Embed Size (px)
Citation preview
Understanding the
Socioeconomic
Conditions of Refugees
in Kalobeyei, Kenya
Results from the 2018 Kalobeyei Socioeconomic Profiling Survey
Understanding the
Socioeconomic
Conditions of Refugees
in Kalobeyei, Kenya
Results from the 2018 Kalobeyei Socioeconomic Profiling Survey

iii
ACKNOWLEDGMENTS . . . . . . . . . . . . . . . . . . . . . . . . . . . . . . . . . . . . . . . . . . . . . . . . . . . . . . . . . . . . . . vi
LIST OF ABBREVIATIONS . . . . . . . . . . . . . . . . . . . . . . . . . . . . . . . . . . . . . . . . . . . . . . . . . . . . . . . . . . . . vii
FOREWORDS . . . . . . . . . . . . . . . . . . . . . . . . . . . . . . . . . . . . . . . . . . . . . . . . . . . . . . . . . . . . . . . . . . . . . . viii
EXECUTIVE SUMMARY . . . . . . . . . . . . . . . . . . . . . . . . . . . . . . . . . . . . . . . . . . . . . . . . . . . . . . . . . . . . . . x
BACKGROUND . . . . . . . . . . . . . . . . . . . . . . . . . . . . . . . . . . . . . . . . . . . . . . . . . . . . . . . . . . . . . . . . . . . . . 1
1. Data Needs for Displaced Populations . . . . . . . . . . . . . . . . . . . . . . . . . . . . . . . . . . . . . . . . . . . . . . . . . 1
2. Refugees in Kenya. . . . . . . . . . . . . . . . . . . . . . . . . . . . . . . . . . . . . . . . . . . . . . . . . . . . . . . . . . . . . . . . . . . 2
RESULTS . . . . . . . . . . . . . . . . . . . . . . . . . . . . . . . . . . . . . . . . . . . . . . . . . . . . . . . . . . . . . . . . . . . . . . . . . . 6
1. Demographic Profile . . . . . . . . . . . . . . . . . . . . . . . . . . . . . . . . . . . . . . . . . . . . . . . . . . . . . . . . . . . . . . . . . 6
1.1 Age structure. . . . . . . . . . . . . . . . . . . . . . . . . . . . . . . . . . . . . . . . . . . . . . . . . . . . . . . . . . . . . . . . . . . . 6
1.2 Country of origin, gender, and disability . . . . . . . . . . . . . . . . . . . . . . . . . . . . . . . . . . . . . . . . . . . . 8
2. Access to Basic Services . . . . . . . . . . . . . . . . . . . . . . . . . . . . . . . . . . . . . . . . . . . . . . . . . . . . . . . . . . . . . 9
2.1 Housing . . . . . . . . . . . . . . . . . . . . . . . . . . . . . . . . . . . . . . . . . . . . . . . . . . . . . . . . . . . . . . . . . . . . . . . . . 10
2.2 Sanitation and water . . . . . . . . . . . . . . . . . . . . . . . . . . . . . . . . . . . . . . . . . . . . . . . . . . . . . . . . . . . . . 11
2.3 Lighting. . . . . . . . . . . . . . . . . . . . . . . . . . . . . . . . . . . . . . . . . . . . . . . . . . . . . . . . . . . . . . . . . . . . . . . . . 12
2.4 Education . . . . . . . . . . . . . . . . . . . . . . . . . . . . . . . . . . . . . . . . . . . . . . . . . . . . . . . . . . . . . . . . . . . . . . . 13
3. Employment and Livelihoods . . . . . . . . . . . . . . . . . . . . . . . . . . . . . . . . . . . . . . . . . . . . . . . . . . . . . . . . . 16
3.1 Livelihood assets. . . . . . . . . . . . . . . . . . . . . . . . . . . . . . . . . . . . . . . . . . . . . . . . . . . . . . . . . . . . . . . . . 21
3.2 Food security and coping strategies . . . . . . . . . . . . . . . . . . . . . . . . . . . . . . . . . . . . . . . . . . . . . . . 22
4. Social Cohesion and Security Perception. . . . . . . . . . . . . . . . . . . . . . . . . . . . . . . . . . . . . . . . . . . . . . . 23
5. Consumption and Poverty. . . . . . . . . . . . . . . . . . . . . . . . . . . . . . . . . . . . . . . . . . . . . . . . . . . . . . . . . . . . 24
5.1 Monetary poverty . . . . . . . . . . . . . . . . . . . . . . . . . . . . . . . . . . . . . . . . . . . . . . . . . . . . . . . . . . . . . . . . 24
5.2 Multidimensional poverty . . . . . . . . . . . . . . . . . . . . . . . . . . . . . . . . . . . . . . . . . . . . . . . . . . . . . . . . . 28
5.3 Determinants of welfare . . . . . . . . . . . . . . . . . . . . . . . . . . . . . . . . . . . . . . . . . . . . . . . . . . . . . . . . . . 30
5.4 Understanding refugee women’s socioeconomic limitations . . . . . . . . . . . . . . . . . . . . . . . . . . 32
CONCLUSIONS AND RECOMMENDATIONS . . . . . . . . . . . . . . . . . . . . . . . . . . . . . . . . . . . . . . . . . . . . . 34
REFERENCES . . . . . . . . . . . . . . . . . . . . . . . . . . . . . . . . . . . . . . . . . . . . . . . . . . . . . . . . . . . . . . . . . . . . . . 37
APPENDICES . . . . . . . . . . . . . . . . . . . . . . . . . . . . . . . . . . . . . . . . . . . . . . . . . . . . . . . . . . . . . . . . . . . . . . . 40
1. Map of Turkana West in Kenya. . . . . . . . . . . . . . . . . . . . . . . . . . . . . . . . . . . . . . . . . . . . . . . . . . . . . . . . 40
2. Map of Kakuma Refugee Camp and Kalobeyei Refugee Settlement . . . . . . . . . . . . . . . . . . . . . . 41
3. Identification Documents. . . . . . . . . . . . . . . . . . . . . . . . . . . . . . . . . . . . . . . . . . . . . . . . . . . . . . . . . . . . . 42
4. Detailed Overview of the Methodology . . . . . . . . . . . . . . . . . . . . . . . . . . . . . . . . . . . . . . . . . . . . . . . . 43
Table of Contents
iv Understanding the Socioeconomic Conditions of Refugees in Kalobeyei, Kenya
LIST OF TABLES
Table 1: Determinants of welfare, preliminary regression analysis results . . . . . . . . . . . . . . . . . . . . . . . . 31
Table 2: Kalobeyei questionnaires for basic and extended profiling . . . . . . . . . . . . . . . . . . . . . . . . . . . . . 44
Table 3: The VRX and SEP interview types. . . . . . . . . . . . . . . . . . . . . . . . . . . . . . . . . . . . . . . . . . . . . . . . . . . 45
Table 4: Robustness check of consumption item removal: poverty headcount rates comparison. . . 47
Table 5: Consumption shares of items in the optional module groups. . . . . . . . . . . . . . . . . . . . . . . . . . . 48
Table 6: Weights used for multidimensional poverty index . . . . . . . . . . . . . . . . . . . . . . . . . . . . . . . . . . . . 48
LIST OF FIGURES
Figure 1: Demoraphic profile of Kalobeyei refugees versus Kenyan nationals . . . . . . . . . . . . . . . . . . . . 7
Figure 2: Dependency ratio for Kalobeyei compared to Kenya and country of origin averages . . . . 7
Figure 3: Population distribution in Kalobeyei by country of origin and residence . . . . . . . . . . . . . . . . 8
Figure 4: Distribution of women-headed households by residence and country of origin. . . . . . . . . . 9
Figure 5: Distribution of households by type of housing, main roofing and flooring materials . . . . . . 10
Figure 6: Distribution of households by number of habitable rooms and density . . . . . . . . . . . . . . . . . 11
Figure 7: Distribution of households by improved sanitation and drinking water source . . . . . . . . . . 11
Figure 8: Distribution of households by source of lighting . . . . . . . . . . . . . . . . . . . . . . . . . . . . . . . . . . . . . 12
Figure 9: Distribution of population ever attending school, age four and above . . . . . . . . . . . . . . . . . . 13
Figure 10: Net and gross enrollment rates, primary school . . . . . . . . . . . . . . . . . . . . . . . . . . . . . . . . . . . . . 13
Figure 11: Net and gross enrollment rates, secondary school . . . . . . . . . . . . . . . . . . . . . . . . . . . . . . . . . . . 14
Figure 12: Population aged 15 and above, not attending school by highest educational
achievement . . . . . . . . . . . . . . . . . . . . . . . . . . . . . . . . . . . . . . . . . . . . . . . . . . . . . . . . . . . . . . . . . . . . . . . . . . . . . 15
Figure 13: Population aged 15 and above who are currently attending school . . . . . . . . . . . . . . . . . . . . 15
Figure 14: Population distribution, by ability to read and write in any language . . . . . . . . . . . . . . . . . . 16
Figure 15: Population distribution in Kalobeyei, by ability to read and write in official languages . . . 16
Figure 16: Labor force participation methodology (UN/ILO) . . . . . . . . . . . . . . . . . . . . . . . . . . . . . . . . . . . 17
Figure 17: Working-age population. . . . . . . . . . . . . . . . . . . . . . . . . . . . . . . . . . . . . . . . . . . . . . . . . . . . . . . . . . 17
Figure 18: Labor force status . . . . . . . . . . . . . . . . . . . . . . . . . . . . . . . . . . . . . . . . . . . . . . . . . . . . . . . . . . . . . . . 18
Figure 19: Main reason for not having looked for a job in the last four weeks. . . . . . . . . . . . . . . . . . . . . 19
Figure 20: Main reasons for having been absent from work . . . . . . . . . . . . . . . . . . . . . . . . . . . . . . . . . . . . 20
Figure 21: Type of work in last seven days, among employed . . . . . . . . . . . . . . . . . . . . . . . . . . . . . . . . . . 20
Figure 22: Main employer for the primary activity (excluding volunteer) . . . . . . . . . . . . . . . . . . . . . . . . 21
Figure 23: Family networks and access to financial services, by gender . . . . . . . . . . . . . . . . . . . . . . . . . 22
Figure 24: Livelihood coping strategies for food security. . . . . . . . . . . . . . . . . . . . . . . . . . . . . . . . . . . . . . 23
Figure 25: Perception of trust, safety, and participation . . . . . . . . . . . . . . . . . . . . . . . . . . . . . . . . . . . . . . . 24
Figure 26: Relations with the host community, by frequency of interaction. . . . . . . . . . . . . . . . . . . . . . 24
Figure 27: Poverty headcount, international poverty line . . . . . . . . . . . . . . . . . . . . . . . . . . . . . . . . . . . . . . 25
Figure 28: Poverty gap and severity, international poverty line. . . . . . . . . . . . . . . . . . . . . . . . . . . . . . . . . 26
Figure 29: Poverty by household size, international poverty line . . . . . . . . . . . . . . . . . . . . . . . . . . . . . . . 26
Figure 30: Poverty by sex of the household head, international poverty line . . . . . . . . . . . . . . . . . . . . . 27

Table of Contents v
Figure 31: Poverty by education of the head, international poverty line . . . . . . . . . . . . . . . . . . . . . . . . . 27
Figure 32: Poverty by origin of the head, international poverty line . . . . . . . . . . . . . . . . . . . . . . . . . . . . . 28
Figure 33: Poverty by whether children reside in the household, international poverty line . . . . . . . . 28
Figure 34: Multidimensional Poverty Index (MPI) . . . . . . . . . . . . . . . . . . . . . . . . . . . . . . . . . . . . . . . . . . . . . 29
Figure 35: Monetary poverty . . . . . . . . . . . . . . . . . . . . . . . . . . . . . . . . . . . . . . . . . . . . . . . . . . . . . . . . . . . . . . . 29
Figure 36: Multidimensional Poverty Index (MPI), by gender and origin of head. . . . . . . . . . . . . . . . . . 30
Figure 37: Multidimensional Poverty Index (MPI), by education of head and household size . . . . . . . 30
Figure 38: Factors limiting refugee women socioeconomic potential . . . . . . . . . . . . . . . . . . . . . . . . . . . 33
Figure 39: Illustration of VRX and long and short SEP coverage in the settlement . . . . . . . . . . . . . . . . 44
Figure 40: Allocation of consumption item questions using the RCM . . . . . . . . . . . . . . . . . . . . . . . . . . . 46
Figure 41: Imputation of total consumption using the RCM . . . . . . . . . . . . . . . . . . . . . . . . . . . . . . . . . . . . 47
vi
Acknowledgments
This report was prepared by a team led by Jed Fix (UNHCR)
and Utz Pape (World Bank). The team consisted of Felix
Appler (World Bank), Theresa Beltramo (UNHCR), Flor-
ence Nimoh (UNHCR), Laura Abril Ríos Rivera (World
Bank), and Felix Schmieding (UNHCR), with additional
contributions received from Nduati Kariuki (World Bank).
The team is grateful to refugees without whose participation,
insights, and contributions this work would not be possible.
The team would like to thank the outstanding efforts of the
enumerators and supervisors who collected the data, includ-
ing Sabina Achola Joseph, Said Aden Said, Top Ruot Paul,
Glama Gutu Jirmo, Feysal Abdi Abdirahman, Abraham
Ntompa, Moawenimana Celestin, Ahadi Matabaro Emman-
uel, Natalena Totoi Charles, Innocent Ndahiriwe, Hussein
Abdalla Suliman, Abdalazeem Abdallah Ibrahim, Manyok
Madit Ajoh, Treize Miderho David, Moses Lujang, Sam-
son Mawa Ebere, Abdikani Waadi Ali, Keyse Abdi Dahir,
Mohamed Abdirizak Farah, Isaac Puoth Samuel Gai, Abdul-
lahi Mohamed Hussein, Anthony Gai Ogida, Daniel Onge-
juk Tome, Orach David Obwoya, William Opio Ogwaro,
Odong Paul Clement, Joshua Tom Lado, Nyanuer Gony
Peter, Evaline Lamwaka Dominic Ochira, Pasquina Abalo
Dominic Ochira, Abubarkar Rugumba Kaura, Mukesh
Karn, Isaac Puoth Samuel Gai, Daud Ibrahim Warsame, Ali
Mohamed Abdi, Akec Jacob Dhol, Chol Deng Arok, Osman
Mani Ali, Mohamed Mohamed Bille, Ntumba Tshilombo
Innocent, Elie Mlgisha Bafuliru Elie, Fikiri Kikombe Bien-
fiait, Ochele Luka Karasin, Israel Jacob Talaja, Bolis Gassim,
Dak Simon Riek, ebengo Honore Alfani, Ochan Riek Jack,
Jamila Mohamud Hashi, Muna Mohammud Bilal, Roselyn
Aminah Khandaka, Sulekha Awoi Farah, Namuya Lawrencia
Lorot, Emmanuel Losiru, Stephen Esibitar Etorite, and Hil-
ary Kiprop Kimaiyo.
The team would like to thank the peer reviewers Tara Vish-
wanath (World Bank) and Anna Lisa Schmidt (World Bank)
for their helpful comments, as well as Patrice Ahouan-
sou (UNHCR), Mukesh Karn (UNHCR), Seda Kuzucu
(UNHCR), Eva Lescrauwaet (UNHCR), Loise Nkonge
(UNHCR), and Ivana Unluova (UNHCR) for support on the
ground and feedback on the report.
The team would like to thank UNHCR Kakuma Sub-Office
management Sukru Cansizoglu, Mohamed Shoman, and
Ignazio Matteini for their vision and commitment to this
work, as well as Pierella Paci and Allen Dennis from the
World Bank. The team would also like to express its gratitude
to UNHCR Kenya Representatives Raouf Mazou and Fathiaa
Abdalla, UNHCR’s Director of Division of Resilience and
Solutions Ewen Macleod, UNHCR’s Division of Resilience
Chief of Section for Partnerships Analytics Research and
Knowledge Section Betsy Lippman, the World Bank Coun-
try Director C. Felipe Jaramillo, and World Bank Manager
for the Fragility, Conflict and Violence Group, Xavier Devic-
tor, as well as the Government of Kenya, its Refugee Affairs
Secretariat, and the Turkana County Government.
This initiative received financial support from UNHCR and
the World Bank Fragility, Conflict and Violence Unit, as well
as the Dutch Partnership Fund.
This work is part of the program “Building the Evidence on
Protracted Forced Displacement: A Multi-Stakeholder Part-
nership.” The program is funded by UK aid from the United
Kingdom’s Department for International Development
(DFID). It is managed by the World Bank Group (WBG)
and was established in partnership with the United Nations
High Commissioner for Refugees (UNHCR). The scope of
the program is to expand the global knowledge on forced
displacement by funding quality research and disseminating
results for the use of practitioners and policy makers. This
work does not necessarily reflect the views of DFID, the
WBG, or UNHCR.
vii
List of Abbreviations
GBV Gender-Based Violence
GCR Global Compact on Refugees
KCHS Kenya Continuous Household Survey
KIHBS Kenya Integrated Household Budget Survey
KISEDP Kalobeyei Integrated Socio-Economic Development Plan in Turkana West
MPI Multidimensional Poverty Index
proGres Profile Global Registration System (UNHCR)
RCM Rapid Consumption Methodology
RSD Refugee Status Determination
SEP Socioeconomic Profiling
UN United Nations
UNHCR United Nations High Commissioner for Refugees
VRX proGres Registration Verification Exercise
WEE Women Economic Empowerment
viii
Forewords
Today, more people than ever are forcibly displaced due to
conflict, violence, and environmental hazards. Fragility, con-
flict, and violence (FCV) has become a development bar-
rier that predominantly affects the most vulnerable people,
threatening their livelihoods and economic growth oppor-
tunities. In fact, by 2030, at least half of the world’s poor will
be living in fragile and conflict-affected settings and most of
them in Africa. With violent conflicts rising at an unprec-
edented rate, the impact of violence and conflict has wors-
ened, creating the largest forced displacement crisis since
World War II. We need adequate data on displaced and host
communities to better understand their characteristics and
dynamics, which is fundamental to inform the design and
implementation of targeted interventions. However, notably
in Sub-Saharan Africa, multidimensional data gaps prevent
an assessment of socioeconomic conditions among the dis-
placed and host populations.
Kenya is exemplary of the challenges and opportunities at
the heart of these dynamics. The current refugee and asy-
lum seeker population in Kenya exceeds 480,000 people,
engendering multilayered impacts on host communities. In
Turkana, the poorest county in the country, the refugee pop-
ulation makes up a significant share of the local economy
and the population (an estimated 40 percent). The Kalobeyei
settlement in Turkana West was established in 2015 as an
alternative to a camp setting, based on principles of refugee
self-reliance, integrated delivery of services, and greater sup-
port for livelihood opportunities through evidence-based
interventions.
Aligned with the Global Compact on Refugees, the Kalobeyei
Integrated Socioeconomic Development Plan (KISEDP) rec-
ognizes the need for collecting and using socioeconomic
data on refugees and hosts for targeted programming. The
UNHCR-World Bank 2018 Kalobeyei Socioeconomic Pro-
filing Survey (SEP) addresses this need by introducing an
innovative approach which allows generating welfare data
that are representative of the Kalobeyei settlement’s popu-
lation and comparable to the Turkana County and national
residents.
This report provides a comprehensive snapshot of demo-
graphic characteristics, standards of living, social cohesion,
and specific vulnerabilities. Moreover, the analysis provides
several recommendations. First, building and maintaining
human capital in the refugee population—especially among
girls and women—needs to be prioritized. Second, promot-
ing self-reliant agricultural interventions can help improve
food security. Third, increasing work opportunities for the
refugee population can help lift aid dependence and improve
livelihoods. Fourth, joint programs for refugees and host
populations can further improve social cohesion.
This report is part of a global collaboration between the World
Bank and the UNHCR, as well as the World Bank-UNHCR
Joint Data Center, and constitutes a milestone for future
work on displacement in East Africa and beyond. Data col-
lection exercises, such as the one presented in this report,
are invaluable in providing evidence to design development
policies to address socioeconomic vulnerabilities, potentially
unlocking economic self-reliance and boosting synergies
with the development of host communities.
Xavier Devictor
Manager
Fragility, Conflict, and Violence
World Bank
ix
The scale, complexity, and speed of forced displacement
today means that we can no longer afford to respond through
humanitarian action alone. In recognition of this, the Global
Compact on Refugees (GCR), endorsed by the United
Nations General Assembly in December 2018, establishes
a framework for more predictable and equitable planning
and management of refugee situations, in line with the 2030
Agenda and the Sustainable Development Goals (SDGs).
Evidence and data are central to the GCR’s bid to achieve last-
ing social and economic progress for the displaced persons
of the world and the communities that host them, and key
to linking the approaches of humanitarian and development
actors, with their complementary know-how and resources.
Socioeconomic data, in particular, is used to design effec-
tive assistance programs, while comparative statistics help
to understand displacement within the context of the host
community, and vice-versa.
Kenya is exemplary of the opportunities at the heart of this
dynamic. Since 1992, it has been a generous host of refu-
gees and asylum seekers, with over 480,000, mainly from
South Sudan and Somalia, living in the country today. The
majority resides in the Dadaab camp, located in the Garissa
County, and the Kakuma camp and Kalobeyei settlement,
located in Turkana County. Despite the limited economic
infrastructure, the camps stand out for their vibrant econo-
mies and the entrepreneurial spirit of their dwellers.
The Kakuma refugee camp and Kalobeyei settlement, in
particular, have expanded significantly, with an estimated
67 percent of the current refugee population having arrived
there in the past five years. Evidence shows that refugee pop-
ulations bring with them substantial skills and expertise that
benefit economies in host countries. The World Bank and
UNHCR report “Yes” in My Backyard (2016) provides anal-
ysis of the impact of refugees, demonstrating the positive
overall effect on economic growth that their presence has
had in the area.
The Kalobeyei Socioeconomic Profiling study builds on
these insights by providing estimates for poverty and other
socioeconomic indicators for refugees. In doing so, it fills an
important data gap. It also contributes to the realization of
the Kalobeyei Integrated Social and Economic Development
Plan (KISEDP), which focuses on the economic develop-
ment of the settlement, enabling refugees and host commu-
nities to pursue more opportunities together.
Ms. Fathiaa Abdalla
UNHCR Representative in Kenya
United Nations High Commissioner for Refugees
x
Executive Summary
The Global Compact on Refugees represents a new
approach to managing forced displacement situations,
one in which evidence and data are central to its success
and key to link humanitarian and development actions.
Kenya is exemplary of the challenges and opportunities of
this new approach. Since 1992, it has been a generous host
of refugees and asylum seekers, a population which today
exceeds 470,000 people, engendering both positive and neg-
ative impacts on local Kenyans. The Kalobeyei Settlement,
located in Turkana County along the northwestern border
of Kenya, was established in 2015 as an alternative to a camp
setting, based on principles of refugee self-reliance, inte-
grated delivery of services to refugees and host community
members, and greater support for livelihood opportunities
through evidence-based interventions.
In Kenya, refugees are not systematically included in
national surveys and, as a result, there is a lack of data
on refugee poverty measures that is comparable to the
national population. While the humanitarian- development
approach used in Kalobeyei emphasizes the interconnect-
edness of refugees and host communities, the existing data
sources do not lend themselves to easy comparison. The
Kalobeyei Socioeconomic Profiling (SEP) Survey helps close
data gaps by using micro-level data to understand the living
conditions of refugees and ultimately inform policy and tar-
geted programming. The SEP employed a novel approach to
addressing this need by generating data that are statistically
representative of the settlement’s population in 2018 and
comparable to the Kenyan national survey measuring pov-
erty from 2015/16.
This survey provides one of the first comparable pov-
erty profiles for refugees and host community members,
enhancing the evidence base for informing targeted pol-
icies and programs. Taking place within a UNHCR reg-
istration verification exercise, the SEP included a range of
standard socioeconomic indicators, including consumption-
based poverty, aligning with the national 2015/16 Kenya
Integrated Household Budget Survey (KIHBS) and Kenya
Continuous Household Survey (KCHS). Initiated jointly by
UNHCR and the World Bank, the survey was designed to
support the settlement’s development framework, as well as
the wider global vision laid out by the Global Compact on
Refugees and the Sustainable Development Goals (SDGs). In
doing so, it provides lessons for how this important informa-
tion may be collected in other settings, in line with the vision
of the World Bank- UNHCR Joint Data Center (JDC).
When compared to national averages, the results of the
SEP survey show that residents of Turkana County—both
hosts and refugees—are among the worse off in Kenya in
terms of poverty and associated socioeconomic indica-
tors. More than half of refugees (58 percent) are poor—as
measured by the international poverty line for extreme pov-
erty of US$1.90 (2011 PPP) per capita per day. This is higher
than the national rate (37 percent) and comparable to what
is found in the 15 poorest counties in the country (59 per-
cent on average) but lower than Turkana County (72 percent
overall, including 85 percent in rural areas and 51 percent
in urban areas). Using a modified version of the Multidi-
mensional Poverty Index (MPI), used by the United Nations
Development Programme (UNDP) in its Human Develop-
ment Report, shows that one-third of refugees (33 percent)
are found to be ‘deprived’ or ‘severely deprived’ in respect
to education, health, and living standards. Of the remaining,
43 percent are ‘vulnerable to deprivation’, while 25 percent
are ‘non-deprived’. Comparable data for nationals are not
available.
Demographic profile. In terms of their demographic pro-
file, refugees in Kalobeyei are younger than the Kenyan
population, with virtually no elders (65 years of age and
older)—resulting in a high dependency ratio and subsequent
increased need for basic services for children and youth. To
contribute positively to future economic prospects, children
and youth require investment in human capital, in terms
of health and education. Additionally, in Kalobeyei, refu-
gee children face special risks which require targeted sup-
port—particularly the over 3,100 unaccompanied minors or
Executive Summary xi
8,656 separated children. The large share of young people to
working-age adults—many of whom are single mothers—
means that households may not be able to finance invest-
ments in health and education themselves, raising the need
for continued public investment to preserve human capital
and ensure a productive future.
Access to basic services. Access to basic services varies across
population groups. The connection between the delivery of
basic services and development outcomes, including living
standards, health status, and economic output, is well docu-
mented. Refugees in Kalobeyei report higher levels of access
to improved sanitation than Turkana County. However,
sharing facilities is a common practice. Likewise, refugees in
Kalobeyei report higher access to improved drinking water
than nationals—although most still describe regular short-
ages. Conversely, almost no refugee households have access
to electricity from the main grid or a generator. In compari-
son, 12 percent of households in Turkana County have access
to electricity/a generator, while nationally 42 percent are
connected to the main grid/generator.
Education. Primary school attendance was found to be
77 percent for children ages 6–13 years. In comparison,
enrollment is over 80 percent nationally, but only 48 percent
in Turkana County. However, low levels of secondary school
enrollment are observed, consistent with the lack of avail-
able schooling options for refugee youth. Among refugees,
secondary school attendance for youth ages 14–17 years is
5 percent, versus 38 percent nationally and 9 percent in Tur-
kana County. When considering overall education levels,
most refugees report having attended school at some point
in their lives (80 percent)—yet gender gaps are large: com-
pared to 90 percent of men, only 71 percent of women have
attended school.
Literacy rates. Literacy rates for refugees fall between the
national and Turkana County averages—and vary signifi-
cantly by gender. While over 60 percent of all refugees above
age 15 report being able to read or write in at least one lan-
guage, only 44 percent of women in this group are able to do
so versus over 80 percent of men. More than half of refugees
(55 percent) speak one of Kenya’s two official languages—
English (49 percent) or Swahili (29 percent). Nationally,
85 percent of Kenyans age 15 and older are literate in at least
one language versus 40 percent of those in Turkana County
(the distinction is not made to the level of English/Swahili).
Economic activity. Rates of economic activity are low, in
part due to the young age of the population. In Kalobeyei,
the large proportion of children and young people means
that only 39 percent of the population is of working age
(15–64 years). Comparatively, 55 percent of the total pop-
ulation of Kenya falls in this age range, as well as 46 percent
of Turkana County. Even among those of working age, labor
force participation rates are low. In Kalobeyei, 37 percent
of the working-age population are classified as employed,
while the majority (59 percent) are considered ‘inactive’, a
classification which includes caring for household members
and students. The remaining 4 percent— those who are avail-
able and looking for work—are considered as unemployed.
In comparison, 72 percent of Kenyans on the whole have
an occupation, 23 percent are inactive, and 6 percent are
unemployed.
Food security. Possibly connected to the above, many
households experience varying degrees of food insecurity.
The World Food Program Livelihoods Coping Strategy
Index is used to understand longer-term coping capacities
of households, the presence of food shortages, and strategies
commonly undertaken to address them. Only 43 percent of
households are food secure, meaning that in the last 30 days
no strategy was employed for dealing with a lack of food or
money to buy food. The remaining households employed
strategies in order of severity: 27 percent are “under stress,”
15 percent are in “crisis,” and 17 percent are in “emergency.”1
Trust and social cohesion. Levels of trust, security and
participation in decision making are high among refugees.
Overall, 8 in 10 refugees feel that neighbors are generally
trustworthy. More than 9 in 10 feel safe walking alone in
their neighborhood during the day—though only 3 in 10 feel
so at night. Meanwhile, 3 in 4 believe that they are able to
express their opinions within the existing community lead-
ership structure, and 2 in 3 perceive that their opinions are
being taken into consideration for decisions that regard their
well-being. In terms of social cohesion between refugees and
1 The total sums to greater than 100 percent due to rounding of individual
results. Maxwell and Caldwell (2008) provide more information on how
to interpret the Coping Strategy Index.
xii Understanding the Socioeconomic Conditions of Refugees in Kalobeyei, Kenya
hosts, half of refugee households reported interacting with a
member of the host community in the past week and more
than 60 percent of refugees feel safe visiting a neighboring
town alone. Around half agree that host community mem-
bers are generally trustworthy. Similarly, around half would
feel comfortable with their child socializing with members of
the host community.
Gender-based vulnerabilities. Overall, most refugee house-
holds in Kalobeyei are headed by women, face poor living
standards, and have low literacy and labor force participation
rates. The SEP findings demonstrate that living conditions
for refugees in Kalobeyei vary according to sex and gender
norms. Such variation translates into a series of disadvan-
taged living conditions for women that exacerbate their
already complex situation, creating a matrix of intersecting
vulnerabilities. Despite being most of the refugee population
in Kalobeyei, women face higher poverty levels; lower access
to basic services such as water, sanitation, and education; and
tend to have a lower labor force participation rate. Therefore,
gender-responsive policies and programs need to take into
consideration sociocultural norms and practices that pre-
vent women from having economic empowerment and limit
women opportunities for socioeconomic growth.
Data collection, analysis, and dissemination are crucial
to inform targeted policies. Systematically surveying and
including refugees into national surveys would contribute
to filling socioeconomic data gaps needed to inform policies
and programs. The analysis of the SEP data from Kalobeyei
provides several recommendations. First, building and main-
taining human capital in the refugee population—especially
among girls and women—need to be prioritized. Second,
promoting self-reliant agricultural interventions can help to
avoid food insecurity. Third, efforts to strengthen access to
improved sanitation must be continued among the refugee
and host populations. Fourth, increasing work opportunities
for the refugee population can help to lift aid dependence
and improve livelihoods. Fifth, joint programs for refugees
and host populations can further improve social cohesion.
1
1 . Data Needs for Displaced Populations
1. The world is witnessing the highest levels of forced
displacement on record. With over 70 million forcibly dis-
placed people worldwide,2 forced displacement has become a
crisis with substantial impacts among both the displaced and
host communities. Forcibly displaced persons face specific
vulnerabilities that need urgent attention, namely, limited
rights, lack of opportunities, protection risks, lack of a plan-
ning horizon, loss of assets, and low living standards among
others. Comparatively, host communities—which tend to be
overwhelmingly in developing countries—are often among
the poorest populations experiencing low standards of liv-
ing, and they often face developmental challenges related
to insecurity and lack of access to education and employ-
ment opportunities. Thus, host communities face increased
challenges in pursuing their own development efforts in an
environment that has been transformed by large inflows of
displaced persons.
2. A new global paradigm has emerged to better man-
age forced displacement situations. The Global Compact
on Refugees (GCR), ratified by the United Nations General
Assembly in December 2018, establishes a framework for
more predictable and equitable responsibility sharing across
member states in managing refugee situations.3 It calls for
measures at the global, regional, and national levels that gov-
ernments, international organizations, and other stakehold-
ers can implement to better support host communities and
to ensure that refugees have opportunities to thrive alongside
their hosts.
3. The Global Compact on Refugees recognizes the need
for greater complementarity between humanitarian and
development actors. The cost of humanitarian aid has
2 United Nations High Commissioner for Refugees 2019. Figures at a
Glance.3 United Nations 2018. See: https://www.unhcr.org/5c658aed4.
Background
sharply increased in the last 15 years, from US$7.2 billion in
2000, the cost of humanitarian assistance tripled, reaching
US$21.8 billion in 2015.4 To sustainably respond to emerg-
ing and protracted crises and to ease skyrocketing human-
itarian costs, the international community has increasingly
advocated for a development response to displacement
situations beyond and in coordination with humanitar-
ian aid. There is increasing recognition that—while critical
at the onset—humanitarian assistance is unable to address
the socio economic dimensions of displacement, including
access to livelihoods and employment. As emphasized in
the GCR, humanitarian and development responses need
to be coherently facilitated and include the early and sus-
tained engagement of development actors to ensure that
“the impact of a large refugee situation on a host country is
taken into account in the planning and implementation of
development programs and policies with direct benefits for
both host communities and refugees.”5 Thus, displacement
situations require development instruments to tackle chal-
lenges with a medium- to long-term horizon. Improving
self-reliance, as opposed to aid dependency, is the basis of
the development approach and is critical to reducing poverty
and vulnerability for refugees.
4. Data are central to the success of these global efforts
and constitute an essential input to link humanitarian
and development activities. Reliable, comparable, and
timely data are key to policy making and targeted program-
ming, and to effectively use humanitarian and development
resources. Especially socioeconomic data on refugees and
hosts, constitute a crucial input that can inform effective
interventions, linking humanitarian and development work
by using relevant indicators to monitor progress and ensure
success. However, multidimensional data gaps prevent an
assessment of socioeconomic conditions among displaced
populations, hindering efforts to design targeted interven-
tions. Notably in Sub-Saharan Africa, key challenges include
4 World Bank Group 2017b.5 United Nations 2018, 24.
2 Understanding the Socioeconomic Conditions of Refugees in Kalobeyei, Kenya
the limited comparable analyses on poverty and living stan-
dards of displaced populations and hosts. Evidence-based
development policies to address socioeconomic vulnerabil-
ities have the potential to unlock economic independence
of refugees by strengthening their agency, self-reliance, and
synergies with host communities. Thus, addressing data gaps
and limitations is crucial to inform targeted policy interven-
tions to find sustainable solutions for displaced and host
communities.
5. Kenya is exemplary of the challenges and opportunities
at the heart of this dynamic. Since 1992, Kenya has been a
generous host of refugees and asylum seekers, a population
which today exceeds 470,000. Refugees in Kenya reside in
three locations: urban areas mainly in Nairobi (16 percent),
Daddab in Garissa County (44 percent), and the Kakuma
camps and Kalobeyei Settlement in Turkana County (40 per-
cent). The majority of refugees and asylum seekers in
Kenya originate from Somalia (54.5 percent). Other major
nationalities are South Sudanese (24.4 percent), Congolese
(8.8 percent), and Ethiopians (5.9 percent).6 The Kakuma
Refugee Camps in Turkana West subcounty have long been
among the largest hosting sites, becoming even larger in
recent years with an estimated 67 percent of the current
refugee population that has arrived in the past five years. In
Turkana West, the refugee population makes up a significant
share of the local economy and the population (an estimated
40 percent).7 Thus, refugees and hosts regularly have socio-
economic interactions that shape their living conditions and
represent an opportunity for development.
6. Refugees in Kenya are not systematically included in
national surveys and, as a result, there is a lack of data
on refugee welfare and poverty that is comparable to the
national population. Such information is critical for area-
based development and targeting of assistance for both
refugees and host community members. Kenya has shown
progress in data availability at the national and county
levels and made efforts to measure the impacts of forced
6 According to UNHCR, Kenya hosts 476,695 registered refugees, asylum
seekers, and other persons of concern, as of May 2019 (United Nations
High Commissioner for Refugees 2019a). See: https://www.unhcr.org/ke/
figures-at-a-glance.7 United Nations High Commissioner for Refugees 2018, 11. See: https://
www.unhcr.org/ke/wp-content/uploads/sites/2/2018/12/KISEDP_
Kalobeyei-Integrated-Socio-Econ-Dev-Programme.pdf.
displacement.8 However, refugees are not systematically
included in the national household surveys that serve as the
primary tools for measuring and monitoring poverty, labor
markets, and other welfare indicators. Comparable data on
the welfare and poverty of refugees and host communities
are necessary for implementing and monitoring area-based
development frameworks, such as the Kalobeyei Integrated
Socio-Economic Development Plan (KISEDP) and the
County Integrated Development Plan (CIDP). Data are
essential for engaging with development actors whose strat-
egies are based on poverty alleviation and who require this
information for long-term planning and investment. Further,
it is required for the design of humanitarian programming,
such as cash assistance, which seeks to target the most vul-
nerable. As a result of socioeconomic data gaps, comparisons
of poverty and vulnerability between refugees, host commu-
nities, and nationals remain difficult.
2 . Refugees in Kenya
7. The Refugees Act of Kenya came into force in 2006,
confirming Kenya’s commitment to international refugee
conventions, while setting out the rights and treatment
of refugees and asylum seekers in Kenya.9 The Act estab-
lished the Department of Refugee Affairs (DRA) replaced
by the Refugee Affairs Secretariat (RAS)10 in 2016. Among
other responsibilities, the RAS is partly in charge of regis-
tration, documentation, and refugee status determination
(RSD) functions. While it was expected that in 2017 the RAS
would fully assume responsibility for reception, registra-
tion, documentation, RSD, and refugee management—with
UNHCR’s active support11—such responsibilities have not
been fully undertaken by RAS. Therefore, the UNHCR in
collaboration with the RAS accords refugee status through
8 Much has been written about Turkana County and the Kakuma camps in
recent years. See: Sanghi, Onder, and Vemuru 2016; World Bank 2018a;
Betts 2018.9 Kenya became a party to the 1951 Convention relating to the Status of
Refugees in 1966, and the 1967 Protocol in 1981. It has also ratified the
1969 Convention Governing the Specific Aspects of the Refugee Problem
in Africa (O’Callaghan and Sturge 2018).10 Refugee Affairs Secretariat 2019. See http://refugee.go.ke/about-us/.11 United Nations High Commissioner for Refugees, Refugee Status
Determination 2019.

Background 3
individual interviews and through prima facie group deter-
mination.12 The RSD process in Kenya takes approximately
two years rather than an intended maximum of six months,
and it lacks an appeal system.13, 14 The Refugees Act stipu-
lates that refugees should be provided with a ‘refugee identity
card’. ID cards take the form of either a UNHCR Mandated
Refugee Certificate (MRC) that is valid for two years, or the
DRA-issued Alien Refugee Certificate (ARC),15 valid for five
years (see Appendix 4 Identification documents). Further-
more, refugees in Kenya face restrictions on the freedom of
movement and right to work (see section 3 “Employment
and Livelihoods”).
8. Forty percent of refugees in Kenya reside in Turkana
West, an ethnically diverse region which remains among
the poorest counties in the country. The Turkana people,
who are plain Nilotes, constitute the main community in the
county and in Turkana West where the refugees reside. The
most important economic activity in the county is pastoral-
ism, characterized by livestock rearing, with the major live-
stock reared being cattle, donkeys, camels, and goats.16 While
poverty in Kenya has declined over the past decade, Turkana
continues to be one of the poorest counties. The proportion
of Kenya’s population living beneath the international pov-
erty line of US$1.90 a day (2011 PPP) fell from 44 percent
in 2005/06 to 37 percent in 2015/16. At this level, poverty in
Kenya is below the Sub-Saharan Africa average and among
the lowest in the East African Community. Poverty reduc-
tion has been driven by improvements among the poorest of
the poor, and particularly among the progress observed in
rural areas.17 In rural Kenya, poverty declined considerably
from around 51 percent in 2005/06 to 39 percent 10 years
12 Refugee Status Determination, or RSD, is the legal or administrative
process by which governments or UNHCR determine whether a
person seeking international protection is considered a refugee under
international, regional, or national law. RSD is often a vital process in
helping refugees realize their rights under international law. States have
the primary responsibility to conduct RSD; however, UNHCR may
conduct RSD under its mandate when a state is not a party to the 1951
Refugee Convention and/or does not have a fair and efficient national
asylum procedure in place (United Nations High Commissioner for
Refugees, Refugee Status Determination 2019d).13 UNHCR-DRC 2012.14 Under the Refugees Act, asylum seekers and refugees are entitled to
appeal any unfavorable decision of the DRA to the Board. However,
Kenya has yet to constitute this body (Garlick et al. 2015).15 In some official government documents, the RAS is sometimes referred
to as DRA.16 Kenya National Bureau of Statistics 2015.17 World Bank 2018.
later. Despite these overall reductions in poverty, in Turkana
72 percent of the population lives in poverty.
9. Refugees in Turkana are located in two areas: Kakuma
Refugee Camp and Kalobeyei Integrated Settlement, with
a cumulative population of over 190,000. The refugee pop-
ulation in Turkana has fluctuated over the years due to the
outbreak of different conflicts. The South Sudan crisis of 2013
led to a massive outflow of refugees into the neighboring
countries, and more than 86,000 individuals fled and sought
asylum in Kenya. Despite the long existence of Kakuma ref-
ugee camps (since 1992), 67 percent of its population arrived
only during the last five years.18 At the same time, the host
community in Kakuma town has also grown in population
size and economic activities. The socioeconomic study “Yes
in My Backyard? The Economics of Refugees and their Social
Dynamics in Kakuma, Kenya”19 finds refugees as an integral
part of the Kakuma social, cultural, and economic fabric with
a vibrant economy. The study shows that refugee-owned busi-
nesses serve both communities and have boosted overall eco-
nomic activity that has led to better nutritional outcomes and
greater physical well-being of the host community.20 Never-
theless, as in other parts of Kenya, refugees in Turkana face
restrictions on their freedom of movement and right to work.
10. The Kalobeyei Settlement, located in Turkana County,
was established in 2015 to accommodate the growing
population from the Kakuma Refugee Camps. Kalobeyei
Settlement, located 30 kilometers north of Kakuma, was
established by UNHCR, the regional government, as well as
development and humanitarian partners. Its aim was to take
pressure off the Kakuma camps and to transition refugee
assistance from an aid-based model to a self-reliance mod-
el.21, 22 Kalobeyei Settlement was planned to offer opportu-
nities for economic inclusion, integrated delivery of services,
and improved livelihood opportunities for both refugees and
the host community.23 Originally it was planned that Kaloye-
18 United Nations High Commissioner for Refugees 2018.19 World Bank Group-UNHCR 2016.20 United Nations High Commissioner for Refugees 2018.21 Betts et al. 201822 The UNHCR defines self-reliance as ‘the social and economic ability
of an individual, a household, or a community to meet essential needs
(including protection, food, water, shelter, personal safety, health, and
education) in a sustainable manner and with dignity’ (UNHCR 2005).23 Host community is understood as the overall population of Turkana
County. Data limitations do not allow a more detailed breakdown that
differentiates across Turkana County inhabitants.

4 Understanding the Socioeconomic Conditions of Refugees in Kalobeyei, Kenya
bei would target established refugees (who had arrived more
than five years before) from Kakuma. However, a new emer-
gency from South Sudan and other factors forced the origi-
nal plan to be adapted.24 Nevertheless, Kalobeyei’s planners
have retained a significant commitment to self- reliance. For
example, Kalobeyei has differed from Kakuma in having des-
ignated market areas, more extensive use of a cash- assistance
program called Bamba Chakula (‘get your food’), and a
greater promotion of subsistence agriculture.25
11. Integrated self-reliance for refugees and the host
community through evidence-based interventions are at
the core of the Kalobeyei Settlement plan. The Kalobeyei
Integrated Socio-Economic Development Plan (KISEDP)
envisions that both refugees and host communities will
benefit from strengthened national service delivery systems
and increased socioeconomic opportunities, along with sus-
tained investments in people’s skills and capabilities, so that
they can become drivers of economic growth in Turkana
West.26 The Kalobeyei Settlement aims to transition refugee
assistance from an aid-based to a self-reliance model, while
also increasing opportunities for interaction between refu-
gees and hosts. Aligned with the Global Compact on Ref-
ugees, the KISEDP recognizes the need for collecting and
using data for programming and reporting.27 Specifically,
socioeconomic data are acknowledged as an essential input
to understand specific needs and vulnerabilities, and inform
area-based programming and investments to achieve the
expected outcome of socioeconomic growth among hosts
and refugees.
12. The Kalobeyei Socioeconomic Profiling (SEP) survey
employed a novel approach to generating data that are
24 As a result, most villages in Kalobeyei are primarily populated by
South Sudanese. Village 2 has a higher portion of Ethiopians who are
ethnically Somalis displaced from Ethiopia’s Ogaden region and Burundi
refugees who were originally located in Dadaab.25 Betts et al. 2018.26 United Nations High Commissioner for Refugees. 2019. KISEDP
Progress Report. January 2018–June 2019.27 Ibid.
statistically representative of the settlement’s population
and comparable to the national population. Taking place
within a UNHCR registration verification exercise, the SEP
included a range of standard socioeconomic indicators,
both at the household and individual level, aligned with
the national 2015/16 Kenya Integrated Household Budget
Survey (KIHBS) and Kenya Continuous Household Survey
(KCHS).28 To improve efficiency and save time—a compre-
hensive poverty survey requires repeated visits over days—
the Rapid Consumption Methodology (RCM)29 was used to
estimate consumption and thus the level of poverty of refu-
gee populations in Kalobeyei. The SEP survey and ensuing
analysis provide a comprehensive snapshot of the demo-
graphic characteristics, standards of living, social cohesion,
and specific vulnerabilities facing refugees regarding food
security and disabilities.
13. This survey provides one of the first comparable pov-
erty profiles for refugees and host community members,
enhancing the evidence base for programming and effi-
cient design of interventions. Initiated jointly by UNHCR
and the World Bank, this survey was designed to support
the KISEDP development framework, as well as the wider
global vision laid out by the Global Refugee Compact and
the Sustainable Development Goals (SDGs). In doing so, it
provides lessons for how this important information may
be collected in other settings to facilitate potential replica-
tion by the World Bank-UNHCR Joint Data Center (JDC).
The socioeconomic profile presented here includes refugees
living in the Kalobeyei refugee settlement surveyed in 2018
compared to the Turkana County host community,30 as well
as the national population surveyed in 2015/16.31
28 Kenya National Bureau of Statistics (KNBS), Kenya Integrated
Household Budget Survey 2015–2016: See: http://statistics.knbs.or.ke/
nada/index.php/catalog/88. 29 Pape and Mistiaen. 2018. Household Expenditure and Poverty Measures
in 60 Minutes: A New Approach with Results from Mogadishu.30 Host community includes not only Turkana West subcounty residents
but the whole population of Turkana County.31 Host community and national estimates were derived from the Kenya
Integrated Household Budget Survey (KIHBS).
Background 5
Methodology
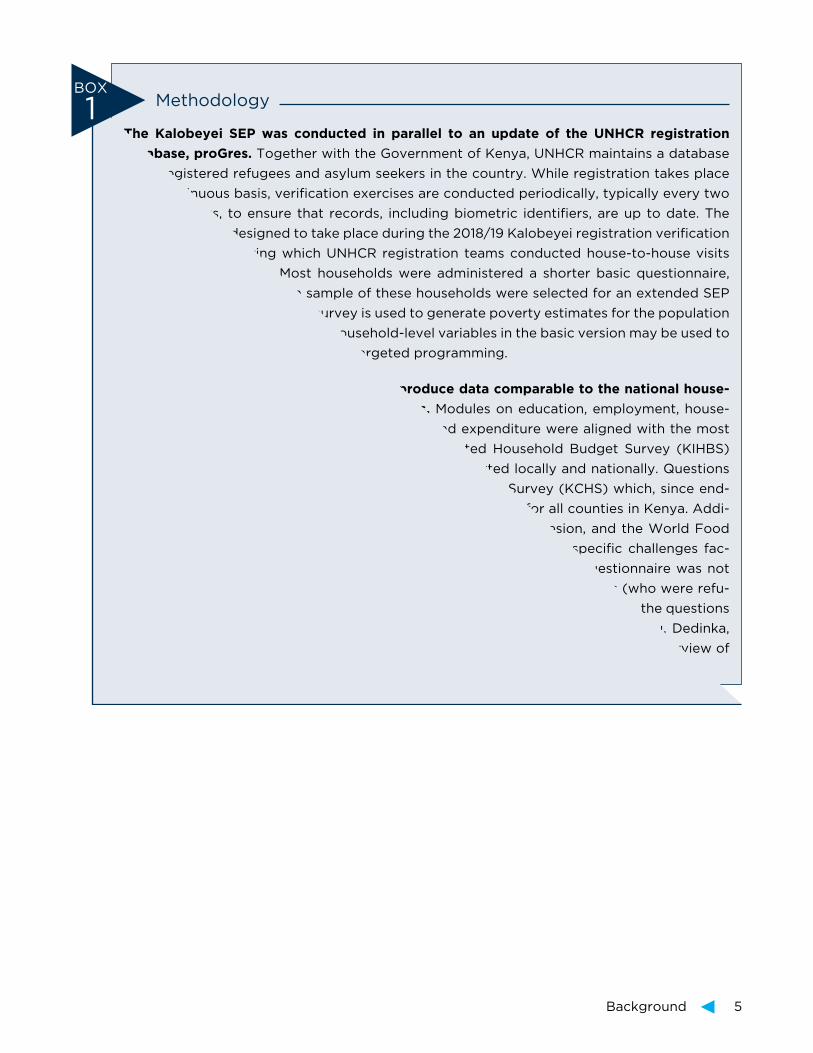
The Kalobeyei SEP was conducted in parallel to an update of the UNHCR registration
database, proGres . Together with the Government of Kenya, UNHCR maintains a database
of all registered refugees and asylum seekers in the country. While registration takes place
on a continuous basis, verification exercises are conducted periodically, typically every two
to three years, to ensure that records, including biometric identifiers, are up to date. The
SEP survey was designed to take place during the 2018/19 Kalobeyei registration verification
exercise (VRX), during which UNHCR registration teams conducted house-to-house visits
across the settlement. Most households were administered a shorter basic questionnaire,
while a systematic random sample of these households were selected for an extended SEP
questionnaire. The extended survey is used to generate poverty estimates for the population
as a whole, while the additional household-level variables in the basic version may be used to
identify vulnerable households for targeted programming.
The SEP questionnaire was designed to produce data comparable to the national house-
hold survey and other standard instruments . Modules on education, employment, house-
hold characteristics, assets and consumption, and expenditure were aligned with the most
recent national poverty survey, the Kenya Integrated Household Budget Survey (KIHBS)
2015/16 and are therefore comparable to results reported locally and nationally. Questions
were also aligned with the Kenya Continuous Household Survey (KCHS) which, since end-
2019, has collected comparable statistics on an annual basis for all counties in Kenya. Addi-
tional modules on access to services, vulnerabilities, social cohesion, and the World Food
Program Livelihoods Coping Index were administered to capture specific challenges fac-
ing refugees. The questionnaires were administered in English. The questionnaire was not
translated into different languages but either (in most cases) enumerators (who were refu-
gees themselves) were able to translate, or interpreters were used to translate the questions
during the interview. The questionnaire was interpreted from English to Lotoku, Dedinka,
Arabic, Nuer, Dinka, Somalian, Aromo, and Ayuwak. See Appendix 5, “Detailed Overview of
Methodology.”
BOX
1
6
Results
14. Understanding the socioeconomic characteristics of
the population, and the poor in particular, is helpful to
identify factors limiting economic growth.32 Moreover,
comparing poor and nonpoor households along different
dimensions, such as demographics, human capital, eco-
nomic activities, and asset ownership, can inform specific
policy actions that may help raise their living standards,
address limitations associated with poverty, and promote
self-reliance.
15. Kalobeyei hosts a diverse community made up of recent
arrivals to Kenya, as well as transfers from Dadaab and
Kakuma camps. The basic SEP survey covers 6,004 house-
holds (35,043 individuals) across the three villages of
Kalobeyei.33 An estimated 85 percent of those surveyed arrived
in Kenya in 2016 or 2017, while 12 percent have been in Kenya
for more than five years. The majority of residents are South
Sudanese, though the population also includes ethnic Soma-
lis displaced from Ethiopia’s Ogaden region, Burundians who
were originally located in Dadaab, and others.
1 . Demographic Profile
1 .1 Age structure
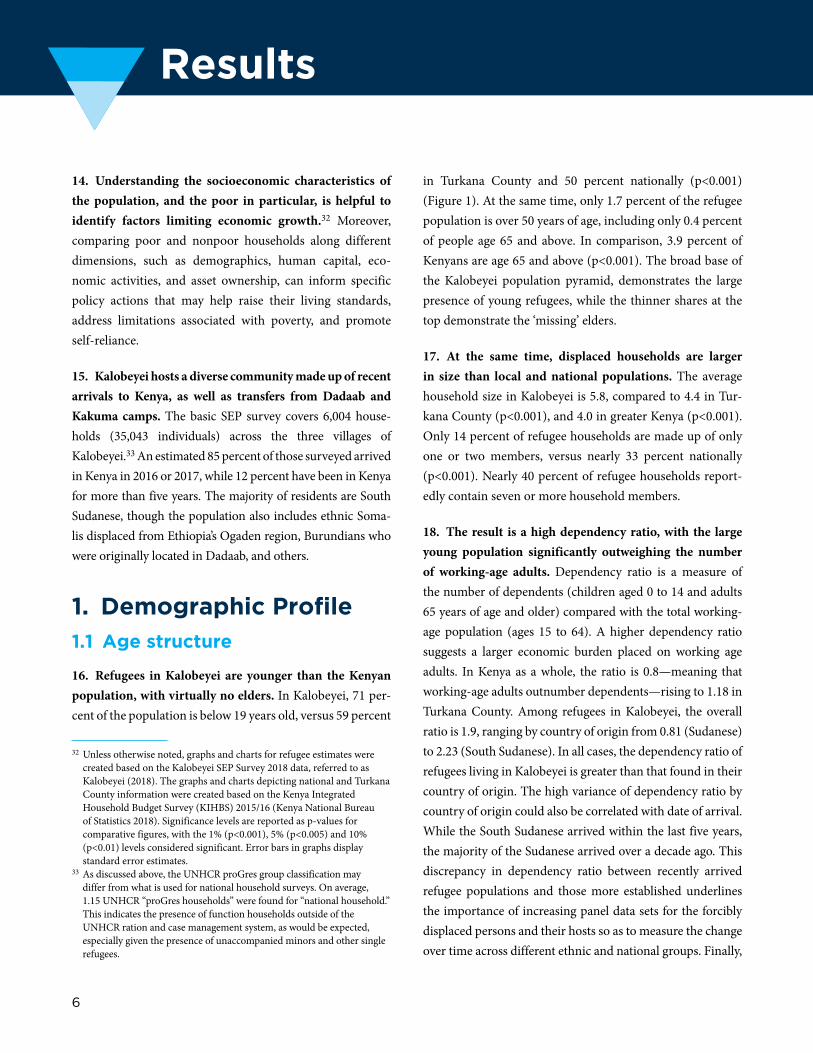
16. Refugees in Kalobeyei are younger than the Kenyan
population, with virtually no elders. In Kalobeyei, 71 per-
cent of the population is below 19 years old, versus 59 percent
32 Unless otherwise noted, graphs and charts for refugee estimates were
created based on the Kalobeyei SEP Survey 2018 data, referred to as
Kalobeyei (2018). The graphs and charts depicting national and Turkana
County information were created based on the Kenya Integrated
Household Budget Survey (KIHBS) 2015/16 (Kenya National Bureau
of Statistics 2018). Significance levels are reported as p-values for
comparative figures, with the 1% (p<0.001), 5% (p<0.005) and 10%
(p<0.01) levels considered significant. Error bars in graphs display
standard error estimates.33 As discussed above, the UNHCR proGres group classification may
differ from what is used for national household surveys. On average,
1.15 UNHCR “proGres households” were found for “national household.”
This indicates the presence of function households outside of the
UNHCR ration and case management system, as would be expected,
especially given the presence of unaccompanied minors and other single
refugees.
in Turkana County and 50 percent nationally (p<0.001)
(Figure 1). At the same time, only 1.7 percent of the refugee
population is over 50 years of age, including only 0.4 percent
of people age 65 and above. In comparison, 3.9 percent of
Kenyans are age 65 and above (p<0.001). The broad base of
the Kalobeyei population pyramid, demonstrates the large
presence of young refugees, while the thinner shares at the
top demonstrate the ‘missing’ elders.
17. At the same time, displaced households are larger
in size than local and national populations. The average
household size in Kalobeyei is 5.8, compared to 4.4 in Tur-
kana County (p<0.001), and 4.0 in greater Kenya (p<0.001).
Only 14 percent of refugee households are made up of only
one or two members, versus nearly 33 percent nationally
(p<0.001). Nearly 40 percent of refugee households report-
edly contain seven or more household members.
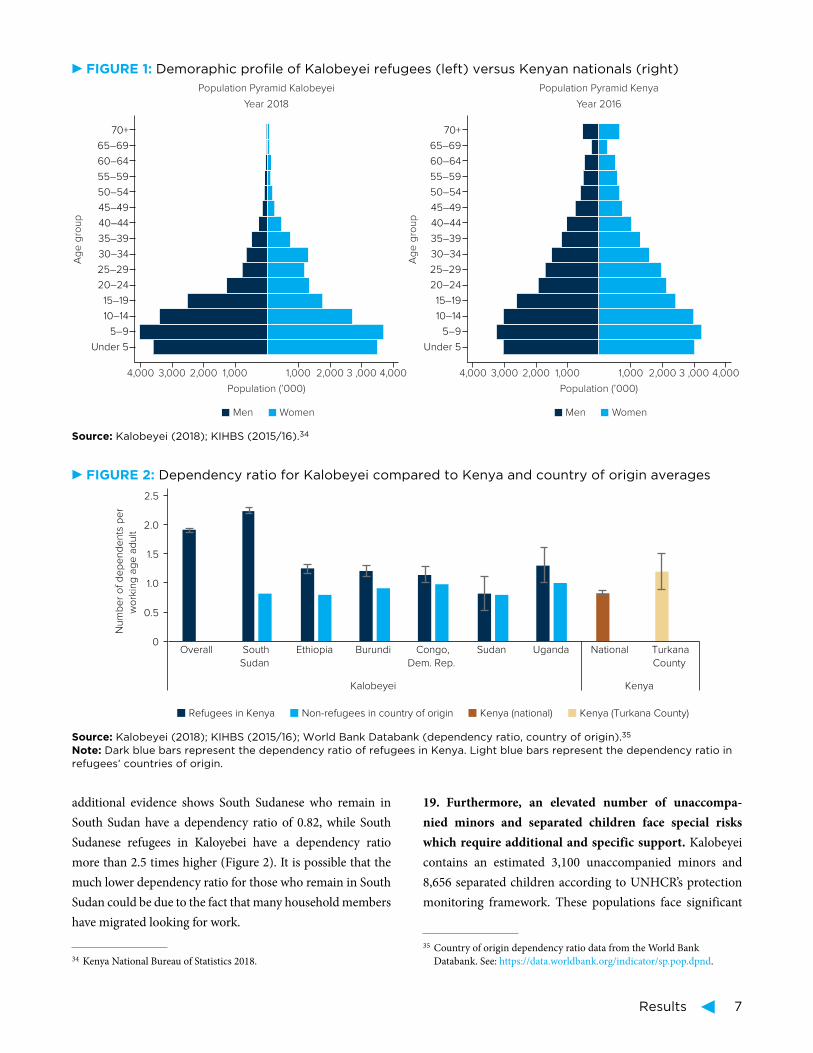
18. The result is a high dependency ratio, with the large
young population significantly outweighing the number
of working-age adults. Dependency ratio is a measure of
the number of dependents (children aged 0 to 14 and adults
65 years of age and older) compared with the total working-
age population (ages 15 to 64). A higher dependency ratio
suggests a larger economic burden placed on working age
adults. In Kenya as a whole, the ratio is 0.8—meaning that
working-age adults outnumber dependents—rising to 1.18 in
Turkana County. Among refugees in Kalobeyei, the overall
ratio is 1.9, ranging by country of origin from 0.81 (Sudanese)
to 2.23 (South Sudanese). In all cases, the dependency ratio of
refugees living in Kalobeyei is greater than that found in their
country of origin. The high variance of dependency ratio by
country of origin could also be correlated with date of arrival.
While the South Sudanese arrived within the last five years,
the majority of the Sudanese arrived over a decade ago. This
discrepancy in dependency ratio between recently arrived
refugee populations and those more established underlines
the importance of increasing panel data sets for the forcibly
displaced persons and their hosts so as to measure the change
over time across different ethnic and national groups. Finally,
Results 7
19. Furthermore, an elevated number of unaccompa-
nied minors and separated children face special risks
which require additional and specific support. Kalobeyei
contains an estimated 3,100 unaccompanied minors and
8,656 separated children according to UNHCR’s protection
monitoring framework. These populations face significant
35 Country of origin dependency ratio data from the World Bank
Databank. See: https://data.worldbank.org/indicator/sp.pop.dpnd.
additional evidence shows South Sudanese who remain in
South Sudan have a dependency ratio of 0.82, while South
Sudanese refugees in Kaloyebei have a dependency ratio
more than 2.5 times higher (Figure 2). It is possible that the
much lower dependency ratio for those who remain in South
Sudan could be due to the fact that many household members
have migrated looking for work.
34 Kenya National Bureau of Statistics 2018.
FIGURE 1: Demoraphic profile of Kalobeyei refugees (left) versus Kenyan nationals (right)
Under 5
4,000 3,000 2,000 1,000
Population (’000)
Men Women
Year 2016
Population Pyramid Kenya
Ag
e g
rou
p
1,000 2,000 3 ,000 4,000
5–9
10–14
15–19
20–24
25–29
30–34
35–39
40–44
45–49
50–54
55–59
60–64
65–69
70+
Ag
e g
rou
p
Under 5
4,000 3,000 2,000 1,000
Population (’000)
Men Women
Year 2018
Population Pyramid Kalobeyei
1,000 2,000 3 ,000 4,000
5–9
10–14
15–19
20–24
25–29
30–34
35–39
40–44
45–49
50–54
55–59
60–64
65–69
70+
Source: Kalobeyei (2018); KIHBS (2015/16).34
FIGURE 2: Dependency ratio for Kalobeyei compared to Kenya and country of origin averages
0
0.5
1.0
1.5
2.0
2.5
Overall South
Sudan
Ethiopia Burundi Congo,
Dem. Rep.
Sudan Uganda National Turkana
County
Kalobeyei
Refugees in Kenya
Kenya
Nu
mb
er
of
de
pe
nd
en
ts p
er
wo
rkin
g a
ge
ad
ult
Non-refugees in country of origin Kenya (national) Kenya (Turkana County)
Source: Kalobeyei (2018); KIHBS (2015/16); World Bank Databank (dependency ratio, country of origin).35
Note: Dark blue bars represent the dependency ratio of refugees in Kenya. Light blue bars represent the dependency ratio in
refugees’ countries of origin.
8 Understanding the Socioeconomic Conditions of Refugees in Kalobeyei, Kenya
additional protection risks and require specialized program-
ming, including case management, counseling, and place-
ment within existing household networks.
1 .2 Country of origin, gender, and disability
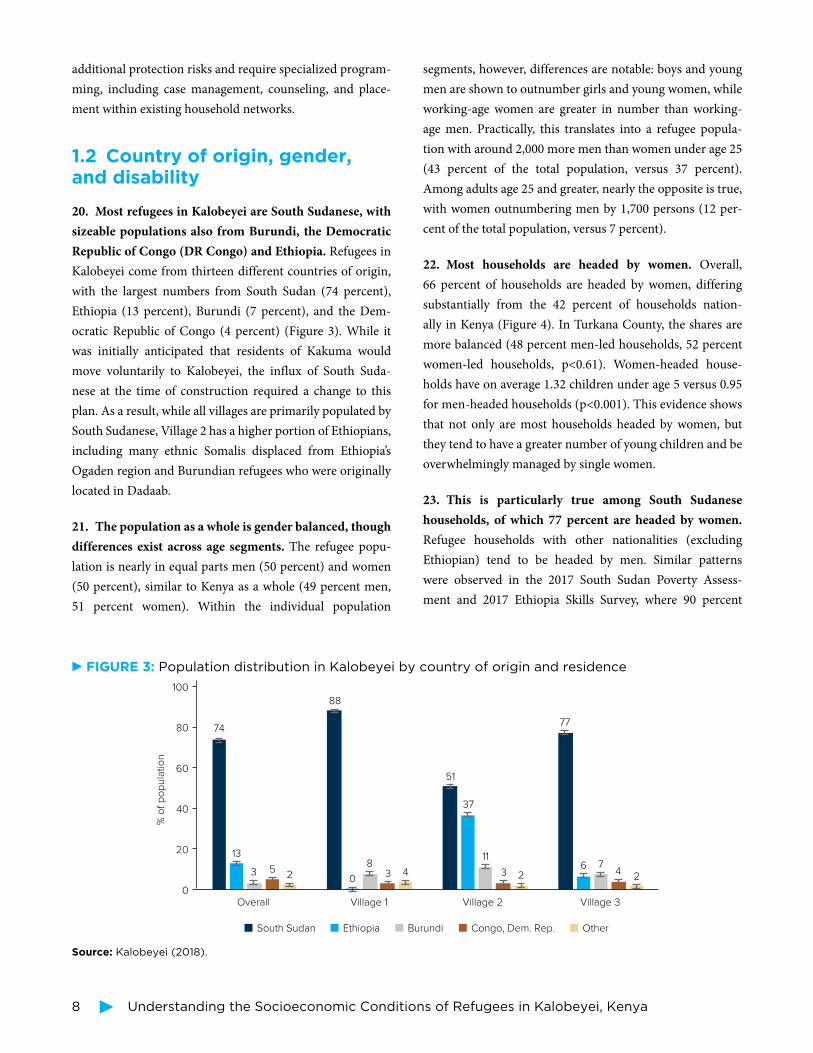
20. Most refugees in Kalobeyei are South Sudanese, with
sizeable populations also from Burundi, the Democratic
Republic of Congo (DR Congo) and Ethiopia. Refugees in
Kalobeyei come from thirteen different countries of origin,
with the largest numbers from South Sudan (74 percent),
Ethiopia (13 percent), Burundi (7 percent), and the Dem-
ocratic Republic of Congo (4 percent) (Figure 3). While it
was initially anticipated that residents of Kakuma would
move voluntarily to Kalobeyei, the influx of South Suda-
nese at the time of construction required a change to this
plan. As a result, while all villages are primarily populated by
South Sudanese, Village 2 has a higher portion of Ethiopians,
including many ethnic Somalis displaced from Ethiopia’s
Ogaden region and Burundian refugees who were originally
located in Dadaab.
21. The population as a whole is gender balanced, though
differences exist across age segments. The refugee popu-
lation is nearly in equal parts men (50 percent) and women
(50 percent), similar to Kenya as a whole (49 percent men,
51 percent women). Within the individual population
segments, however, differences are notable: boys and young
men are shown to outnumber girls and young women, while
working-age women are greater in number than working-
age men. Practically, this translates into a refugee popula-
tion with around 2,000 more men than women under age 25
(43 percent of the total population, versus 37 percent).
Among adults age 25 and greater, nearly the opposite is true,
with women outnumbering men by 1,700 persons (12 per-
cent of the total population, versus 7 percent).
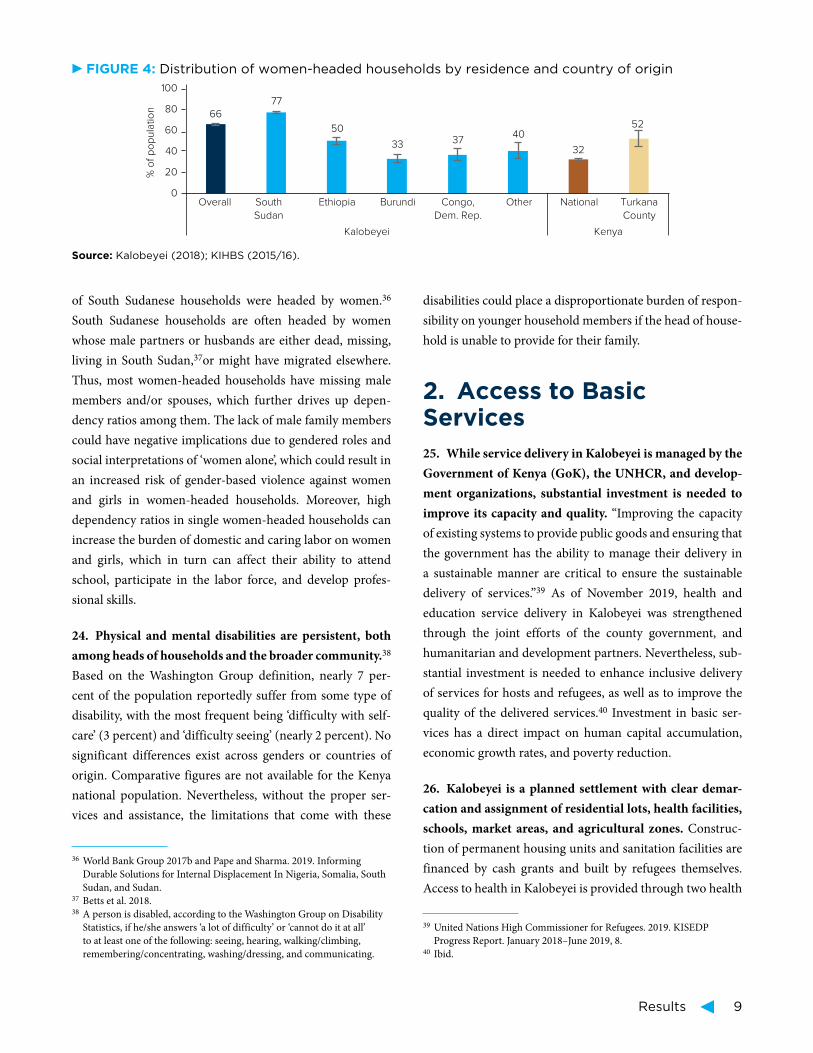
22. Most households are headed by women. Overall,
66 percent of households are headed by women, differing
substantially from the 42 percent of households nation-
ally in Kenya (Figure 4). In Turkana County, the shares are
more balanced (48 percent men-led households, 52 percent
women- led households, p<0.61). Women-headed house-
holds have on average 1.32 children under age 5 versus 0.95
for men-headed households (p<0.001). This evidence shows
that not only are most households headed by women, but
they tend to have a greater number of young children and be
overwhelmingly managed by single women.
23. This is particularly true among South Sudanese
households, of which 77 percent are headed by women.
Refugee households with other nationalities (excluding
Ethiopian) tend to be headed by men. Similar patterns
were observed in the 2017 South Sudan Poverty Assess-
ment and 2017 Ethiopia Skills Survey, where 90 percent
FIGURE 3: Population distribution in Kalobeyei by country of origin and residence
0
20
40
60
80 74
13
3 52
88
0
83 4
51
37
11
3 2
77
6 74
2
100
Overall
% o
f p
op
ula
tio
n
Village 1 Village 2 Village 3
South Sudan Ethiopia Burundi Congo, Dem. Rep. Other
Source: Kalobeyei (2018).
Results 9
of South Sudanese households were headed by women.36
South Sudanese households are often headed by women
whose male partners or husbands are either dead, missing,
living in South Sudan,37or might have migrated elsewhere.
Thus, most women-headed households have missing male
members and/or spouses, which further drives up depen-
dency ratios among them. The lack of male family members
could have negative implications due to gendered roles and
social interpretations of ‘women alone’, which could result in
an increased risk of gender-based violence against women
and girls in women-headed households. Moreover, high
dependency ratios in single women-headed households can
increase the burden of domestic and caring labor on women
and girls, which in turn can affect their ability to attend
school, participate in the labor force, and develop profes-
sional skills.
24. Physical and mental disabilities are persistent, both
among heads of households and the broader community.38
Based on the Washington Group definition, nearly 7 per-
cent of the population reportedly suffer from some type of
disability, with the most frequent being ‘difficulty with self-
care’ (3 percent) and ‘difficulty seeing’ (nearly 2 percent). No
significant differences exist across genders or countries of
origin. Comparative figures are not available for the Kenya
national population. Nevertheless, without the proper ser-
vices and assistance, the limitations that come with these
36 World Bank Group 2017b and Pape and Sharma. 2019. Informing
Durable Solutions for Internal Displacement In Nigeria, Somalia, South
Sudan, and Sudan.37 Betts et al. 2018.38 A person is disabled, according to the Washington Group on Disability
Statistics, if he/she answers ‘a lot of difficulty’ or ‘cannot do it at all’
to at least one of the following: seeing, hearing, walking/climbing,
remembering/concentrating, washing/dressing, and communicating.
disabilities could place a disproportionate burden of respon-
sibility on younger household members if the head of house-
hold is unable to provide for their family.
2 . Access to Basic Services
25. While service delivery in Kalobeyei is managed by the
Government of Kenya (GoK), the UNHCR, and develop-
ment organizations, substantial investment is needed to
improve its capacity and quality. “Improving the capacity
of existing systems to provide public goods and ensuring that
the government has the ability to manage their delivery in
a sustainable manner are critical to ensure the sustainable
delivery of services.”39 As of November 2019, health and
education service delivery in Kalobeyei was strengthened
through the joint efforts of the county government, and
humanitarian and development partners. Nevertheless, sub-
stantial investment is needed to enhance inclusive delivery
of services for hosts and refugees, as well as to improve the
quality of the delivered services.40 Investment in basic ser-
vices has a direct impact on human capital accumulation,
economic growth rates, and poverty reduction.
26. Kalobeyei is a planned settlement with clear demar-
cation and assignment of residential lots, health facilities,
schools, market areas, and agricultural zones. Construc-
tion of permanent housing units and sanitation facilities are
financed by cash grants and built by refugees themselves.
Access to health in Kalobeyei is provided through two health
39 United Nations High Commissioner for Refugees. 2019. KISEDP
Progress Report. January 2018–June 2019, 8.40 Ibid.
FIGURE 4: Distribution of women-headed households by residence and country of origin
66
77
50
33 3740
32
52
0
20
40
60
80
100
Overall South
Sudan
Ethiopia Burundi Congo,
Dem. Rep.
Other National Turkana
County
Kalobeyei Kenya
% o
f p
op
ula
tio
n
Source: Kalobeyei (2018); KIHBS (2015/16).
10 Understanding the Socioeconomic Conditions of Refugees in Kalobeyei, Kenya
facilities run by international organizations and accessible
for both hosts and refugees. These facilities are under review
to be accredited as part of the efforts to promote Universal
Health Care, which for Turkana translates into the enroll-
ment of refugees in the National Hospital Insurance Fund
(NHIF). Health services are complemented by government
run health centers. Furthermore, there are five primary and
two secondary schools run by international organizations.
Efforts to strengthen inclusion of refugees and asylum seek-
ers in the national education system are being carried out
through the development of the Refugee Education Policy.41
Market and agricultural designated areas (kitchen gardens)
were established as part of the Kalobeyei settlement plan,
while self-reliance programs have largely replaced in-kind
food rations with monthly cash vouchers under the World
Food Program’s Bamba Chakula program.42
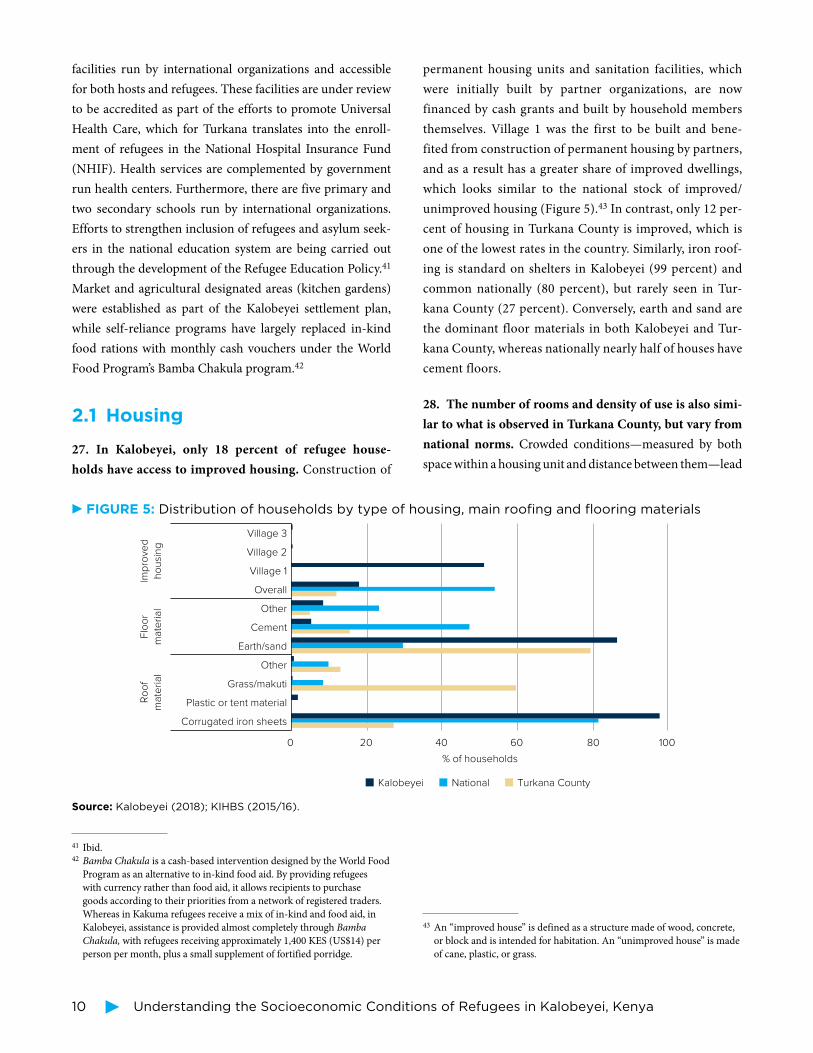
2 .1 Housing
27. In Kalobeyei, only 18 percent of refugee house-
holds have access to improved housing. Construction of
41 Ibid. 42 Bamba Chakula is a cash-based intervention designed by the World Food
Program as an alternative to in-kind food aid. By providing refugees
with currency rather than food aid, it allows recipients to purchase
goods according to their priorities from a network of registered traders.
Whereas in Kakuma refugees receive a mix of in-kind and food aid, in
Kalobeyei, assistance is provided almost completely through Bamba
Chakula, with refugees receiving approximately 1,400 KES (US$14) per
person per month, plus a small supplement of fortified porridge.
permanent housing units and sanitation facilities, which
were initially built by partner organizations, are now
financed by cash grants and built by household members
themselves. Village 1 was the first to be built and bene-
fited from construction of permanent housing by partners,
and as a result has a greater share of improved dwellings,
which looks similar to the national stock of improved/
unimproved housing (Figure 5).43 In contrast, only 12 per-
cent of housing in Turkana County is improved, which is
one of the lowest rates in the country. Similarly, iron roof-
ing is standard on shelters in Kalobeyei (99 percent) and
common nationally (80 percent), but rarely seen in Tur-
kana County (27 percent). Conversely, earth and sand are
the dominant floor materials in both Kalobeyei and Tur-
kana County, whereas nationally nearly half of houses have
cement floors.
28. The number of rooms and density of use is also simi-
lar to what is observed in Turkana County, but vary from
national norms. Crowded conditions—measured by both
space within a housing unit and distance between them—lead
43 An “improved house” is defined as a structure made of wood, concrete,
or block and is intended for habitation. An “unimproved house” is made
of cane, plastic, or grass.
FIGURE 5: Distribution of households by type of housing, main roofing and flooring materials
0 20 40 60 80 100
Corrugated iron sheets
Plastic or tent material
Grass/makuti
Other
Earth/sand
Cement
Other
Overall
Village 1
Village 2
Village 3
Ro
of
ma
teri
al
Flo
or
ma
teri
al
Imp
rove
d
ho
usi
ng
% of households
Kalobeyei National Turkana County
Source: Kalobeyei (2018); KIHBS (2015/16).

Results 11
to increased morbidity and stress,44 and constitute a major
factor in the transmission of diseases.45 On average, house-
holds in Kalobeyei occupy 1.3 habitable rooms, versus 2.1
nationally (p<0.001) and 1.1 in Turkana County (p<0.001)
(Figure 6). Due to the higher average number of household
members—likely driven by the large population of children
and young people—this translates into 4.5 persons per habit-
able room, against 2.3 in Kenya as a whole (p<0.001) and 4.2
in the rest of Turkana County (p<0.38).
2 .2 Sanitation and water
29. The Constitution of Kenya 2010 recognizes that
access to safe and sufficient water is a basic human right.
It also assigns responsibility for water supply and sanitation
provision to the 47 county governments. In Turkana there
has been a general decline in both the quantity and quality
44 UNHCR Camp Planning Standards. See: https://emergency.unhcr.org/
entry/45581/camp-planning-standards-planned-settlements.45 World Health Organization 2019.
of water for productive and domestic use. During drought,
reduced water tables are common; this leads to low yielding
boreholes and longer waiting times at the few water points
available. Other challenges include the drying of surface
water sources, high siltation, and long distances to water
points. Better water governance is therefore key to unlocking
some of the long- established barriers to economic develop-
ment of the county.46
30. Refugees in Kalobeyei reported higher access to
improved drinking water than nationals—although most
still describe regular shortages.47 Kalobeyei residents
report 100 percent access to a water point, though two-thirds
reported insufficient quantities of drinking water in the past
month (Figure 7). This is consistent with results from a 2018
Oxford Refugee Studies Center report, which found that lack
of access to sufficient quantities of water was a commonly
46 Department of Water Agriculture and Irrigation 2017.47 “Improved drinking water” is defined as water that is piped, public
tap, or from a borehole. “Unimproved drinking water” includes an
unprotected well or spring.
FIGURE 6: Distribution of households by number of habitable rooms and density
1.3
4.5
2.1 2.3
1.1
4.2
0
1
2
3
4
5
Number of habitable rooms Persons per habitable room N
um
be
r o
f ro
om
s a
nd
pe
rso
ns
pe
r ro
om
Kalobeyei National Turkana County
Source: Kalobeyei (2018); KIHBS (2015/16).
FIGURE 7: Distribution of households by improved sanitation and drinking water source
100
52
7365
63
32
0
20
40
60
80
100
Improved drinking water Improved sanitation
Kalobeyei National Turkana County
Source: Kalobeyei (2018); KIHBS (2015/16).
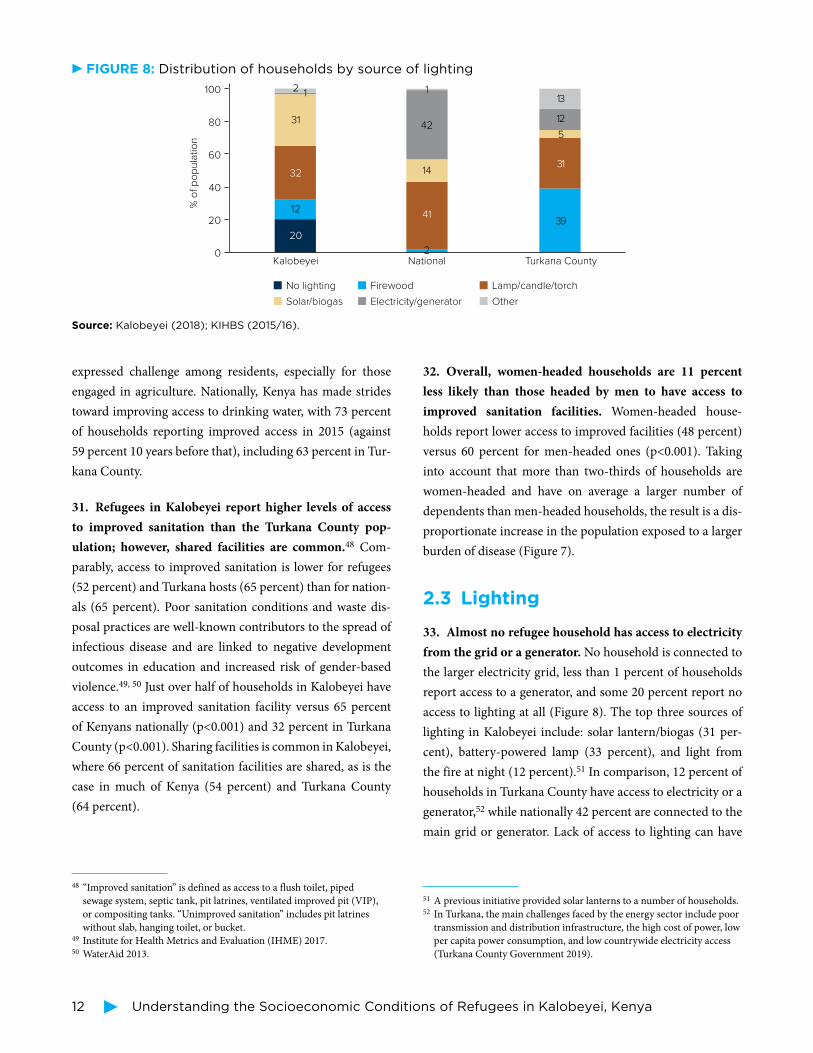
12 Understanding the Socioeconomic Conditions of Refugees in Kalobeyei, Kenya
expressed challenge among residents, especially for those
engaged in agriculture. Nationally, Kenya has made strides
toward improving access to drinking water, with 73 percent
of households reporting improved access in 2015 (against
59 percent 10 years before that), including 63 percent in Tur-
kana County.
31. Refugees in Kalobeyei report higher levels of access
to improved sanitation than the Turkana County pop-
ulation; however, shared facilities are common.48 Com-
parably, access to improved sanitation is lower for refugees
(52 percent) and Turkana hosts (65 percent) than for nation-
als (65 percent). Poor sanitation conditions and waste dis-
posal practices are well-known contributors to the spread of
infectious disease and are linked to negative development
outcomes in education and increased risk of gender-based
violence.49, 50 Just over half of households in Kalobeyei have
access to an improved sanitation facility versus 65 percent
of Kenyans nationally (p<0.001) and 32 percent in Turkana
County (p<0.001). Sharing facilities is common in Kalobeyei,
where 66 percent of sanitation facilities are shared, as is the
case in much of Kenya (54 percent) and Turkana County
(64 percent).
48 “Improved sanitation” is defined as access to a flush toilet, piped
sewage system, septic tank, pit latrines, ventilated improved pit (VIP),
or compositing tanks. “Unimproved sanitation” includes pit latrines
without slab, hanging toilet, or bucket.49 Institute for Health Metrics and Evaluation (IHME) 2017.50 WaterAid 2013.
32. Overall, women-headed households are 11 percent
less likely than those headed by men to have access to
improved sanitation facilities. Women-headed house-
holds report lower access to improved facilities (48 percent)
versus 60 percent for men-headed ones (p<0.001). Taking
into account that more than two-thirds of households are
women-headed and have on average a larger number of
dependents than men-headed households, the result is a dis-
proportionate increase in the population exposed to a larger
burden of disease (Figure 7).
2 .3 Lighting
33. Almost no refugee household has access to electricity
from the grid or a generator. No household is connected to
the larger electricity grid, less than 1 percent of households
report access to a generator, and some 20 percent report no
access to lighting at all (Figure 8). The top three sources of
lighting in Kalobeyei include: solar lantern/biogas (31 per-
cent), battery-powered lamp (33 percent), and light from
the fire at night (12 percent).51 In comparison, 12 percent of
households in Turkana County have access to electricity or a
generator,52 while nationally 42 percent are connected to the
main grid or generator. Lack of access to lighting can have
51 A previous initiative provided solar lanterns to a number of households.52 In Turkana, the main challenges faced by the energy sector include poor
transmission and distribution infrastructure, the high cost of power, low
per capita power consumption, and low countrywide electricity access
(Turkana County Government 2019).
FIGURE 8: Distribution of households by source of lighting
0
20
40
60
80
100
Kalobeyei
2 1
31
32
12
20
National
41
14
42
1
2Turkana County
39
31
5
12
13
% o
f p
op
ula
tio
n
No lighting Firewood Lamp/candle/torch
Solar/biogas Electricity/generator Other
Source: Kalobeyei (2018); KIHBS (2015/16).
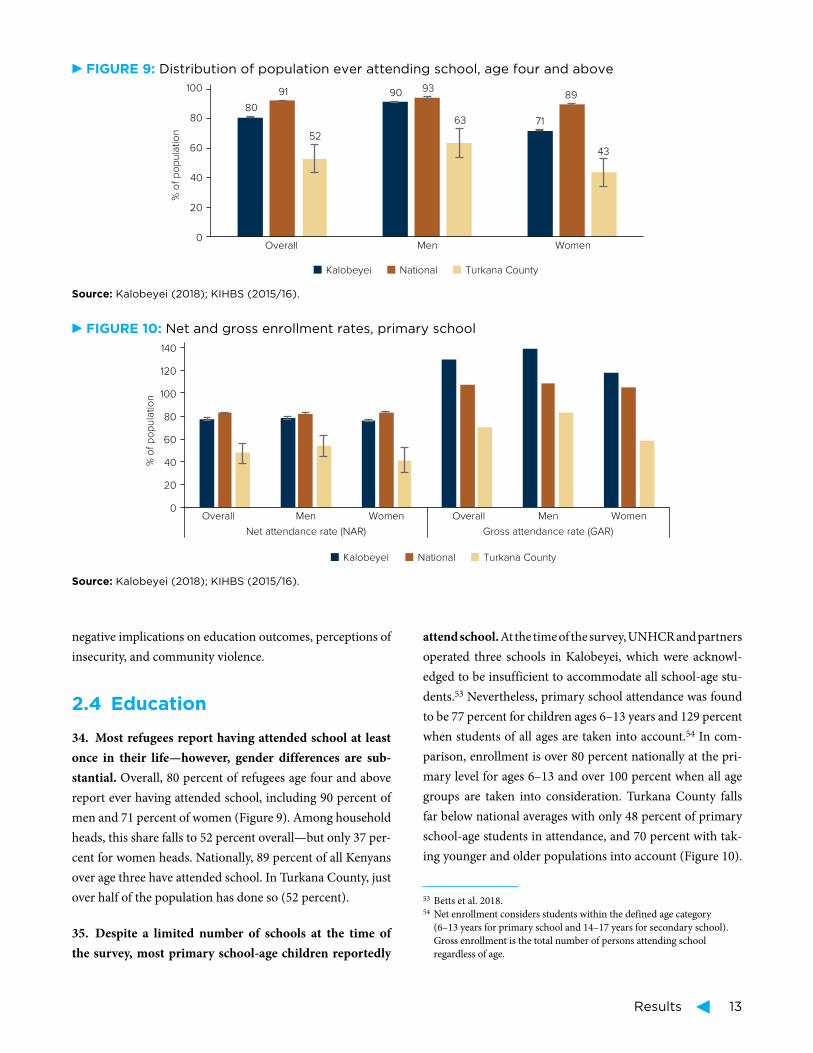
Results 13
negative implications on education outcomes, perceptions of
insecurity, and community violence.
2 .4 Education
34. Most refugees report having attended school at least
once in their life—however, gender differences are sub-
stantial. Overall, 80 percent of refugees age four and above
report ever having attended school, including 90 percent of
men and 71 percent of women (Figure 9). Among household
heads, this share falls to 52 percent overall—but only 37 per-
cent for women heads. Nationally, 89 percent of all Kenyans
over age three have attended school. In Turkana County, just
over half of the population has done so (52 percent).
35. Despite a limited number of schools at the time of
the survey, most primary school-age children reportedly
attend school. At the time of the survey, UNHCR and partners
operated three schools in Kalobeyei, which were acknowl-
edged to be insufficient to accommodate all school-age stu-
dents.53 Nevertheless, primary school attendance was found
to be 77 percent for children ages 6–13 years and 129 percent
when students of all ages are taken into account.54 In com-
parison, enrollment is over 80 percent nationally at the pri-
mary level for ages 6–13 and over 100 percent when all age
groups are taken into consideration. Turkana County falls
far below national averages with only 48 percent of primary
school-age students in attendance, and 70 percent with tak-
ing younger and older populations into account (Figure 10).
53 Betts et al. 2018.54 Net enrollment considers students within the defined age category
(6–13 years for primary school and 14–17 years for secondary school).
Gross enrollment is the total number of persons attending school
regardless of age.
FIGURE 9: Distribution of population ever attending school, age four and above
80
90
71
91 9389
52
63
43
0
20
40
60
80
100
Overall Men Women
% o
f p
op
ula
tio
n
Kalobeyei National Turkana County
Source: Kalobeyei (2018); KIHBS (2015/16).
FIGURE 10: Net and gross enrollment rates, primary school
0
20
40
60
80
100
120
140
Overall Men Women Overall Men Women
Net attendance rate (NAR) Gross attendance rate (GAR)
% o
f p
op
ula
tio
n
Kalobeyei National Turkana County
Source: Kalobeyei (2018); KIHBS (2015/16).
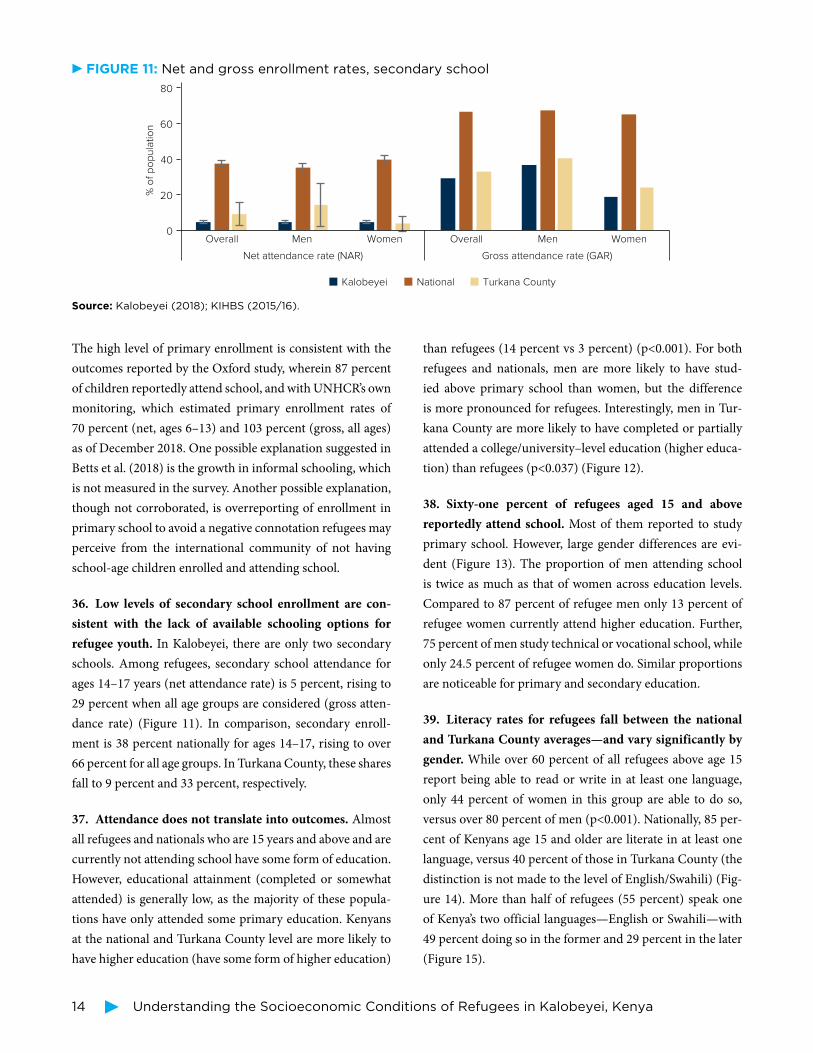
14 Understanding the Socioeconomic Conditions of Refugees in Kalobeyei, Kenya
The high level of primary enrollment is consistent with the
outcomes reported by the Oxford study, wherein 87 percent
of children reportedly attend school, and with UNHCR’s own
monitoring, which estimated primary enrollment rates of
70 percent (net, ages 6–13) and 103 percent (gross, all ages)
as of December 2018. One possible explanation suggested in
Betts et al. (2018) is the growth in informal schooling, which
is not measured in the survey. Another possible explanation,
though not corroborated, is overreporting of enrollment in
primary school to avoid a negative connotation refugees may
perceive from the international community of not having
school-age children enrolled and attending school.
36. Low levels of secondary school enrollment are con-
sistent with the lack of available schooling options for
refugee youth. In Kalobeyei, there are only two secondary
schools. Among refugees, secondary school attendance for
ages 14–17 years (net attendance rate) is 5 percent, rising to
29 percent when all age groups are considered (gross atten-
dance rate) (Figure 11). In comparison, secondary enroll-
ment is 38 percent nationally for ages 14–17, rising to over
66 percent for all age groups. In Turkana County, these shares
fall to 9 percent and 33 percent, respectively.
37. Attendance does not translate into outcomes. Almost
all refugees and nationals who are 15 years and above and are
currently not attending school have some form of education.
However, educational attainment (completed or somewhat
attended) is generally low, as the majority of these popula-
tions have only attended some primary education. Kenyans
at the national and Turkana County level are more likely to
have higher education (have some form of higher education)
than refugees (14 percent vs 3 percent) (p<0.001). For both
refugees and nationals, men are more likely to have stud-
ied above primary school than women, but the difference
is more pronounced for refugees. Interestingly, men in Tur-
kana County are more likely to have completed or partially
attended a college/university–level education (higher educa-
tion) than refugees (p<0.037) (Figure 12).
38. Sixty-one percent of refugees aged 15 and above
reportedly attend school. Most of them reported to study
primary school. However, large gender differences are evi-
dent (Figure 13). The proportion of men attending school
is twice as much as that of women across education levels.
Compared to 87 percent of refugee men only 13 percent of
refugee women currently attend higher education. Further,
75 percent of men study technical or vocational school, while
only 24.5 percent of refugee women do. Similar proportions
are noticeable for primary and secondary education.
39. Literacy rates for refugees fall between the national
and Turkana County averages—and vary significantly by
gender. While over 60 percent of all refugees above age 15
report being able to read or write in at least one language,
only 44 percent of women in this group are able to do so,
versus over 80 percent of men (p<0.001). Nationally, 85 per-
cent of Kenyans age 15 and older are literate in at least one
language, versus 40 percent of those in Turkana County (the
distinction is not made to the level of English/Swahili) (Fig-
ure 14). More than half of refugees (55 percent) speak one
of Kenya’s two official languages—English or Swahili—with
49 percent doing so in the former and 29 percent in the later
(Figure 15).
FIGURE 11: Net and gross enrollment rates, secondary school
0
20
40
60
80
Overall Men Women Overall Men Women
Net attendance rate (NAR) Gross attendance rate (GAR)
% o
f p
op
ula
tio
n
Kalobeyei National Turkana County
Source: Kalobeyei (2018); KIHBS (2015/16).
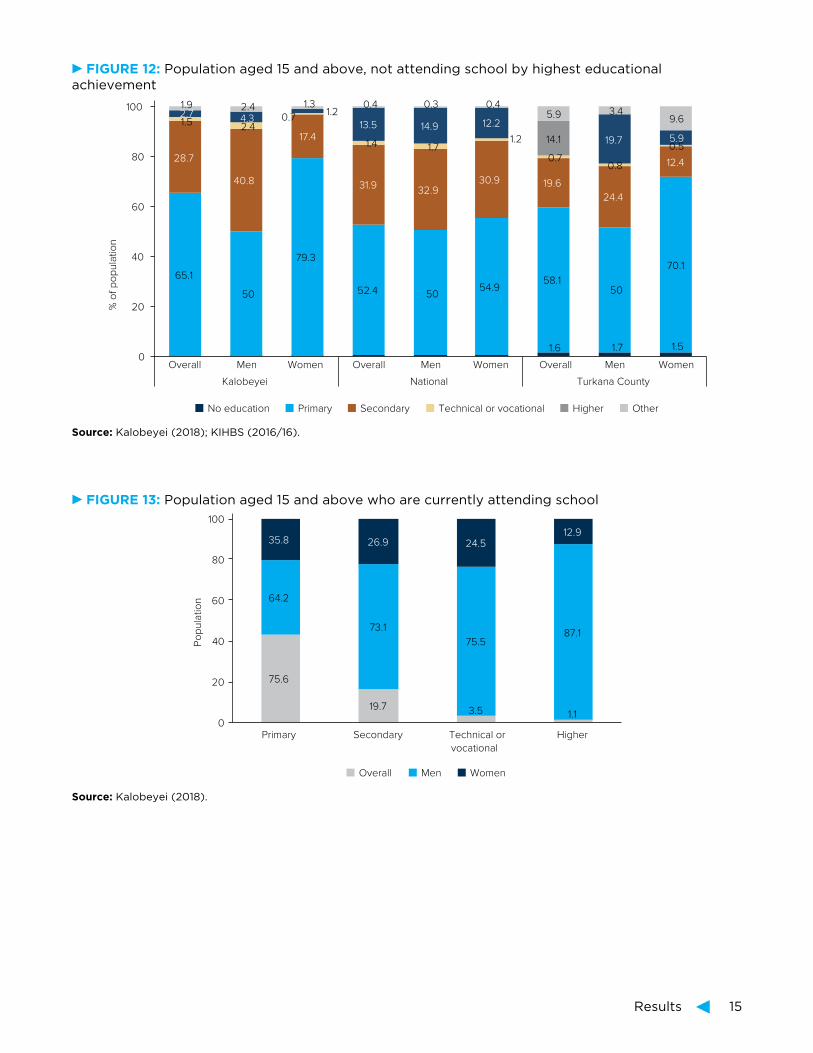
Results 15
FIGURE 12: Population aged 15 and above, not attending school by highest educational achievement
1.6 1.7 1.5
65.1
50
79.3
52.4 50 54.9
58.1 50
70.1
28.7
40.8
17.4
31.9 32.9
30.9 19.6
24.4
12.4
1.5 2.4 0.7
1.4 1.7 1.2
0.7 0.8
0.5
2.7 4.3 1.2
13.5 14.9 12.2
14.1 19.7 5.9
1.9 2.4 1.3 0.4 0.3 0.4 5.9 3.4
9.6
0
20
40
60
80
100
Overall Men Women Overall Men Women Overall Men Women
Kalobeyei National Turkana County
% o
f p
op
ula
tio
n
No education Primary Secondary Technical or vocational Higher Other
Source: Kalobeyei (2018); KIHBS (2016/16).
FIGURE 13: Population aged 15 and above who are currently attending school
75.6
19.7 3.5 1.1
64.2
73.1
75.5 87.1
35.8 26.9 24.5 12.9
0
20
40
60
80
100
Primary Secondary Technical or
vocational
Higher
Po
pu
latio
n
Overall Men Women
Source: Kalobeyei (2018).

16 Understanding the Socioeconomic Conditions of Refugees in Kalobeyei, Kenya
3 . Employment and Livelihoods
40. Refugees in Kenya face restrictions on the freedom
of movement and right to work. Although the constitution
of Kenya 2010 stipulates that every person has the right to
freedom of movement,55 Kenya’s policy of encampment con-
strains refugees’ ability to move outside the camps without
a movement pass. Only camp residents in possession of a
movement pass can travel to other parts of Kenya. Passes are
issued for a limited set of reasons, such as medical or higher
educational requirements or due to protection concerns in
camps. Refugees’ lack of freedom of movement fundamen-
tally curtails their ability to access employment and higher
education.56 Moreover, the 2006 Refugee Act provides ref-
ugees the same rights to employment as other nonnation-
als. Employment of nonnationals is governed by the Kenya
Citizenship and Immigration Act 2011, under which work
permits, called ‘Class M’ permits, are granted. Applications
for permits also need a recommendation from a prospective
employer and must be accompanied by a letter from the DRA
confirming refugee status.57 While refugees may theoreti-
cally work, in practice this is reportedly much more difficult
given that work permits for asylum seekers or refugees are
55 National Council for Law Reporting 2010, 23.56 Refugee Consortium of Kenya 2012.57 Zetter and Ruaudel 2017.
issued only in a few isolated cases.58 For those who manage
to obtain them, work permits last for a limited period of time
of five years. Due to the obstacles to formal employment, ref-
ugees undertake low paying jobs (incentive workers) 59 and
often seek employment in the informal sector. For refugees,
the right to work, as well as the freedom to move where the
economic opportunities are and access labor markets are
vital for becoming self-reliant and allows them to contribute
to the local economy.60
41. Refugees in possession of a valid refugee identifica-
tion document can acquire a business permit independent
of a Class M permit. Issuance of single business permits is
carried out by county business licensing offices. In Kakuma
and Kalobeyei, refugees can apply for single business permits
at the office of the county administration (Trade, Tourism
and Industrialization). While single business permits are
issued to enterprises with permanent facilities, street ven-
dors or traders with temporary stalls are charged daily fees.61
One of the key challenges with regards to fee collection is the
lack of a streamlined approach with clear charging regula-
tions. Fee collection is carried out without issuing receipts,
collectors often lack official IDs, and there is no consistent
and clear information about requirements for different
58 Refugee Consortium of Kenya 2012.59 Betts et al. 2018.60 Zetter 2016; Schuettler 2017.61 United Nations High Commissioner for Refugees. 2017. Kakuma
Integrated Livelihoods Strategy 2017–2019, 27.
FIGURE 14: Population distribution, by ability FIGURE 15: Population distribution in to read and write in any language Kalobeyei, by ability to read and write in official languages
0
20
40
60
80
100
Overall Men Women
% o
f p
op
ula
tio
n
Kalobeyei National Turkana County
0
20
40
60
80
100
Overall Men Women
% o
f p
op
ula
tio
n
English Swahili
Source: Kalobeyei (2018); KIHBS (2015/16).
Note: For English and Swahili literacy, data are unavailable for the Kenyans.
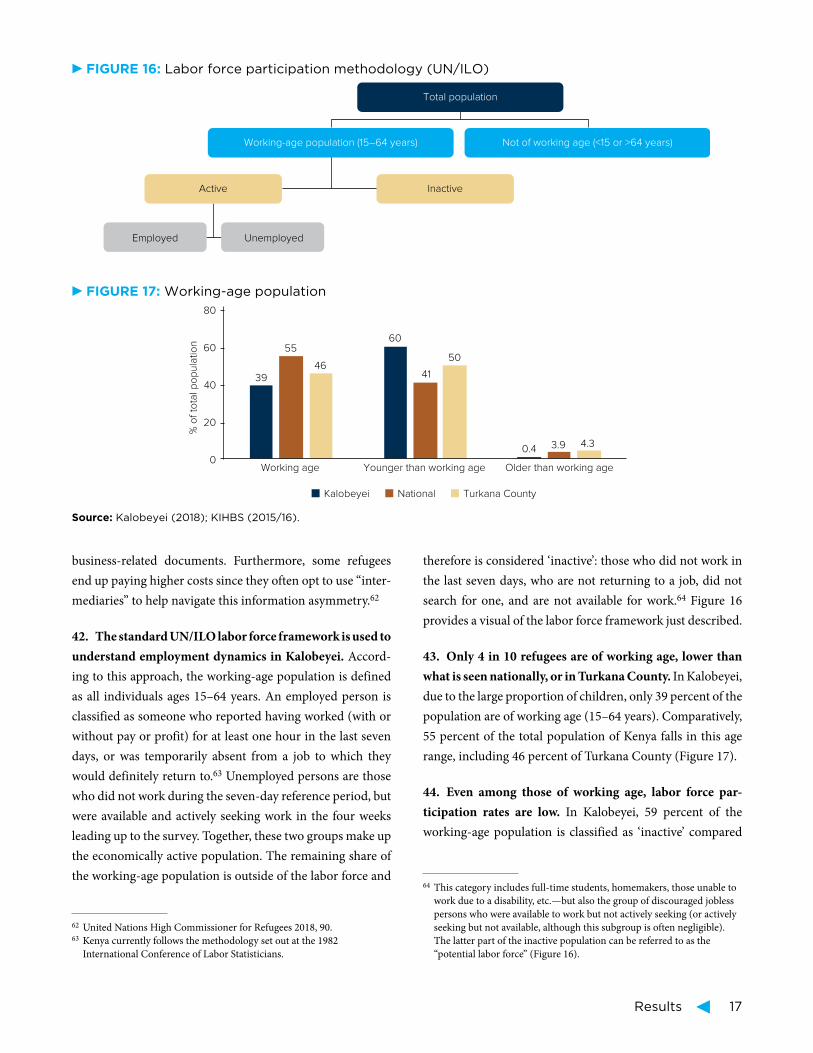
Results 17
business-related documents. Furthermore, some refugees
end up paying higher costs since they often opt to use “inter-
mediaries” to help navigate this information asymmetry.62
42. The standard UN/ILO labor force framework is used to
understand employment dynamics in Kalobeyei. Accord-
ing to this approach, the working-age population is defined
as all individuals ages 15–64 years. An employed person is
classified as someone who reported having worked (with or
without pay or profit) for at least one hour in the last seven
days, or was temporarily absent from a job to which they
would definitely return to.63 Unemployed persons are those
who did not work during the seven-day reference period, but
were available and actively seeking work in the four weeks
leading up to the survey. Together, these two groups make up
the economically active population. The remaining share of
the working-age population is outside of the labor force and
62 United Nations High Commissioner for Refugees 2018, 90.63 Kenya currently follows the methodology set out at the 1982
International Conference of Labor Statisticians.
therefore is considered ‘inactive’: those who did not work in
the last seven days, who are not returning to a job, did not
search for one, and are not available for work.64 Figure 16
provides a visual of the labor force framework just described.
43. Only 4 in 10 refugees are of working age, lower than
what is seen nationally, or in Turkana County. In Kalobeyei,
due to the large proportion of children, only 39 percent of the
population are of working age (15–64 years). Comparatively,
55 percent of the total population of Kenya falls in this age
range, including 46 percent of Turkana County (Figure 17).
44. Even among those of working age, labor force par-
ticipation rates are low. In Kalobeyei, 59 percent of the
working-age population is classified as ‘inactive’ compared
64 This category includes full-time students, homemakers, those unable to
work due to a disability, etc.—but also the group of discouraged jobless
persons who were available to work but not actively seeking (or actively
seeking but not available, although this subgroup is often negligible).
The latter part of the inactive population can be referred to as the
“potential labor force” (Figure 16).
FIGURE 16: Labor force participation methodology (UN/ILO)
Total population
Working-age population (15–64 years)
Active
Employed Unemployed
Inactive
Not of working age (<15 or >64 years)
FIGURE 17: Working-age population
39
60
0.4
55
41
3.9
46 50
4.3
0
20
40
60
80
Working age Younger than working age Older than working age
% o
f to
tal p
op
ula
tio
n
Kalobeyei National Turkana County
Source: Kalobeyei (2018); KIHBS (2015/16).
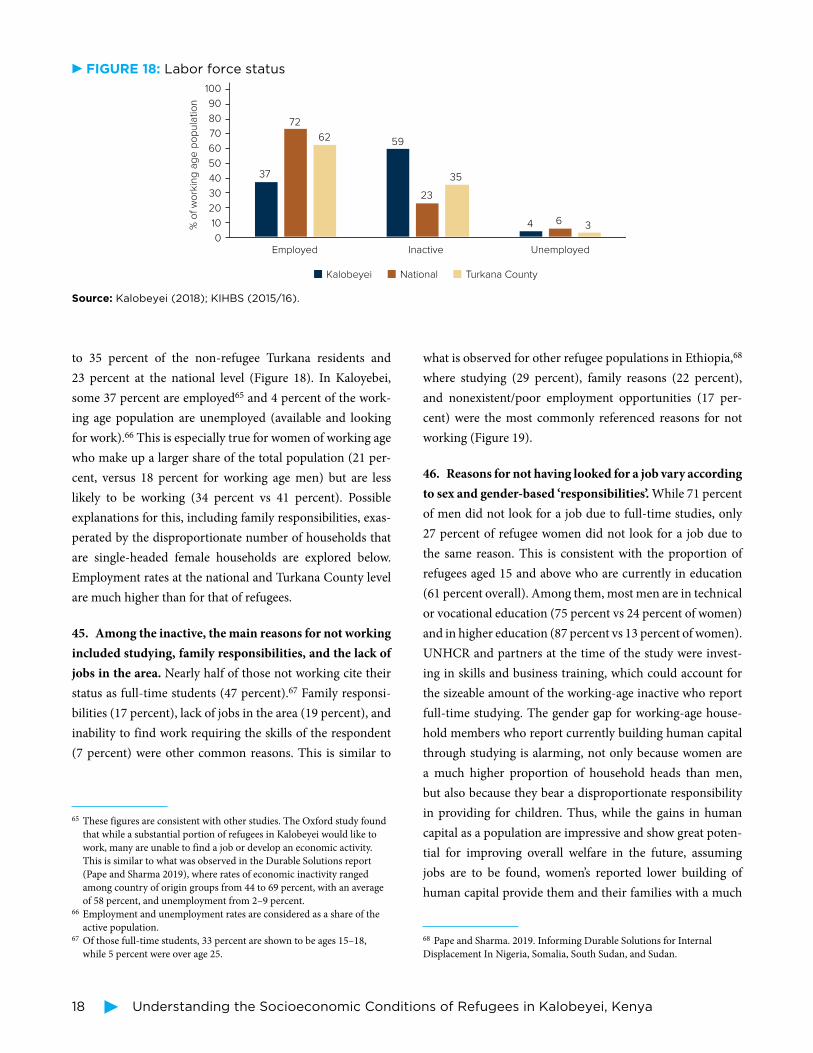
18 Understanding the Socioeconomic Conditions of Refugees in Kalobeyei, Kenya
to 35 percent of the non-refugee Turkana residents and
23 percent at the national level (Figure 18). In Kaloyebei,
some 37 percent are employed65 and 4 percent of the work-
ing age population are unemployed (available and looking
for work).66 This is especially true for women of working age
who make up a larger share of the total population (21 per-
cent, versus 18 percent for working age men) but are less
likely to be working (34 percent vs 41 percent). Possible
explanations for this, including family responsibilities, exas-
perated by the disproportionate number of households that
are single-headed female households are explored below.
Employment rates at the national and Turkana County level
are much higher than for that of refugees.
45. Among the inactive, the main reasons for not working
included studying, family responsibilities, and the lack of
jobs in the area. Nearly half of those not working cite their
status as full-time students (47 percent).67 Family responsi-
bilities (17 percent), lack of jobs in the area (19 percent), and
inability to find work requiring the skills of the respondent
(7 percent) were other common reasons. This is similar to
65 These figures are consistent with other studies. The Oxford study found
that while a substantial portion of refugees in Kalobeyei would like to
work, many are unable to find a job or develop an economic activity.
This is similar to what was observed in the Durable Solutions report
(Pape and Sharma 2019), where rates of economic inactivity ranged
among country of origin groups from 44 to 69 percent, with an average
of 58 percent, and unemployment from 2–9 percent.66 Employment and unemployment rates are considered as a share of the
active population. 67 Of those full-time students, 33 percent are shown to be ages 15–18,
while 5 percent were over age 25.
what is observed for other refugee populations in Ethiopia,68
where studying (29 percent), family reasons (22 percent),
and nonexistent/poor employment opportunities (17 per-
cent) were the most commonly referenced reasons for not
working (Figure 19).
46. Reasons for not having looked for a job vary according
to sex and gender-based ‘responsibilities’. While 71 percent
of men did not look for a job due to full-time studies, only
27 percent of refugee women did not look for a job due to
the same reason. This is consistent with the proportion of
refugees aged 15 and above who are currently in education
(61 percent overall). Among them, most men are in technical
or vocational education (75 percent vs 24 percent of women)
and in higher education (87 percent vs 13 percent of women).
UNHCR and partners at the time of the study were invest-
ing in skills and business training, which could account for
the sizeable amount of the working-age inactive who report
full-time studying. The gender gap for working-age house-
hold members who report currently building human capital
through studying is alarming, not only because women are
a much higher proportion of household heads than men,
but also because they bear a disproportionate responsibility
in providing for children. Thus, while the gains in human
capital as a population are impressive and show great poten-
tial for improving overall welfare in the future, assuming
jobs are to be found, women’s reported lower building of
human capital provide them and their families with a much
68 Pape and Sharma. 2019. Informing Durable Solutions for Internal
Displacement In Nigeria, Somalia, South Sudan, and Sudan.
FIGURE 18: Labor force status
37
59
4
72
23
6
62
35
3
0
10
20
30
40
50
60
70
80
90
100
Employed Inactive Unemployed
% o
f w
ork
ing
ag
e p
op
ula
tio
n
Kalobeyei National Turkana County
Source: Kalobeyei (2018); KIHBS (2015/16).

Results 19
lower probability for improving welfare through gainful
employment in the future. Furthermore, 28 percent of the
women did not look for a job because of ‘family responsi-
bilities’, while that was the case for only 2 percent of men.
Interestingly, most of the population who did not look for a
job because they were not able to find work requiring their
skills were women (11 percent vs 3 percent of men). Refugee
women in Kalobeyei are more likely than men to not look for
jobs because of family ‘responsibilities’ (p<0.00), while men
are more likely to not look for jobs because they are full-time
students (p<0.00; Figure 19) (see section 5.4 “Understand-
ing refugee women’s socioeconomic limitations” for more
details).
47. Out of those employed, 2 percent were absent from
work during the last seven days due to education or train-
ing, as well as due to family and community-based respon-
sibilities. The main reasons for having been absent from
work also vary according to gender. Compared to 9 percent
of women, 26 percent of men were absent from work due to
education or training. In contrast, compared to only 7 per-
cent of men, 36 percent of women were absent from work
due to family or community responsibilities. Absences to
work and reasons of not having looked for a job, are marked
by a gender divide which illustrates that stereotypical gender
roles linked to gender-based responsibilities are negatively
impacting the opportunities for economic development for
women, their families, and their communities at large. This
observed gender divide is likely only enhanced by an already
complex and income-scarce context (Figure 20).69
48. Among the inactive, 36 percent can be described as
“potential labor force,” or those persons who were avail-
able to work but not actively seeking.70 This was the case
for 42 percent of the inactive women and 29 percent of the
inactive men which confirms, on one the hand, that refu-
gee women—despite taking charge of the unpaid domestic
chores—tend to be more economically inactive than refugee
men; and on the other hand, the need for developing and
implementing social protection programs that address the
needs of inactive populations and promotes full participa-
tion in the labor market.
49. “Volunteer activity” was the most predominant form
of work reported by refugees. As found in precedent studies
that show that due to restrictions on the freedom of move-
ment and difficulties in obtaining a Class M work permit,
most refugees in Kalobeyei are limited to ‘incentive work’
and volunteering.71 Nearly half of the refugees who are
69 If employment and earnings gender gaps were closed in each of the top
30 refugee-hosting countries (which include Kenya), refugee women could
generate up to $1.4 trillion to annual global GDP (Kabir and Klugman 2019).70 This includes those actively seeking but not available, but this is
negligible in the refugee population. 71 Betts et al. 2018.
FIGURE 19: Main reason for not having looked for a job in the last four weeks
0 20 40 60 80
No jobs available in the area
Unable to find work requiring his/her skills
Homemaker (family responsibilities)
Full-time student/pupil
% of unemployed/inactive population
Women Men Overall
Source: Kalobeyei (2018).

20 Understanding the Socioeconomic Conditions of Refugees in Kalobeyei, Kenya
employed reported working as a volunteer during the past
seven days—possibly in combination with another activity
(Figure 21). In fact, 27 percent of those employed worked
exclusively as volunteers, interns or apprentices.72 The pres-
ence of “incentive workers,” those hired with pay restrictions
by the United Nations and NGOs in community service func-
tions, is closely regulated, and since these positions are paid,
these positions were classified as remunerated work (under
72 Due to how the questionnaire was formulated, it is not possible to see
the primary employer for volunteer positions. However, an ongoing
socioeconomic assessment of the Kakuma refugee population (to
be published on the last quarter of year 2020), will include this
differentiation.
labor force status “wage employment”).73 Conversely, almost
no one (less than 1 percent) in the Kenyan national popula-
tion reports being engaged in volunteer activity. For Turkana
County, the proportion is 3 percent. At the national level, the
most common activity is wage employment, while in Tur-
kana, the majority reported to be self-employed (49 percent
versus 23 percent for the Kenyan national average). The dis-
proportionate number of nationals in Turkana County who
report being self-employed is another contributing factor to
the county being one of the poorest in Kenya.
73 Betts et al. (2018) estimate that 80 percent of those with a regular income
source work as “inventive workers” acting as teachers, community
mobilizers, and security guards. When asked to verify this finding,
enumerators confirmed that incentive workers were correctly classified as
employed, and indicated that they encountered numerous refugees who
reported separate volunteering activities, often as a gateway to employment.
FIGURE 20: Main reasons for having been absent from work
7 7
17
24
8
4
26
7 7 9 9
36
0
10
20
30
40
Illness, injury, or
temporary disability
Off season Education or training Family/community
responsibilities
Overall Men Women
FIGURE 21: Type of work in last seven days, among employed
0
20
40
60
27
42
2621 23
49
34 34
17
27
116
20
50
3.61.52 .25
Wage
employment
Self-employed Agriculture
(own/family)
Family business Apprenticeship Volunteer
Kalobeyei National Turkana County
Source: Kalobeyei (2018); KIHBS (2015/16).
Note: Percentages do not sum up to 100 percent since persons may have engaged in more than one activity.

Results 21
50. Self-employed work in the informal sector is the most
common source of self-generated income. Excluding vol-
unteers, who earn very little or no money, 28 percent of
refugees are self-employed in the informal sector, while an
additional 10 percent are employed by others in the infor-
mal sector and 8 percent work in the formal private sector.
Reportedly, 14 percent were self-employed in the agricul-
tural sector, and 5 percent in activities related to pastoralism.
Nearly 25 percent are employed by nongovernmental orga-
nizations or the United Nations. Among other factors, but
mainly due to restrictions on the freedom of movement and
difficulties to obtain a Class M work permit, which allows
a full salary,74 refugees have no option but to accept ‘incen-
tive work’ positions and participate in the informal sector
(Figure 22).75
3 .1 Livelihood assets
51. Access to family networks abroad and other liveli-
hoods assets for refugees varies—often by gender. Thirteen
percent of refugees have at least one family member abroad
and 6 percent receive remittances from abroad. Ten percent
of households have at least one family connection outside
of the settlement in Kenya. Programs helping to channel
remittances to productive investments, such as business-
related skills, have been shown to be effective for promoting
74 There are legal restrictions on the allowable monthly salary for incentive
work (Betts et al. 2018).75 Betts et al. 2018; O’Callaghan and Sturge 2018.
development. In Mexico—one of the highest recipients of
remittances worldwide—programs focused on using remit-
tances to foster business growth have been shown to boost
entrepreneurship in lower income areas.76 Entrepreneur-
ship promotes self-reliance and can lead to the creation of
employment opportunities for refugees and hosts.77 Never-
theless, although remittances can be useful to finance refu-
gee entrepreneurial activities, the current restrictions on the
right to work and freedom of movement sharply limit refu-
gee’s opportunities to start-up businesses hindering efforts to
unlock refugees economic potential.
52. Financial services have been integrated into other
assistance types. Kenya offers a range of financial services,
including mobile money services with basic savings and
payment features. Most nationals aged 18 and above are
subscribed to mobile financial services. Among those sub-
scribed, 75 percent use mobile money while 14 percent use
mobile banking. As part of the humanitarian sector’s broader
shift toward cash programming in place of traditional distri-
butions and programming, UNHCR adopted cash grants for
shelter in 2018, for which all households were required to
establish a mobile money account.78 Besides mobile money,
financial services in Kalobeyei are accessed mainly through
76 World Bank 2019.77 United Nations High Commissioner for Refugees. 2019. How business
incubators can facilitate refugee entrepreneurship and integration.78 The SEP survey questionnaire inquired only about accounts in banks
and other formal financial institutions, given the assistance previously
provided for enrollment in mobile money.
FIGURE 22: Main employer for the primary activity (excluding volunteer)
Other
United Nations agency
Local NGO/CBO
Pastoralist activities (self-employed)
Private sector enterprise (registered/formal)
Informal sector (employed)
Small-scale agriculture (self-employed)
International NGOs
Informal sector (self-employed)
0 5 10 15 20 25 30
% of employed population
Source: Kalobeyei (2018).
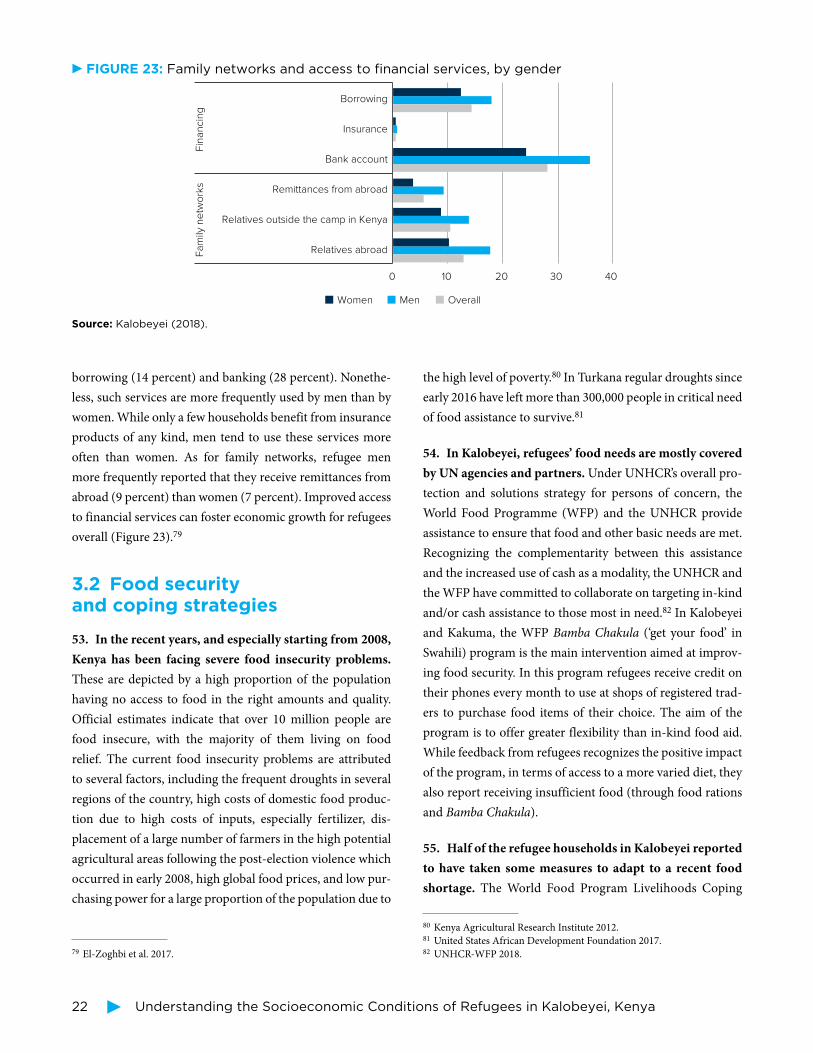
22 Understanding the Socioeconomic Conditions of Refugees in Kalobeyei, Kenya
borrowing (14 percent) and banking (28 percent). Nonethe-
less, such services are more frequently used by men than by
women. While only a few households benefit from insurance
products of any kind, men tend to use these services more
often than women. As for family networks, refugee men
more frequently reported that they receive remittances from
abroad (9 percent) than women (7 percent). Improved access
to financial services can foster economic growth for refugees
overall (Figure 23).79
3 .2 Food security and coping strategies
53. In the recent years, and especially starting from 2008,
Kenya has been facing severe food insecurity problems.
These are depicted by a high proportion of the population
having no access to food in the right amounts and quality.
Official estimates indicate that over 10 million people are
food insecure, with the majority of them living on food
relief. The current food insecurity problems are attributed
to several factors, including the frequent droughts in several
regions of the country, high costs of domestic food produc-
tion due to high costs of inputs, especially fertilizer, dis-
placement of a large number of farmers in the high potential
agricultural areas following the post-election violence which
occurred in early 2008, high global food prices, and low pur-
chasing power for a large proportion of the population due to
79 El-Zoghbi et al. 2017.
the high level of poverty.80 In Turkana regular droughts since
early 2016 have left more than 300,000 people in critical need
of food assistance to survive.81
54. In Kalobeyei, refugees’ food needs are mostly covered
by UN agencies and partners. Under UNHCR’s overall pro-
tection and solutions strategy for persons of concern, the
World Food Programme (WFP) and the UNHCR provide
assistance to ensure that food and other basic needs are met.
Recognizing the complementarity between this assistance
and the increased use of cash as a modality, the UNHCR and
the WFP have committed to collaborate on targeting in-kind
and/or cash assistance to those most in need.82 In Kalobeyei
and Kakuma, the WFP Bamba Chakula (‘get your food’ in
Swahili) program is the main intervention aimed at improv-
ing food security. In this program refugees receive credit on
their phones every month to use at shops of registered trad-
ers to purchase food items of their choice. The aim of the
program is to offer greater flexibility than in-kind food aid.
While feedback from refugees recognizes the positive impact
of the program, in terms of access to a more varied diet, they
also report receiving insufficient food (through food rations
and Bamba Chakula).
55. Half of the refugee households in Kalobeyei reported
to have taken some measures to adapt to a recent food
shortage. The World Food Program Livelihoods Coping
80 Kenya Agricultural Research Institute 2012.81 United States African Development Foundation 2017.82 UNHCR-WFP 2018.
FIGURE 23: Family networks and access to financial services, by gender
0 10 20 30 40
Relatives abroad
Relatives outside the camp in Kenya
Remittances from abroad
Bank account
Insurance
Borrowing
Fa
mily
ne
two
rks
Fin
an
cin
g
Overall Women Men
Source: Kalobeyei (2018).
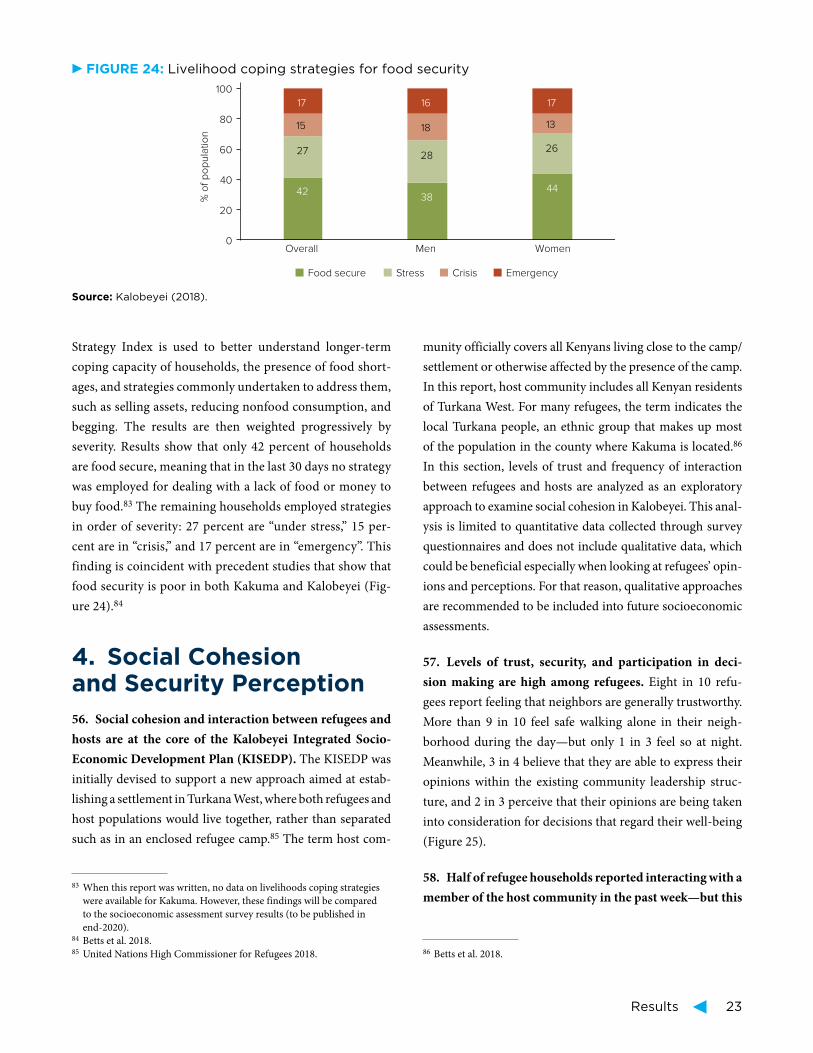
Results 23
Strategy Index is used to better understand longer-term
coping capacity of households, the presence of food short-
ages, and strategies commonly undertaken to address them,
such as selling assets, reducing nonfood consumption, and
begging. The results are then weighted progressively by
severity. Results show that only 42 percent of households
are food secure, meaning that in the last 30 days no strategy
was employed for dealing with a lack of food or money to
buy food.83 The remaining households employed strategies
in order of severity: 27 percent are “under stress,” 15 per-
cent are in “crisis,” and 17 percent are in “emergency”. This
finding is coincident with precedent studies that show that
food security is poor in both Kakuma and Kalobeyei (Fig-
ure 24).84
4 . Social Cohesion and Security Perception
56. Social cohesion and interaction between refugees and
hosts are at the core of the Kalobeyei Integrated Socio-
Economic Development Plan (KISEDP). The KISEDP was
initially devised to support a new approach aimed at estab-
lishing a settlement in Turkana West, where both refugees and
host populations would live together, rather than separated
such as in an enclosed refugee camp.85 The term host com-
83 When this report was written, no data on livelihoods coping strategies
were available for Kakuma. However, these findings will be compared
to the socioeconomic assessment survey results (to be published in
end-2020).84 Betts et al. 2018.85 United Nations High Commissioner for Refugees 2018.
munity officially covers all Kenyans living close to the camp/
settlement or otherwise affected by the presence of the camp.
In this report, host community includes all Kenyan residents
of Turkana West. For many refugees, the term indicates the
local Turkana people, an ethnic group that makes up most
of the population in the county where Kakuma is located.86
In this section, levels of trust and frequency of interaction
between refugees and hosts are analyzed as an exploratory
approach to examine social cohesion in Kalobeyei. This anal-
ysis is limited to quantitative data collected through survey
questionnaires and does not include qualitative data, which
could be beneficial especially when looking at refugees’ opin-
ions and perceptions. For that reason, qualitative approaches
are recommended to be included into future socioeconomic
assessments.
57. Levels of trust, security, and participation in deci-
sion making are high among refugees. Eight in 10 refu-
gees report feeling that neighbors are generally trustworthy.
More than 9 in 10 feel safe walking alone in their neigh-
borhood during the day—but only 1 in 3 feel so at night.
Meanwhile, 3 in 4 believe that they are able to express their
opinions within the existing community leadership struc-
ture, and 2 in 3 perceive that their opinions are being taken
into consideration for decisions that regard their well-being
(Figure 25).
58. Half of refugee households reported interacting with a
member of the host community in the past week—but this
86 Betts et al. 2018.
FIGURE 24: Livelihood coping strategies for food security
42 38
44
27 28 26
15 18 13
17 16 17
0
20
40
60
80
100
Overall Men Women
% o
f p
op
ula
tio
n
Food secure Stress Crisis Emergency
Source: Kalobeyei (2018).
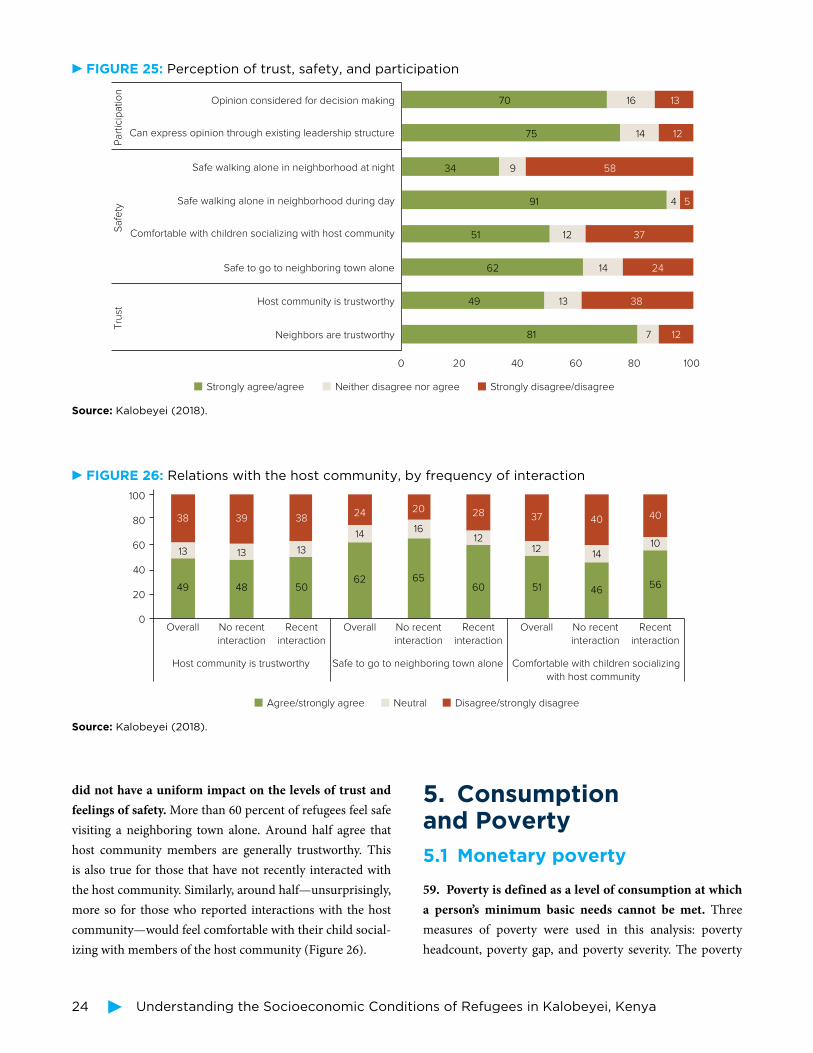
24 Understanding the Socioeconomic Conditions of Refugees in Kalobeyei, Kenya
did not have a uniform impact on the levels of trust and
feelings of safety. More than 60 percent of refugees feel safe
visiting a neighboring town alone. Around half agree that
host community members are generally trustworthy. This
is also true for those that have not recently interacted with
the host community. Similarly, around half—unsurprisingly,
more so for those who reported interactions with the host
community—would feel comfortable with their child social-
izing with members of the host community (Figure 26).
5 . Consumption and Poverty
5 .1 Monetary poverty
59. Poverty is defined as a level of consumption at which
a person’s minimum basic needs cannot be met. Three
measures of poverty were used in this analysis: poverty
headcount, poverty gap, and poverty severity. The poverty
FIGURE 25: Perception of trust, safety, and participation
0 20
81 7 12
49 13 38
62 14 24
51 12 37
91 4 5
34 9 58
75 14 12
70 16 13
40 60 80 100
Neighbors are trustworthy
Host community is trustworthy
Safe to go to neighboring town alone
Comfortable with children socializing with host community
Safe walking alone in neighborhood during day
Safe walking alone in neighborhood at night
Can express opinion through existing leadership structure
Opinion considered for decision making
Tru
st
Sa
fety
P
art
icip
atio
n
Strongly agree/agree Neither disagree nor agree Strongly disagree/disagree
Source: Kalobeyei (2018).
FIGURE 26: Relations with the host community, by frequency of interaction
0
20
40
60
80
100
Overall No recent
interaction
Recent
interaction
Overall No recent
interaction
Recent
interaction
Overall No recent
interaction
Recent
interaction
49 48 5062 65
60 51 4656
13 13 13
1416
1212
1410
38 39 3824 20 28 37 40 40
Host community is trustworthy Safe to go to neighboring town alone Comfortable with children socializing
with host community
Agree/strongly agree Neutral Disagree/strongly disagree
Source: Kalobeyei (2018).
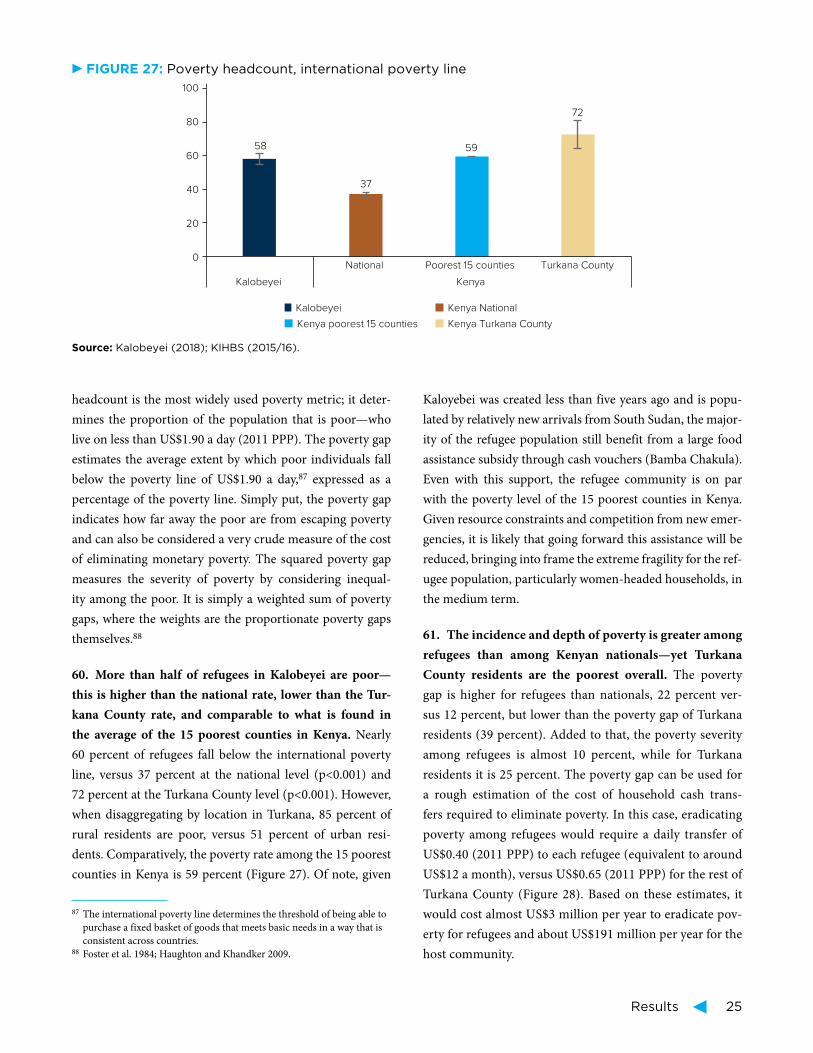
Results 25
headcount is the most widely used poverty metric; it deter-
mines the proportion of the population that is poor—who
live on less than US$1.90 a day (2011 PPP). The poverty gap
estimates the average extent by which poor individuals fall
below the poverty line of US$1.90 a day,87 expressed as a
percentage of the poverty line. Simply put, the poverty gap
indicates how far away the poor are from escaping poverty
and can also be considered a very crude measure of the cost
of eliminating monetary poverty. The squared poverty gap
measures the severity of poverty by considering inequal-
ity among the poor. It is simply a weighted sum of poverty
gaps, where the weights are the proportionate poverty gaps
themselves.88
60. More than half of refugees in Kalobeyei are poor—
this is higher than the national rate, lower than the Tur-
kana County rate, and comparable to what is found in
the average of the 15 poorest counties in Kenya. Nearly
60 percent of refugees fall below the international poverty
line, versus 37 percent at the national level (p<0.001) and
72 percent at the Turkana County level (p<0.001). However,
when disaggregating by location in Turkana, 85 percent of
rural residents are poor, versus 51 percent of urban resi-
dents. Comparatively, the poverty rate among the 15 poorest
counties in Kenya is 59 percent (Figure 27). Of note, given
87 The international poverty line determines the threshold of being able to
purchase a fixed basket of goods that meets basic needs in a way that is
consistent across countries. 88 Foster et al. 1984; Haughton and Khandker 2009.
Kaloyebei was created less than five years ago and is popu-
lated by relatively new arrivals from South Sudan, the major-
ity of the refugee population still benefit from a large food
assistance subsidy through cash vouchers (Bamba Chakula).
Even with this support, the refugee community is on par
with the poverty level of the 15 poorest counties in Kenya.
Given resource constraints and competition from new emer-
gencies, it is likely that going forward this assistance will be
reduced, bringing into frame the extreme fragility for the ref-
ugee population, particularly women-headed households, in
the medium term.
61. The incidence and depth of poverty is greater among
refugees than among Kenyan nationals—yet Turkana
County residents are the poorest overall. The poverty
gap is higher for refugees than nationals, 22 percent ver-
sus 12 percent, but lower than the poverty gap of Turkana
residents (39 percent). Added to that, the poverty severity
among refugees is almost 10 percent, while for Turkana
residents it is 25 percent. The poverty gap can be used for
a rough estimation of the cost of household cash trans-
fers required to eliminate poverty. In this case, eradicating
poverty among refugees would require a daily transfer of
US$0.40 (2011 PPP) to each refugee (equivalent to around
US$12 a month), versus US$0.65 (2011 PPP) for the rest of
Turkana County (Figure 28). Based on these estimates, it
would cost almost US$3 million per year to eradicate pov-
erty for refugees and about US$191 million per year for the
host community.
FIGURE 27: Poverty headcount, international poverty line
58
37
59
72
0
20
40
60
80
100
National Poorest 15 counties Turkana County
Kalobeyei Kenya
Kalobeyei Kenya National
Kenya poorest 15 counties Kenya Turkana County
Source: Kalobeyei (2018); KIHBS (2015/16).
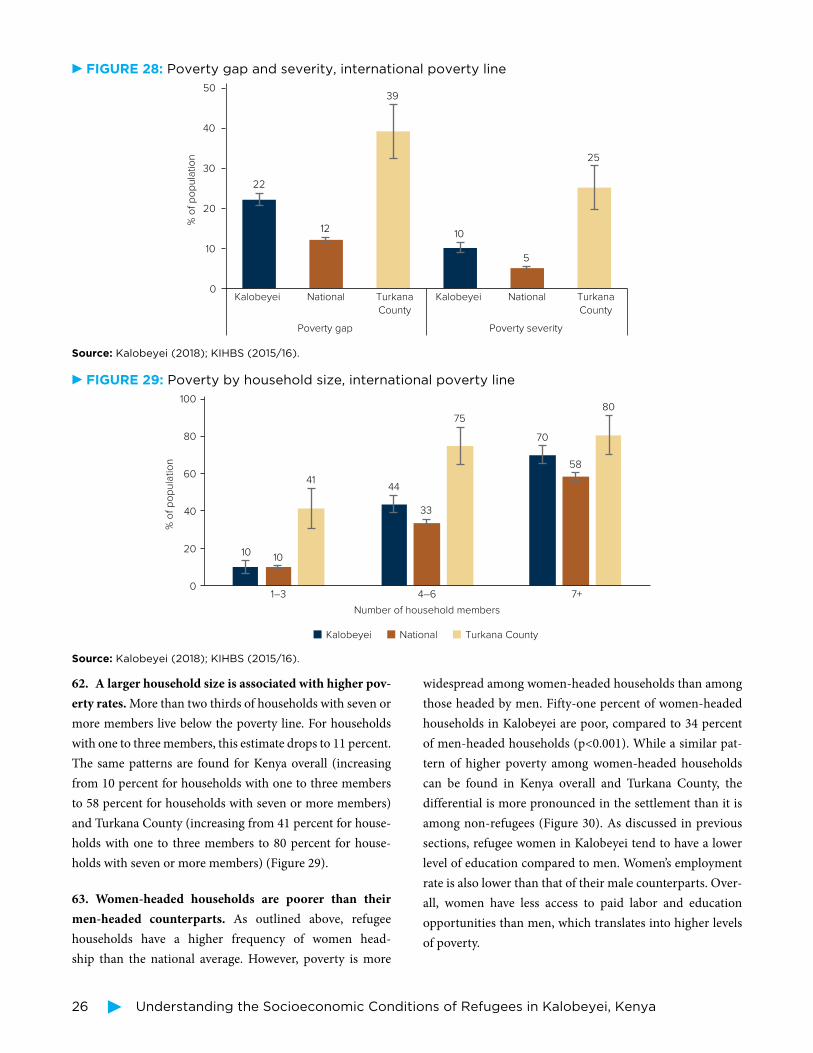
26 Understanding the Socioeconomic Conditions of Refugees in Kalobeyei, Kenya
62. A larger household size is associated with higher pov-
erty rates. More than two thirds of households with seven or
more members live below the poverty line. For households
with one to three members, this estimate drops to 11 percent.
The same patterns are found for Kenya overall (increasing
from 10 percent for households with one to three members
to 58 percent for households with seven or more members)
and Turkana County (increasing from 41 percent for house-
holds with one to three members to 80 percent for house-
holds with seven or more members) (Figure 29).
63. Women-headed households are poorer than their
men-headed counterparts. As outlined above, refugee
households have a higher frequency of women head-
ship than the national average. However, poverty is more
widespread among women-headed households than among
those headed by men. Fifty-one percent of women-headed
households in Kalobeyei are poor, compared to 34 percent
of men-headed households (p<0.001). While a similar pat-
tern of higher poverty among women-headed households
can be found in Kenya overall and Turkana County, the
differential is more pronounced in the settlement than it is
among non-refugees (Figure 30). As discussed in previous
sections, refugee women in Kalobeyei tend to have a lower
level of education compared to men. Women’s employment
rate is also lower than that of their male counterparts. Over-
all, women have less access to paid labor and education
opportunities than men, which translates into higher levels
of poverty.
FIGURE 28: Poverty gap and severity, international poverty line
22
12
39
10
5
25
0
10
20
30
40
50
Kalobeyei National Turkana
County
Kalobeyei National Turkana
County
Poverty gap Poverty severity
% o
f p
op
ula
tio
n
Source: Kalobeyei (2018); KIHBS (2015/16).
FIGURE 29: Poverty by household size, international poverty line
0
20
40
60
80
100
1–3
1010
4441
33
75
70
58
80
4–6
Number of household members
7+
% o
f p
op
ula
tio
n
Kalobeyei National Turkana County
Source: Kalobeyei (2018); KIHBS (2015/16).
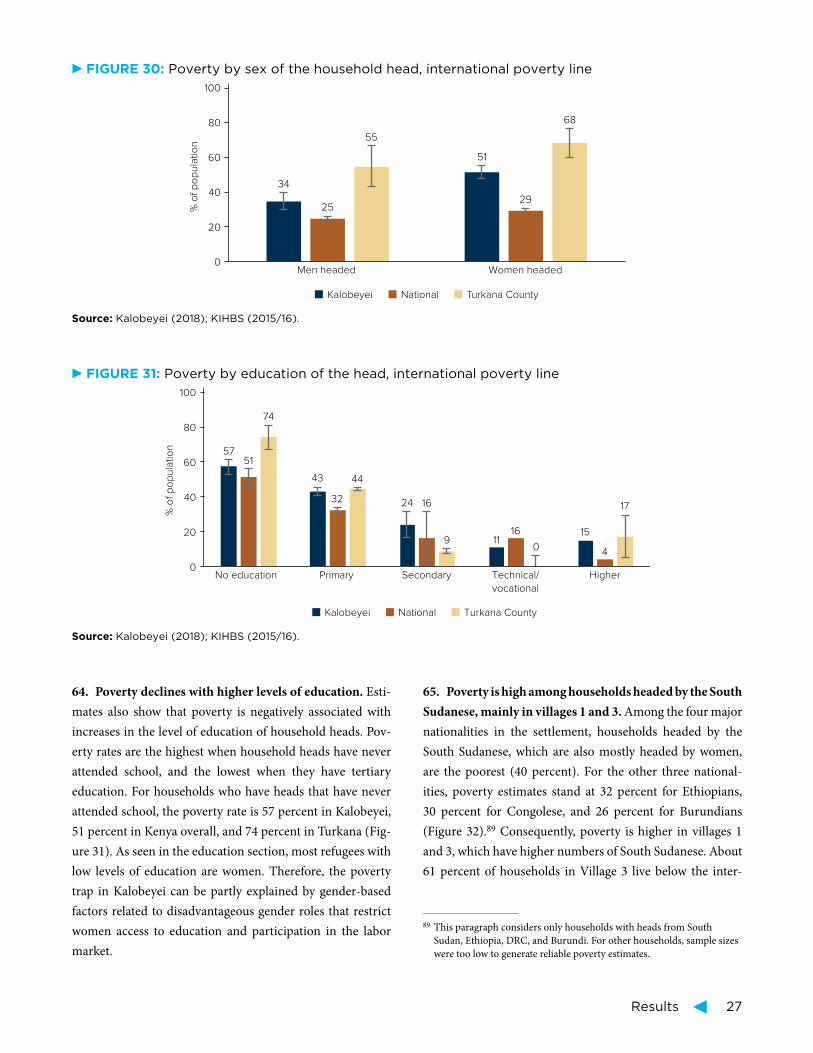
Results 27
64. Poverty declines with higher levels of education. Esti-
mates also show that poverty is negatively associated with
increases in the level of education of household heads. Pov-
erty rates are the highest when household heads have never
attended school, and the lowest when they have tertiary
education. For households who have heads that have never
attended school, the poverty rate is 57 percent in Kalobeyei,
51 percent in Kenya overall, and 74 percent in Turkana (Fig-
ure 31). As seen in the education section, most refugees with
low levels of education are women. Therefore, the poverty
trap in Kalobeyei can be partly explained by gender-based
factors related to disadvantageous gender roles that restrict
women access to education and participation in the labor
market.
65. Poverty is high among households headed by the South
Sudanese, mainly in villages 1 and 3. Among the four major
nationalities in the settlement, households headed by the
South Sudanese, which are also mostly headed by women,
are the poorest (40 percent). For the other three national-
ities, poverty estimates stand at 32 percent for Ethiopians,
30 percent for Congolese, and 26 percent for Burundians
(Figure 32).89 Consequently, poverty is higher in villages 1
and 3, which have higher numbers of South Sudanese. About
61 percent of households in Village 3 live below the inter-
89 This paragraph considers only households with heads from South
Sudan, Ethiopia, DRC, and Burundi. For other households, sample sizes
were too low to generate reliable poverty estimates.
FIGURE 30: Poverty by sex of the household head, international poverty line
0
20
40
60
80
100
Men headed Women headed
% o
f p
op
ula
tio
n
Kalobeyei National Turkana County
34
25
55
51
29
68
Source: Kalobeyei (2018); KIHBS (2015/16).
FIGURE 31: Poverty by education of the head, international poverty line
0
20
40
60
80
100
No education Primary Secondary Technical/
vocational
Higher
% o
f p
op
ula
tio
n
Kalobeyei National Turkana County
5751
74
43
32
44
24 16
9 1116
0
15
4
17
Source: Kalobeyei (2018); KIHBS (2015/16).
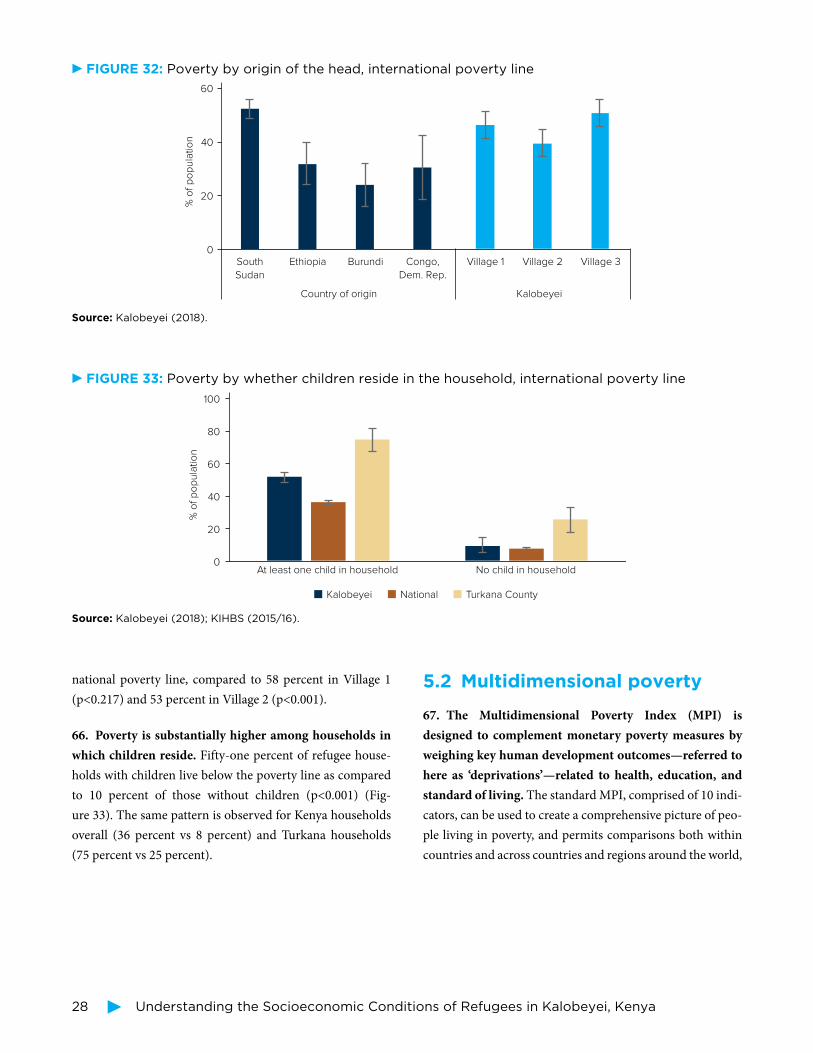
28 Understanding the Socioeconomic Conditions of Refugees in Kalobeyei, Kenya
national poverty line, compared to 58 percent in Village 1
(p<0.217) and 53 percent in Village 2 (p<0.001).
66. Poverty is substantially higher among households in
which children reside. Fifty-one percent of refugee house-
holds with children live below the poverty line as compared
to 10 percent of those without children (p<0.001) (Fig-
ure 33). The same pattern is observed for Kenya households
overall (36 percent vs 8 percent) and Turkana households
(75 percent vs 25 percent).
5 .2 Multidimensional poverty
67. The Multidimensional Poverty Index (MPI) is
designed to complement monetary poverty measures by
weighing key human development outcomes—referred to
here as ‘deprivations’—related to health, education, and
standard of living. The standard MPI, comprised of 10 indi-
cators, can be used to create a comprehensive picture of peo-
ple living in poverty, and permits comparisons both within
countries and across countries and regions around the world,
FIGURE 32: Poverty by origin of the head, international poverty line
0
20
40
60
South
Sudan
Ethiopia Burundi Congo,
Dem. Rep.
Village 1 Village 2 Village 3
Country of origin Kalobeyei
% o
f p
op
ula
tio
n
Source: Kalobeyei (2018).
FIGURE 33: Poverty by whether children reside in the household, international poverty line
0
20
40
60
80
100
At least one child in household No child in household
% o
f p
op
ula
tio
n
Kalobeyei National Turkana County
Source: Kalobeyei (2018); KIHBS (2015/16).
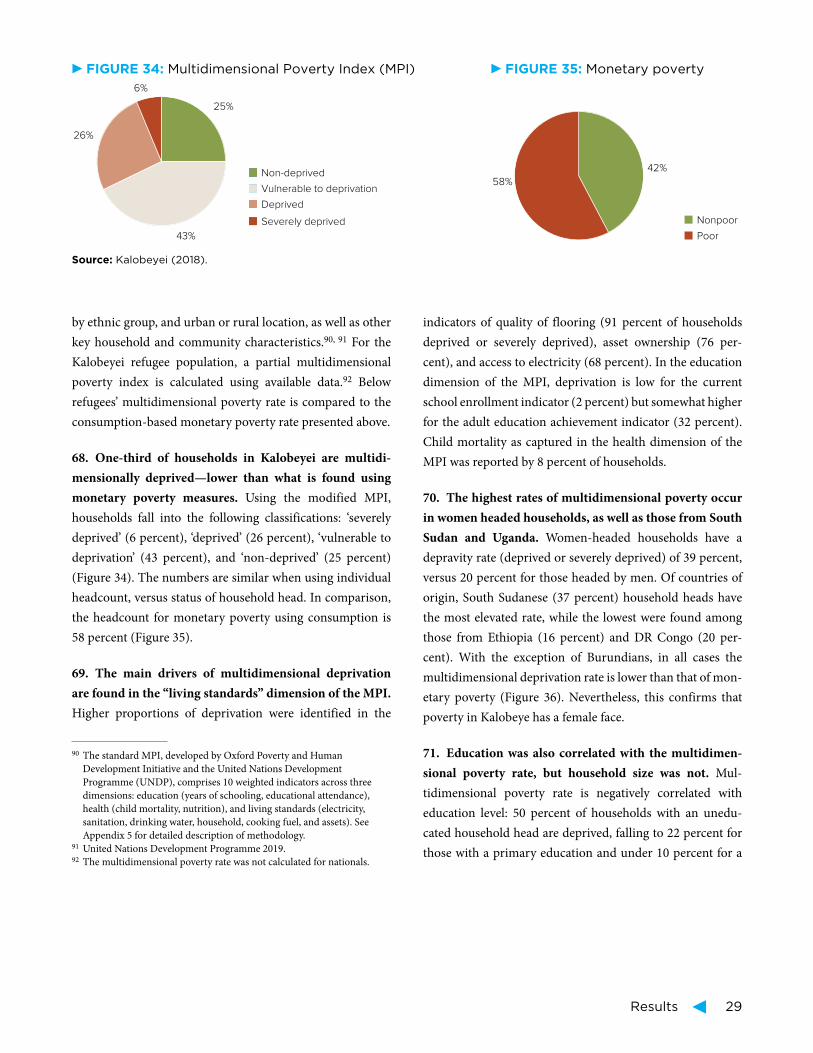
Results 29
by ethnic group, and urban or rural location, as well as other
key household and community characteristics.90, 91 For the
Kalobeyei refugee population, a partial multidimensional
poverty index is calculated using available data.92 Below
refugees’ multidimensional poverty rate is compared to the
consumption-based monetary poverty rate presented above.
68. One-third of households in Kalobeyei are multidi-
mensionally deprived—lower than what is found using
monetary poverty measures. Using the modified MPI,
households fall into the following classifications: ‘severely
deprived’ (6 percent), ‘deprived’ (26 percent), ‘vulnerable to
deprivation’ (43 percent), and ‘non-deprived’ (25 percent)
(Figure 34). The numbers are similar when using individual
headcount, versus status of household head. In comparison,
the headcount for monetary poverty using consumption is
58 percent (Figure 35).
69. The main drivers of multidimensional deprivation
are found in the “living standards” dimension of the MPI.
Higher proportions of deprivation were identified in the
90 The standard MPI, developed by Oxford Poverty and Human
Development Initiative and the United Nations Development
Programme (UNDP), comprises 10 weighted indicators across three
dimensions: education (years of schooling, educational attendance),
health (child mortality, nutrition), and living standards (electricity,
sanitation, drinking water, household, cooking fuel, and assets). See
Appendix 5 for detailed description of methodology. 91 United Nations Development Programme 2019.92 The multidimensional poverty rate was not calculated for nationals.
indicators of quality of flooring (91 percent of households
deprived or severely deprived), asset ownership (76 per-
cent), and access to electricity (68 percent). In the education
dimension of the MPI, deprivation is low for the current
school enrollment indicator (2 percent) but somewhat higher
for the adult education achievement indicator (32 percent).
Child mortality as captured in the health dimension of the
MPI was reported by 8 percent of households.
70. The highest rates of multidimensional poverty occur
in women headed households, as well as those from South
Sudan and Uganda. Women-headed households have a
depravity rate (deprived or severely deprived) of 39 percent,
versus 20 percent for those headed by men. Of countries of
origin, South Sudanese (37 percent) household heads have
the most elevated rate, while the lowest were found among
those from Ethiopia (16 percent) and DR Congo (20 per-
cent). With the exception of Burundians, in all cases the
multidimensional deprivation rate is lower than that of mon-
etary poverty (Figure 36). Nevertheless, this confirms that
poverty in Kalobeye has a female face.
71. Education was also correlated with the multidimen-
sional poverty rate, but household size was not. Mul-
tidimensional poverty rate is negatively correlated with
education level: 50 percent of households with an unedu-
cated household head are deprived, falling to 22 percent for
those with a primary education and under 10 percent for a
FIGURE 34: Multidimensional Poverty Index (MPI) FIGURE 35: Monetary poverty
25%
43%
26%
6%
Non-deprived
Vulnerable to deprivation
Deprived
Severely deprived
42%
58%
Nonpoor
Poor
Source: Kalobeyei (2018).
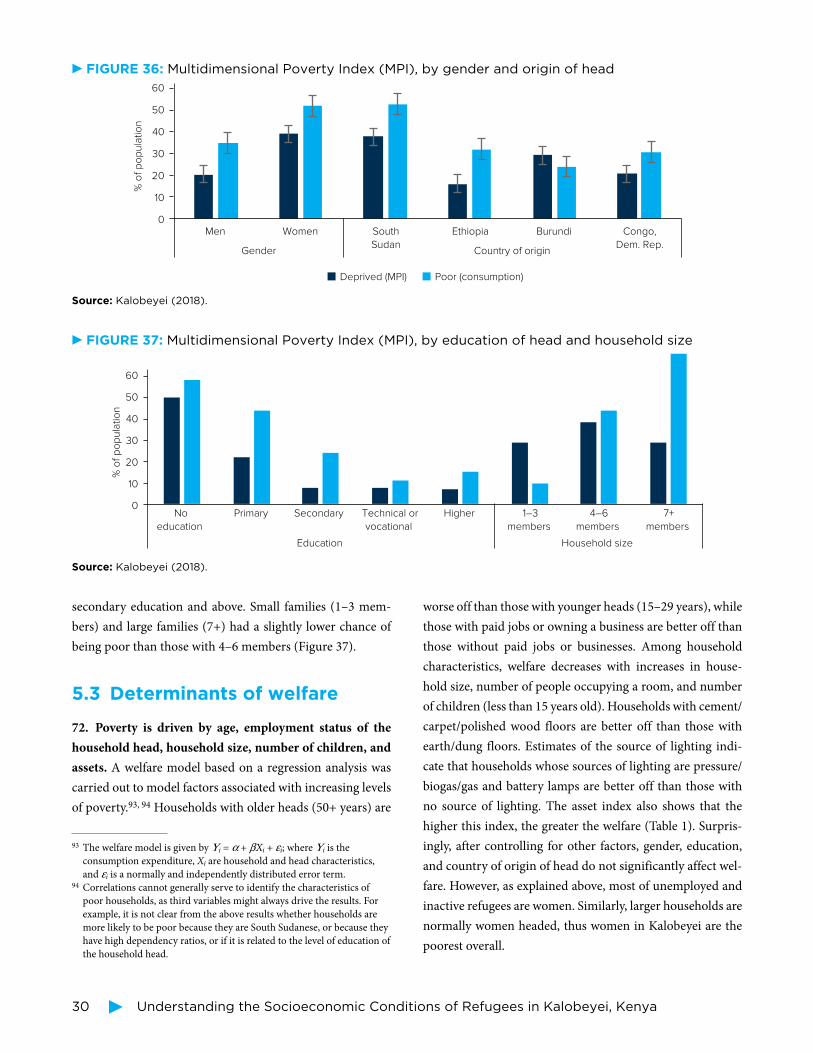
30 Understanding the Socioeconomic Conditions of Refugees in Kalobeyei, Kenya
secondary education and above. Small families (1–3 mem-
bers) and large families (7+) had a slightly lower chance of
being poor than those with 4–6 members (Figure 37).
5 .3 Determinants of welfare
72. Poverty is driven by age, employment status of the
household head, household size, number of children, and
assets. A welfare model based on a regression analysis was
carried out to model factors associated with increasing levels
of poverty.93, 94 Households with older heads (50+ years) are
93 The welfare model is given by Ui = a + bXi + ei; where Ui is the
consumption expenditure, Xi are household and head characteristics,
and ei is a normally and independently distributed error term.94 Correlations cannot generally serve to identify the characteristics of
poor households, as third variables might always drive the results. For
example, it is not clear from the above results whether households are
more likely to be poor because they are South Sudanese, or because they
have high dependency ratios, or if it is related to the level of education of
the household head.
worse off than those with younger heads (15–29 years), while
those with paid jobs or owning a business are better off than
those without paid jobs or businesses. Among household
characteristics, welfare decreases with increases in house-
hold size, number of people occupying a room, and number
of children (less than 15 years old). Households with cement/
carpet/ polished wood floors are better off than those with
earth/dung floors. Estimates of the source of lighting indi-
cate that households whose sources of lighting are pressure/
biogas/gas and battery lamps are better off than those with
no source of lighting. The asset index also shows that the
higher this index, the greater the welfare (Table 1). Surpris-
ingly, after controlling for other factors, gender, education,
and country of origin of head do not significantly affect wel-
fare. However, as explained above, most of unemployed and
inactive refugees are women. Similarly, larger households are
normally women headed, thus women in Kalobeyei are the
poorest overall.
FIGURE 37: Multidimensional Poverty Index (MPI), by education of head and household size
0
10
20
30
40
50
60
No
education
Primary Secondary Technical or
vocational
Higher 1–3
members
4–6
members
7+
members
Education Household size
% o
f p
op
ula
tio
n
Source: Kalobeyei (2018).
FIGURE 36: Multidimensional Poverty Index (MPI), by gender and origin of head
0
10
20
30
40
50
60
Men Women South
Sudan
Ethiopia Burundi Congo,
Dem. Rep.Gender Country of origin
% o
f p
op
ula
tio
n
Deprived (MPI) Poor (consumption)
Source: Kalobeyei (2018).
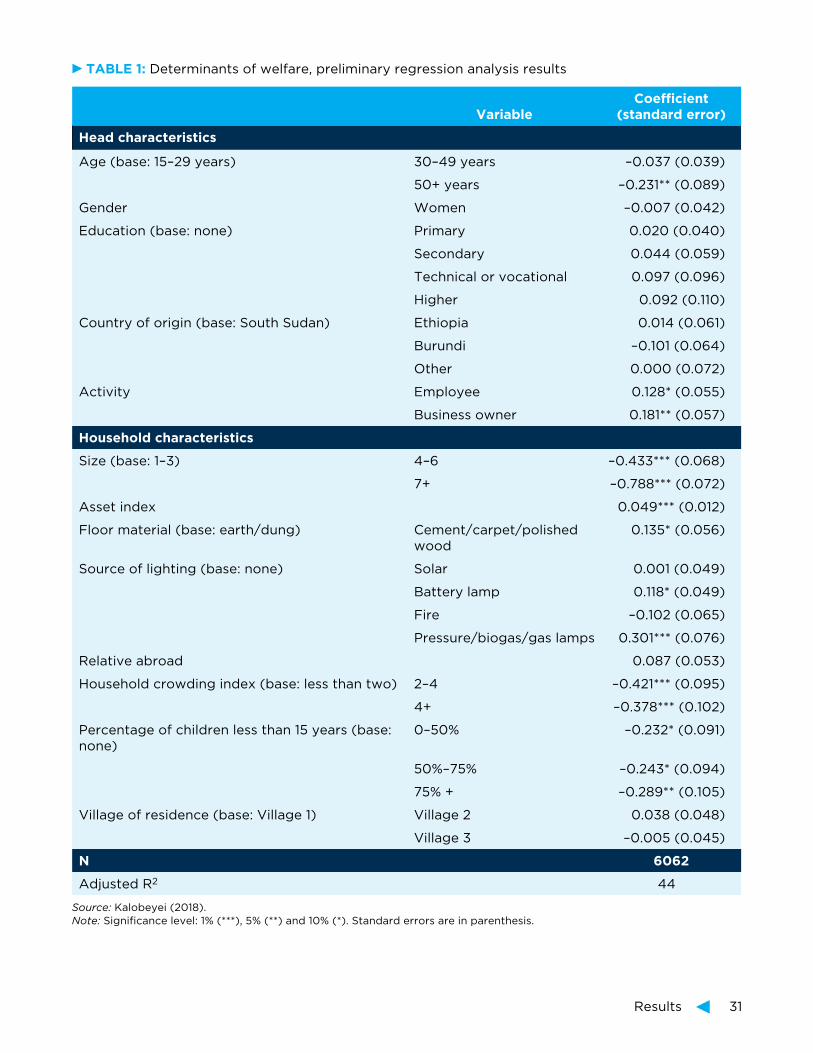
Results 31
TABLE 1: Determinants of welfare, preliminary regression analysis results
VariableCoefficient
(standard error)
Head characteristics
Age (base: 15–29 years) 30–49 years –0.037 (0.039)
50+ years –0.231** (0.089)
Gender Women –0.007 (0.042)
Education (base: none) Primary 0.020 (0.040)
Secondary 0.044 (0.059)
Technical or vocational 0.097 (0.096)
Higher 0.092 (0.110)
Country of origin (base: South Sudan) Ethiopia 0.014 (0.061)
Burundi –0.101 (0.064)
Other 0.000 (0.072)
Activity Employee 0.128* (0.055)
Business owner 0.181** (0.057)
Household characteristics
Size (base: 1–3) 4–6 –0.433*** (0.068)
7+ –0.788*** (0.072)
Asset index 0.049*** (0.012)
Floor material (base: earth/dung) Cement/carpet/polished wood
0.135* (0.056)
Source of lighting (base: none) Solar 0.001 (0.049)
Battery lamp 0.118* (0.049)
Fire –0.102 (0.065)
Pressure/biogas/gas lamps 0.301*** (0.076)
Relative abroad 0.087 (0.053)
Household crowding index (base: less than two) 2–4 –0.421*** (0.095)
4+ –0.378*** (0.102)
Percentage of children less than 15 years (base: none)
0–50% –0.232* (0.091)
50%–75% –0.243* (0.094)
75% + –0.289** (0.105)
Village of residence (base: Village 1) Village 2 0.038 (0.048)
Village 3 –0.005 (0.045)
N 6062
Adjusted R2 44
Source: Kalobeyei (2018).
Note: Significance level: 1% (***), 5% (**) and 10% (*). Standard errors are in parenthesis.
32 Understanding the Socioeconomic Conditions of Refugees in Kalobeyei, Kenya
5 .4 . Understanding refugee women’s socioeconomic limitations
95 From cooking and cleaning, to fetching water and firewood or taking care of children and the elderly, women carry out at least two-and-a-half times more
unpaid household and care work than men. As a result, they have less time to engage in paid labor, or work longer hours, combining paid and unpaid labor
(UN Women 2016).
Refugee women’s socioeconomic limitations
Overall, most refugee households in Kalobeyei are women headed, face poor living stan-
dards, and have low literacy and labor force participation rates . The SEP findings demon-
strate that living conditions for refugees in Kalobeyei vary according to sex and gender-based
norms. Such variation translates into a series of disadvantaged living conditions for women
that exacerbate their already complex situation, creating a matrix of intersecting vulner-
abilities. Despite being most of the refugee population in Kalobeyei, women face higher
poverty levels; lower access to basic services such as water, sanitation, and education; and
tend to have a lower labor force participation rate. South Sudanese households which are
mostly headed by women (77 percent) are the worse off among refugees in Kalobeyei. In
fact, 52 percent of the poor in Kalobeyei are South Sudanese. A closer examination of the
employment and education findings provides possible explanations for this trend:
1. Education. Refugee women and girls have lower literacy rates and lower gross and net
enrollment rates than men and boys. Likewise, less women can speak English and Swa-
hili than men. Literacy is associated with higher levels of education and socioeconomic
standing, while skill with an official language of Kenya may help facilitate commercial
opportunities. Following this, the lower literacy rates among women correlate with low
levels of access to education and can potentially imply a barrier to seeking local employ-
ment opportunities. Lower literacy rates and access to education for women and girls
may be explained by gender-based norms that prioritize male education and restrict
women from developing non- domestic–related skills. With some differences across cul-
tures, women are usually not expected to work on a paid basis and thus ‘do not need
to study to get a job’ since they are to be economically dependent on a male partner or
spouse, take care of family members, and carry out unpaid household and care work.95
2. Employment. Refugee women in Kalobeyei have lower labor force participation rates
and are more likely to be inactive due to ‘family responsibilities’—which include domes-
tic and care work—than men. Furthermore, more women than men reported to not
have looked for a job because they were not able to find an activity in which their abil-
ities were required. These findings reflect that on the one hand, women are overbur-
dened with ‘family responsibilities’ that prevent them from looking for paid jobs. On the
other hand, the survey findings show that some refugee women have not developed the
required skills to be able to participate in the labor market (due to restrictions to educa-
tion) (Figure 38). Thus, women are prevented from looking for a paid job because they
are devoting their time to nonpaid, caring labor activities while men are busy in full-time
education where they can develop useful skills that can translate into paid jobs in the
BOX
2

Results 33
future. Considering that many refugee women—especially from South Sudan—migrate
without a male partner or spouse, refugee women are facing new responsibilities that
involve shifting gender roles. Refugee women need to engage in paid labor activities—
possibly for the first time—and undertake jobs for which they may not necessarily have
the needed skills. Migration (forced and voluntary) largely permeates trajectories of
women economic empowerment (WEE). While in some cases migration may bring
opportunities for WEE due to exposure to new social norms, it can also limit WEE due
to an increased risk of violence or disadvantageous gender-based norms. The case of
South Sudanese women in Kalobeyei is an example of forced migrant women that face
new living experiences in which they need to work for pay and undertake jobs for which
they may not necessarily have the needed skills. In consequence they remain inactive
and thus, reliant on aid.
FIGURE 38: Factors limiting refugee women socioeconomic potential
Gender-based
norms and
roles
Lack of job
skills
Low labor
force
participation
Restricted
access to
education
Locked
potential
Therefore, gender-responsive policies and programs need to take into consideration socio-
cultural norms and practices that prevent WEE and limit women opportunities for socio-
economic growth. Furthermore, gender-responsive programs need to be developed in a
participatory manner, assessing the needs of the target population by including them into
the program design process.
34
Conclusions
and Recommendations
73. Data collection, analysis, and dissemination are cru-
cial to inform targeted policies and to meet the objec-
tives of the Global Compact on Refugees. With the rise in
forced displacement worldwide, efforts have been made to
understand and tackle its causes and consequences. Such
efforts include the creation of standardized frameworks for
collecting data to track the status and welfare of displaced
people—but less often to track effects of displaced groups
on host communities. These contributions have produced
useful analytical outputs. However, several data limitations
prevent an accurate assessment of socioeconomic conditions
among displaced people and hosts, which hinders efforts to
design targeted policy interventions. Micro-data collection
through household surveys, as carried out for refugees in the
Kalobeyei settlement, can contribute to filling socioeconomic
data gaps while supporting the objectives of the Global Com-
pact on Refugees. Therefore, it is recommended to develop
and strengthen international policy frameworks that pro-
mote the implementation of household surveys in displace-
ment contexts to understand the living conditions and needs
of displaced and host populations to correctly inform tar-
geted policies and programs. Such efforts can be instrumen-
tal in strengthening the humanitarian- development nexus to
find durable solutions for forced displacement.
74. Systematically including refugees into national sur-
veys can contribute to filling socioeconomic data gaps on
internationally displaced populations. Kenya has shown
progress in data availability at the national and county levels
and made efforts to measure the impacts of forced displace-
ment. However, socioeconomic data to compare poverty and
vulnerability levels between refugees, host communities,
and nationals remain scarce. Refugees are not systematically
included in national surveys that serve as the primary tools
for measuring and monitoring poverty, labor markets, and
other welfare indicators at the country level. Including them
can contribute to filling socioeconomic data gaps on interna-
tional displacement, while providing crucial inputs to inform
targeted responses, policies, and programs for refugees and
host communities. Particularly, increasing panel data across
refugee and host communities would provide a rich learn-
ing to assess how welfare and social cohesion trends change
over time. Investigating this hypothesis and others under-
lines our earlier point, for the need for panel data to monitor
changes of the same household over times of war and forced
displacement.
75. Going beyond socioeconomic data with a focus on the
displacement trajectory can further enhance the design
of solutions for displacement. Socioeconomic surveys
are essential to understand the current living conditions of
households to inform policies, for example, on labor mar-
kets and safety nets as well as health and education. However,
they do not consider the specific displacement trajectory of
displaced households, which are not only affected by a trau-
matic episode at the event of displacement, but often con-
tinue to have specific displacement-related vulnerabilities.
It is critical to understand these vulnerabilities and how
they need to be addressed to work toward ending displace-
ment. It is recommended that a forcibly displaced module
be developed to serve as a tool for existing surveys, includ-
ing national surveys that measure poverty, Living Standards
Measurement Surveys, and beyond. A standardized forced
displacement module that measures the particular vulnera-
bilities faced by refugees and other forcibly displaced persons
is essential to complete the picture needed for informing
optimal programming and policy. A newly developed frame-
work by the World Bank has been administered to displaced
populations in Ethiopia, Nigeria, Somalia, South Sudan, and
Sudan—and should be considered for future data collection
of displaced populations in Kenya.96
96 Pape and Sharma. 2019. Informing Durable Solutions for Internal
Displacement in Nigeria, Somalia, South Sudan, and Sudan.
Conclusions and Recommendations 35
76. Access to improved sanitation must be further
enhanced among the refugee and host populations.
While 65 percent of Turkana residents do not have access to
improved sanitation, almost half of the refugees in Kalobeyei
face the same situation. Lack of access to improved sanita-
tion involves overcrowding in toilet use, which reduces living
standards, contributes to the spread of communicable dis-
eases, and increases the threat of being a victim of gender-
based violence (GBV)—especially for women and girls.
Policy efforts must continue to promote access to improved
sanitation facilities for hosts and refugees. Interventions to
improve access to sanitation facilities could build on ongoing
work to provide training on building latrines, accompanied
with the provision of building materials, as well as the use of
innovative technological solutions. Added to that, awareness
raising campaigns on the risks of poor sanitation for hosts
and refugees could help overcome risks associated with lack
of access to improved sanitation. Overall, substantial invest-
ment is needed to enhance inclusive delivery of services for
hosts and refugees, as well as to improve the quality of the
delivered services. Investment in basic services has a direct
impact on human capital accumulation, economic growth
rates, and poverty reduction.
77. Building and maintaining human capital in the ref-
ugee population—especially among girls and women—
needs to be prioritized. The refugee population is younger
than non-displaced populations in Kenya. Moreover, the
young refugee and Turkana host populations have lower
access to education than nonhost nationals. The large num-
ber of young people—refugees and host communities—has
implications for the need for basic services today, as well as
economic opportunities in the future. Human capital is a
critical factor fueling economic growth at the macro level but
also creating sustainable individual livelihoods that require
urgent investment, especially in education and health, the
building blocks for economic activity.97 Improving the avail-
ability and quality of service delivery for refugees and the
host community is a recognized goal of KISEDP, as well as
the social pillar of the Kenya national development strategy,
Vision 2030. Despite improvements, access to basic services
remains a challenge in Turkana County, the consequences
97 World Bank Group 2019.
for which are magnified by the large share of a young pop-
ulation. Specifically, policy interventions must prioritize
and maintain human capital by improving living condi-
tions and access to education for young refugees. Coupled
with the protection and support to maintain human capital,
policy efforts for displaced populations must incorporate a
gender-responsive approach that addresses the needs and
vulnerabilities of refugee women and girls, especially with
regards to domestic and care work, and risk to GBV and dis-
crimination in educational and work environments. Further-
more, a systematic use of existing good practices to closing
gender gaps and enhancing the agency of women and girls
would increase the scope and impact of operations in con-
texts of forced displacement.98
78. Promoting self-reliant agricultural interventions can
avoid food insecurity. While 43 percent of households are
food secure,99 27 percent are “under stress,” 15 percent are
in “crisis,” and 17 percent are in “emergency.” Policies and
programs need to promote self-reliance interventions to
overcome food insecurity; firstly, by ensuring that no ref-
ugee (nor host) lives under stress, crisis, or emergency due
to lack of food, and secondly, by assessing the needs, skills,
and resources in refugee and host populations to promote
sustainable practices to achieve food security. Food secu-
rity interventions could include access to land for agricul-
tural activities, subsidies on farm inputs, access to credit
and cash transfers for farming, and development of rural
agricultural markets and agribusiness skills. The imple-
mentation of food security interventions needs to promote
partnerships between (national and international) organi-
zations in the field and the Government National Cereals
and Produce Board (NCPB) and other relevant government
institutions. While food security has been improved through
the Bamba Chakula program and partners interventions,
further investment and targeted interventions are needed to
overcome high levels of food insecurity. In addition to this,
future assessments can benefit from comparing Kalobeyei
and Kakuma levels of food security to identify which model
(camp vs settlement) brings more durable impacts and leads
to sustainable solutions.
98 The Gender Group 2019.99 Meaning that in the last thirty days, no strategy was employed to deal
with a lack of food or money to buy food.
36 Understanding the Socioeconomic Conditions of Refugees in Kalobeyei, Kenya
79. Joint programs for refugees and host populations
can further improve social cohesion. Overall, 8 in 10 refu-
gees report feeling that neighbors are generally trustworthy.
Meanwhile, 3 in 4 believe that they are able to express their
opinions within the existing community leadership struc-
ture, and 2 in 3 perceive that their opinions are being taken
into consideration for decisions that regard their well- being.
In terms of social cohesion between refugees and hosts,
50 percent of refugee households reported interacting with a
member of the host community in the past week, and more
than 60 percent of refugees feel safe visiting a neighboring
town alone. Around 50 percent agree that host community
members are generally trustworthy. Similarly, around 50 per-
cent would feel comfortable with their child socializing with
members of the host community. To continue to promote
greater social cohesion and generate opportunities for socio-
economic integration outside of camps, policy interventions
should facilitate the implementation of social cohesion pro-
grams that promote interaction between refugees and hosts
to (a) deconstruct myths about hosts or refugees, (b) pro-
mote intercultural exchange, and (c) stimulate the creation
of partnerships and collective businesses co-led by refugees
and hosts. In addition, programs that improve livelihoods
and access to services should be designed to include host
communities.
80. Gender-responsive policies and programs need to be
implemented to address gender-based stereotypical barriers
that prevent women from finding sustainable livelihoods and
fully participate in the labor force. It is urgent to support ref-
ugee women and ensure they have enabling conditions to par-
ticipate in the labor force. This involves having time to devote
to paid activities—and not only caring and domestic nonpaid
work in the household. Interventions could include business
skills development programs, cash transfer interventions, lit-
eracy programs for women, and gender stereotypes awareness
programs that promote shared responsibility of caring labor
(between men and women) and sensitize communities regard-
ing the positive impacts of supporting women participation in
the labor market. It is important to shift gender- stereotypical
perspectives and address vulnerabilities derived from over-
burdening women and girls with ‘family responsibilities’ that
should be shared by both men and women. Furthermore,
focusing on enhancing access to financial services for women
can help close gender gaps and contribute to women economic
empowerment efforts by enabling women to gain control over
spending decisions within the household.
81. Increasing work opportunities and business condu-
cive environments for the refugee and host populations
can help reduce aid dependence, improve livelihoods, and
support self-reliance. In Kalobeyei, due to the large propor-
tion of children and young people, only 39 percent of the
population are of working age (15–64 years), versus 55 per-
cent in Kenya as a whole and 46 percent in Turkana County.
Even among those of working age, labor force participation
rates are low. Only 37 percent of the working-age population
are classified as employed, while the majority—59 percent—
are considered ‘inactive’, a classification which includes car-
ing for household members and students. In order to tackle
this, policy and programmatic efforts must promote and
ensure: (a) agile processes to provide work permits for ref-
ugee populations, (b) support of entrepreneurial activities
through business and managerial skills development pro-
grams, (c) market system analyses to identify the sectors in
Turkana West that can maximize job and income generation,
coupled with vocational training to assure market-driven
skills development, and job-matching, (d) access to land
to promote the utilization and development of agricultural
skills, and (e) partnerships with the private sector to promote
investing in refugee-led businesses and create employment
opportunities in the area100 for refugees and hosts.
100 An example of this is the IFC investment climate program, as well as
the Huduma-Biashara One-Shop-Stop programs, which have been
approved and will be tolled out in 2020.
37
References
Beegle, Kathleen, Joachim de Weerdt, Jed
Friedman, and John Gibson. 2012. “Methods
of Household Consumption Measurement
through Surveys: Experimental Results from
Tanzania.” Journal of Development Econom-
ics 3–18.
Betts, Alex, Remco Geervliet, and Claire
MacPherson. 2018. Self-Reliance in Kalobeyei?
Socio-Economic Outcomes for Refugees in
North-West Kenya. Oxford: Refugee Studies
Center.
Deaton, Angus, and S. Zaidi. 2002. Guidelines
for Constructing Consumption Aggregates
for Welfare Analysis. Washington DC: World
Bank.
Department of Water Agriculture and Irrigation,
Turkana County Government. 2017. Turkana
County Water, Sanitation Services Sector
Strategic Plan 2017–2021. Turkana County
Government.
El-Zoghbi Mayada, Nadine Chehade, Peter
McConaghy, and Matthew Soursourian. 2017.
The Role of Financial Services in Humani-
tarian Crises. https://www.cgap.org/sites/
default/files/researches/documents/Forum-
The-Role-of-Financial-Services-in-Humanitarian-
Crises_1.pdf.
Foster, J., Greer, J., and Thorbecke, E. 1984. “A
Class of Decomposable Poverty Measures.”
Econometrica 781.
Garlick, M., Guild, E., Proctor, C., and Salomons, M.
2015. Building on the foundation: formative
evaluation of the refugee status determination
(RSD). UNHCR.
Haughton, J., and Khandker, S. 2009. Handbook
on Poverty and Inequality. Washington DC:
World Bank.
Institute for Health Metrics and Evaluation
(IHME). 2017. Global Burden of Disease Study.
Seattle: IHME.
Kabir, Raiyan, and Jeni Klugman. 2019. Unlock-
ing Refugee Women’s Potential. Closing Eco-
nomic Gaps to Benefit All. International Rescue
Committee.
Kaplan, Lennart, Utz Johann Pape, and James
Walsh. April 2018. “Eliciting Accurate
Responses to Consumption Questions among
IDPs in South Sudan Using ‘Honesty Primes’.”
World Bank Group, Working Paper, 8539.
Kenya Agricultural Research Institute. 2012.
“Food Security Report.” Food Secu-
rity Portal. Accessed 2019. http://www
.foodsecurityportal.org/kenya/food-security-
report-prepared-kenya-agricultural-research-
institute.
Kenya National Bureau of Statistics. 2015. County
Statistical Abstract. Turkana County. Kenya
National Burau of Statistics.
Kenya National Bureau of Statistics. 2018. Basic
Report on Well-Being in Kenya. Nairobi: KNBS.
Kenya National Bureau of Statistics. 2018. Basic
Report: 2015/16 Kenya Integrated Household
Budget Survey. Nairobi: KNBS.
Kenya National Bureau of Statistics. 2018. Labour
Force Basic Report. Nairobi: KNBS.
Kilic, Talip, and Thomas Sohnesen. 2019. “Same
Question but Different Answer: Experimental
Evidence on Questionnaire Design’s Impact
on Poverty Measured by Proxies.” Review of
Income and Wealth 144–65.
Maxwell, Daniel, and Richard Caldwell. 2008. The
Coping Strategies Index. A tool for rapid mea-
surement of household food security and the
impact of food aid programs in humanitarian
emergencies. CARE.
38 Understanding the Socioeconomic Conditions of Refugees in Kalobeyei, Kenya
Ministry of Interior and Coordination of National
Government. 2017. Identification Documents.
https://perma.cc/4UDM-BJGB.
National Council for Law Reporting. 2010. Con-
stitution of Kenya. Nairobi: National Council
for Law Reporting with the Authority of the
Attorney-General. http://kenyalaw.org:8181/
exist/kenyalex/actview.xql?actid=Const2010.
O’Callaghan, and Sturge. 2018. Against the odds:
refugee integration in Kenya. Humanitarian
Policy Group.
Pape, Utz, and Ambika Sharma. 2019. Informing
Durable Solutions for Internal Displacement
In Nigeria, Somalia, South Sudan, and Sudan.
Washington DC: World Bank Group.
Pape, Utz, and Johan Mistiaen. 2018. “Household
Expenditure and Poverty Measures in 60 Min-
utes: A New Approach with Results from Mog-
adishu.” Working Paper.
Refugee Affairs Secretariat. 2019. Background/A
brief history. Nairobi: State Department of
Immigration and Citizen Services.
Refugee Consortium of Kenya. 2012. “Asylum
under threat: assessing the protection of
Somali refugees in Dadaab refugee camps and
along the migration corridor.” Accessed 2019.
https://reliefweb.int/sites/reliefweb.int/files/
resources/Asylum_Under_Threat.pdf.
Sanghi, Apurva, Harun Onder, and Varalakshmi
Vemuru. 2016. Yes in my backyard? The eco-
nomics of refugees and their social dynamics
in Kakuma, Kenya. Washington DC: World
Bank Group.
Schuettler, Kirsten. 2017. Refugees’ right to work:
Necessary but insufficient for formal employ-
ment of refugees. World Bank.
The Gender Group, The World Bank Group. 2019.
“Addressing the Needs of Women and Girls
in Contexts of Forced Displacement:
Experiences from Operations.” http://
documents.worldbank.org/curated/en/
138521556825963608/Addressing-the-
Needs-of-Women-and-Girls-in-Contexts-of-
Forced-Displacement-Experiences-from-
Operations.
Turkana County Government. 2019. County
Integrated Development Plan. Tur-
kana County Government. https://www
.turkana.go.ke/wp-content/uploads/2019/10/
Turkana_CIDP_Book_POPULAR_V3.pdf.
UN Women. 2016. “Redistribute unpaid work.”
https://www.unwomen.org/en/news/in-
focus/csw61/redistribute-unpaid-work.
UNHCR, The United Nations High Commis-
sioner for Refugees. 2005. Handbook for
Self- reliance. Geneva: United Nations High
Commissioner for Refugees (UNHCR).
UNHCR-DRC. 2012. Living on the Edge. A Live-
lihood Status Report on Urban Refugees Liv-
ing in Nairobi, Kenya. United Nations High
Commissioner for Refugees, Danish Refugee
Council.
UNHCR-WFP. 2018. Joint principles for target-
ing assistance to meet food and other basic
needs to persons of concern. World Food
Programme.
United Nations. 2018. Global Compact on Refu-
gees. New York: United Nations.
United Nations Development Programme. 2019.
Frequently Asked Questions—Multidimensional
Poverty Index (MPI). http://hdr.undp.org/
en/faq-page/multidimensional-poverty-
index-mpi#t295n2957.
United Nations High Commissioner for Refu-
gees. 2003. Implementing Registration within
an Identity Management Framework. Geneva:
UNHCR.
———. 2017. Kakuma Integrated Livelihoods Strat-
egy 2017–2019.
United Nations High Commissioner for Refugees.
2018. Kalobeyei Integrated Socio-Economic
Development Plan for Turkana West (KISEDP).
Nairobi: UNHCR.
United Nations High Commissioner for Refu-
gees. 2019a. Kenya Figures at a Glance. May.
https://www.unhcr.org/ke/figures-at-a-
glance.
———. 2019b. How business incubators can facili-
tate refugee entrepreneurship and integration.
https://www.unhcr.org/innovation/how-
References 39
we-can-use-business-incubators-for-refugee-
integration/.
———. 2019c. KISEDP Progress Report. January
2018–June 2019. UNHCR.
———. 2019d. Refugee Status Determination.
https://www.unhcr.org/ke/refugee-status-
determination.
———. 2019e. Refugee Status Determination.
https://www.unhcr.org/refugee-status-
determination.html.
United States African Development Founda-
tion. 2017. In Kenya, supporting Turkana
to move from food aid to self-sufficiency.
Accessed 2019. https://reliefweb.int/report/
kenya/kenya-supporting-turkana-move-food-
aid-self-sufficiency.
WaterAid. 2013. We can’t wait: A report on san-
itation and hygiene for women and girls. Lon-
don: WaterAid.
World Bank. 2018a. Kakuma as a marketplace: a
consumer and market study of a refugee camp
and town in northwest Kenya. Washington DC:
World Bank Group.
———. 2018b. Kenya Poverty and Gender Assess-
ment 2015–2016: Reflecting on a Decade of
Progress and the Road Ahead. Washington
DC: World Bank Group.
———. 2019. Migration and Remittances: Recent
Developments and Outlook. Washington DC:
World Bank Group.
World Bank Group. 2017a. Forcibly Displaced:
Toward a Development Approach Supporting
Refugees, the Internally Displaced, and Their
Hosts. The World Bank Group.
———. 2017b. The Impact of Conflict and Shocks
on Poverty: South Sudan Poverty Assessment
2017. Washington DC: World Bank Group.
———. 2019. World Development Report 2019:
The Changing Nature. Washington DC: World
Bank Group.
World Bank Group-UNHCR. 2016. Yes in My Back-
yard? The Economics of Refugees and Their
Social Dynamics in Kakuma, Kenya. UNHCR,
World Bank Group.
World Health Organization. 2019. Water sanita-
tion hygiene. What are the health risks related
to overcrowding? World Health Organization.
Zetter and Ruaudel. 2017. “Kenya profile,
KNOMAD refugees’ right to work and access
to labor markets: an assessment, Kenya coun-
try case study.”
Zetter, Roger, and Héloïse Ruaudel. 2016.
KNOMAD Study. Refugees’ Right to Work and
Access to Labor Markets—An Assessment.
KNOMAD. Global Knowledge Partnership on
Migration and Development.
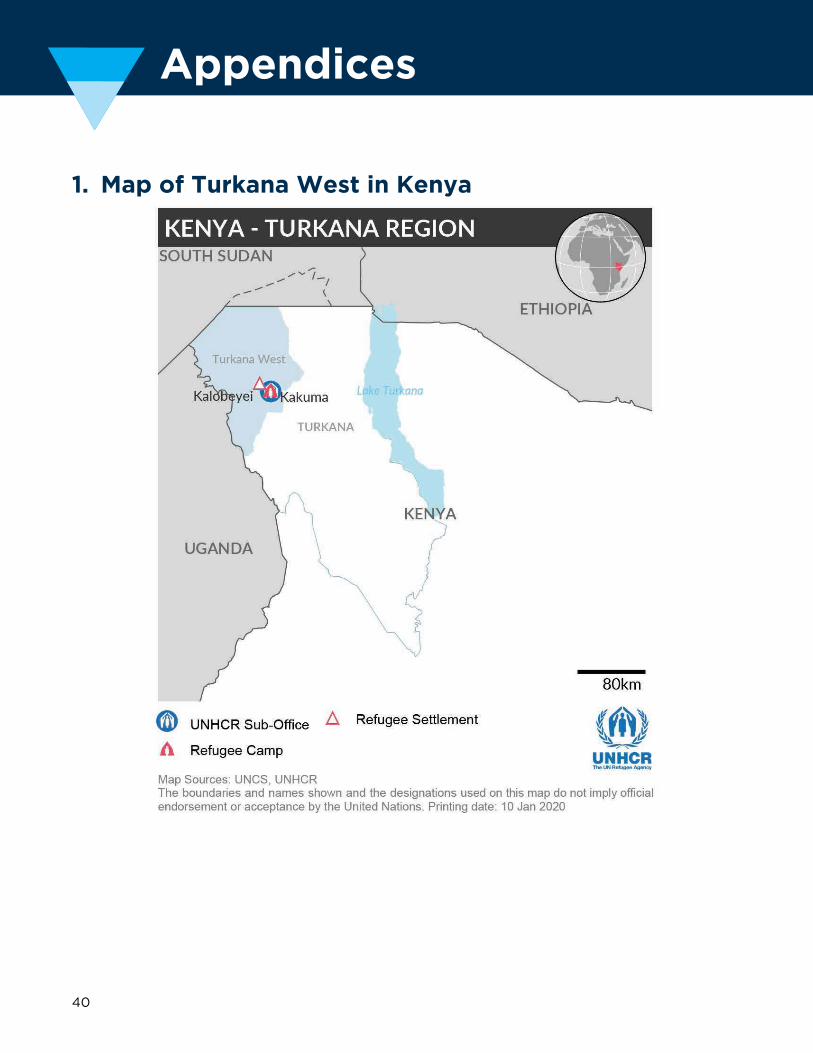
40
Appendices
1 . Map of Turkana West in Kenya
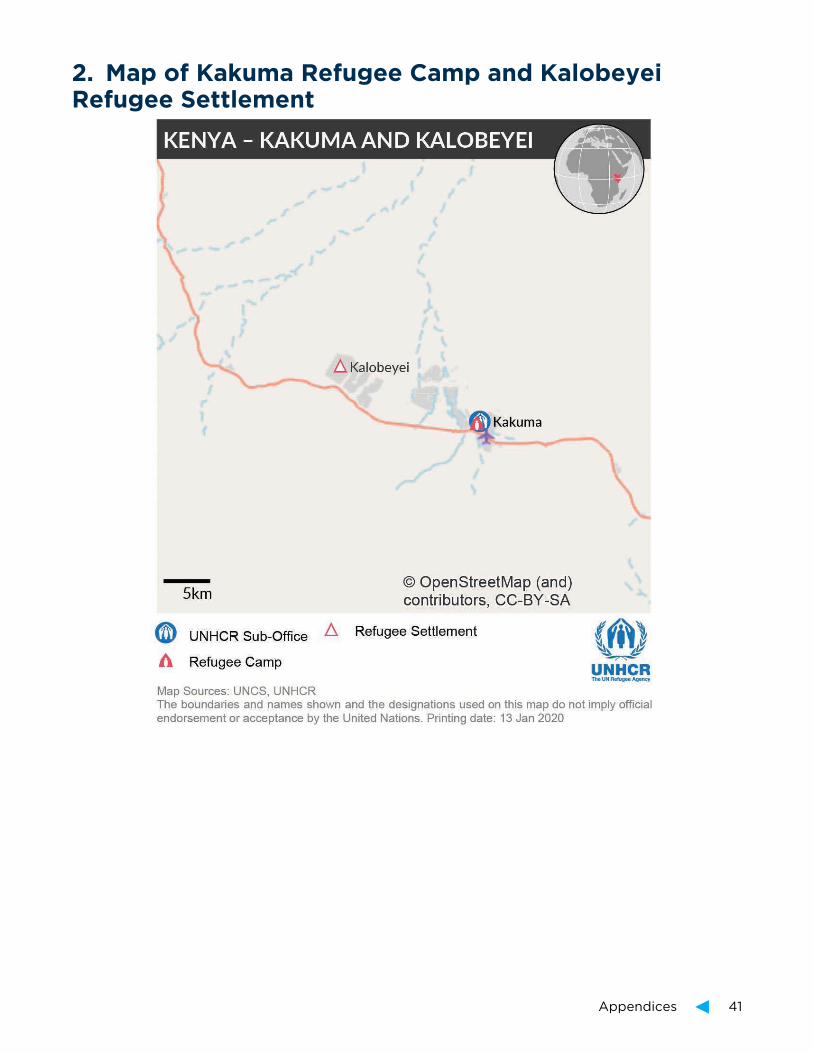
Appendices 41
2 . Map of Kakuma Refugee Camp and Kalobeyei Refugee Settlement

42 Understanding the Socioeconomic Conditions of Refugees in Kalobeyei, Kenya
3 . Identification Documents
Type of document
Purpose of document
Information included
Document holder Validity
Place of issue and authority
DRA asylum pass
To confirm that person/s is accepted as an asylum seeker
Names of all members on a case, photos of each person, age, family relationship
The principal applicant
6 months DRA Shauri Moyo, Kakuma, Dadaab, Mombasa, Nakuru, Eldoret
Notification of recognition
This document is issued to all refugees recognized after July 1, 2014. The document confirms recognition of refugee status. It is intended to document the refugee status of the individual while the refugee awaits the issuance of the Refugee ID card. It can be used to access all services
File number, photo, name, nationality, and DOB. Indicates that holder and dependents are persons of concern to UNHCR
The principal applicant and all dependents over 16 years
1 year DRA Lavington. Issued jointly by DRA-UNHCR
Mandate Refugee Certificate (MRC)
This document is issued to all refugees recognized before July 1, 2014. Document confirms recognition of refugee status. Can be used to access all services
File number, photo, name, nationality, and DOB and validity of document
The principal applicant and all dependents over 16 years
2 years. Renewable by UNHCR until further notice
First issuance of by UNHCR, RSD Unit. Renewal is undertaken by UNHCR, Protection Delivery Unit
Refugee ID card
Photo, fingerprints, and name
5 years DRA
UN Convention Travel Document (UNCTD)
Traveling outside Kenya
— Applicant — DRA in collaboration with UNHCR
Source: Ministry of Interior and Coordination of National Government 2017.

Appendices 43
4 . Detailed Overview of the Methodology
Design
81. The household definition is aligned with what is
used by the Kenya National Bureau of Statistics (KNBS)
and was adapted to the refugee context. According to the
KNBS 2015/16 Kenya Integrated Household Budget Survey
(KIHBS), households are groups of people who are living
together, have a common household head, and share “a com-
mon source of food and/or income as a single unit in the
sense that they have common housekeeping arrangements
[. . . .]” Based on the KNBS definition of a household, as well
as with the feedback from the field testing carried out before
the data collection, the household definition adopted for this
survey is “a set of related or unrelated people (either sharing
the same dwelling or not) who pool ration cards and regularly
cook and eat together.”101 The UNHCR definition of family
was not used as a definition of a household. The definition
of a UNHCR family was not used for this assessment since
it serves for registration processes as well as for allocation of
assistance and resettlement. Additionally, in practice, refu-
gees may or may not live with their registration unit—or they
may share resources across units. To ensure that the results
are comparable to national surveys, the SEP was designed to
allow merging and splitting of UNHCR registration units to
align with the Kenya National Bureau of Statistics household
definition.102
82. Linking VRX and SEP reduced survey application
time and the nonresponse rate, improved quality through
enhanced oversight, and saved refugees’ time—though
new challenges are introduced. Both the basic and the
extended SEP have a household nonresponse rate of about
101 Kenya National Bureau of Statistics 2018.102 United Nations High Commissioner for Refugees 2003. See: https://www
.refworld.org/pdfid/3f967dc14.pdf. UNHCR group definitions include
household, family, and case. A household is defined as “a group of persons
(one or more) living together who make common provisions for food
or other essentials of living.” A family is “those members of a household
who are related to a specific degree through blood, adoption, or marriage.
The degree of relationship used in determining the limits of the family
is dependent on the uses to which the data is put, and cannot be defined
on a worldwide basis.” Finally, case is an additional designation used for
specific actions, such as status determination or resettlement.
2 percent, mainly due to the absence of an adult household
member present at the time of the survey. This relatively low
nonresponse rate is attributed to the large communication
campaign undertaken by UNHCR and the government to
ensure the presence of all household members on the day
of the survey, given the connection between verification,
legal status, and continued eligibility for assistance. The
use of monitoring tools, including daily consistency checks
adapted from the KIHBS and national surveys, had posi-
tive impacts on data quality for both surveys, while running
them together allowed for an efficient allocation of financial
resources and time. Linking the two also introduces a chal-
lenge: as verification is known among refugees to inform
eligibility for assistance, there is a risk that responses to the
socioeconomic survey are influenced by this perception.103
The Kalobeyei SEP controlled for this through careful com-
munications, both in a campaign in advance of the data
collection and in messaging from the enumerators, and
by monitoring response rates compared to averages from
national surveys.104 Future work is recommended to further
assess this dynamic, for example, through the use of behav-
ioral nudges.105
Survey instruments
83. The exercise encompasses three different survey
instruments: the VRX questionnaire, a basic SEP, and an
extended SEP interview. ProGres records were updated
for all households in the settlement. A systematic random
sample was then selected for an extended SEP interview.106
Those who were not selected for the extended interview were
administered a shorter version of the questionnaire (Fig-
ure 39, Table 2). The sample of the extended survey alone is
representative and therefore sufficient for generating poverty
103 For example, those who are not present and accounted for at the time of
verification may not be eligible for further food or cash distribution. 104 Similar to national governments in some settings, UNHCR often acts as
the primary service provider on which refugees rely for their well-being.
Registration data carry legal standing, including use in resettlement, and
are increasingly verified by biometric identification, which increases
quality. At the same time, data use for distribution of assistance may
create certain incentives when it comes to reporting on need or
indicators related to targeting of these services. 105 An extension of this work in Kakuma is expected to include behavioral
nudges to understand the potential impact of this effect Kaplan et al.
2018.106 The sample was implicitly stratified for the three villages in the camp.
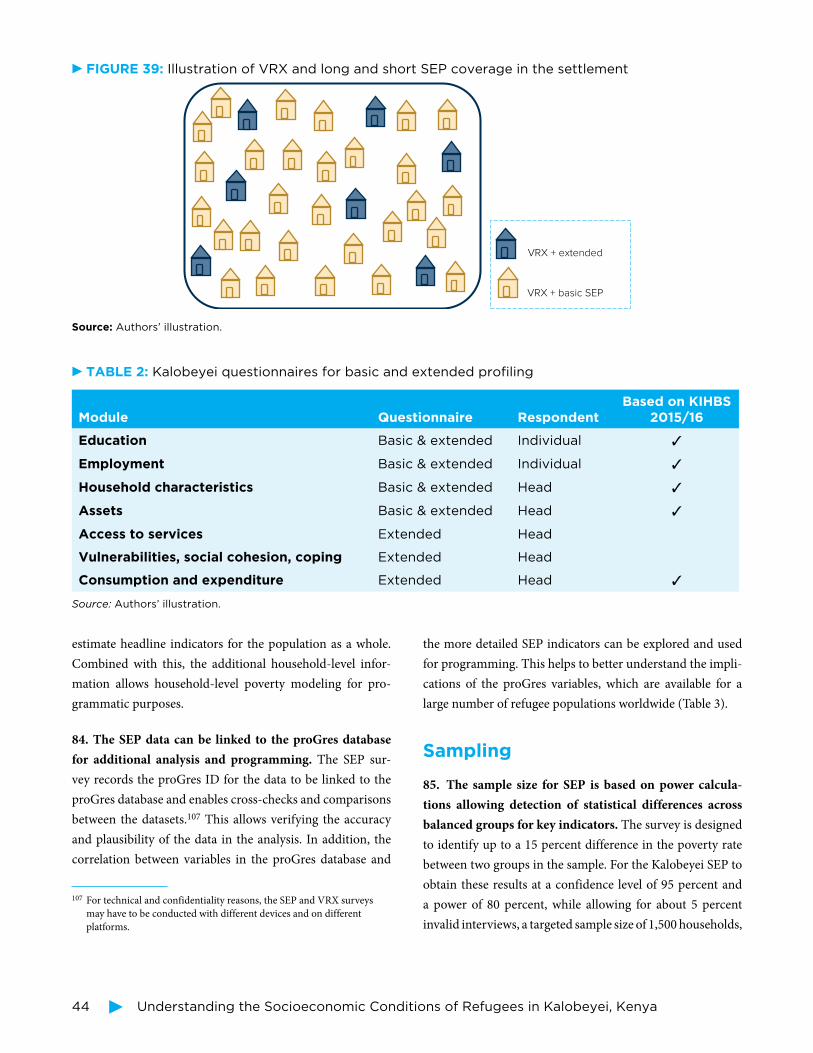
44 Understanding the Socioeconomic Conditions of Refugees in Kalobeyei, Kenya
estimate headline indicators for the population as a whole.
Combined with this, the additional household-level infor-
mation allows household-level poverty modeling for pro-
grammatic purposes.
84. The SEP data can be linked to the proGres database
for additional analysis and programming. The SEP sur-
vey records the proGres ID for the data to be linked to the
proGres database and enables cross-checks and comparisons
between the datasets.107 This allows verifying the accuracy
and plausibility of the data in the analysis. In addition, the
correlation between variables in the proGres database and
107 For technical and confidentiality reasons, the SEP and VRX surveys
may have to be conducted with different devices and on different
platforms.
the more detailed SEP indicators can be explored and used
for programming. This helps to better understand the impli-
cations of the proGres variables, which are available for a
large number of refugee populations worldwide (Table 3).
Sampling
85. The sample size for SEP is based on power calcula-
tions allowing detection of statistical differences across
balanced groups for key indicators. The survey is designed
to identify up to a 15 percent difference in the poverty rate
between two groups in the sample. For the Kalobeyei SEP to
obtain these results at a confidence level of 95 percent and
a power of 80 percent, while allowing for about 5 percent
invalid interviews, a targeted sample size of 1,500 households,
TABLE 2: Kalobeyei questionnaires for basic and extended profiling
Module Questionnaire RespondentBased on KIHBS
2015/16
Education Basic & extended Individual ✓
Employment Basic & extended Individual ✓
Household characteristics Basic & extended Head ✓
Assets Basic & extended Head ✓
Access to services Extended Head
Vulnerabilities, social cohesion, coping Extended Head
Consumption and expenditure Extended Head ✓
Source: Authors’ illustration.
FIGURE 39: Illustration of VRX and long and short SEP coverage in the settlement
VRX + extended
VRX + basic SEP
Source: Authors’ illustration.
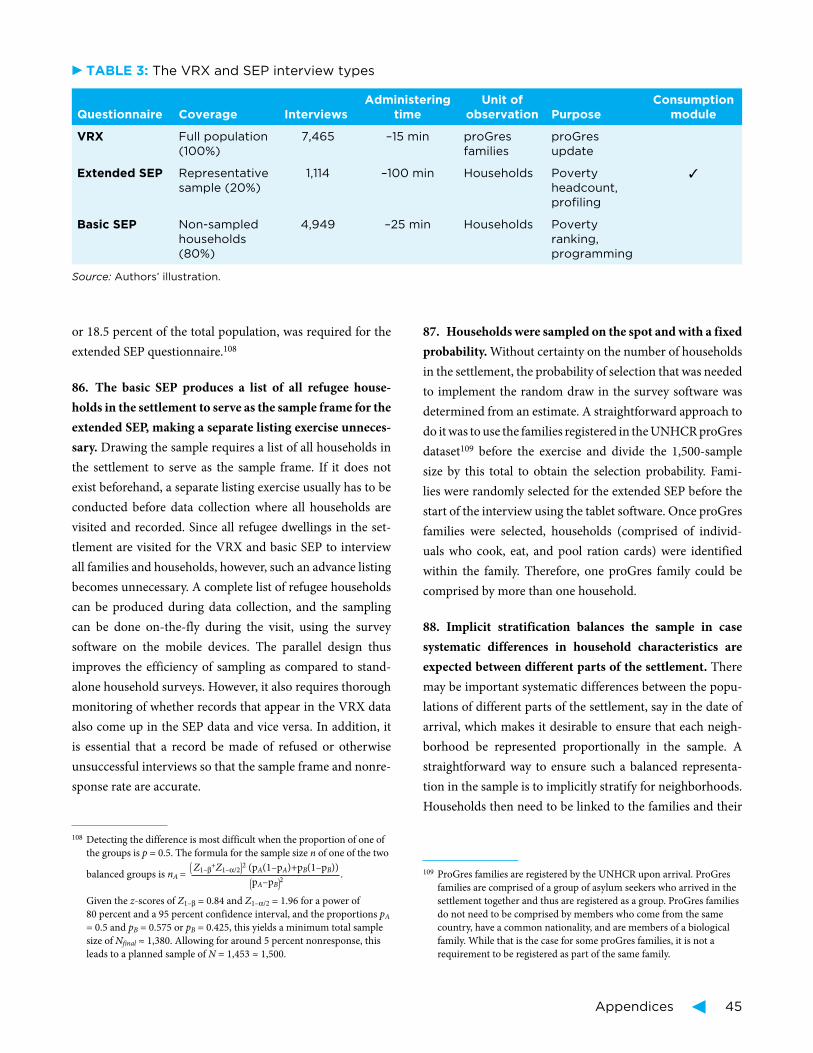
Appendices 45
or 18.5 percent of the total population, was required for the
extended SEP questionnaire.108
86. The basic SEP produces a list of all refugee house-
holds in the settlement to serve as the sample frame for the
extended SEP, making a separate listing exercise unneces-
sary. Drawing the sample requires a list of all households in
the settlement to serve as the sample frame. If it does not
exist beforehand, a separate listing exercise usually has to be
conducted before data collection where all households are
visited and recorded. Since all refugee dwellings in the set-
tlement are visited for the VRX and basic SEP to interview
all families and households, however, such an advance listing
becomes unnecessary. A complete list of refugee households
can be produced during data collection, and the sampling
can be done on-the-fly during the visit, using the survey
software on the mobile devices. The parallel design thus
improves the efficiency of sampling as compared to stand-
alone household surveys. However, it also requires thorough
monitoring of whether records that appear in the VRX data
also come up in the SEP data and vice versa. In addition, it
is essential that a record be made of refused or otherwise
unsuccessful interviews so that the sample frame and nonre-
sponse rate are accurate.
108 Detecting the difference is most difficult when the proportion of one of
the groups is p = 0.5. The formula for the sample size n of one of the two
balanced groups is Z1–β+Z1–α/2
2 (pA(1–pA)+pB(1–pB))nA
= pA–pB
2.
Given the z-scores of Z1–β = 0.84 and Z1–α/2 = 1.96 for a power of
80 percent and a 95 percent confidence interval, and the proportions pA
= 0.5 and pB = 0.575 or pB = 0.425, this yields a minimum total sample
size of Nfinal ≈ 1,380. Allowing for around 5 percent nonresponse, this
leads to a planned sample of N = 1,453 ≈ 1,500.
87. Households were sampled on the spot and with a fixed
probability. Without certainty on the number of households
in the settlement, the probability of selection that was needed
to implement the random draw in the survey software was
determined from an estimate. A straightforward approach to
do it was to use the families registered in the UNHCR proGres
dataset109 before the exercise and divide the 1,500- sample
size by this total to obtain the selection probability. Fami-
lies were randomly selected for the extended SEP before the
start of the interview using the tablet software. Once proGres
families were selected, households (comprised of individ-
uals who cook, eat, and pool ration cards) were identified
within the family. Therefore, one proGres family could be
comprised by more than one household.
88. Implicit stratification balances the sample in case
systematic differences in household characteristics are
expected between different parts of the settlement. There
may be important systematic differences between the popu-
lations of different parts of the settlement, say in the date of
arrival, which makes it desirable to ensure that each neigh-
borhood be represented proportionally in the sample. A
straightforward way to ensure such a balanced representa-
tion in the sample is to implicitly stratify for neighborhoods.
Households then need to be linked to the families and their
109 ProGres families are registered by the UNHCR upon arrival. ProGres
families are comprised of a group of asylum seekers who arrived in the
settlement together and thus are registered as a group. ProGres families
do not need to be comprised by members who come from the same
country, have a common nationality, and are members of a biological
family. While that is the case for some proGres families, it is not a
requirement to be registered as part of the same family.
TABLE 3: The VRX and SEP interview types
Questionnaire Coverage Interviews
Administering
time
Unit of
observation Purpose
Consumption
module
VRX Full population
(100%)
7,465 –15 min proGres
families
proGres
update
Extended SEP Representative
sample (20%)
1,114 –100 min Households Poverty
headcount,
profiling
✓
Basic SEP Non-sampled
households
(80%)
4,949 –25 min Households Poverty
ranking,
programming
Source: Authors’ illustration.
( )
)(
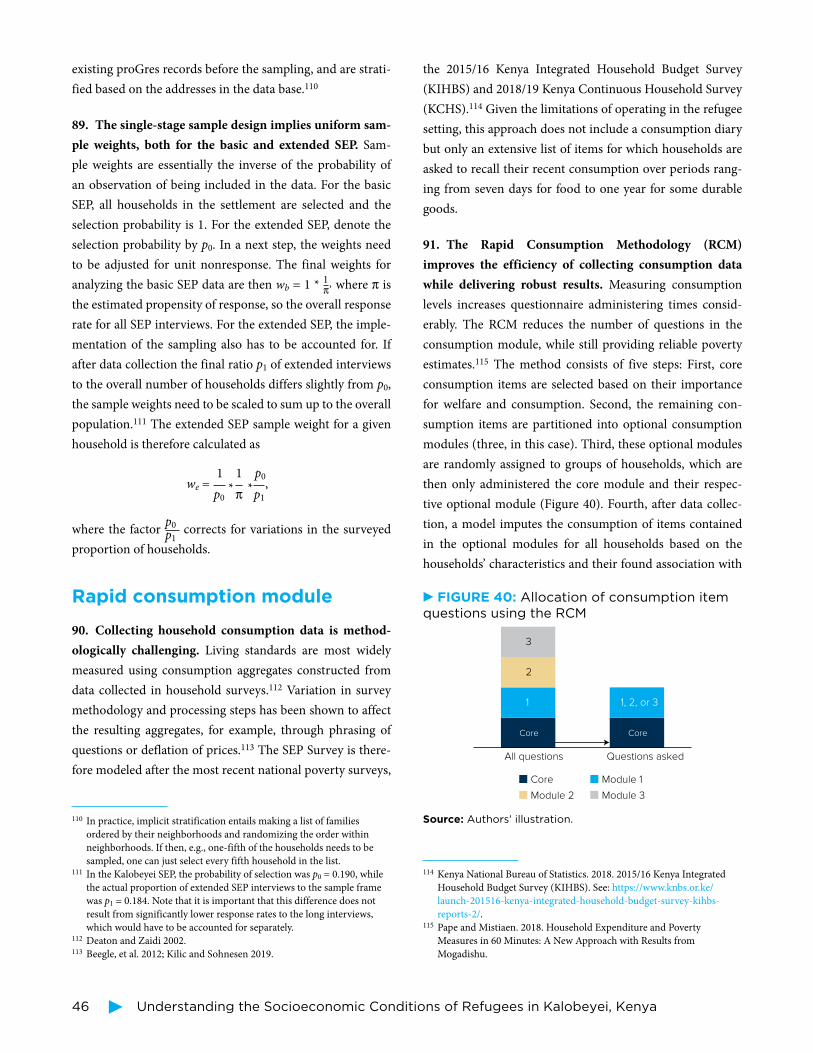
46 Understanding the Socioeconomic Conditions of Refugees in Kalobeyei, Kenya
existing proGres records before the sampling, and are strati-
fied based on the addresses in the data base.110
89. The single-stage sample design implies uniform sam-
ple weights, both for the basic and extended SEP. Sam-
ple weights are essentially the inverse of the probability of
an observation of being included in the data. For the basic
SEP, all households in the settlement are selected and the
selection probability is 1. For the extended SEP, denote the
selection probability by p0. In a next step, the weights need
to be adjusted for unit nonresponse. The final weights for
analyzing the basic SEP data are then wb = 1 * 1,π where π is
the estimated propensity of response, so the overall response
rate for all SEP interviews. For the extended SEP, the imple-
mentation of the sampling also has to be accounted for. If
after data collection the final ratio p1 of extended interviews
to the overall number of households differs slightly from p0,
the sample weights need to be scaled to sum up to the overall
population.111 The extended SEP sample weight for a given
household is therefore calculated as
1 1 p0we = * * , p0 π p1
where the factor p0
p1 corrects for variations in the surveyed
proportion of households.
Rapid consumption module
90. Collecting household consumption data is method-
ologically challenging. Living standards are most widely
measured using consumption aggregates constructed from
data collected in household surveys.112 Variation in survey
methodology and processing steps has been shown to affect
the resulting aggregates, for example, through phrasing of
questions or deflation of prices.113 The SEP Survey is there-
fore modeled after the most recent national poverty surveys,
110 In practice, implicit stratification entails making a list of families
ordered by their neighborhoods and randomizing the order within
neighborhoods. If then, e.g., one-fifth of the households needs to be
sampled, one can just select every fifth household in the list.111 In the Kalobeyei SEP, the probability of selection was p0 = 0.190, while
the actual proportion of extended SEP interviews to the sample frame
was p1 = 0.184. Note that it is important that this difference does not
result from significantly lower response rates to the long interviews,
which would have to be accounted for separately.112 Deaton and Zaidi 2002.113 Beegle, et al. 2012; Kilic and Sohnesen 2019.
the 2015/16 Kenya Integrated Household Budget Survey
(KIHBS) and 2018/19 Kenya Continuous Household Survey
(KCHS).114 Given the limitations of operating in the refugee
setting, this approach does not include a consumption diary
but only an extensive list of items for which households are
asked to recall their recent consumption over periods rang-
ing from seven days for food to one year for some durable
goods.
91. The Rapid Consumption Methodology (RCM)
improves the efficiency of collecting consumption data
while delivering robust results. Measuring consumption
levels increases questionnaire administering times consid-
erably. The RCM reduces the number of questions in the
consumption module, while still providing reliable poverty
estimates.115 The method consists of five steps: First, core
consumption items are selected based on their importance
for welfare and consumption. Second, the remaining con-
sumption items are partitioned into optional consumption
modules (three, in this case). Third, these optional modules
are randomly assigned to groups of households, which are
then only administered the core module and their respec-
tive optional module (Figure 40). Fourth, after data collec-
tion, a model imputes the consumption of items contained
in the optional modules for all households based on the
households’ characteristics and their found association with
114 Kenya National Bureau of Statistics. 2018. 2015/16 Kenya Integrated
Household Budget Survey (KIHBS). See: https://www.knbs.or.ke/
launch-201516-kenya-integrated-household-budget-survey-kihbs-
reports-2/.115 Pape and Mistiaen. 2018. Household Expenditure and Poverty
Measures in 60 Minutes: A New Approach with Results from
Mogadishu.
FIGURE 40: Allocation of consumption item questions using the RCM
Core Core
1 1, 2, or 3
2
3
All questions Questions asked
Core Module 1
Module 2 Module 3
Source: Authors’ illustration.
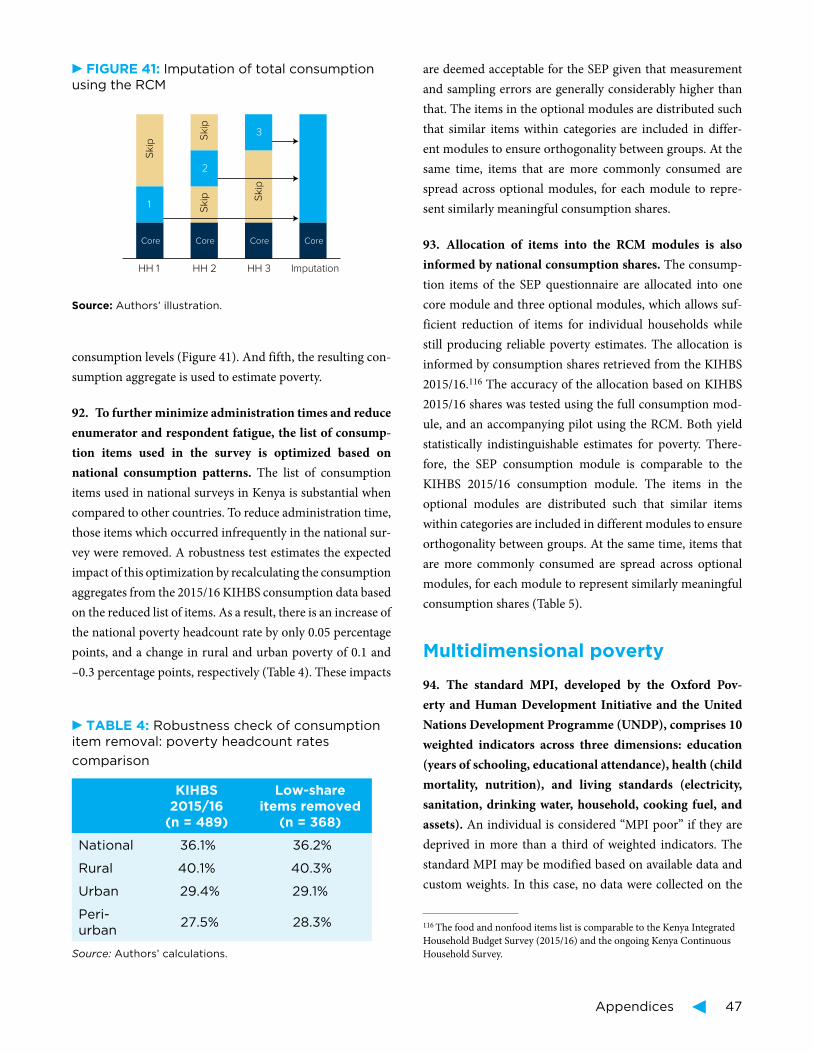
Appendices 47
consumption levels (Figure 41). And fifth, the resulting con-
sumption aggregate is used to estimate poverty.
92. To further minimize administration times and reduce
enumerator and respondent fatigue, the list of consump-
tion items used in the survey is optimized based on
national consumption patterns. The list of consumption
items used in national surveys in Kenya is substantial when
compared to other countries. To reduce administration time,
those items which occurred infrequently in the national sur-
vey were removed. A robustness test estimates the expected
impact of this optimization by recalculating the consumption
aggregates from the 2015/16 KIHBS consumption data based
on the reduced list of items. As a result, there is an increase of
the national poverty headcount rate by only 0.05 percentage
points, and a change in rural and urban poverty of 0.1 and
–0.3 percentage points, respectively (Table 4). These impacts
are deemed acceptable for the SEP given that measurement
and sampling errors are generally considerably higher than
that. The items in the optional modules are distributed such
that similar items within categories are included in differ-
ent modules to ensure orthogonality between groups. At the
same time, items that are more commonly consumed are
spread across optional modules, for each module to repre-
sent similarly meaningful consumption shares.
93. Allocation of items into the RCM modules is also
informed by national consumption shares. The consump-
tion items of the SEP questionnaire are allocated into one
core module and three optional modules, which allows suf-
ficient reduction of items for individual households while
still producing reliable poverty estimates. The allocation is
informed by consumption shares retrieved from the KIHBS
2015/16.116 The accuracy of the allocation based on KIHBS
2015/16 shares was tested using the full consumption mod-
ule, and an accompanying pilot using the RCM. Both yield
statistically indistinguishable estimates for poverty. There-
fore, the SEP consumption module is comparable to the
KIHBS 2015/16 consumption module. The items in the
optional modules are distributed such that similar items
within categories are included in different modules to ensure
orthogonality between groups. At the same time, items that
are more commonly consumed are spread across optional
modules, for each module to represent similarly meaningful
consumption shares (Table 5).
Multidimensional poverty
94. The standard MPI, developed by the Oxford Pov-
erty and Human Development Initiative and the United
Nations Development Programme (UNDP), comprises 10
weighted indicators across three dimensions: education
(years of schooling, educational attendance), health (child
mortality, nutrition), and living standards (electricity,
sanitation, drinking water, household, cooking fuel, and
assets). An individual is considered “MPI poor” if they are
deprived in more than a third of weighted indicators. The
standard MPI may be modified based on available data and
custom weights. In this case, no data were collected on the
116 The food and nonfood items list is comparable to the Kenya Integrated
Household Budget Survey (2015/16) and the ongoing Kenya Continuous
Household Survey.
FIGURE 41: Imputation of total consumption using the RCM
Core Core Core Core
Skip S
kip
Skip
Skip
HH 1 HH 2 HH 3 Imputation
1
2
3
Source: Authors’ illustration.
TABLE 4: Robustness check of consumption item removal: poverty headcount rates
comparison
KIHBS 2015/16
(n = 489)
Low-share items removed
(n = 368)
National 36.1% 36.2%
Rural 40.1% 40.3%
Urban 29.4% 29.1%
Peri-urban
27.5% 28.3%
Source: Authors’ calculations.
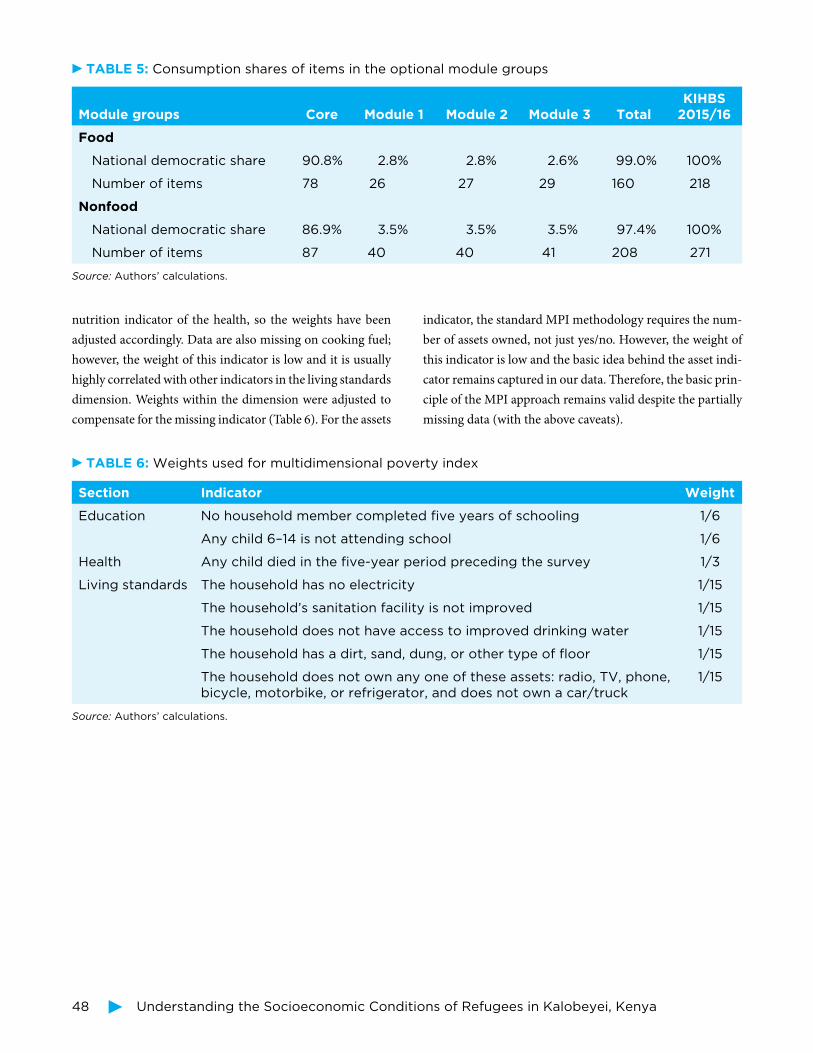
48 Understanding the Socioeconomic Conditions of Refugees in Kalobeyei, Kenya
nutrition indicator of the health, so the weights have been
adjusted accordingly. Data are also missing on cooking fuel;
however, the weight of this indicator is low and it is usually
highly correlated with other indicators in the living standards
dimension. Weights within the dimension were adjusted to
compensate for the missing indicator (Table 6). For the assets
indicator, the standard MPI methodology requires the num-
ber of assets owned, not just yes/no. However, the weight of
this indicator is low and the basic idea behind the asset indi-
cator remains captured in our data. Therefore, the basic prin-
ciple of the MPI approach remains valid despite the partially
missing data (with the above caveats).
TABLE 5: Consumption shares of items in the optional module groups
Module groups Core Module 1 Module 2 Module 3 TotalKIHBS
2015/16
Food
National democratic share 90.8% 2.8% 2.8% 2.6% 99.0% 100%
Number of items 78 26 27 29 160 218
Nonfood
National democratic share 86.9% 3.5% 3.5% 3.5% 97.4% 100%
Number of items 87 40 40 41 208 271
Source: Authors’ calculations.
TABLE 6: Weights used for multidimensional poverty index
Section Indicator Weight
Education No household member completed five years of schooling 1/6
Any child 6–14 is not attending school 1/6
Health Any child died in the five-year period preceding the survey 1/3
Living standards The household has no electricity 1/15
The household’s sanitation facility is not improved 1/15
The household does not have access to improved drinking water 1/15
The household has a dirt, sand, dung, or other type of floor 1/15
The household does not own any one of these assets: radio, TV, phone, bicycle, motorbike, or refrigerator, and does not own a car/truck
1/15
Source: Authors’ calculations.