Embed Size (px)
Citation preview

Claremont Colleges Claremont Colleges
Scholarship @ Claremont Scholarship @ Claremont
CMC Senior Theses CMC Student Scholarship
2021
Understanding the Relationship between Customer Concentration Understanding the Relationship between Customer Concentration
and Profitability in Public Firms in the Electronics Manufacturing and Profitability in Public Firms in the Electronics Manufacturing
Industry Industry
Alexander Garcia Delgado
Follow this and additional works at: https://scholarship.claremont.edu/cmc_theses
Recommended Citation Recommended Citation Garcia Delgado, Alexander, "Understanding the Relationship between Customer Concentration and Profitability in Public Firms in the Electronics Manufacturing Industry" (2021). CMC Senior Theses. 2650. https://scholarship.claremont.edu/cmc_theses/2650
This Open Access Senior Thesis is brought to you by Scholarship@Claremont. It has been accepted for inclusion in this collection by an authorized administrator. For more information, please contact [email protected].

Understanding the relationship between Customer Concentration and Profitability in Public
Firms in the Electronics Manufacturing Industry
A Thesis Presented
by
Alexander Benjamin Garcia Delgado
To the Keck Science Department
Of Claremont McKenna, Pitzer, and Scripps College
In partial fulfillment of
The degree of Bachelor of Arts
Senior Thesis in Economics and Physics
04/08/2021

2
Table of Contents
1. Abstract………………………………………………………………………………………..3
2. Introduction………………………………………………………………………………...…4
3. Literature Review…………………………………………………………………………….5
4. Hypothesis Development……………………………………………………………………...8
5. Data Selection & Methods…………………………………………………………………...11
6. Results………………………………………………………………………………………...15
7. Discussion…………………………………………………………………………………….18
8. References…………………………………………………………………………………….21
9. Acknowledgements…………………………………………………………………………..23

3
Abstract
This study investigates the relationship between a supplier’s profitability and their major
customers. Previous literature concerning a firm’s customer makeup and their profitability have
produced two general conclusions. The first conclusion is that there is a negative correlation due
to the power imbalance major customers gain over their suppliers, resulting in lower prices,
overextended credit accounts, and inconsistent cash payments for the goods provided by the
supplier. Other literature argues that there is a positive correlation due to mutual dependence
between a customer and its supplier causing an increase in information sharing and joint actions,
resulting in a higher profitability for the supplier. This study analyzed 136 firms in the
electronics manufacturing industry in 2017 and found a positive and significant correlation
between customer concentration and a supplier’s profitability. The analysis also found a positive
but insignificant correlation between mutual dependence and a supplier’s profitability. The
results suggest that gained efficiencies from greater customer concentration outweigh the effects
of a disadvantageous power imbalance by major customers.

4
Introduction
Globalization has brought upon rapid change to the way we think of supply chains and supplier-
consumer relations. With a world that is widely interconnected, emphasis has been placed on
systemic risk within the fields of supply chain management and industrial organization. The term
“supply chain” is now appearing more and more to be a “supply network”. A firm’s customers
are a major component of the supply network of modern manufacturing firms. According to US
manufacturing firms, about 30% of all sales are attributed to a small percentage of large
customers (Campello and Gao, 2017). Extensive studies and analysis into this subject have
shown that as firms develop relationships with these select few and very large customers,
investments in specialized, customer specific assets occur and the customer obtains an economic
leverage over their supplier, allowing them to negotiate a lower product price or delay regular
payments for the products. (Kelly, Lusting, and Van Newburgh, 2013; Cohen and Frazzini,
2008)
This paper will build upon the existing literature concerning the correlation between a firm’s
major customers and that firm’s profitability. This analysis will primarily focus on the publicly
traded companies in the electronics manufacturing industry, a novelty in the current knowledge,
which has primarily focused on the manufacturing business entirely. (Campello and Gao, 2013;
Kim, 2017) The electronics industry, while it has been around for a significant amount of time, is
an industry that is constantly evolving and supplying the innovation of the model world. This
paper wishes to analyze the relationship between major customers and a supplier’s profitability
within the electronics manufacturing industry and to what magnitude the relationship compares
to existing literature.

5
Literature Review
Extensive work has been done that looks into the impact of having major customers on a firm’s
profitability and overall performance. While results and correlations vary across the existing
literature, there appears to be two schools off thought concerning the relationship between major
customers and profitability that are based on economic reasoning.
Some literature suggests a negative correlation between major customers and a supplier’s
profitability. Galbraith and Stiles’ 1983 article views the relationship between a firm and their
major customers as a potential power imbalance. The article mentions the Rolls Royce
investigation of 1969, which showed that Rolls Royce was a major customer of several suppliers
and had significant power over these firms (Galbraith and Stiles, 1983). Due to the high sales
volume attributed to Rolls Royce, Rolls Royce had significant leverage in demanding lower
prices and conditions unequivocally advantageous to them. Smith Clayton Forge, a supplier for
Rolls Royce’s engine blades, had developed product specific forging technique unique for Rolls
Royce (Galbraith and Stiles, 1983). This investment in customer specific assets by a supplier
increased the leverage Rolls Royce had on their supplier, further placing Smith Clayton Forge in
a disadvantageous and profit stifling situation. Rolls Royce, being a large part of multiple
suppliers’ total sales, had also received generous credit lines with these companies. (Galbraith
and Stiles, 1983) These credit lines, while they did allow for the continued business between a
supplier and their major customer, also allowed for an irregular cash payment schedule for the
products and services being provided by the supplier. This problem grew into the worst situation
for the suppliers when Rolls Royce defaulted in 1969, significantly affecting all of its suppliers
in the process (Galbraith and Stiles, 1983). The Rolls Royce bankruptcy and investigation of
1969 strongly exemplifies the economic risks suppliers take when having major customers:

6
suppliers lose price negotiating leverage due to large sales volume, investing in customer specific
assets, and overextending credit lines to their major customers. Further studies have shown that
this power imbalance is not a case specific phenomenon and can be seen in other relationships,
such as between manufacturing firms and large retail stores (Kelly and Gosman, 2000).
On the opposite side of the same coin, there exists literature which suggests a positive correlation
between a firm having major customers and the firm’s profitability. The theoretical justification
for this positive correlation is a mix of sociology and economic theory, stating that the mutual
dependence of both suppliers and their major customers stifles opportunistic power imbalances
in favor of maintaining the relationship (Granovetter, 1985). In addition to stifling opportunism
from the major customer, further literature suggests that such relationships also promote
information sharing within the supply chain of products, allowing for an improved and more
synchronous asset management by the supplier firms. (Cowley, 1988) The benefits of a
synchronous supplier and major customer relationship can be observed in case studies of
collaborative marketing campaigns. (Bund, 1985). Patatoukas (2012) did an empirical analysis of
supplier firms with major customers and found a positive contemptuous association between a
firms Customer Concentration (CC) and the supplier firm’s accounting rate of return (ARR). In
this specific research, the positive association was linked to the theory that the efficiencies of
having a major customer base outweighed the monetary losses due to disadvantageous prices
forced by the major customers (Patatoukas, 2012). The efficiencies mentioned above include
relatively lower selling, general and administrative costs, enhanced asset utilization, greater
return on assets (ROA), and a greater inventory turnover.
Most of the literature regarding a firm’s customer base and profitability studied public firms as a
whole, focusing on the manufacturing sector (SIC 2000-4000), or looking at firms that have

7
retail companies (Target, Walmart, Amazon) as their major customers (Kelly and Gosman,2000).
Existing literature on major customers in the electronics manufacturing industry is limited and
primarily focuses on the effect of a firm’s supply network on the firm’s innovation output
(Ghosh and Hora, 2014). While Ghosh and Hora primarily focus on the customer’s perspective
of the supply chain, they analyze the supply chain as a network rather than a direct link between
a single supplier and single customer. This paper studies the electronics industry through the
network lens, and I will be adopting this same lens, but will focus on the impact on the supplier
firms’ profitability characteristics.

8
Hypothesis Development
Previous literature has used a measure called customer concentration (CC) to measure how
dependent a supplier’s sales are on their major customers (Kim, 2014; Patatoukas, 2012; Kelly
and Gosman, 2000; Balakrishnan,1996). The customer concentration metric takes into account
the number of major customers and the respective sales generated from each customer. There is
some division on the conclusions gathered using the customer concentration metric. Kelly and
Goodman (2000) observed that within the manufacturer-retail relationships, manufacturing firms
with major retail customers were less profitable. This lesser performance was attributed to the
buying power of the retail companies, who held leverage over the suppliers due to the significant
sales they generated for the supplier firm. Balakrishnan (1996) also had similar results, however
the observations were focused on just-in-time (JIT) companies and their suppliers. The reasoning
for this negative correlation was similar to that of Kelly and Goodman, finding that the
customers had significant leverage which allowed for a disadvantageous price for the supplier
and the possibility of irregular payment schedules by the customer (Balakrishnan (1996). More
recently, Kim (2014) found that customer concentration negatively impacted a firm’s
profitability and overall performance, furthering the notion that having major customers hampers
a firm’s profitability. However, it is important to mention that Patatoukas (2012) observed a
positive association between customer concentration and the supplier firms’ profitability and
overall performance. This observation was done on a sample of firms in several industries
including manufacturing and construction, wholesale and retail trade, and public administration.
Patatoukas observed that firms with a greater customer concentration reported lower gained
efficiencies, such as lower cost of goods sold (COGS), selling, general and administrative costs
(SGA), and inventory turnover rates. It is possible to expect that a firm with a smaller number of
customers could specialize products and marketing strategy to each customer, allowing a better

9
utilization of the supplier’s resources. A supplier that produces customer specific goods could
become a just-in-time (JIT) firm, lowering the cost of holding inventory.
This paper will primarily focus on the electronics manufacturing industry (SIC 3600-3699), an
industry where there is not a significant amount of literature. However, previous works that
encompassed multiple industries, including manufacturing, in their samples have for the vast
majority observed a negative association between customer concentration and a supplier firm’s
profitability. While there is some empirical evidence and a theoretical justification through
gained efficiencies for a positive correlation between CC and a firm’s profitability, most of the
literature review has demonstrated a negative correlation. Therefore, I am compelled to introduce
the following hypothesis:
Hypothesis One: Customer concentration has a negative correlation with a supplier firm’s
profitability in the electronics manufacturing industry.
In this study, I will also be looking at the relationship between a supplier’s mutual dependence
with its major customers and how that effects its profitability. Like the customer concentration
measure in the previous paragraph, there has been some consistent usage of the mutual
dependence metric in literature. Mutual dependence is an interaction term that takes into account
how embedded a supplier’s sales are with a particular customer and also how important these
sales are to the costumer’s operation. A more detailed mathematical explanation is given in the
next section. The concept of mutual dependence in the supplier-customer relationship stems from
a social network view of this system, suggesting that dependence between both a customer and
their supplier promotes trust and a willingness to subdue opportunistic power grabs in order to
preserve the relationship (Uzzi, 1997). Kim (2017) found a positive correlation between a
supplier’s mutual dependence and their profitability when he looked at a sample size of 717

10
firms across multiple industries, including the electronic industry. Based on previous literature’s
analytic results and the theoretical justification of embeddedness increasing the profitability of a
supplier, I am compelled to state the following hypothesis:
Hypothesis Two: Mutual Dependence is positively correlated with a supplier firm’s profitability
in the electronics manufacturing industry.

11
Data Sample Construction & Methodology
The data sample for this study was obtained from Standard & Poor’s Compustat database,
specifically the Historical Segment – Customer data. This study focused on North American
public firms in the electronics manufacturing industry, which are associated by the firm having a
Standard Industrial Classification code between 3600-3699. This study also focused specifically
on the fiscal year 2017. The data sample consisted of public firms that had disclosed at least one
major customer in fiscal year of 2017. The sample data from Compustat was further enhanced by
only looking at major customers who were other companies and not government entities (local,
state, and federal), individual people, or geographical areas. The data sample from compustat
was additionally filtered by removing major customer entries that were not a single entity (ie. “2
customers”, “10 customers”). The data entry for each supplier firm’s major customers had to be a
single identifiable and publicly traded company. As a result of the filtering, the data sample
consisted of 136 publicly traded companies that had at least one major customer that was another
company in the year 2017.
Having selected the study’s sample size, several economic data on each company was collected.
Data on each company in the sample included the number of major customers and the sales
generated from each major customer. Additional supplier company specific information that was
gathered included the firms’ size (which is the natural log of their annual total sales), the dollar
amount of cash on hand in 2017 (CASH), the supplier’s cost of goods sold (COGS), their
research and development expense in 2017 (RD), the total value of the shareholder’s equity (TE),
and the net value of the supplier’s property, plant, and equipment. All of these figures were as of
the date each company published their annual documents for the fiscal year 2017. All monetary
figures are in USD and foreign monetary figures (JPY, KRW, TWD, CYN) were converted to

12
USD using the exchange rate at the date the financial fillings were published. (Historical
Exchange Rates, 2021) Annual financial data was also collected on each of the major customers
from the sample data. For this analysis, I used a hierarchical regression analysis on two
dependent variables. The dependent variables for this analysis include the suppliers return on
assets (ROA) and their return on sales (ROS). These variables are sufficient indicators of a firm’s
profitability and have been used in previous literature (Kim, 2017). A mathematical
interpretation of ROA and ROS is listed below.
𝑅𝑒𝑡𝑢𝑟𝑛 𝑜𝑛 𝐴𝑠𝑠𝑒𝑡𝑖 =𝑁𝑒𝑡 𝐼𝑛𝑐𝑜𝑚𝑒𝑖
𝑇𝑜𝑡𝑎𝑙 𝐴𝑠𝑠𝑒𝑡𝑖
𝑅𝑒𝑡𝑢𝑟𝑛 𝑜𝑛 𝑆𝑎𝑙𝑒𝑠𝑖 =𝑁𝑒𝑡 𝐼𝑛𝑐𝑜𝑚𝑒𝑖
𝑇𝑜𝑡𝑎𝑙 𝑆𝑎𝑙𝑒𝑠𝑖
There will be a total of two hierarchical regression analysis, one on return on asset and one on
return on sales. Each one of this hierarchical regression analysis will consist of two models.
Model one will regress one of the dependent variables on only the control variables. The control
variables include the supplier’s cash, cost of goods sold, research and development expense, their
total equity, the net value of their property plant and equipment, and the supplier firm’s size.
Cash was chosen as a control variable to account for a company’s liquidity and ability to meet
their financial obligations under the event that a customer does not pay or pays irregularly. The
cost of goods sold was submitted to account for the size of the supplier’s cost of operations. This
study expects a negative correlation between COGS and supplier’s profitability since a relative
increase in COGS would directly result in lower net income. Research and Development expense
is necessary because the sample data is in the electronic manufacturing industry, an asset and
technology heavy sector. This study expects a negative correlation between research and
development expense with the firm’s profitability. Similarly, property, plant and equipment is

13
necessary to account for the wide ranges in firm sizes, specifically on the customer specific
assets each supplier has relative to the rest of the sample. Lastly, total equity and firm size both
account for a firm’s overall size, which is necessary to include in order to not skew the result due
to extremely small boutique suppliers or large, multinational ones. All of these control variables
are in a United States Dollar amount with the exception of their firm size, which is the natural
log of their total sales.
𝐹𝑖𝑟𝑚 𝑆𝑖𝑧𝑒𝑖 = ln (𝑇𝑜𝑡𝑎𝑙 𝑆𝑎𝑙𝑒𝑠𝑖)
Model two add two additional dependent variables, customer concentration and mutual
dependence, to the construction of model one. These two independent variables are the main
independent variables that incorporate a supplier’s relationship with their major customers.
Customer concentration (CC) is the sum of sales generated by each major customer, j, divided by
the total sales of the supplier, i, squared. This variable has a range from 0 to 1 and reflects how
much of a supplier’s sales are attributed to major customers. A mathematical equation for customer
concentration is shown below.
𝐶𝑢𝑠𝑡𝑜𝑚𝑒𝑟 𝐶𝑜𝑛𝑐𝑒𝑛𝑡𝑟𝑎𝑡𝑖𝑜𝑛𝑖 = ∑ (𝑆𝑎𝑙𝑒𝑠𝑖𝑗
𝑆𝑎𝑙𝑒𝑠𝑖)
2𝐽
𝑗=1
The second dependent variable of interest that was added in model two is mutual dependence
(MD). This dependent variable is an interaction between how important a customer is to the
supplier (𝑆𝑖𝑗) and how important the supplier is to the customer (𝑃𝑖𝑗). 𝑆𝑖𝑗 is similar to customer
concentration, where we divide the sales generated by a customer by the total sales of the
supplier, however we are not squaring the fraction here. 𝑃𝑖𝑗 represents how important the
supplier is to the customer’s annual purchases. It is calculated by the dividing the sales generated

14
by customer j by the customer j’s cost of goods sold for the same year. Each interaction between
𝑆𝑖𝑗 and 𝑃𝑖𝑗 is weighted by a factor of 𝜔𝑖𝑗. This weighing factor is 𝑆𝑖𝑗 divided by the total sales of
supplier i. Mutual dependence can be interpreted as an interaction term between customer
concentration and how important a supplier is to their customer. This measure has a range from 0
to 1, where a value of 1 would mean that all the sales generated by a customer equate all the cost
of goods sold of the customer. Mathematical equations for 𝑀𝐷𝑖𝑗 and its components are below.
𝑀𝐷𝑖 = ∑ 𝜔𝑖𝑗(𝑆𝑖𝑗 ∗ 𝑃𝑖𝑗)
𝐽
𝑗=1
𝜔𝑖𝑗 =(
𝑆𝑎𝑙𝑒𝑠𝑖𝑗
𝑆𝑎𝑙𝑒𝑠𝑖)
∑ (𝑆𝑎𝑙𝑒𝑠𝑖𝑗
𝑆𝑎𝑙𝑒𝑠𝑖)𝐽
𝑗=1
𝑆𝑖𝑗 = (𝑆𝑎𝑙𝑒𝑠𝑖𝑗
𝑆𝑎𝑙𝑒𝑠𝑖) 𝑎𝑛𝑑 𝑃𝑖𝑗 = (
𝑆𝑎𝑙𝑒𝑠𝑖𝑗
𝐶𝑜𝑠𝑡 𝑜𝑓 𝑔𝑜𝑜𝑑𝑠 𝑠𝑜𝑙𝑑𝑗)

15
Results
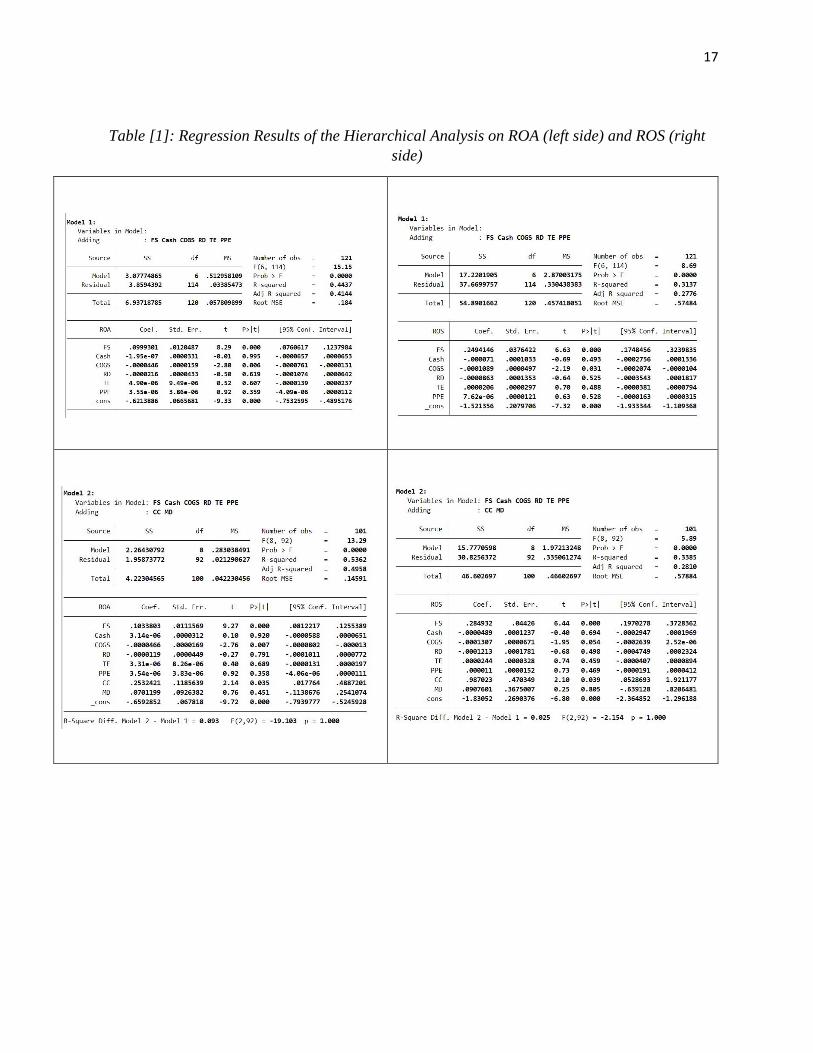
The hierarchical regression analysis produced four individual regressions, two different models
for each of the two dependent variables ROA and ROS. Table 1 shows the results of each of the
regressions run on STATA.
The first thing to note is that the 𝑅2values for model one on both the ROA and ROS regressions
were .4437 and .3137, respectively. These values are sufficient and appropriate compared to 𝑅2
values from existing literature with similar regression analysis (Kim, 2017). The adjusted 𝑅2 for
both model ones were slightly less at 0.4144 and 0.3137, however they were still adequate when
compared to previous regressions ran in existing literature.
Focusing on the hierarchical regression on ROA, there was a significant increase in the 𝑅2 from
model two to model one. There was a 0.093 increase between an 𝑅2 of 0.5362 in model two and
0.4437 in model one. This indicated that customer concentration and mutual dependence had
some descriptive power in a supplier’s return on assets.
The hierarchical regression analysis on ROS also demonstrated an increase in the 𝑅2 between
model two and model one, however, it was significantly smaller compared to the regression on
ROA. There was a 0.025 increase between a 𝑅2 of 0.3385 in model two and 0.3137 model one.
This increase indicates that customer concentration and mutual dependence have some
descriptive power on ROS, however, not as great as in the regression on ROA.
Looking at the values for customer concentration (CC) in model two for the regression on ROA,
we see a coefficient of 0.2532 and a 𝑃 > |𝑡| = 0.035. This means that customer concentration
has a positive and statistically significant effect on a supplier’s ROA at a 95% confidence level.
Customer concentration in model two of the regression on ROS demonstrated a coefficient value

16
of 0.987203 and 𝑃 > |𝑡| = 0.039. This is important as the analysis shows that customer
concentration has a positive and significant effect on a supplier’s profitability. This does not
support hypothesis one, which stated that customer concentration is negatively associated with a
supplier’s profitability.
Mutual dependence (MD) in model two of the regression on ROA had a coefficient of 0.0701
and a 𝑃 > |𝑡| = 0.451. This indicates that MD had a positive but insignificant effect on a
supplier’s ROA. Similarly for the regression on ROS, the coefficient for MD was 0.0907 and had
an 𝑃 > |𝑡| = 0.805. Both of these results indicated that MD has a positive, but statistically
insignificant effect on a supplier’s profitability at a 95% confidence level. This result only
partially supports hypothesis two.
17
Table [1]: Regression Results of the Hierarchical Analysis on ROA (left side) and ROS (right
side)

18
Discussion
It is important to explore why the empirical analysis did not support the hypothesis that customer
concentration is negatively associated with a supplier’s profitability. Two possible explanations
for this contradiction could be the effect of gained efficiencies and the increasing demand for
electronic components.
Previous literature, such as Patatoukas (2012) found a positive correlation between customer
concentration and a supplier’s profitability. The author reported that although suppliers with a
greater customer concentration reported lower margins, they also reported lower expenses such
as cost of goods sold and selling, general, and administrative expenses. That article also reported
that customer with greater CC also reported higher inventory turnover rates and greater asset
utilization (Patatoukas, 2012). There exists the possibility that within the electronics
manufacturing industry, the gained efficiencies from a greater customer concentration are more
effective than in other industries. Suppliers could possibly invest in product specific assets for
producing their customer’s products, such as the buying of new equipment to produce a model
specific camera for their customer’s phone.
Aside from the benefits of a streamlined operation for the supplier, there could be the additive
effect of joint actions between electronics manufacturing suppliers and their clients. Information
sharing and joint actions, such as a collaborative marketing campaign, can lessen the
disadvantageous position of suppliers with their customers and improve the profitability of the
suppliers (Bund, 1985). This effect, although not explored in this study, could possibly have a
significant impact on suppliers within the electronics manufacturing industry. It is possible that
the combination of gained efficiencies and increased information sharing between suppliers and

19
major customers as a result of customer concentration outweigh the potential negative power
imbalance.
Currently, in March of 2021, there is a massive shortage for electronic components, more
specifically microchips, due to the massive increase in demand for the production of everything
from children’s toys to multi-million-dollar aircrafts (King, Wu, and Pogkas, 2021). While this
explosive demand is a few years after our sample data, I believe it is reflective of the high
demand for electronic components, especially as more and more products produced have at least
one electric component in them. According to the World Bank, in 2017 there were 102.8 active
cellular subscriptions per 100 people, and this number has since increased to 109.4 in 2019
(World Bank, 2019). Similarly, the percentage of the people connected to the internet increased
from 28.754% in 2010 to almost 49% in 2017 (World Bank, 2017). The world is quickly
becoming more and more connected, thus increasing the demand of the smart devices and the
electronic components that make these devices possible. It could be possible that this high
demand for electronic components lessens the power imbalance between suppliers and major
customers in favor of the suppliers. Studying this further would be an interesting avenue for
greater exploration.
The analysis in this study, specifically the positive but statistically insignificant effect mutual
dependence had on a supplier’s profitability, only partially supported the second hypothesis. It is
important to ask why the mutual dependence was statistically insignificant.
The statistical insignificance of MD could be due to the size of the sample data. While the study
ensured that all of the suppliers were North America publicly traded companies, the major
customers could be either public or private companies. Since some of the major customers were
private companies, it was difficult to gather financial data necessary to calculate their mutual

20
dependence. This resulted in overall less data points to run the regression on. A possible avenue
for further exploration of the mutual dependence of suppliers would be to run a regression across
several years to gain more data.
Lastly, it is important to reflect on the importance of this study and how it contributes to the
existing literature. The technology sector is rapidly growing and in order to make smart
investment and business decisions within this field, we must fully understand the systemic risk
that exists. The networks between electronic manufacturing firms and their major customers are
a part of this systemic risk and thus is worth investigating to better understand it.

21
References:
Campello, M., & Gao, J. (2017). Customer concentration and loan contract terms. Journal of
Financial Economics, 123(1), 108–136. https://doi.org/10.1016/j.jfineco.2016.03.010
Herskovic, B., Kelly, B., Lustig, H., Van Nieuwerburgh, S., & National Bureau of Economic
Research. (2013). Firm volatility in granular networks (Ser. Nber working paper series, no.
w19466). National Bureau of Economic Research
Cohen, L., & Frazzini, A. (2008). Economic links and predictable returns. The Journal of
Finance, 63(4), 1977–2011.
Kim, Y. H. (2017). The effects of major customer networks on supplier profitability. Journal of
Supply Chain Management, 53(1), 26–40. https://doi.org/10.1111/jscm.12118
Galbraith, C. S., & Stiles, C. H. (1983). Firm profitability and relative firm power. Strategic
Management Journal, 4(3), 237–249.
Kelly, Trish, & Gosman, Martin L. (2000). Increased buyer concentration and its effects on
profitability in the manufacturing sector. Review of Industrial Organization, 17(1), 41–59.
Granovetter, M. (1985). Economic action and social structure: the problem of
embeddedness. American Journal of Sociology, 91(3), 481–510.
Cowley, P. R. (1988). Market structure and business performance: an evaluation of buyer/seller
power in the pims database. Strategic Management Journal, 9(3), 271–278.
Bund, B. (1985). Winning and keeping industrial customers: the dynamics of customer
relationships. Lexington Books.
Patatoukas, P. N. (2012). Customer-base concentration: implications for firm performance and
capital markets. The Accounting Review, 87(2), 363–392.
Bellamy, M. A., Ghosh, S., & Hora, M. (2014). The influence of supply network structure on
firm innovation. Journal of Operations Management, 32(6), 357–373.
https://doi.org/10.1016/j.jom.2014.06.004
Balakrishnan, R., Linsmeier, T. J., & Venkatachalam, M. (1996). Financial benefits from jit
adoption: effects of customer concentration and cost structure. The Accounting Review, 71(2),
183–205.
Uzzi, Brian. 1997. “Social Structure and Competition in Interfirm Networks: The Paradox of
Embeddedness.” Administrative Science Quarterly 42 (1): 35–67.
Wharton Research Data Services. "WRDS" wrds.wharton.upenn.edu, accessed 2021-03-12.
https://www.exchangerates.org.uk/, 2021. Historical Exchange Rates; 12/31/2017

22
https://www.bloomberg.com/graphics/2021-semiconductors-chips-shortage/, March 28th , 2021.
How a Chip Shortage Snarled Everything from Phones to Cars by Ian King, Debby Wu and
Demetrios Pogkas. Bloomberg.com
World Bank. “Mobile cellular subscriptions.” World Development Indicators, The World Bank
Group, 2021, https://data.worldbank.org/indicator/IT.CEL.SETS.P2?view=chart. Accessed
March 2021.
World Bank. “Individuals Using the Internet (% of the population).” World Development
Indicators, The World Bank Group, 2021.
https://data.worldbank.org/indicator/IT.NET.USER.ZS?view=chart. Accessed March 2021.

23
Acknowledgements
I would like to thank my family and friends for all their support these last four years. I would
also like to thank my readers, Professors Fan Yu and Scot Gould for their support during this
thesis semester. Lastly, I would like to thank you for taking the time to read this thesis and for
any feedback you may wish to give me. Thank you.