Embed Size (px)
Citation preview
Center for Energy Studies
American Chemical Society National MeetingNew Orleans, LouisianaApril 7, 2008
Understanding the Impacts of Katrina and Rita on Gulf Coast Energy Infrastructure
David E. DismukesCenter for Energy StudiesLouisiana State University
Center for Energy Studies
Summary on Impacts of Hurricanes
Hurricanes were incredibly destructive to energy business – effects felt for some time. Was a shining moment for all in the industry.
Hurricanes clearly showed the interrelationship of all types of energy infrastructure in the Gulf – the “4 Ps” –production, processing, pipes, and power.
Hurricanes impacts were felt nationally and internationally – drives home importance of Gulf coast and critical energy infrastructure.
© LSU Center for Energy Studies
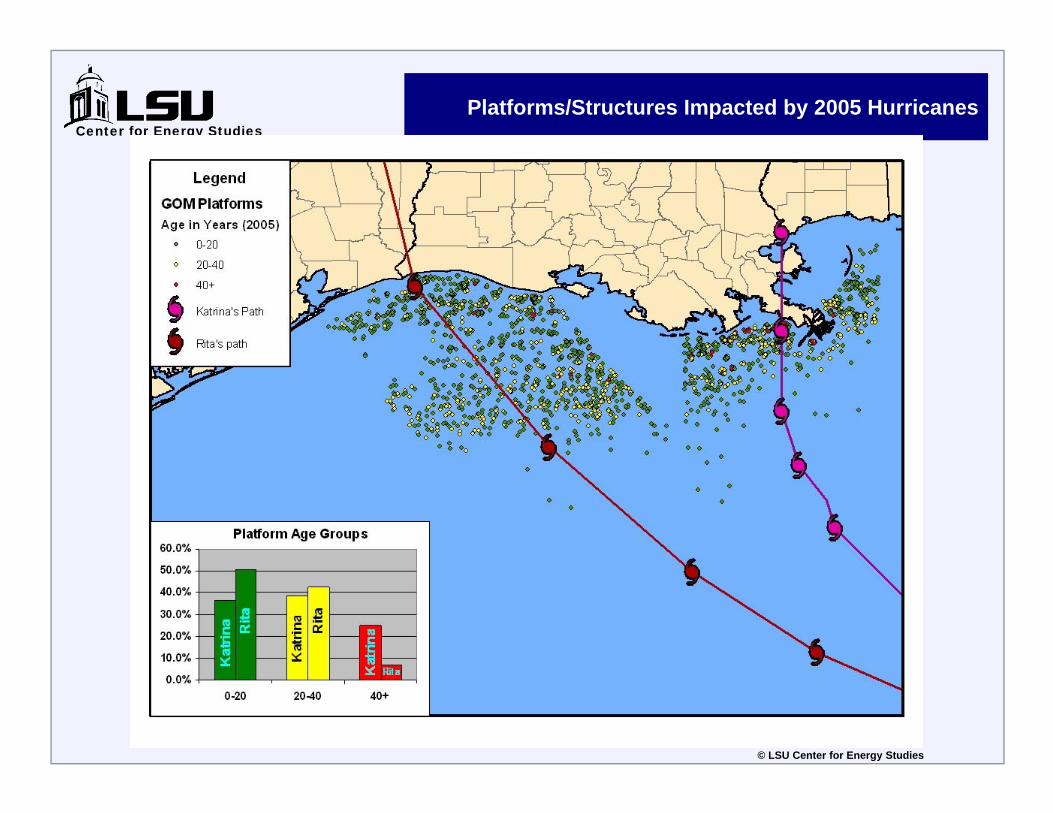
Center for Energy StudiesPlatforms/Structures Impacted by 2005 Hurricanes
© LSU Center for Energy Studies
Center for Energy Studies
0%
10%
20%
30%
40%
50%
60%
70%
80%
90%
100%
Landfall 20 40 60 80 100 120 140 160 180 200 220 240 260 280
Katrina/Rita - Crude OilKatrina/Rita - Natural GasPermanent Shut-in Potential - OilPermanent Shut-in Potential - Gas
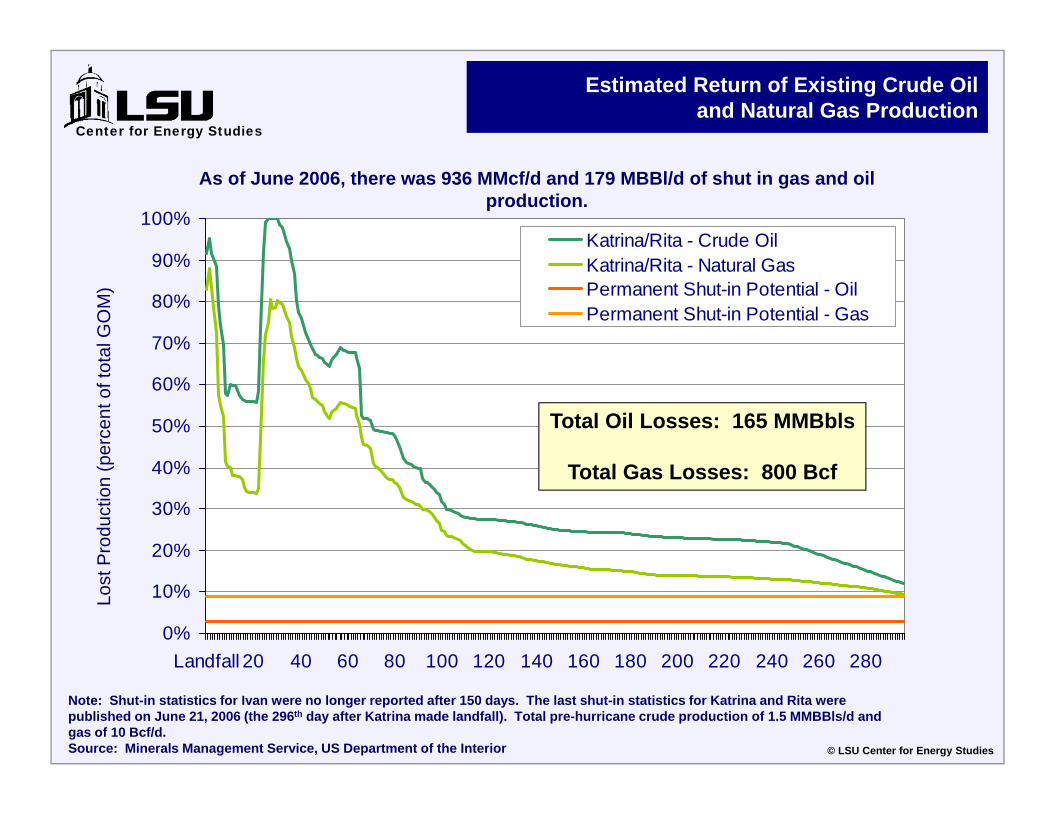
Estimated Return of Existing Crude Oiland Natural Gas Production
As of June 2006, there was 936 MMcf/d and 179 MBBl/d of shut in gas and oil production.
© LSU Center for Energy Studies
Note: Shut-in statistics for Ivan were no longer reported after 150 days. The last shut-in statistics for Katrina and Rita were published on June 21, 2006 (the 296th day after Katrina made landfall). Total pre-hurricane crude production of 1.5 MMBBls/d and gas of 10 Bcf/d.Source: Minerals Management Service, US Department of the Interior
Lost
Pro
duct
ion
(per
cent
of t
otal
GO
M)
Total Oil Losses: 165 MMBbls
Total Gas Losses: 800 Bcf
Center for Energy Studies
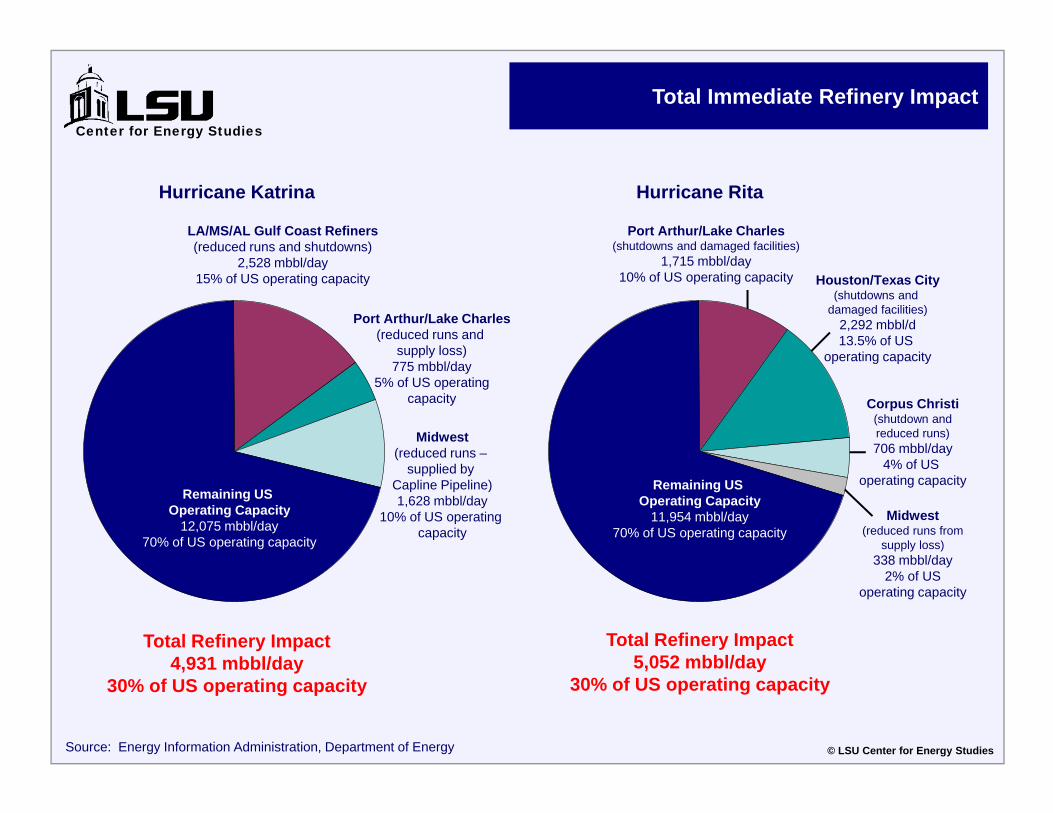
Total Immediate Refinery Impact
LA/MS/AL Gulf Coast Refiners(reduced runs and shutdowns)
2,528 mbbl/day15% of US operating capacity
Port Arthur/Lake Charles(reduced runs and
supply loss)775 mbbl/day
5% of US operatingcapacity
Total Refinery Impact4,931 mbbl/day
30% of US operating capacity
Remaining US Operating Capacity
12,075 mbbl/day70% of US operating capacity
Source: Energy Information Administration, Department of Energy
Midwest(reduced runs –
supplied by Capline Pipeline)1,628 mbbl/day
10% of US operating capacity
Port Arthur/Lake Charles(shutdowns and damaged facilities)
1,715 mbbl/day10% of US operating capacity Houston/Texas City
(shutdowns and damaged facilities)
2,292 mbbl/d13.5% of US
operating capacity
Corpus Christi(shutdown andreduced runs)706 mbbl/day
4% of US operating capacity
Midwest(reduced runs from
supply loss)338 mbbl/day
2% of USoperating capacity
Remaining US Operating Capacity
11,954 mbbl/day70% of US operating capacity
Total Refinery Impact5,052 mbbl/day
30% of US operating capacity
Hurricane Katrina Hurricane Rita
© LSU Center for Energy Studies
Center for Energy Studies
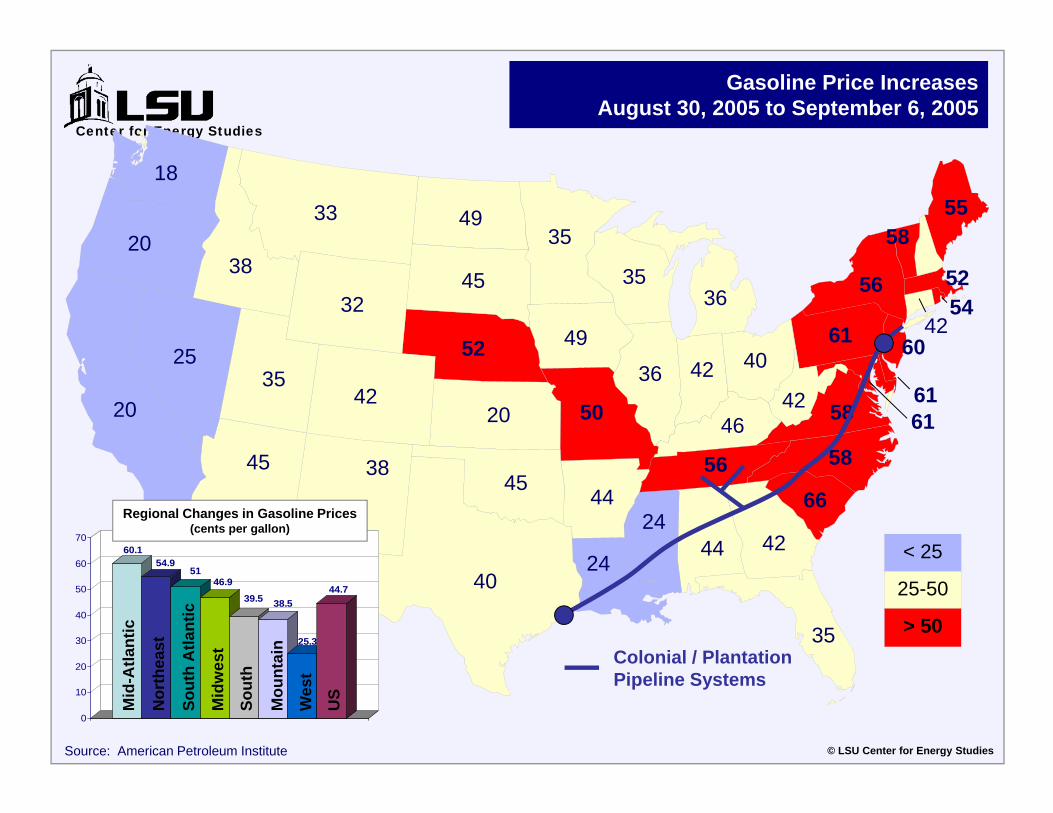
Source: American Petroleum Institute
Gasoline Price IncreasesAugust 30, 2005 to September 6, 2005
20
25
20
18
45
35
38
33
32
42
38
40
45
20
52
45
4935
49
50
3536
36 42 40
4246
5666
58
58 6161
61 60
56
5855
42
5254
< 25
25-50
> 50Colonial / Plantation Pipeline Systems
60.154.9
5146.9
39.5 38.5
25.3
44.7
0
10
20
30
40
50
60
70
Mid
-Atla
ntic
Nor
thea
st
Sout
h A
tlant
ic
Mid
wes
t
Sout
h
Mou
ntai
n
Wes
t
US
Regional Changes in Gasoline Prices(cents per gallon)
35
4244
44
24
24
© LSU Center for Energy Studies
Center for Energy Studies
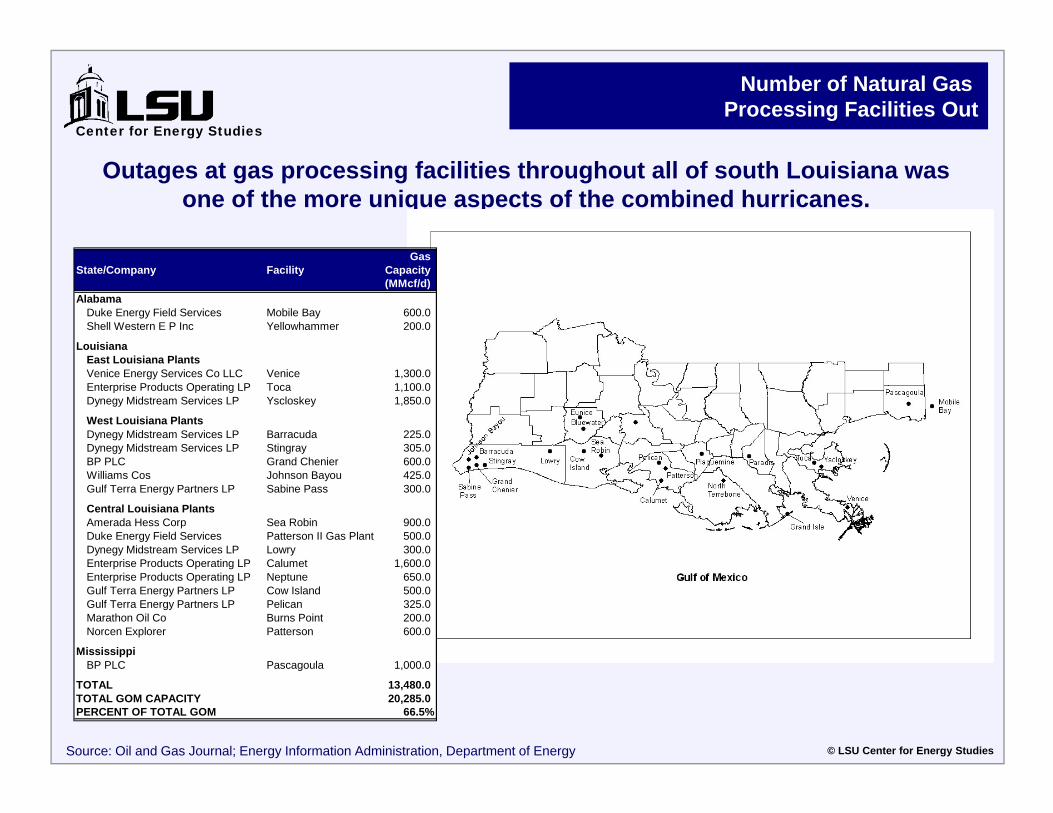
Number of Natural Gas Processing Facilities Out
Source: Oil and Gas Journal; Energy Information Administration, Department of Energy
Outages at gas processing facilities throughout all of south Louisiana was one of the more unique aspects of the combined hurricanes.
© LSU Center for Energy Studies
GasState/Company Facility Capacity
(MMcf/d)Alabama
Duke Energy Field Services Mobile Bay 600.0 Shell Western E P Inc Yellowhammer 200.0
LouisianaEast Louisiana PlantsVenice Energy Services Co LLC Venice 1,300.0 Enterprise Products Operating LP Toca 1,100.0 Dynegy Midstream Services LP Yscloskey 1,850.0
West Louisiana PlantsDynegy Midstream Services LP Barracuda 225.0 Dynegy Midstream Services LP Stingray 305.0 BP PLC Grand Chenier 600.0 Williams Cos Johnson Bayou 425.0 Gulf Terra Energy Partners LP Sabine Pass 300.0
Central Louisiana PlantsAmerada Hess Corp Sea Robin 900.0 Duke Energy Field Services Patterson II Gas Plant 500.0 Dynegy Midstream Services LP Lowry 300.0 Enterprise Products Operating LP Calumet 1,600.0 Enterprise Products Operating LP Neptune 650.0 Gulf Terra Energy Partners LP Cow Island 500.0 Gulf Terra Energy Partners LP Pelican 325.0 Marathon Oil Co Burns Point 200.0 Norcen Explorer Patterson 600.0
MississippiBP PLC Pascagoula 1,000.0
TOTAL 13,480.0TOTAL GOM CAPACITY 20,285.0PERCENT OF TOTAL GOM 66.5%
Center for Energy Studies
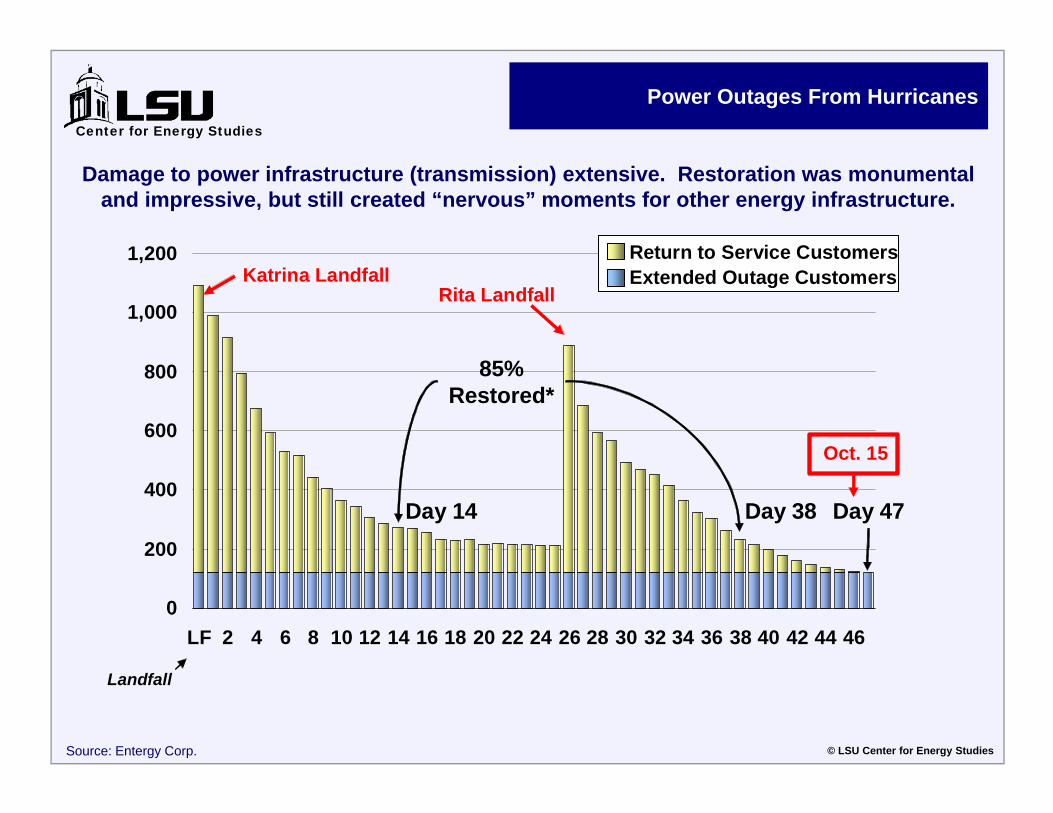
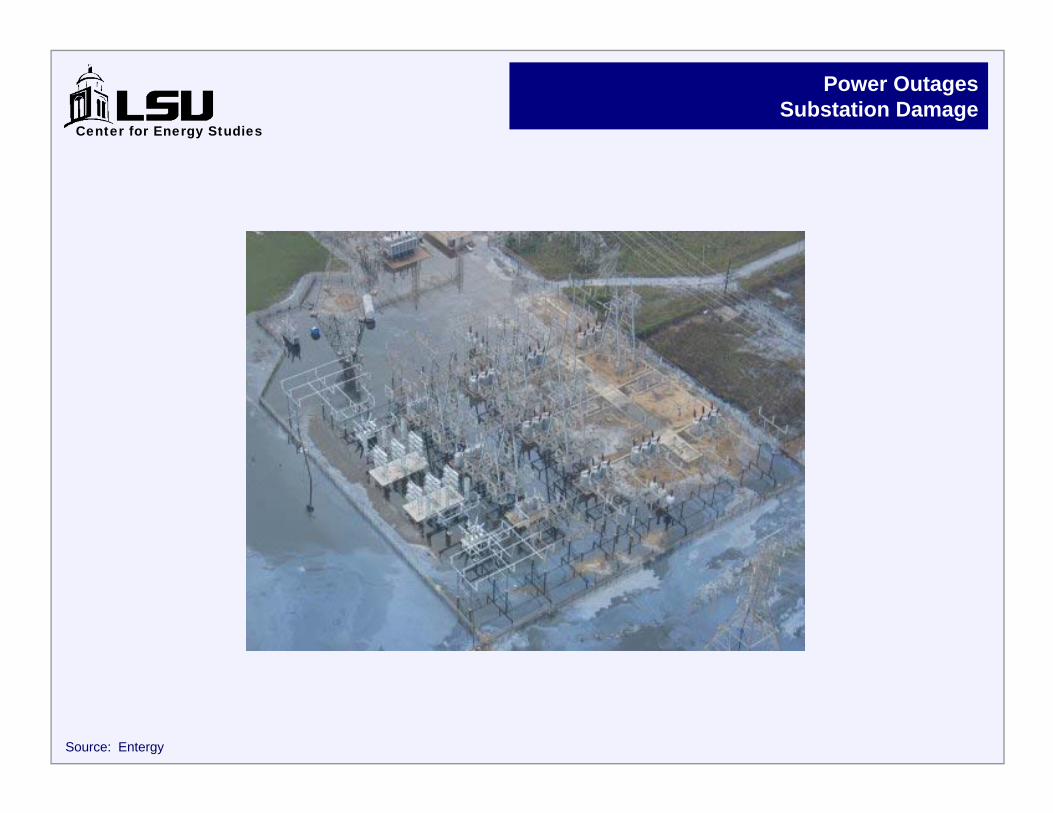
Power Outages From Hurricanes
Source: Entergy Corp.
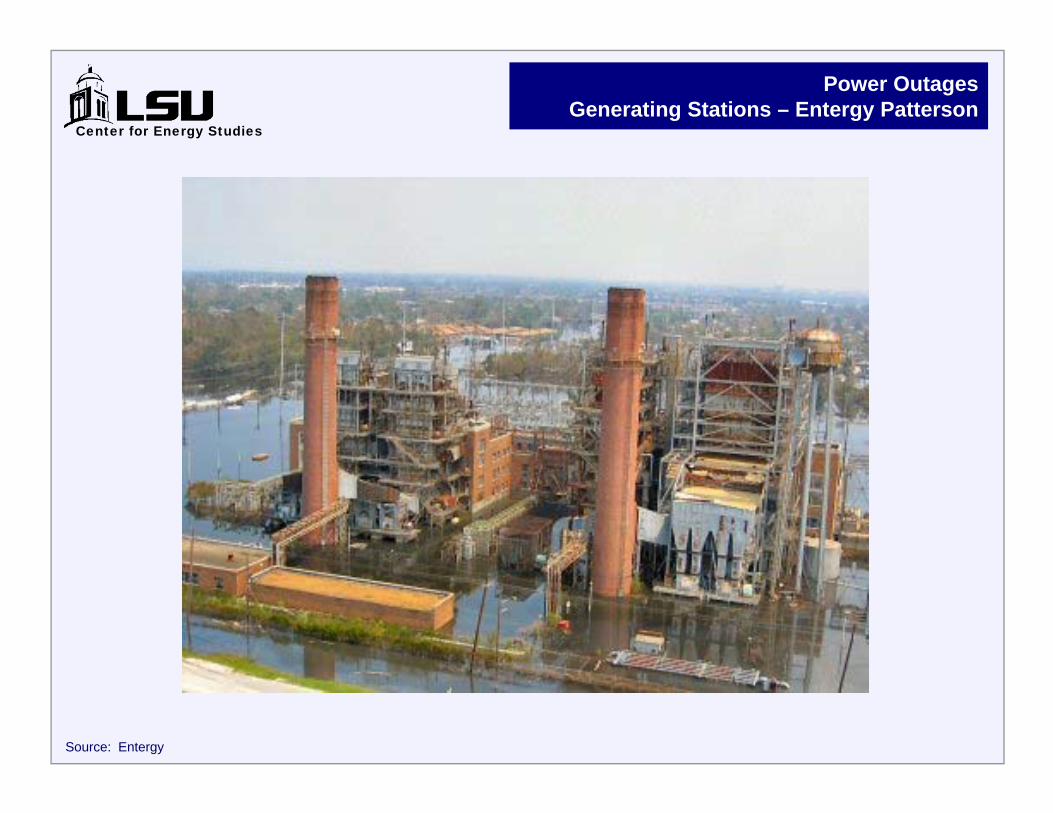
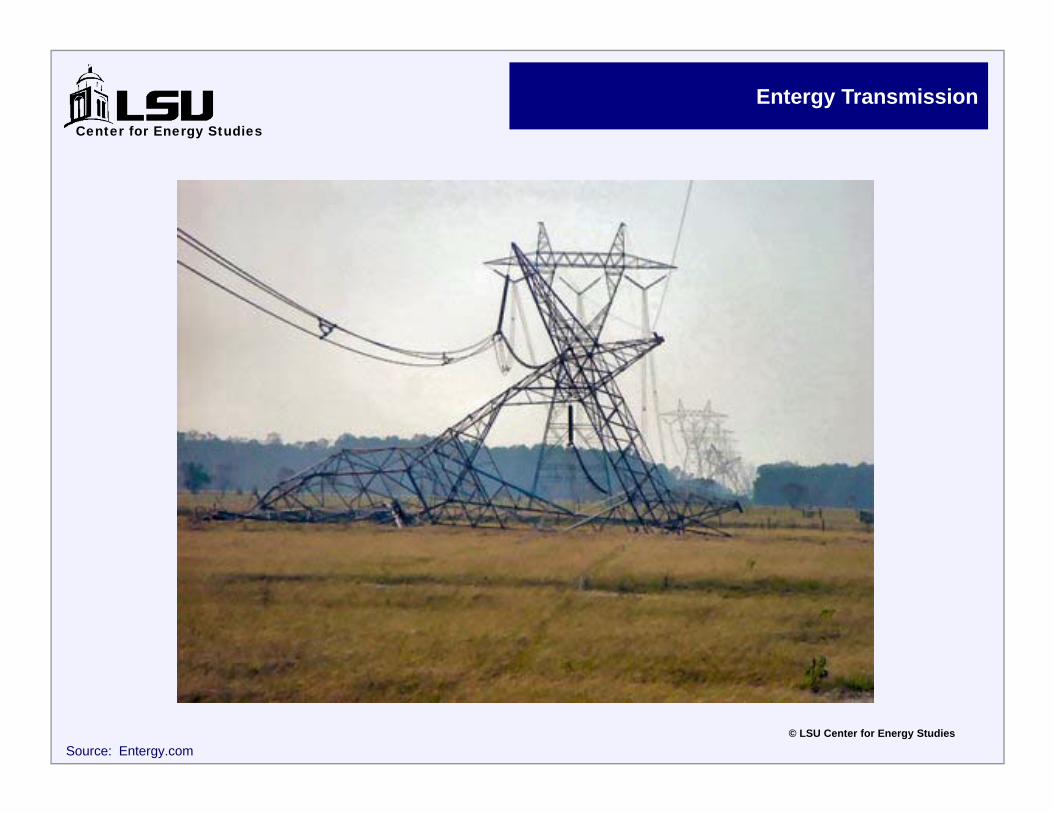
Damage to power infrastructure (transmission) extensive. Restoration was monumental and impressive, but still created “nervous” moments for other energy infrastructure.
© LSU Center for Energy Studies
0
200
400
600
800
1,000
1,200
LF 2 4 6 8 10 12 14 16 18 20 22 24 26 28 30 32 34 36 38 40 42 44 46
Katrina LandfallRita Landfall
85% Restored*
Day 14 Day 38
Return to Service CustomersExtended Outage Customers
Day 47
Landfall
Oct. 15
Center for Energy Studies
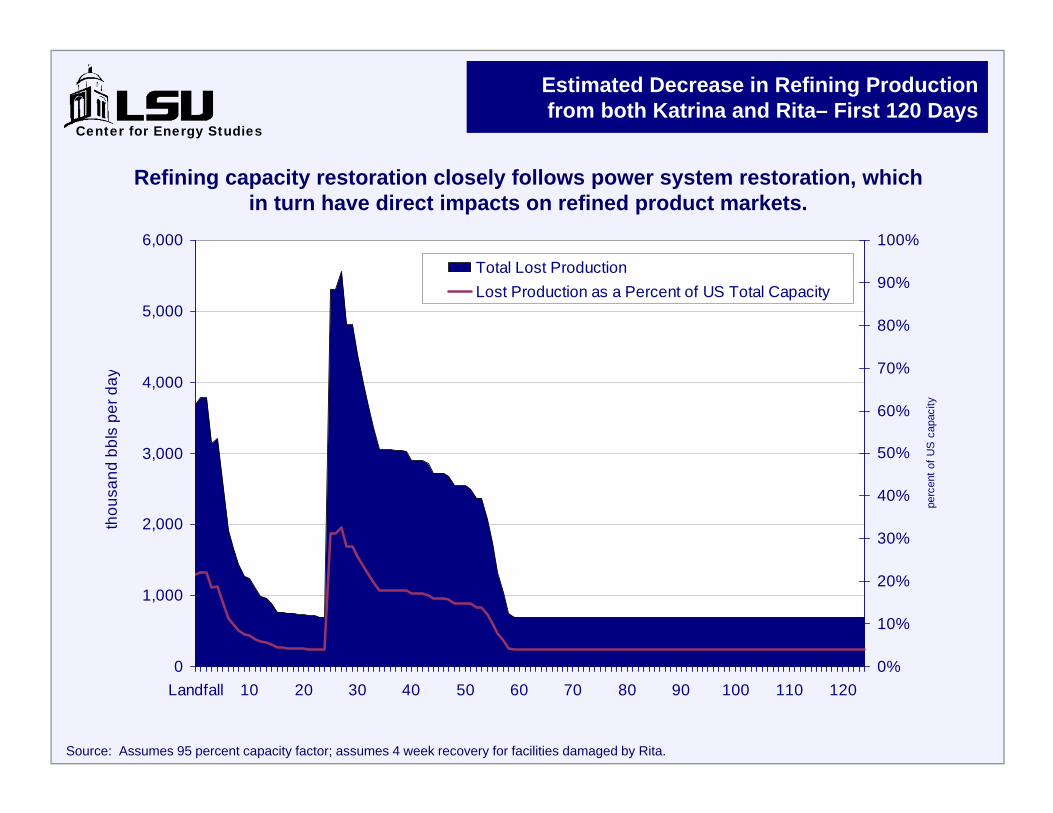
Estimated Decrease in Refining Productionfrom both Katrina and Rita– First 120 Days
0
1,000
2,000
3,000
4,000
5,000
6,000
Landfall 10 20 30 40 50 60 70 80 90 100 110 120
thou
sand
bbl
s pe
r day
0%
10%
20%
30%
40%
50%
60%
70%
80%
90%
100%
perc
ent o
f US
cap
acity
Total Lost ProductionLost Production as a Percent of US Total Capacity
Refining capacity restoration closely follows power system restoration, which in turn have direct impacts on refined product markets.
Source: Assumes 95 percent capacity factor; assumes 4 week recovery for facilities damaged by Rita.
Center for Energy Studies
Examples of Energy Infrastructure Damage
© LSU Center for Energy Studies
Center for Energy Studies
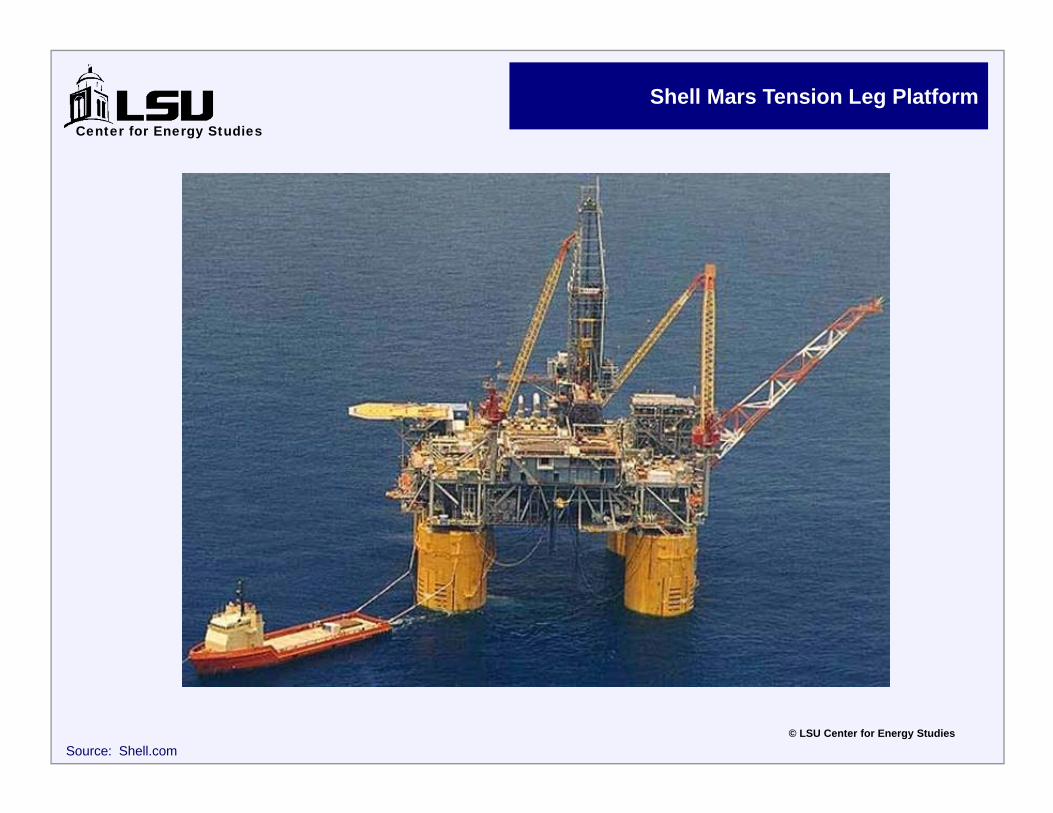
Shell Mars Tension Leg Platform
Source: Shell.com© LSU Center for Energy Studies
Center for Energy Studies
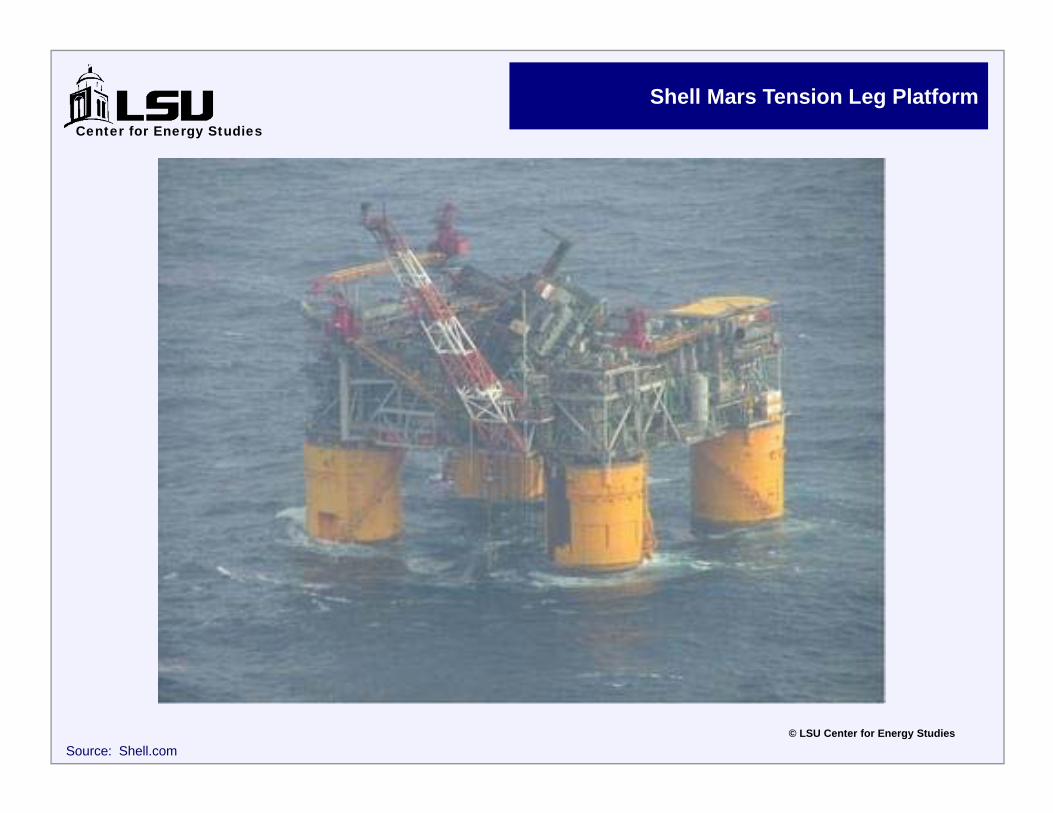
Shell Mars Tension Leg Platform
Source: Shell.com© LSU Center for Energy Studies
Center for Energy Studies
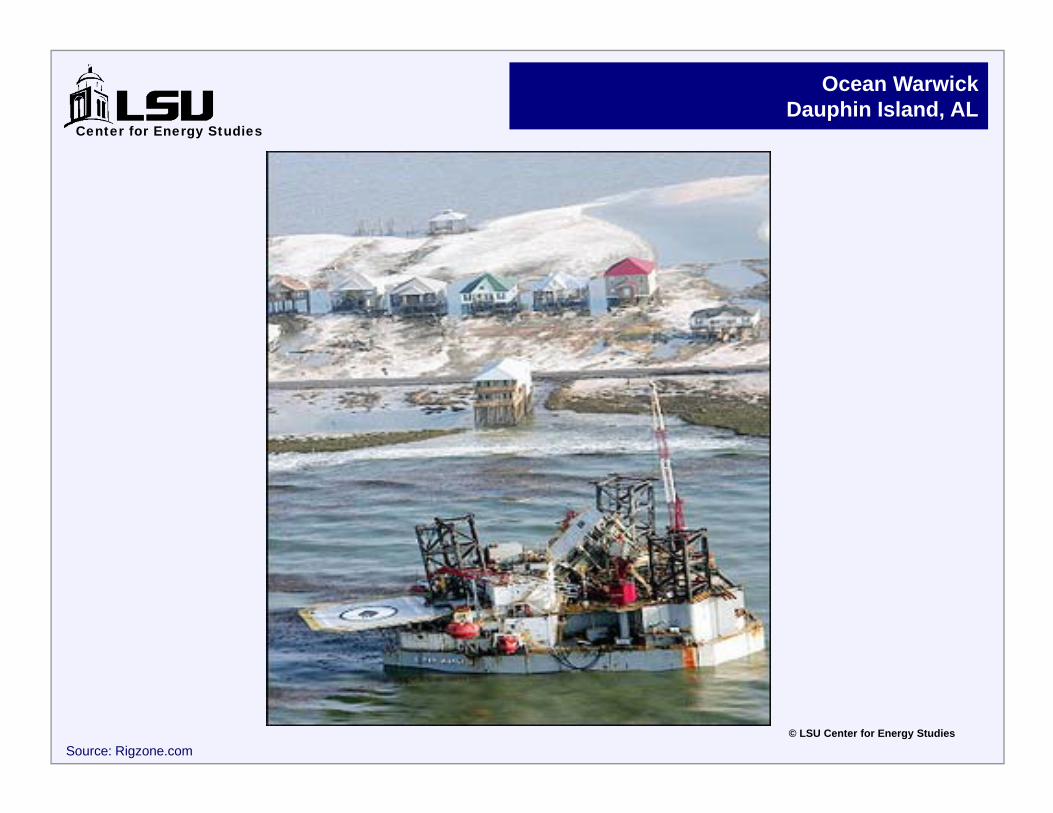
Ocean WarwickDauphin Island, AL
© LSU Center for Energy Studies
Source: Rigzone.com
Center for Energy Studies
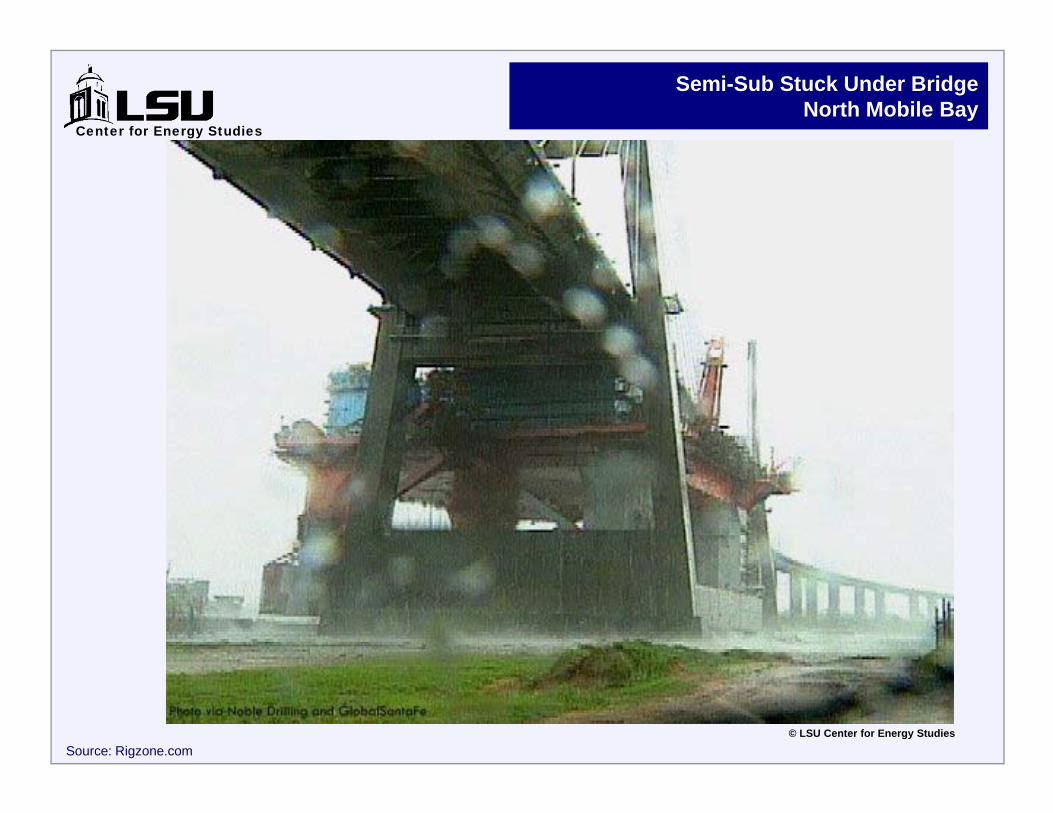
Semi-Sub Stuck Under BridgeNorth Mobile Bay
© LSU Center for Energy Studies
Source: Rigzone.com
Center for Energy Studies
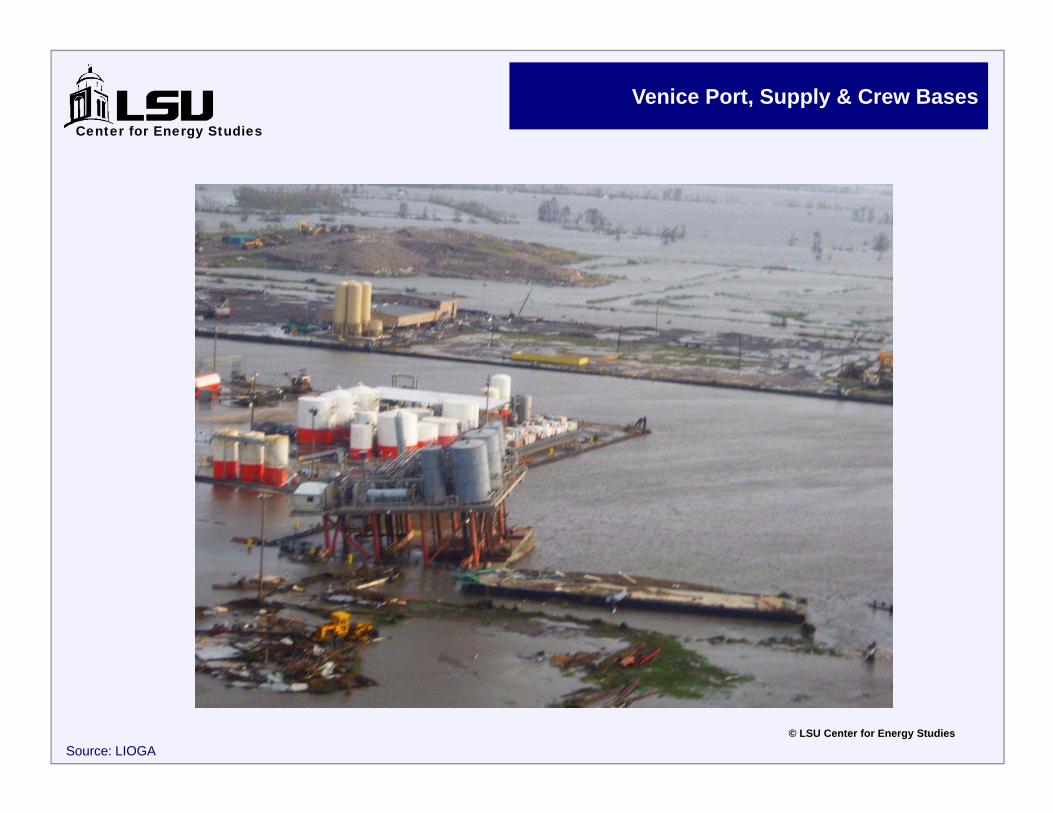
Venice Port, Supply & Crew Bases
© LSU Center for Energy Studies
Source: LIOGA
Center for Energy Studies
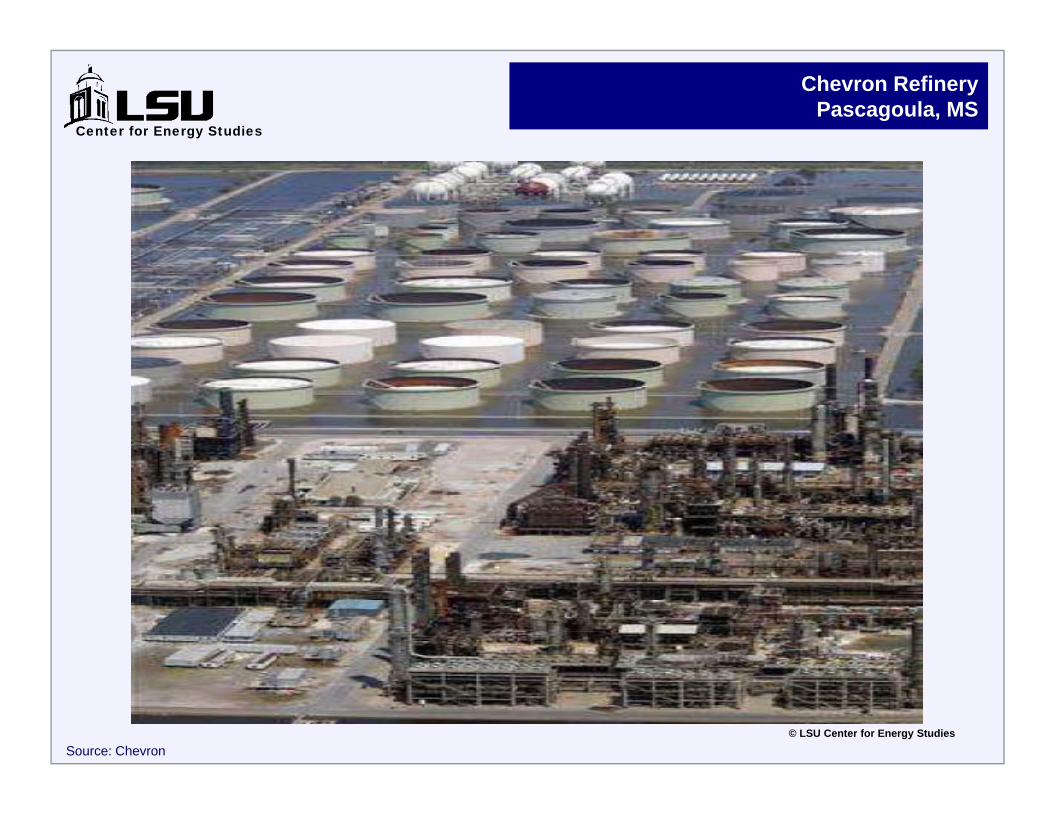
Chevron RefineryPascagoula, MS
© LSU Center for Energy Studies
Source: Chevron
Center for Energy Studies
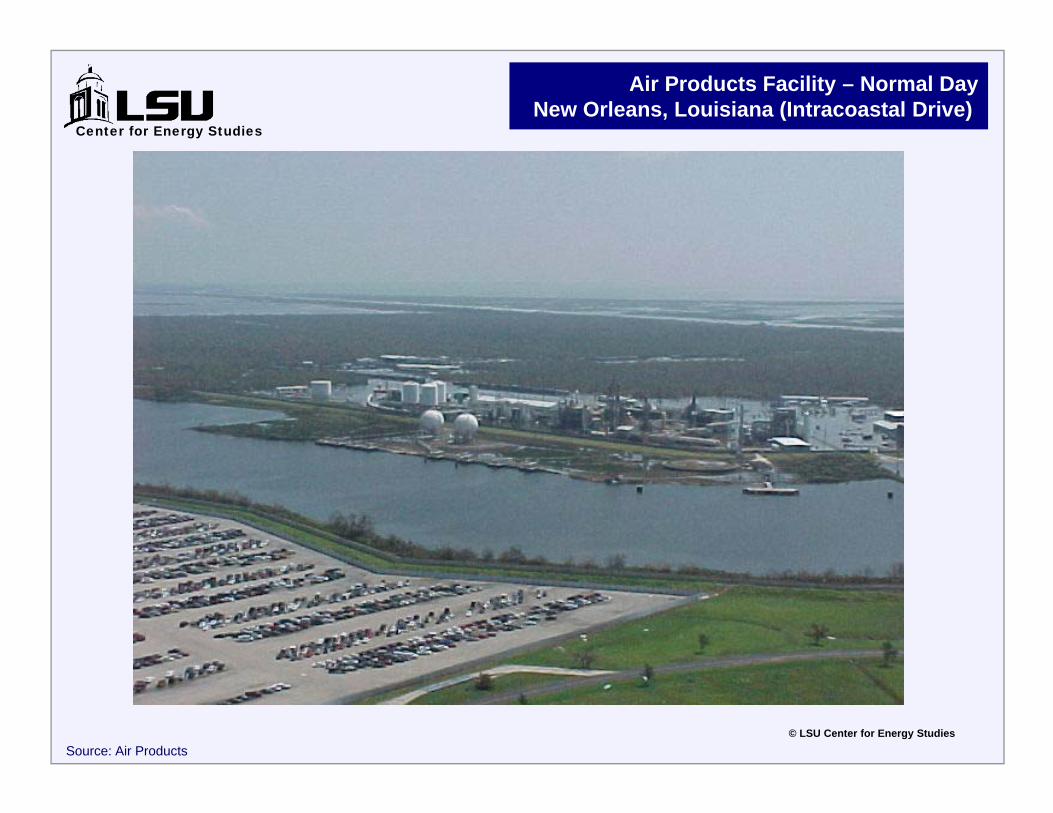
Air Products Facility – Normal DayNew Orleans, Louisiana (Intracoastal Drive)
© LSU Center for Energy Studies
Source: Air Products
Center for Energy Studies
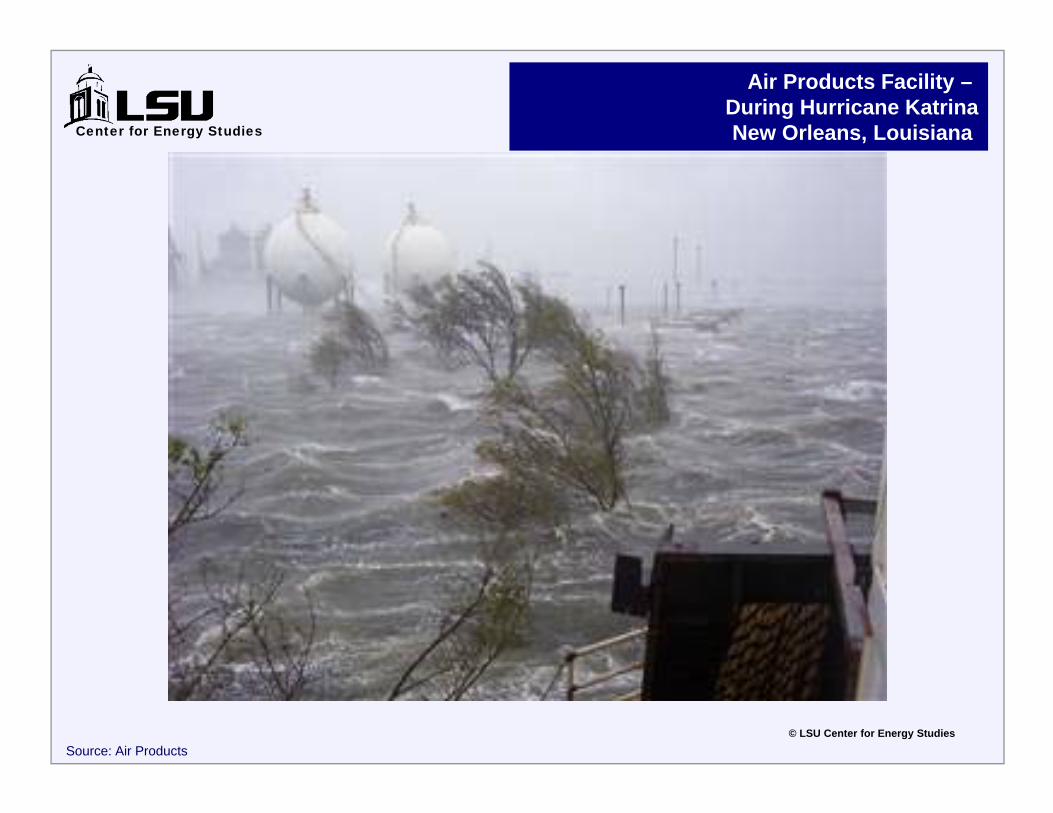
Air Products Facility –During Hurricane KatrinaNew Orleans, Louisiana
© LSU Center for Energy Studies
Source: Air Products
Center for Energy Studies
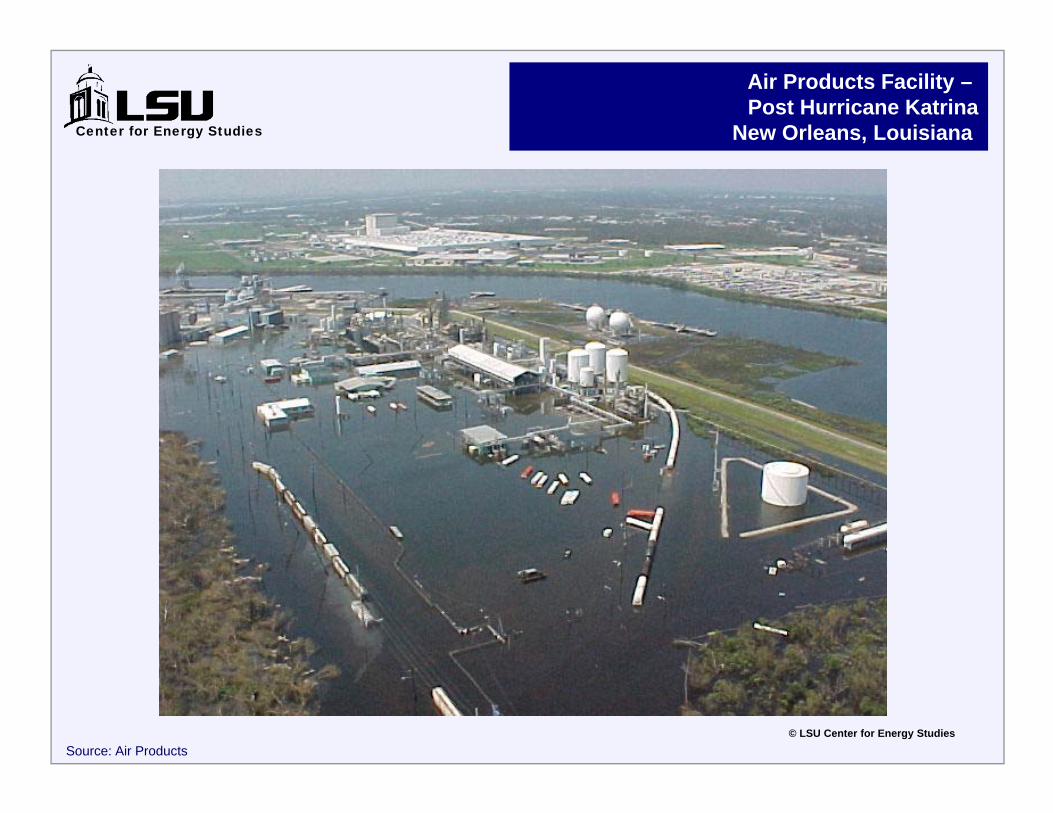
Air Products Facility –Post Hurricane Katrina
New Orleans, Louisiana
© LSU Center for Energy Studies
Source: Air Products
Center for Energy Studies
Power OutagesGenerating Stations – Entergy Patterson
Source: Entergy
Center for Energy Studies
Power OutagesSubstation Damage
Source: Entergy

Center for Energy Studies
Then,Along Comes Rita
© LSU Center for Energy Studies
Center for Energy Studies
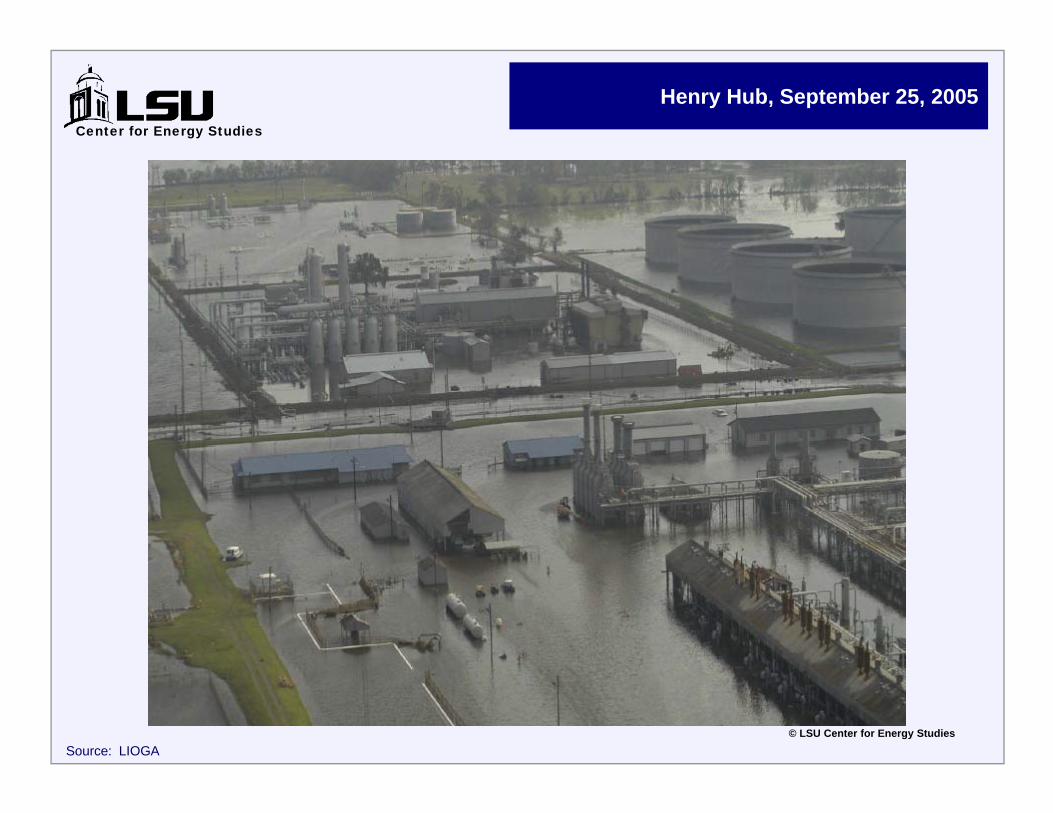
Henry Hub, September 25, 2005
Source: LIOGA© LSU Center for Energy Studies
Center for Energy Studies
Entergy Transmission
Source: Entergy.com© LSU Center for Energy Studies
Center for Energy Studies
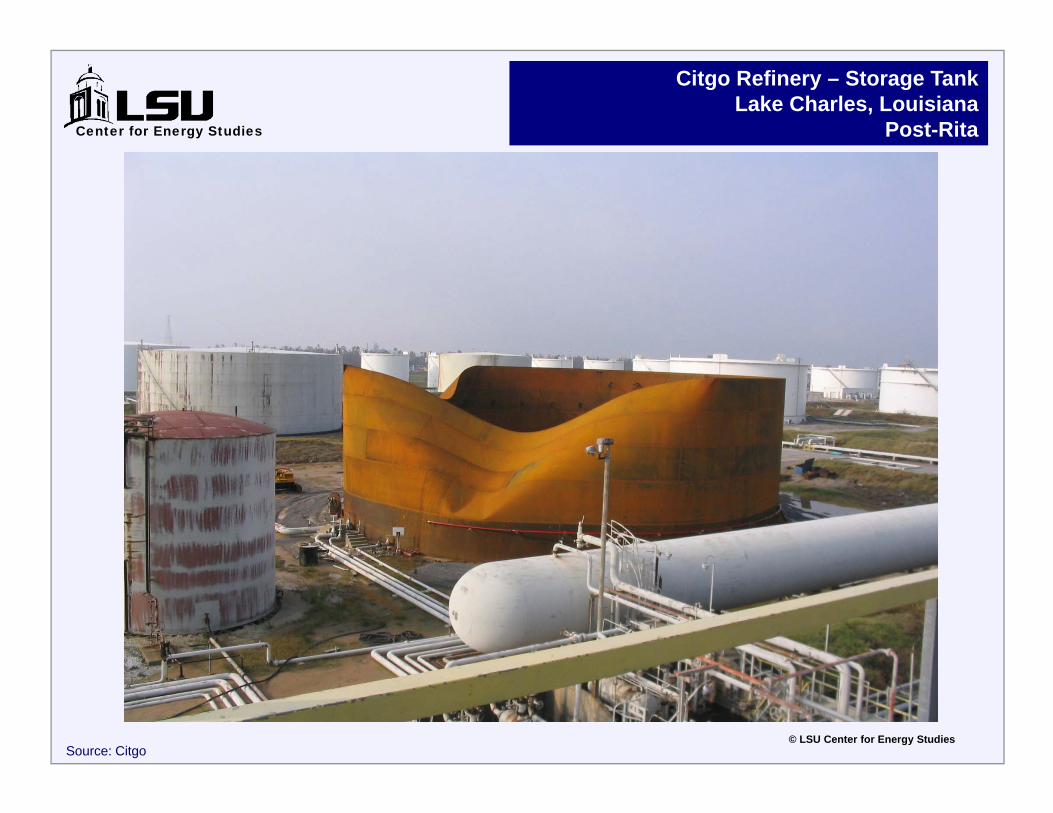
Citgo Refinery – Storage TankLake Charles, Louisiana
Post-Rita
© LSU Center for Energy StudiesSource: Citgo
Center for Energy Studies
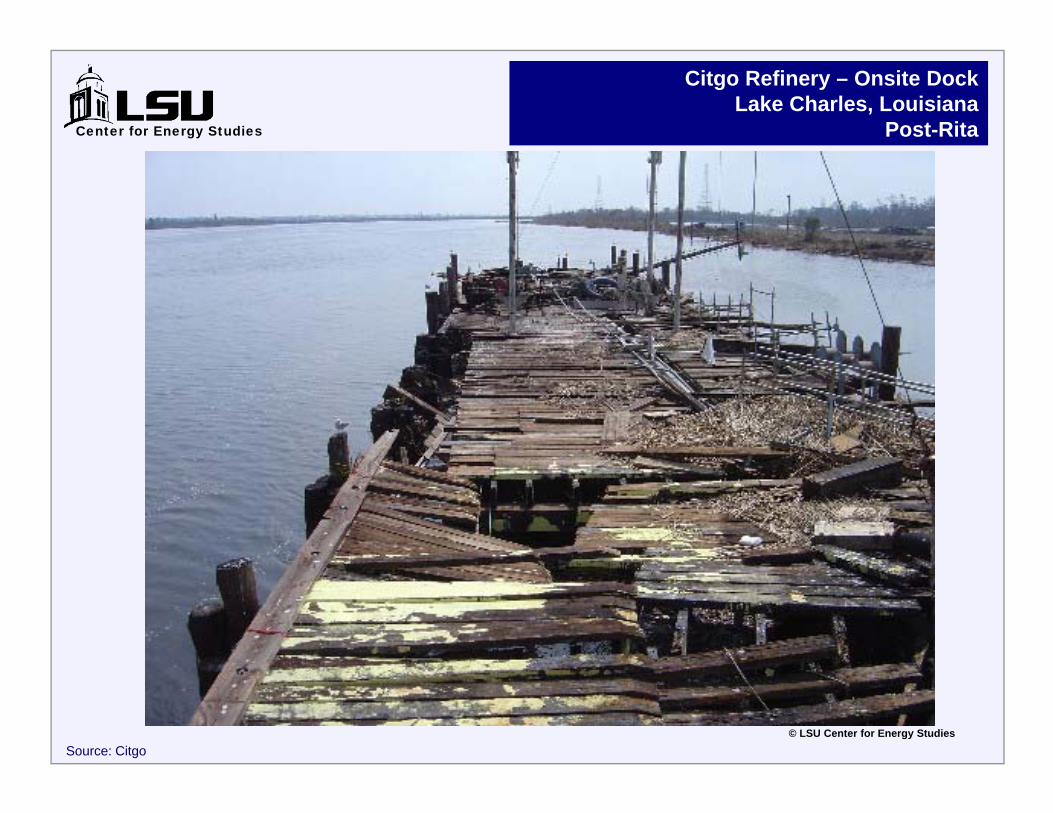
Citgo Refinery – Onsite DockLake Charles, Louisiana
Post-Rita
© LSU Center for Energy Studies
Source: Citgo
Center for Energy Studies
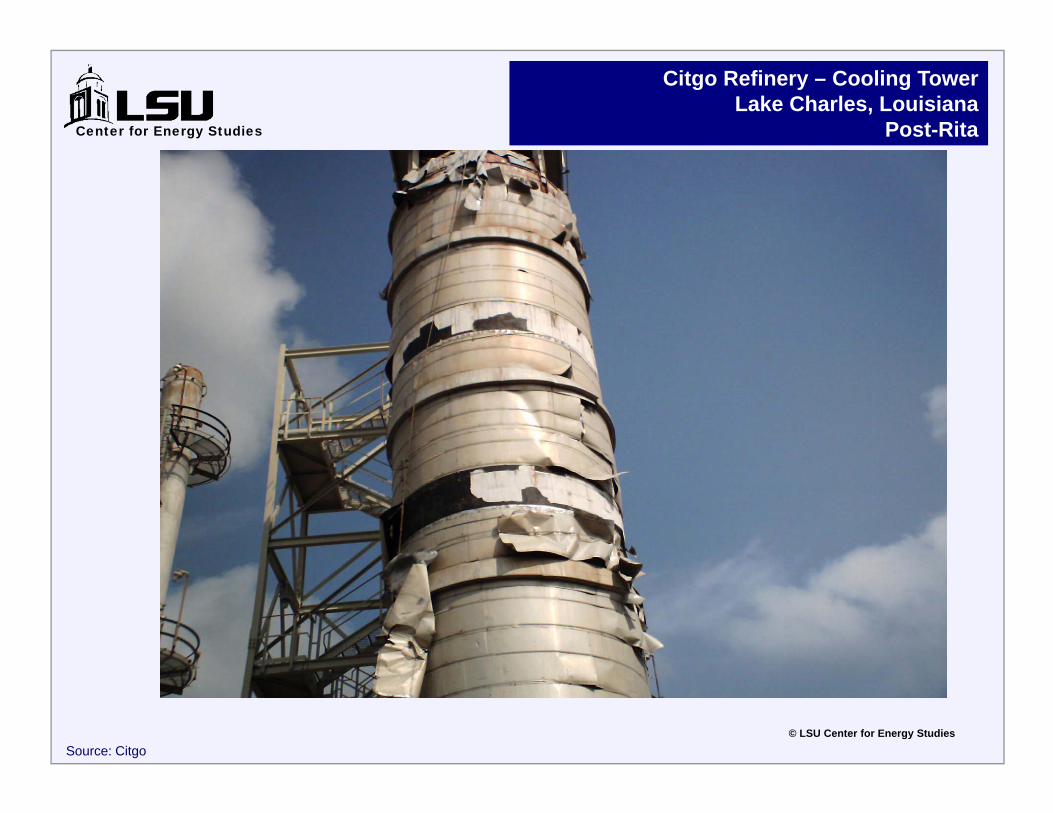
Citgo Refinery – Cooling TowerLake Charles, Louisiana
Post-Rita
© LSU Center for Energy Studies
Source: Citgo
Center for Energy Studies
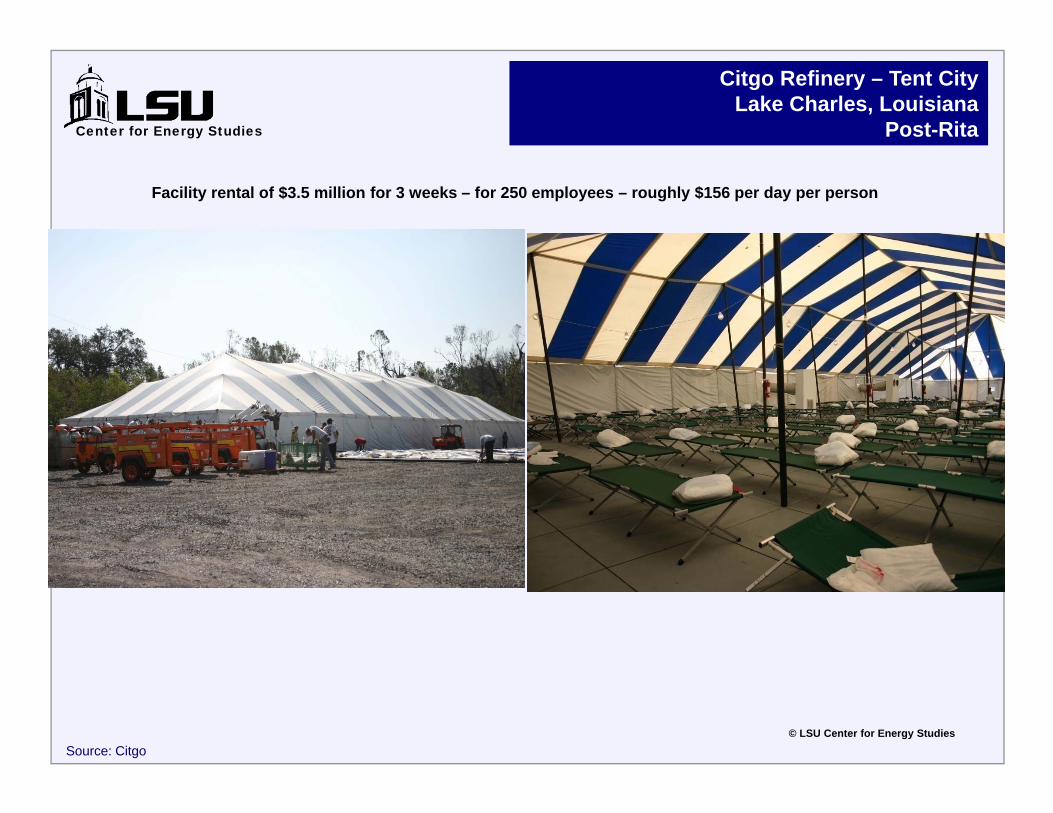
Citgo Refinery – Tent CityLake Charles, Louisiana
Post-Rita
© LSU Center for Energy Studies
Source: Citgo
Facility rental of $3.5 million for 3 weeks – for 250 employees – roughly $156 per day per person
Center for Energy Studies
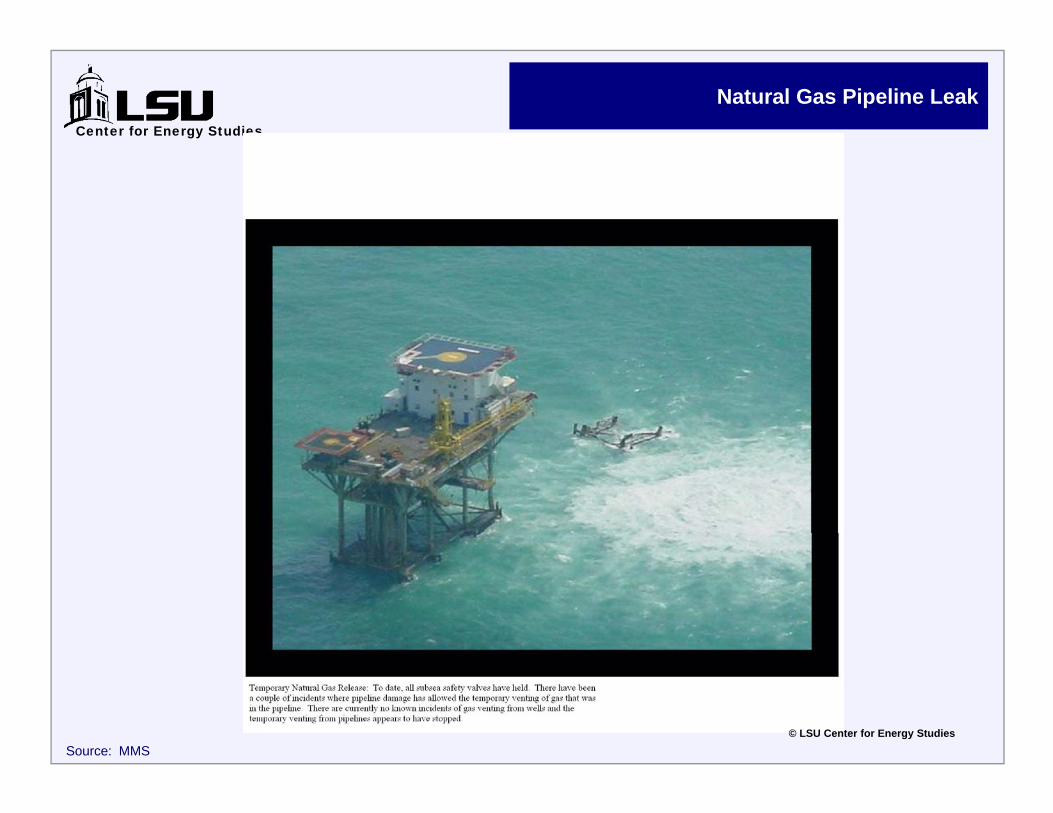
Natural Gas Pipeline Leak
Source: MMS© LSU Center for Energy Studies

Center for Energy Studies
Chevron Typhoon TLP
© LSU Center for Energy Studies
Source: Chevron, Rigzone.com
Center for Energy Studies
Energy Capacity Offline:Current and Forecast
Center for Energy Studies
0
1,000
2,000
3,000
4,000
5,000
6,000
7,000
Q3 2005 Q4 2005 Q1 2006 Q2 2006 Q3 2006 Q4 2006
MB
bls
per d
ay
EIA Short-Term Outlook in September 2005Current CES OutlookEIA Actual (Q3 & Q4 2005)EIA Short-Term Outlook in April 2006CES Outlook from 9/28/05
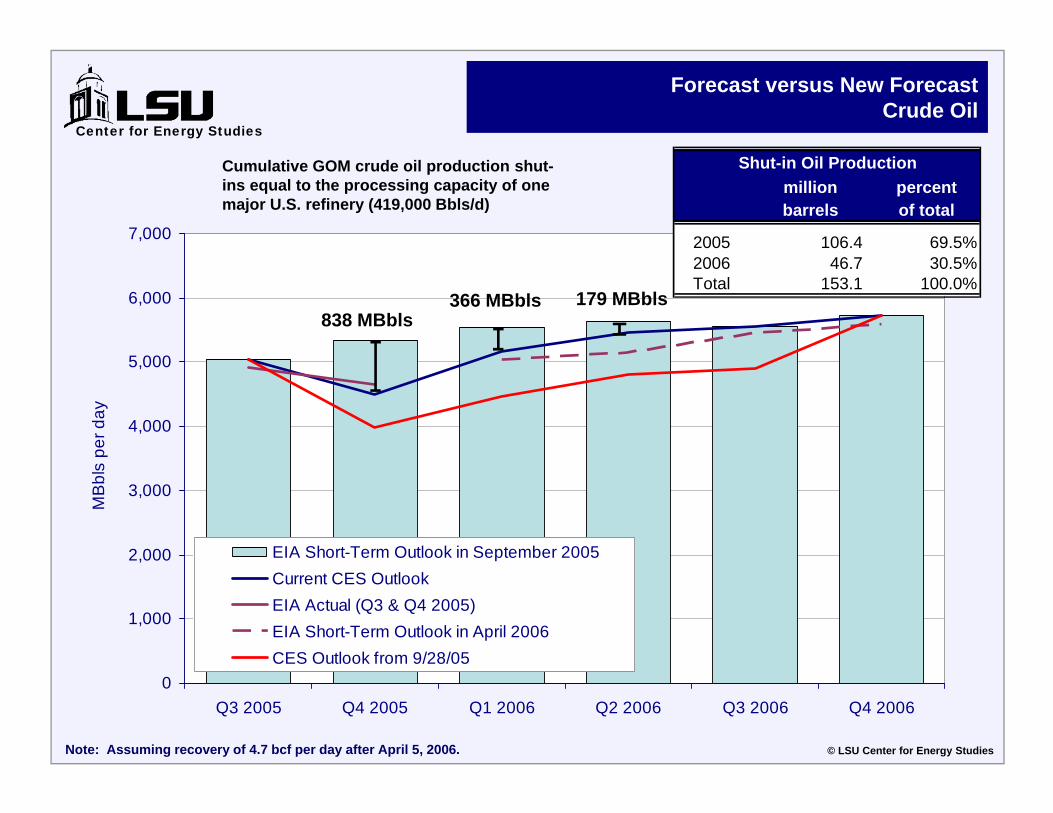
Forecast versus New ForecastCrude Oil
Note: Assuming recovery of 4.7 bcf per day after April 5, 2006.
838 MBbls366 MBbls 179 MBbls
© LSU Center for Energy Studies
million percentbarrels of total
2005 106.4 69.5%2006 46.7 30.5%Total 153.1 100.0%
Shut-in Oil ProductionCumulative GOM crude oil production shut-ins equal to the processing capacity of one major U.S. refinery (419,000 Bbls/d)
Center for Energy Studies
0
1,000
2,000
3,000
4,000
5,000
6,000
Q3 2005 Q4 2005 Q1 2006 Q2 2006 Q3 2006 Q4 2006
bcf
EIA Short-Term Outlook in September 2005Current CES OutlookEIA Actual (Q3 & Q4 2005)EIA Short-Term Outlook in April 2006CES Outlook from 9/28/05
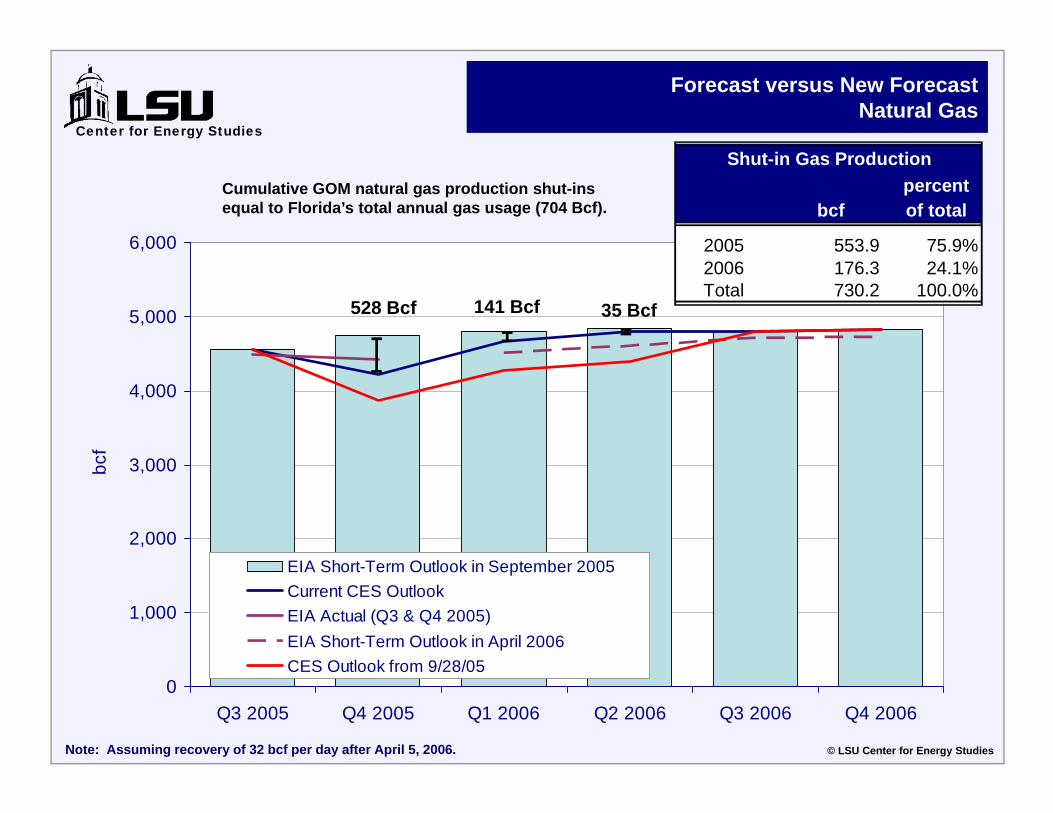
Note: Assuming recovery of 32 bcf per day after April 5, 2006.
Forecast versus New ForecastNatural Gas
528 Bcf 141 Bcf
© LSU Center for Energy Studies
35 Bcf
percentbcf of total
2005 553.9 75.9%2006 176.3 24.1%Total 730.2 100.0%
Shut-in Gas ProductionCumulative GOM natural gas production shut-ins equal to Florida’s total annual gas usage (704 Bcf).
Center for Energy Studies
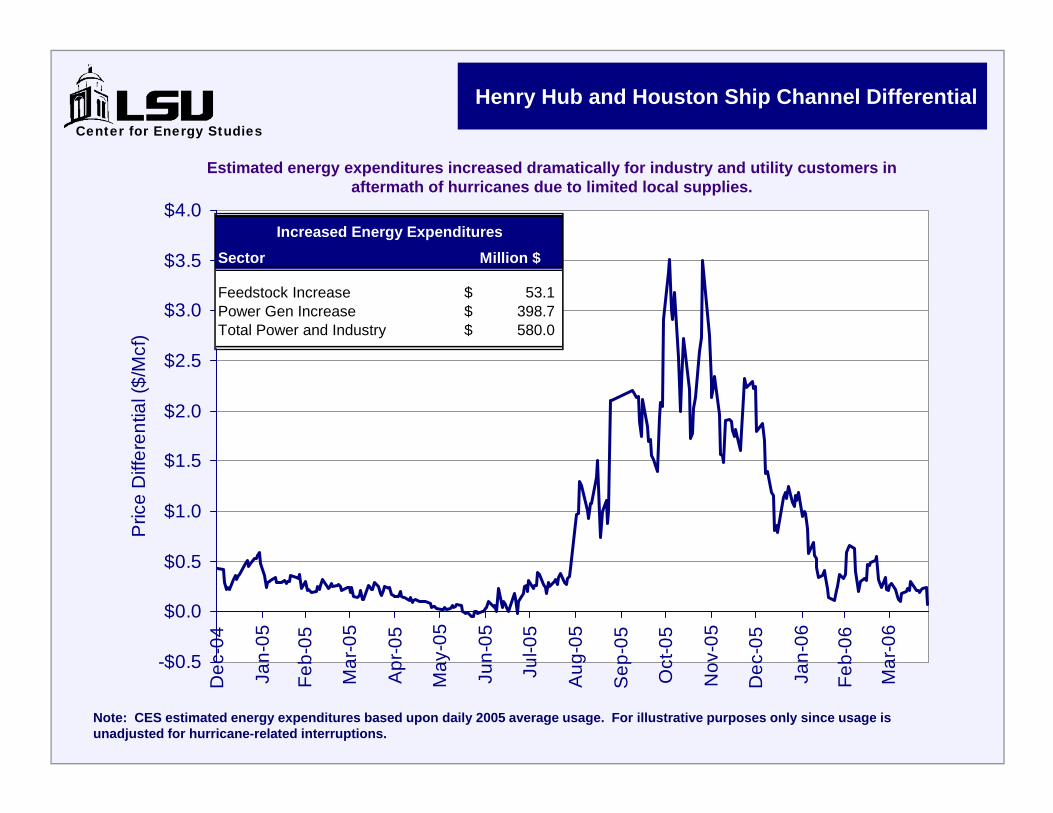
Henry Hub and Houston Ship Channel Differential
Estimated energy expenditures increased dramatically for industry and utility customers in aftermath of hurricanes due to limited local supplies.
-$0.5
$0.0
$0.5
$1.0
$1.5
$2.0
$2.5
$3.0
$3.5
$4.0D
ec-0
4
Jan-
05
Feb-
05
Mar
-05
Apr
-05
May
-05
Jun-
05
Jul-0
5
Aug
-05
Sep
-05
Oct
-05
Nov
-05
Dec
-05
Jan-
06
Feb-
06
Mar
-06
Pric
e D
iffer
entia
l ($/
Mcf
)
Sector Million $
Feedstock Increase 53.1$ Power Gen Increase 398.7$ Total Power and Industry 580.0$
Increased Energy Expenditures
Note: CES estimated energy expenditures based upon daily 2005 average usage. For illustrative purposes only since usage is unadjusted for hurricane-related interruptions.
Center for Energy Studies
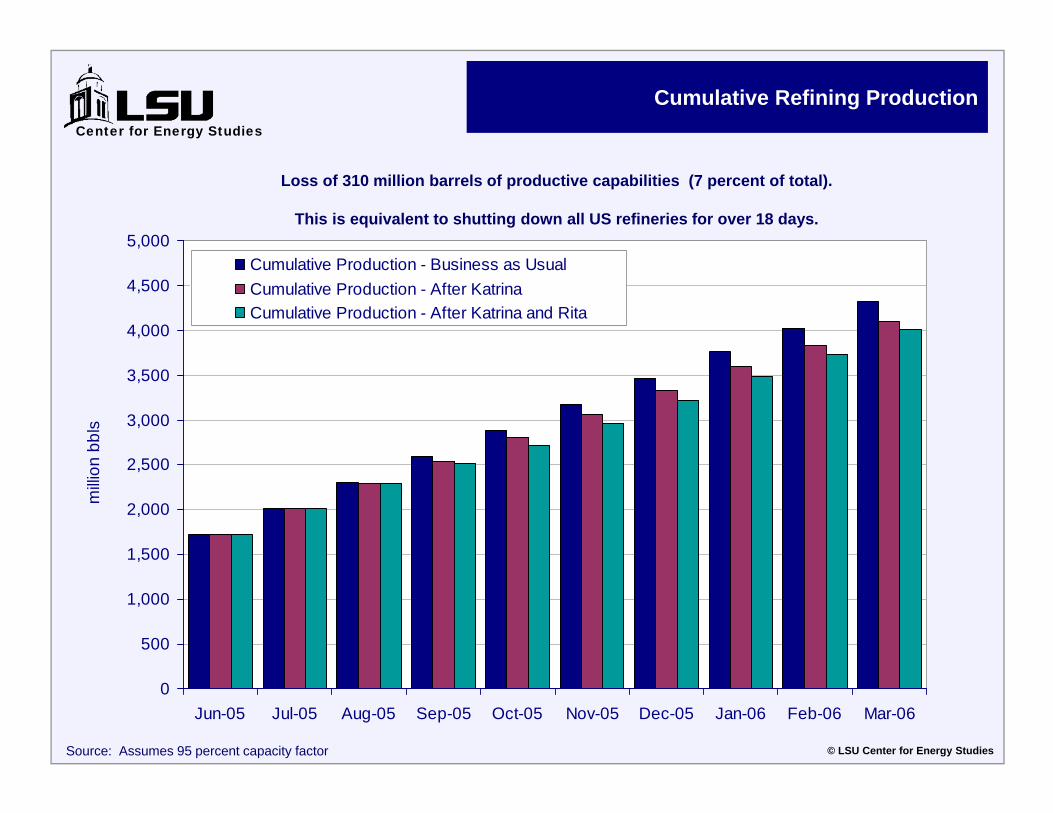
Cumulative Refining Production
Source: Assumes 95 percent capacity factor
0
500
1,000
1,500
2,000
2,500
3,000
3,500
4,000
4,500
5,000
Jun-05 Jul-05 Aug-05 Sep-05 Oct-05 Nov-05 Dec-05 Jan-06 Feb-06 Mar-06
milli
on b
bls
Cumulative Production - Business as UsualCumulative Production - After KatrinaCumulative Production - After Katrina and Rita
Loss of 310 million barrels of productive capabilities (7 percent of total).
This is equivalent to shutting down all US refineries for over 18 days.
© LSU Center for Energy Studies
Center for Energy Studies
Conclusions
GOM region has played an important historic role in the development of energy infrastructure. Not likely to change despite hurricane activity.
Hurricanes proved that the region, its workforce, and the underlying assets are resilient and can be restored quickly, even in the face of two natural disasters.
Some concerns about “diversifying” energy infrastructure in the region. Given current economic challenges concern is that diversity in some infrastructure areas could “diversify” to other parts of the world, which actually increase US vulnerability, not decrease it.
Man-made incidents and catastrophic incidents should not be taken lightly -- but the “stochastic” nature of these events requires a more probabilistic approach to mitigation – more than likely a resiliency as opposed to “hardening” solution.