Embed Size (px)
Citation preview

F E D E R A L R E S E R V E B A N K O F N E W Y O R KP U B L I C I N F O R M A T I O N D E P A R T M E N T
UNDE
RSTA
NDIN
GF E D E R A L
B U D G E T
t h e
DE
FI
CI
T
S
UR
PL
US
RE
VE
NU
ES
S
PE
ND
IN
G

B y E d S t e i n b e r g
P u b l i c I n f o r m a t i o n D e p a r t m e n t
F e d e r a l R e s e r v e B a n k o f N e w Y o r k

This booklet provides
an overview of the basic economic
concepts related to the budget of the
federal government. It discusses the
sources of the government’s revenues,
the nature of the government’s major
expenditures, and some issues
related to the government debt
and surplus or deficit.

B U D G E Tthe
F O O D C L O T H I N G H O U S I N G D E F E N S E S O C I A L
2
The Family Budget If you receive an allowance from your family, or if you havea part-time job, you know that you have to operate withina budget — that is, the amount you can spend is limitedby the size of your income. Similarly, your family has tolive within a budget — that is, the amounts it can spendon food, clothing, housing, entertainment, and other itemsare limited by the size of your family’s income. Of course,for a limited time, you or your family can spend more thanyour income — by borrowing or by dipping into your sav-ings — but you can’t do that on a permanent basis.
The Federal Budget The federal government, too, has to operate within a bud-get. Decisions have to be made as to how much the gov-ernment will spend on each of many items, such asnational defense, Social Security, the FBI, and space explo-ration.
A budget usually applies to a certain period of time. Yourfamily may have a monthly budget, deciding how much tospend each month on food, clothing, housing, etc.; or per-haps it has a yearly budget that includes items such as asummer vacation. The federal government prepares itsbudget for each fiscal year. The fiscal year, the 12-monthperiod used for budgetary purposes, runs from October 1 toSeptember 30. Thus, the 2001 fiscal year runs from Octo-ber 1, 2000, to September 30, 2001.

The preparation of the federal government’s annual bud-get is a complicated process. The steps in the process are
illustrated below, and more information is available onthe Web.1
D I S C U S S I O N Q U E S T I O N
In what ways do you think the federal govern-ment’s preparation of a budget is similar to the
preparation of a family’s budget? In what ways are the processes different?
E N T E R T A I N M E N T . . . L S E C U R I T Y T H E F B I S P A C E
Congress voteson the bills.
Congress voteson the bill.
By the first Monday in February, the President
submits a budget to Congress.
The Appropriations Committee in
each chamber deals with
discretionaryspending issues.
Each Appropriations Committee divides the issues among 13 subcommittees.
Each of the 13 subcommittees produces a bill.
The House Ways and Means,
Senate Finance, and other committees
deal with revenue and entitlement
issues.
M A N D A T O R Y D I S C R E T I O N A R Y
When passed, the bills are submitted to the President
for signature or veto.
Bills must be signedinto law by October 1.
With their input, the Budget Committees
prepare a reconciliation
bill.
In meetings between the House and Senate subcommittees, 13 final bills
are produced.
By April 15 (a target date), the House and Senate must agree on a budget resolution, which establishes
a framework for total spending and revenue.
(controllable*)SPENDING
(uncontrollable*)SPENDING
T H E P R O C E S S B E G I N S :
SenateBudget
HouseBudget
Budget
Resolution
Reconciliation
Bill
1. w
ww
.acc
ess.
gpo.
gov/
usbu
dget
/fy2
001/
guid
e03.
htm
l#Th
eBud
getP
roce
ss
*See a more complete discussion on page 4.
Preparation
of the Federal
Government’s
Annual Budget
3

For example, if your family rents its house or apartment, ithas to pay the rent each month, and if you live in your ownhome and have a mortgage, you have to pay the mortgageeach month. Such payments are mandatory (they have tobe made); they are not discretionary. On the other hand,the amounts that your family chooses to spend on itemssuch as food and entertainment are discretionary. In anyparticular month, for example, you may decide to eat outmore or less often.
Similarly, the federal government’s budget contains bothmandatory and discretionary elements. Consider, forexample, Social Security, which accounts for more than 20percent of total federal expenditures. (Social Security is aprogram that taxes people when they are working, andthen provides them with income when they retire; it alsoprovides income for workers who become disabled and forthe dependents of workers who die.) By law, the govern-ment has to pay Social Security benefits to anyone whoqualifies for them.
Federal SpendingAs shown in the chart, mandatory spending accounts
for the majority of the federal budget. The largestsingle discretionary item is national defense, whichaccounts for almost half of the discretionary shareof the budget.
Other examples of mandatory spending are Medicare, Med-icaid, benefits to retired civil servants, and interest on thedebt that the government has accumulated over the years.(Medicare is a program that pays for health care for theelderly and certain disabled persons, while Medicaid isa joint federal-state program that provides medicalassistance to low-income persons.) In contrast, spend-ing on items such as national defense, space explo-ration, and the FBI is discretionary; the governmentcan do more or less of it, as it decides.
Spending Priorities Change Over Time. Thirty-five years ago, for example, defense accounted formore than two-thirds of all discretionary spending, anddiscretionary spending exceeded mandatory spending,because many of today’s social programs were much small-er. For example, the number of retired workers receivingSocial Security benefits was only about one-third as largeas it is today, and Medicare, which today accounts for morethan one-tenth of the budget, was not yet in effect. Also,because the federal debt was much smaller, interest pay-ments were a smaller share of the budget.
S P E N D I N G
OtherMandatory
42%
Social Security23%
Non-Defense Discretionary
19%
Defense Discretionary
16%
D I S C R E T I O N A R Y
Your family’s budget and the government’s budget are alike in that both include some itemson which spending is discretionary, or controllable, and some items on which spending ismandatory, or not controllable.
4
Source: Executive Office of the President of the United States, 2000.

How Much Do We Pay?The Independent Budget Office of the City of New Yorkwill tell you how much of the federal taxes that yourfamily pays goes for individual items such as nationaldefense, Social Security, health care coverage, andinterest payments.
Go to www.ibo.nyc.ny.us and click on 1999 Tax Receipt.You will be asked how much you pay in federal taxes. If
you don’t know (or don’t want totell), enter any amount and youwill learn how much of thatamount would go for nationaldefense, Social Security, etc.
Here’s the opening paragraph ofa report that appeared in The
New York Times. What are theadvantages and disadvantages ofacross-the-board budget cuts —that is, cutting all items by the same percent?
Suppose your family had to cut its budget one percent; would youuse an across-the-board approach? Why or why not? How doyour arguments apply to the federal budget?
First, short-term deficits have become less and less use-ful as indicators of the longer term fiscal situation, becauseof the current budgetary approach of ignoring implicit fed-eral commitments. Second, the recent reliance on dis-cretionary spending cuts to make room for ongoingentitlement growth may have reached the end of its effec-tiveness, as discretionary spending is approaching an his-torically low share of GDP. Third, as entitlement growthis driven by demographic and economic factors rather thanby explicit legislation, it will require active program reduc-tions, rather than simply legislative forbearance, to improvethe current fiscal situation.
M A N D A T O R Y E X P E N S E SE X P E N S E S
D I S C U S S I O N Q U E S T I O N
An economist recently made the following comments aboutthe shift that has occurred in the budget from discretionary tomandatory spending. The economist was speaking to a groupof colleagues, though, and he used language that is meaning-ful to economists but perhaps unclear to others. Can youhelp? Explain in everyday language the three points thatappear below:
TAKE THE BUDGET CHALLENGE!
5

Composition of FederalRevenuesAs shown in the chart, individual income taxes make upabout one-half of federal revenues, Social Security payrolltaxes and related revenues (such as unemployment insur-ance taxes) provide another one-third, and corporateincome taxes another 10 percent. Based on theinformation in the chart, you can understandsomething very important about the federalbudget, something the federal govern-ment has in common with many U.S.families.
That is, income is higher in good economic times than inbad economic times, such as in a recession. When times aregood, family incomes are larger because it is easier to findwork, overtime work may be more available, and businessprofits are higher. Similarly, the government’s revenuesare higher in good times because more people are working
and they pay more taxes on their larger incomes,and corporations pay more taxes on their
higher profits.
R E V E N U E S
Other
Excise Taxes
Corporate Income Taxes
10%
Social Security Taxes, etc.
34%
Individual Income Taxes
48%
W A G E S S A L A R I E S B U S I N E S SS O C I A L S E C U R I T Y T A X E S
6
Source: Executive Office of the President of the United States, 2000.
Your family’s income probably consists largely of wages and salaries, or perhaps the profitsof a family business. In contrast, the federal government’s income, or revenues, consistspredominantly of taxes.

A Tax AdvantageIn fact, when times are good and people’s incomesincrease, federal tax revenues rise even more rapidly thanpeople’s incomes. That happens for two reasons. First, theincome tax is graduated, meaning that as people’s incomesrise, they pay higher tax rates on the higher amounts.
The second reason has to do with the personal exemption,or the amount of tax-free income per person to which afamily is entitled. Suppose a family has $12,000 in person-al exemptions, and prosperity increases the family’s incomefrom $50,000 to $60,000, or by 20 percent. Because of the$12,000 in exemptions, the amount of income on whichthe family may have to pay taxes increases from $38,000 to$48,000, or 26 percent.
D I S C U S S I O N Q U E S T I O N S
Governments rely on many different types oftaxes. For example, there are taxes on the
income (wages, salaries, interest, dividends,etc.) that people earn, on the profits that cor-porations make, on the spending that people do(general sales taxes), and on the purchase ofparticular items, such as gasoline or cigarettes.Social Security is funded by a tax on wages andsalaries. Suppose you were in charge ofdetermining which taxes the government shouldlevy. What would you tax more? Whatwould you tax less? Explain your choices. As mentioned below, the personal income tax
is a graduated tax; that means that peoplewith higher incomes pay higher tax rates thanpeople with lower incomes. Lower amounts ofincome are currently taxed at a 15 percent rate,higher amounts at 31 percent, even higheramounts at 36 percent, and the highest at 39.6percent. During World War II, though, the high-est rate was 94 percent. What arguments canyou make for and against taxing away 94 percentof each extra dollar earned by someone with avery high income?
Economists recognize that the people who pay a tax are not necessari-ly those who bear the true burden of the tax. For example, corpora-tions pay a tax on profits, but they may pass the tax on to theircustomers in the form of higher prices on their products. Similarly,owners of apartment buildings have to pay a tax on the value of theirproperty, but they pass the tax on — by charging higher rents — tothe people who rent the apartments. With that in mind, read the fol-lowing Congressional Budget Office discussion of the Social Securitytax, and explain the last sentence. (The Congressional Budget Office,which was created in 1974, provides Congress with nonpartisan analy-ses that it needs for economic and budget decisions.)
The tax that finances Social Security equals 6.2 percentof wage, salary, and self-employment income up to ataxable maximum ($76,200 in 2000), paid by bothemployer and employee. Thus, the total Social Securitytax is 12.4 percent of earnings up to the maximum. TheMedicare tax has no cap and equals 1.45 percent ofearnings, again paid by both employer and employee, toyield a total tax of 2.9 percent. Economists generallyagree that the entire payroll tax is actually paid by work-ers because their wages are lower by the employer’sshare of the tax.
TAKE THE BUDGET CHALLENGE!
S I N C O M E I N V E S T M E N T I N C O M ES I N C O M E T A X E S C O R P O R A T E T A X E S
Tax Exposure Can IncreaseFaster Than Income
7
Increase of tax exposureis 26 percent
$38M to $48M
Tax ExposureIncrease
26%
$50M to $60MIncrease of income
is 20 percent
IncomeIncrease
20%

Government BorrowingIf your family spends more than its income, it may borrowto make up the difference, perhaps by taking on some cred-it card debt or by taking out a loan from a bank or creditunion. The government borrows mainly by issuing Treasurybills, notes, and bonds. Bills are loans that the govern-ment repays in a year or less, notes have maturities of fromtwo to 10 years, and bonds mature in more than 10 years.When someone buys a U.S. Savings Bond, for example, theperson is lending to the federal government. While Sav-ings Bonds exist in paper form, the other government IOUsexist only as electronic accounting entries on computers.That allows the large IOUs to be bought and sold easily,and it reduces their vulnerability to theft and loss.
Interestingly, the government has to borrow even when itdoesn’t have a deficit. The reason is that the governmentis constantly paying off old debt. Suppose, for example,that the government is running a balanced budget — rev-enues are precisely equal to spending — and you cash in a
Savings Bond. Because the government’s spending isalready equal to its revenues, the government has to bor-row the funds it needs to pay off your Savings Bond. Peo-ple are constantly cashing in government IOUs, so thegovernment has to do new borrowing to offset that, and itactually does some borrowing every week.
S U R P L U S and
The difference between the government’s revenues and spending in a fiscal year is the gov-ernment’s annual surplus or deficit. If the government’s revenues exceed its spending in aparticular year, there is a surplus. If outlays exceed revenues, there is a deficit.
B O R R O W M O N E Y F R O M I S S U E T - B I L L S,
8
For a description of the mechanics of governmentborrowing, see Public Debt: Private Asset, an 8-page booklet published by the Federal Reserve Bankof Chicago. The booklet can be obtained free ofcharge from:
Publications CoordinatorPublic Information CenterFederal Reserve Bank of ChicagoP.O. Box 834230 South LaSalle StreetChicago, Illinois 60690-0834Telephone: 312-322-5111
You can also order the booklet online atwww.frbchi.org and view it on the Web.1

Paying Back With Interest What determines how much interest the government has topay when it borrows? The answer is that interest is theprice of credit, and, as in any competitive market, price isdetermined by demand and supply. Thus, the interest ratesthat the government has to pay are determined by theinteraction of the government’s demand for credit and thesupply of credit to the government by lenders, includingbanks, corporations, private citizens, U.S. governmentagencies, and foreign individuals and institutions. Thatsupply, in turn, is determined by such factors as the will-ingness of the U.S. consumer to save, the borrowing needsof U.S. business to invest in new equipment and buildings,and the total budget surplus or deficit of state and localgovernments.
You should remember two major points about the interestthat the federal government pays. First, the governmentcan borrow at lower interest rates than private parties(such as your family), because lenders are less worriedabout not being repaid when they lend to the governmentthan they are when they lend to private parties; people aresure the government will pay its debts. Second, rates gen-erally are higher on longer maturities than on shortermaturities, because people who lend for longer periodshave to be compensated for the risk that inflation mightaccelerate during the longer periods. If inflation acceler-ates, the lenders will be repaid with dollars that cannot buyas much as could the dollars that they originally lent to thegovernment. As an example of what’s called the spreadbetween short- and long-term rates, the rate on three-month bills averaged 4.7 percent in 1999, while the rate on30-year bonds averaged 5.9 percent, a spread of 1.2 per-centage points.
Interestingly, the government has to borrow even when it doesn’t have a deficit. The reason is that the government isconstantly paying off old debt.
A B A N K N O T E S , A N D B O N D S
D E F I C I T
9
Longer Terms
Yield
Higher
Interest
1. w
ww
.frb
chi.o
rg/p
ubs-
spee
ch/p
ublic
atio
ns/B
OOKL
ETS/
publ
ic_d
ebt/
publ
ic_d
ebt.
htm
l
Interest paid on a 3-month Treasury bill
Interest paid on a 30-year Treasury bond
0
1
2
3
4
5
6%
4.7%
5.9%Spread of 1.2 Percentage Points
B U D G E T I NT H E
1988198419801976197219681964196019561952194819441940-300
-250
-200
-150
-100
-50
0
50
100
150
200
250
S T R O N G E R E C O N O M YH I G H E R
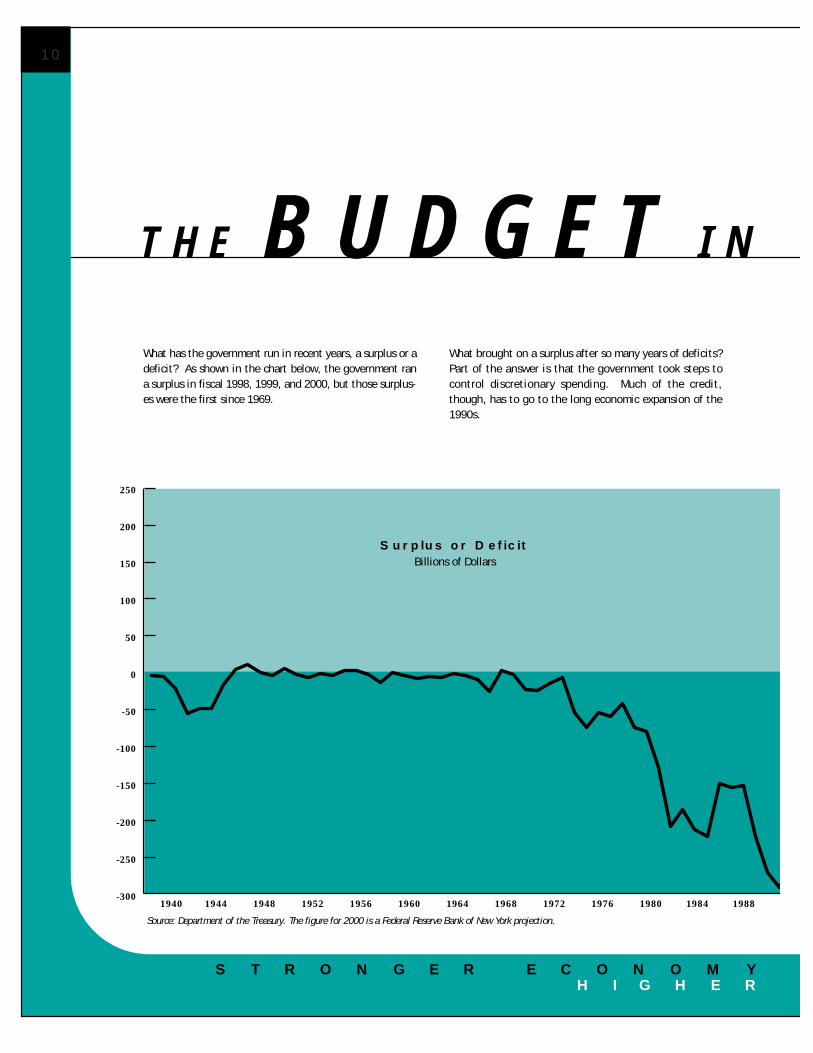
What has the government run in recent years, a surplus or adeficit? As shown in the chart below, the government rana surplus in fiscal 1998, 1999, and 2000, but those surplus-es were the first since 1969.
What brought on a surplus after so many years of deficits?Part of the answer is that the government took steps tocontrol discretionary spending. Much of the credit,though, has to go to the long economic expansion of the1990s.
Surplus or DeficitBillions of Dollars
Source: Department of the Treasury. The figure for 2000 is a Federal Reserve Bank of New York projection.
10

Y E A R SR E C E N T
G O V E R N M E N T R E V E N U E S
As explained earlier, a strong economy increases govern-ment revenues, because people and corporations pay high-er taxes on their higher incomes. In addition, prosperityreduces the amounts that the government has to spend onitems such as unemployment insurance.
D I S C U S S I O N Q U E S T I O N
Why did the governmentfind it easier than your
family would to run a deficitalmost 30 years in a row?
THE
BUDGET
SURPLUS
OF THE
LATE 1990s
WAS DUE
MAINLY
TO
ECONOMIC
EXPANSION.
11

Forecasting a Surplus or Deficit Economists expect that under current laws, the govern-ment will continue to enjoy a budget surplus for manyyears. A note of caution, though:
The New York Times reported on its January 26, 2000, frontpage that long-term budget projections have proven noto-riously volatile and unreliable. As recently as January 1998,for example, the Congressional Budget Office (CBO) fore-cast a budget deficit for the 1999 fiscal year, while in fact,the government ran a surplus of more than $120 billionthat year.
Why do you think it is difficult to forecast the sur-plus or deficit? What developments could occur thatwould affect the accuracy of the forecasts? Explainthe impact those developments would have on thepredicted surplus or deficit. You can find part of theanswer in a six-page paper by Yale University econo-mist William D. Nordhaus, Policy Rules in the NewEconomy. This paper is available on the Web.1
Despite the uncertainties, CBO does provide a fore-cast of the government surplus or deficit 10 years intothe future (www.cbo.gov). Why do you think CBOdoes that?
For an excellent discussion of why the budgetoutlook improved so dramatically in recent years,see Box 1-1 of CBO’s July 2000 Budget and Eco-nomic Outlook, available on the Web.2
Now, when your family has extra funds in its budget, it maylook for ways to spend them. Similarly, government offi-cials propose many options for using the anticipated feder-al surpluses. Some would like to increase discretionaryspending — by spending more on national defense, forexample. Others would like to cut taxes or pay off some ofthe debt that the government has accumulated over theyears, and others would like to use the surplus to help fundthe Social Security program. For a discussion of the variousproposals, see the CBO’s March 2000 report, BudgetOptions, which is available on the Web.3 Also available onthe Web4 is a CBO discussion of the forces likely to affectthe budget over the next 75 years.
The B U D G E T
F E W E R T A X P A Y E R S
12
Photo courtesy of the Congressional Budget Office.
M O R E S O C I A L

The Social Security FactorWhy does Social Security need help? The answer is thatSocial Security actually has a surplus now, but it will facefinancial pressures in the coming decades, as the largenumbers of people born in the two decades after World WarII retire. Birth rates were high in the two decades afterWorld War II, but lower in subsequent decades. For thatreason, and also because retired people are living longer,the ratio of the number of workers paying Social Securitytaxes to the number of people receiving Social Securitybenefits will fall sharply when the so-called baby boomersretire. As shown in the chart, the ratio is expected to fallfrom 3.4 in 2000 to 2.1 in 2030 and 2.0 in 2040 and 2050.
For more information on the financial outlook for SocialSecurity, go to the Web.5
How large a factor are Social Security benefits in theincomes of people over 65? You can find out from Incomeof the Aged Chartbook, 1998, a 23-page publication of theSocial Security Administration, available on the Web.6
O U T L O O K
2.0
1.5
2.5
3.0
3.5
205020402030202020102000199019801970
3. w
ww
.cbo
.gov
/sho
wdo
c.cf
m?i
ndex
=184
5&se
quen
ce=0
&fr
om=7
5. w
ww
.ssa
.gov
/und
erst
andi
ng.h
tm6.
ww
w.s
sa.g
ov/s
tati
stic
s/ia
c98t
oc.h
tml
2. w
ww
.cbo
.gov
/sho
wdo
c.cf
m ?
inde
x=22
41&
sequ
ence
=0&
from
=7
Number of Workers per Social Security Beneficiary
Source: Congressional Budget Office. The figures for 2010 and beyond are estimates.
13
1. w
ww
.cbo
.gov
/sho
wdo
c.cf
m?i
ndex
=209
5&se
quen
ce=0
&fr
om=7
S E C U R I T Y R E C I P I E N T S
4. w
ww
.cbo
.gov
/sho
wdo
c.cf
m?i
ndex
=251
7&se
quen
ce=0
&fr
om=7

A Growing ProblemWhile the deficit is the amount by which governmentspending exceeds revenues in a particular year, the federaldebt is the total amount of funds that the government hasborrowed over the years, but has not yet repaid. When thisbooklet was written, in mid-2000, the federal debt wasabout $5.6 trillion. That’s $5,600,000,000,000.
When did the debt get so large? Until recent decades,large increases in the debt generally occurred only duringwars and recessions. During World War I, for example, thedebt increased from a little over $1 billion to about $15billion. Then, by reducing taxable income and creating aneed for new social programs, the Depression of the 1930sbrought the debt to almost $50 billion by the start of WorldWar II.
The costs of World War II drove thedebt to more than $250 billion, butthe debt hardly grew at all for thenext quarter century. In the late1960s, though, spending increasesdue to the Vietnam War and newsocial programs put the governmentdeeper in debt. After 1981, deficitsincreased very sharply. Tax cutsreduced revenue, while spending grewrapidly for programs such as SocialSecurity and Medicare and, to a lesserextent, for national defense. The debtgrew rapidly until the mid-1990s,when it leveled off.
Is the debt too large? To answer thatquestion, economists sometimes com-
pare the size of the debt with that of the country’s GrossDomestic Product (GDP), the dollar value of all the goodsand services produced in the economy each year. Just asyour family can put the debt it owes into perspective bymeasuring it against your family’s income, so, too, we cangain some perspective on the size of the federal debt bymeasuring it against GDP, the total income from which thegovernment can derive its revenue.
As shown in the chart, the debt rose very sharply to morethan 100 percent of GDP during World War II, then fellsteadily to about one-third of GDP by 1980. The ratio roseduring the 1980s and early 1990s, reaching a high of about67 percent in the mid-1990s, but it has come down inrecent years to about 60 percent.
F E D E R A LThe
30
0
60
90
120
2000199619921988198419801976197219681964196019561952194819441940
P R E - W W I D E B T :T O D A Y :
Debt as a Percent of GrossDomestic Product
Source: Economic Report of the President, February 2000.
14

Or Is It a Problem?Why worry at all about the size of thefederal debt? After all, doesn’t thegovernment simply owe the debtmainly to U.S. residents and to U.S.business firms? In a sense, don’t we(through the government) simply owethe debt to ourselves?
To a large extent, the answer is yes,but many economists have at leasttwo worries about a large federaldebt. The first is that if the govern-ment does a lot of borrowing, theincreased demand for credit may pushinterest rates up. The higher interestrates, in turn, make investment moreexpensive, and thus may discouragesome investment in the buildings and equipment that helpour economy grow. In that way, a large federal debt couldlead to slower economic growth for the United States.
Second, as shown in the chart above, there has been anincrease in the proportion of the debt that is owed to for-eigners, from around 13 percent in the late 1980s to 22percent in the late 1990s. A large foreign-held debt canbe a concern, because it is something we don’t owe to our-selves. In order to pay it off, we will have to transfer someof our purchasing power to foreigners, and that means thatin the future, the ability of U.S. households to consumegoods and services will be diminished.
In its fiscal year 2000 budget, the Clinton Administrationhad this to say about government deficits and debt (avail-able on the Web1):
We must do all we can to keep the days of deficitsin the past. Budget deficits force the Government toborrow money in the private capital markets. Thatborrowing competes with (1) borrowing by businessesthat want to build factories and machines that makeworkers more productive and raise incomes, and (2)borrowing by families who hope to buy new homes,cars, and other goods. The competition for fundstends to produce higher interest rates.
Deficits increase the Federal debt and, with it, theGovernment’s obligation to pay interest. The more itmust pay in interest, the less it has available to spendon education, law enforcement, and other importantservices, or the more it must collect in taxes — forev-er after. As recently as 1997, the Government spentover 15 percent of its budget to pay interest, in con
Do you want an up-to-date figure on the size of the federal debt to thepenny? You can find it atwww.publicdebt.treas.gov.
0
5
10
15
20
25
20001996199219881984198019761972196819641960
$ 1 , 0 0 0 , 0 0 0 , 0 0 0$ 5 , 6 0 0 , 0 0 0 , 0 0 0 , 0 0 0
Foreign-Held Debt as a Percent of Total Debt
D E B T
Source: Department of Commerce, Department of the Treasury, and Federal Reserve Bank of New York.
15
1. w
3.ac
cess
.gpo
.gov
/usb
udge
t/fy
2000
/gui
de04
.htm
l

D I S C U S S I O N Q U E S T I O N
16
0
10
20
30
40
50
SwedenFranceItalyGermanyCanadaUnited Kingdom
United States
Japan
Total Tax Revenue as a Percent of GDP
Source: Organisation for Economic Co-operation and Development. Data are for 1997.
Now that you have finished reading the booklet,let’s consider a basic question about the role
that the government should play in the economy.The chart at the left shows that the governmentplays a larger role in the economy in other coun-tries than it does in the United States, mainlybecause foreign governments play more of a role infunding health care than does the U.S. govern-ment. What roles do you think the governmentshould play in the economy? Which goods andservices should be produced by the private sector,and which ones should the government produce?Why? Why, for example, does the governmentprovide national defense? Why does the gov-ernment provide free elementary and high schooleducation? Should tax dollars be used to payfor people’s health care? Why or why not? 1.
ww
w.p
ublic
debt
.tre
as.g
ov/o
pd/o
pdfa
q.ht
m
trast to a projected 12 percent for 2000. Continuingsurplus will reduce these interest payments further infuture years.
In the end, the surplus is a decision about our future.We can provide a solid foundation for future genera-tions, just as parents try to do within a family. For aNation, this means a strong economy and low interestrates and debt. Alternatively, we can generate largedeficits and debt for those who come after us.
To learn more about the federal debt (including how to makea contribution to reduce the debt), check out the Web.1
Let’s return to our earlier analogy between a family budgetand the government budget. Under what circumstancesshould a family run a deficit in a particular year? What reasons are there for running a deficit in the governmentbudget?
In recent years, many countries have privatized many activi-ties, such as telephone service — that is, they have shiftedthe production of the services from the government to pri-vate industry. Why do you think they have done that?

Design: Robert Silverman Design
N

Federal Reserve Bank of New York
Public Information Department
33 Liberty Street
New York, NY 10045
www.ny.frb.org
2000