Embed Size (px)
Citation preview

UNIVERSIDADE TÉCNICA DE LISBOAINSTITUTO SUPERIOR TÉCNICO
Understanding the Effect of User Position on Ray-Pointing Techniques for Large Scale Displays
Ricardo Jorge Jota Costa
Supervisior: Co-Supervisior:
Doctor Joaquim Armando Pires JorgeDoctor Saul Greenberg
Thesis approved in public session to obtain the PhD Degree in Information Systems and Computer Engineering
Juri final classification: Pass with Merit
JuryChairperson: Presidente do Conselho Científico do ISTMembers of the Committee:
Doctor Saul GreenbergDoctor Joaquim Armando Pires JorgeDoctor Nuno Manuel Robalo CorreiaDoctor Tobias IsenbergDoctor Daniel Jorge Viegas GonçalvesDoctor Carlos António Roque Martinho
2011

UNIVERSIDADE TÉCNICA DE LISBOAINSTITUTO SUPERIOR TÉCNICO
Understanding the Effect of User Position on Ray-Pointing Techniques for Large Scale Displays
Ricardo Jorge Jota Costa
2011
This work was funded in part by the Portuguese Foundation for Science and Technology, grant SFRH/BD/17574/2004, The European Commission and the FP6 Specific Targeted Research Project IMPROVE (IST-2003-004785), and the European Commission and the FP7 Specific Targeted Research Project MAXIMUS (IST-2007-1-217039).
Supervisior: Co-Supervisior:
Doctor Joaquim Armando Pires JorgeDoctor Saul Greenberg
Thesis approved in public session to obtain the PhD Degree in Information Systems and Computer Engineering
Juri final classification: Pass with Merit
JuryChairperson: Presidente do Conselho Científico do ISTMembers of the Committee:
Doctor Saul GreenbergDoctor Joaquim Armando Pires JorgeDoctor Nuno Manuel Robalo CorreiaDoctor Tobias IsenbergDoctor Daniel Jorge Viegas GonçalvesDoctor Carlos António Roque Martinho

ii
Resumo
Ecrãs de larga escala permitem que os utilizadores sejam fisicamente móveis.Como tal, a utilização de teclado e rato é desaconselhada, porque a sua utiliza-ção limita a mobilidade. Para permitir que o utilizador se mova livremente,foram propostas técnicas de interacção baseadas no gesto de apontar. No en-tanto, existe uma lacuna de informação sobre quais os factores humanos queafectam esta classe de técnicas. Em particular, não é sabido se a posição físicado utilizador tem algum efeito na utilização de técnicas de apontar. O objec-tivo deste trabalho é investigar que efeito a posição do utilizador tem nestastécnicas.
Os nosso resultados demonstram que a distancia do utilizador ao ecrã nãoparece afectar a interacção. No entanto, para as tarefas executadas, os uti-lizadores demonstraram uma preferência para uma distância em particular.Também descobrimos que os factores humanos tipo de controlo e parallax in-fluenciam a interacção. Técnicas com tipo de controlo rotacional são adequadaspara tarefas de visar e técnicas com parallax reduzido são adequadas para tare-fas de rastear. Para concluir, estes resultados foram aplicados num cenário deecrã de larga escala, para revisão de modelos arquitectónicos, onde foi desen-volvida interface multi-modal baseada em técnicas de apontar.
iii

iv

Palavras Chave
Interacção Homem Máquina
Ecrãs de larga escala
Técnincas de apontar
Factores Humanos
Parallax
Distancia do utilizador ao ecrã
v

vi

Abstract
Large-scale displays support interaction scenarios where the user is physicallyunrestrained. However, standard input devices – such as keyboards and mice– are cumbersome and might restrain user mobility in large scale displays.
Pointing has been suggested as an interaction technique adequate for such sce-narios. However, little is known regarding what human factors affect pointingperformance. In particular, whether user position and distance to display arerelevant to pointing is yet to be researched. Our proposal is to understand howuser position and location affect pointing as an interaction technique.
Our results suggest that user distance to the display does not affect pointing,but users exhibit preferences for a specific distance according to the given task.We also found that control type and parallax have influence the way users per-form. The results show that techniques based on rotational control performbetter for targeting tasks, and techniques with low parallax are best for tracingtasks. To conclude, these results were applied in a real-world scenario wherea prototype for architectural design review was build for a large-scale displaywith a multi-modal interface based on a pointing modality.
vii

viii
Keywords
Human Computer Interaction
Large-scale Displays
Pointing Techniques
Human Factors
Parallax
User Distance
ix

x

Acknowledgements
First and foremost this thesis would not have been possible without the utmostsupport of my advisors, Joaquim A. Jorge and Saul Greenberg. I will be foreverin debt for their guidance in the best of times and beacon of optimist in theworst of times.
Secondly, I want to share this achievement with my dear colleagues at Inesc-ID, who saw me grow and vividly shared their energy with me. Bruno Araújo,Alfredo Ferreira, Luís Bruno, Diogo Mariano and Pedro Lopes were alwaysavailable and are second to none. Also, I would like to show my gratitudeto the researchers at iLab, who gave the warmest welcome in Calgary. Theircontributions are memorable and I would not be who I am today if it was not forthem. Sheelagh Carpendale, Ehud Sharlin, Miguel Nacenta, Nicolai Marquardt,Sean Lynch, Paul Lapides and Matthew Tobiasz made working in Calgary afantastic experience. I am glad to have turned those collaborations into long-lasting friendships.
Finally, I would like to leave a written statement of deep love for father, motherand closest friends. Their unconditional patience towards me is one of the bestthings in life. A man is only truly alone when he has no friends.
Thank you,Ricardo Jorge Jota Costa
xi

xii
Contents
1 Introduction 1
1.1 Results . . . . . . . . . . . . . . . . . . . . . . . . . . . . . . . . . . 3
1.2 The Evolution of the work presented . . . . . . . . . . . . . . . . . 4
1.2.1 Timeline . . . . . . . . . . . . . . . . . . . . . . . . . . . . . 4
1.3 Dissertation Outline . . . . . . . . . . . . . . . . . . . . . . . . . . 8
2 Previous Work 11
2.1 Theoretical Frameworks . . . . . . . . . . . . . . . . . . . . . . . . 11
2.1.1 Heidegger . . . . . . . . . . . . . . . . . . . . . . . . . . . . 12
2.1.2 Merleau-Ponty . . . . . . . . . . . . . . . . . . . . . . . . . 12
2.1.3 Embodied Cognition . . . . . . . . . . . . . . . . . . . . . . 13
2.2 Theoretical Interaction Frameworks . . . . . . . . . . . . . . . . . 15
2.2.1 Overview . . . . . . . . . . . . . . . . . . . . . . . . . . . . 18
2.3 Task Models and Cognitive Architectures . . . . . . . . . . . . . . 19
2.4 Proxemics . . . . . . . . . . . . . . . . . . . . . . . . . . . . . . . . 21
2.5 Large-Scale Displays . . . . . . . . . . . . . . . . . . . . . . . . . . 23
2.5.1 Vertical surfaces . . . . . . . . . . . . . . . . . . . . . . . . . 23
2.5.2 Horizontal surfaces . . . . . . . . . . . . . . . . . . . . . . . 26
2.6 Interaction . . . . . . . . . . . . . . . . . . . . . . . . . . . . . . . . 27
2.6.1 Devices . . . . . . . . . . . . . . . . . . . . . . . . . . . . . . 27
2.6.2 Interaction Techniques . . . . . . . . . . . . . . . . . . . . . 32
2.7 The Lourenço Fernandes environment . . . . . . . . . . . . . . . . . 34
2.7.1 Powerwall . . . . . . . . . . . . . . . . . . . . . . . . . . . . 35
2.7.2 Tabletop . . . . . . . . . . . . . . . . . . . . . . . . . . . . . 36
xiii
CONTENTS
2.8 Distance Aware . . . . . . . . . . . . . . . . . . . . . . . . . . . . . 36
2.9 Discussion . . . . . . . . . . . . . . . . . . . . . . . . . . . . . . . . 38
3 Pointing for Large-Scale Displays 41
3.1 Distance in Pointing Techniques . . . . . . . . . . . . . . . . . . . . 41
3.1.1 Pointing Variants . . . . . . . . . . . . . . . . . . . . . . . . 43
3.1.2 Evaluation . . . . . . . . . . . . . . . . . . . . . . . . . . . . 45
3.1.3 Results . . . . . . . . . . . . . . . . . . . . . . . . . . . . . . 48
3.1.4 Discussion . . . . . . . . . . . . . . . . . . . . . . . . . . . . 53
3.2 Control Type and Parallax . . . . . . . . . . . . . . . . . . . . . . . 56
3.2.1 Ray Pointing Fundamentals . . . . . . . . . . . . . . . . . . 57
3.2.2 Experiment 1 - Horizontal Targeting . . . . . . . . . . . . . 62
3.2.3 Experiment 2 - Vertical Targeting . . . . . . . . . . . . . . . 69
3.2.4 Results . . . . . . . . . . . . . . . . . . . . . . . . . . . . . . 70
3.2.5 Experiment 3 - Tracing . . . . . . . . . . . . . . . . . . . . . 72
3.2.6 Results . . . . . . . . . . . . . . . . . . . . . . . . . . . . . . 73
3.2.7 Discussion . . . . . . . . . . . . . . . . . . . . . . . . . . . . 74
3.3 Overall Discussion . . . . . . . . . . . . . . . . . . . . . . . . . . . 78
3.3.1 Large-scale Display . . . . . . . . . . . . . . . . . . . . . . . 78
3.3.2 Distance . . . . . . . . . . . . . . . . . . . . . . . . . . . . . 78
3.3.3 Interaction Techniques . . . . . . . . . . . . . . . . . . . . . 79
3.3.4 Practical relevance of results . . . . . . . . . . . . . . . . . 80
4 Evaluating Pointing on a real world scenario 81
4.1 A design review application for large-scale displays . . . . . . . . 82
4.1.1 System Requirements . . . . . . . . . . . . . . . . . . . . . 82
4.1.2 Design Goals . . . . . . . . . . . . . . . . . . . . . . . . . . 85
4.1.3 System Architecture . . . . . . . . . . . . . . . . . . . . . . 86
4.2 Input Devices . . . . . . . . . . . . . . . . . . . . . . . . . . . . . . 88
4.2.1 Pointing Device . . . . . . . . . . . . . . . . . . . . . . . . . 89
xiv
CONTENTS
4.2.2 Speech . . . . . . . . . . . . . . . . . . . . . . . . . . . . . . 91
4.2.3 Handheld Device . . . . . . . . . . . . . . . . . . . . . . . . 91
4.2.4 Body Tracking . . . . . . . . . . . . . . . . . . . . . . . . . . 92
4.3 User Interface . . . . . . . . . . . . . . . . . . . . . . . . . . . . . . 92
4.3.1 Activating interface elements using strokes . . . . . . . . . 92
4.3.2 Menus . . . . . . . . . . . . . . . . . . . . . . . . . . . . . . 94
4.4 User Tests . . . . . . . . . . . . . . . . . . . . . . . . . . . . . . . . 98
4.4.1 Apparatus . . . . . . . . . . . . . . . . . . . . . . . . . . . . 98
4.4.2 Participants . . . . . . . . . . . . . . . . . . . . . . . . . . . 99
4.4.3 Procedure and Design . . . . . . . . . . . . . . . . . . . . . 99
4.4.4 Measures and Analysis Methodology . . . . . . . . . . . . 100
4.4.5 Results . . . . . . . . . . . . . . . . . . . . . . . . . . . . . . 100
4.4.6 Users Task Performance . . . . . . . . . . . . . . . . . . . . 101
4.4.7 Multi-modal Preferences for user tasks . . . . . . . . . . . 102
4.5 Observations . . . . . . . . . . . . . . . . . . . . . . . . . . . . . . . 104
5 Conclusions 107
5.1 Contributions . . . . . . . . . . . . . . . . . . . . . . . . . . . . . . 108
5.2 Limitations . . . . . . . . . . . . . . . . . . . . . . . . . . . . . . . . 108
5.3 Other work produced . . . . . . . . . . . . . . . . . . . . . . . . . . 109
5.3.1 MAXIMUS project . . . . . . . . . . . . . . . . . . . . . . . 109
5.3.2 The continuous interaction space . . . . . . . . . . . . . . . 110
5.3.3 StereoBlocks . . . . . . . . . . . . . . . . . . . . . . . . . . . 110
5.4 Future Work . . . . . . . . . . . . . . . . . . . . . . . . . . . . . . . 111
5.4.1 Distance . . . . . . . . . . . . . . . . . . . . . . . . . . . . . 111
References 113
xv

CONTENTS
xvi

List of Figures
2.1 Model Human Processor . . . . . . . . . . . . . . . . . . . . . . . . 15
2.2 Norman’s model of HCI . . . . . . . . . . . . . . . . . . . . . . . . 17
2.3 Activity Theory . . . . . . . . . . . . . . . . . . . . . . . . . . . . . 18
2.4 Task Models . . . . . . . . . . . . . . . . . . . . . . . . . . . . . . . 21
2.5 Vertical surface size comparison . . . . . . . . . . . . . . . . . . . . 24
2.6 Lourenço Fernandes Lab - Powerwall . . . . . . . . . . . . . . . . 35
2.7 Lourenço Fernandes Lab - Input Devices . . . . . . . . . . . . . . . 36
2.8 Lourenço Fernandes Lab - Tabletop . . . . . . . . . . . . . . . . . . 37
3.1 Grab, Point and Mouse interaction metaphors . . . . . . . . . . . 43
3.2 Pointing metaphor, third person perspective . . . . . . . . . . . . 44
3.3 Distances tested and tracking devices . . . . . . . . . . . . . . . . 46
3.4 Speed session screenshots . . . . . . . . . . . . . . . . . . . . . . . 46
3.5 Precision session screenshots . . . . . . . . . . . . . . . . . . . . . 47
3.6 Median results for the Cluster and Spread Tasks . . . . . . . . . . 50
3.7 User questionnaire answers for difficulty in learning and usage . 52
3.8 User questionnaire answers for metaphor preference . . . . . . . 53
3.9 Example of user movement during a test (Speed tests; spreadtask). Left: head and device movement when using a grab metaphor.Right: head and device movement when using a point metaphor.Theground is (x, z) and height is y: Head is plotted from above (x, z),Device is plotted from perpendicular to the display (x, z). . . . . 54
3.10 Four variants of ray pointing . . . . . . . . . . . . . . . . . . . . . 58
3.11 Ray Pointing definition . . . . . . . . . . . . . . . . . . . . . . . . . 58
3.12 Image-plane pointing example . . . . . . . . . . . . . . . . . . . . 59
xvii

LIST OF FIGURES
3.13 Parallax depiction . . . . . . . . . . . . . . . . . . . . . . . . . . . . 61
3.14 Control type and Parallax Experimental Setup . . . . . . . . . . . 62
3.15 Geometrical relationships between D, W, d and w . . . . . . . . . 64
3.16 Calculation of subtended angle . . . . . . . . . . . . . . . . . . . . 65
3.17 Relationships between linear IDs and angular IDs . . . . . . . . . 66
3.18 Throughput values for the horizontal targeting task . . . . . . . . 67
3.19 Average physical demand and effort responses in the horizontaltargeting task . . . . . . . . . . . . . . . . . . . . . . . . . . . . . . 68
3.20 Vertical task angles and paths . . . . . . . . . . . . . . . . . . . . . 69
3.21 Throughput for the vertical targeting task . . . . . . . . . . . . . . 71
3.22 Tracing task tunnels and positions . . . . . . . . . . . . . . . . . . 72
3.23 Throughput for the tracing task . . . . . . . . . . . . . . . . . . . . 74
3.24 Example of laser on close and distant interaction . . . . . . . . . . 79
4.1 IMMIView interaction example . . . . . . . . . . . . . . . . . . . . 84
4.2 IMMIView System Architecture . . . . . . . . . . . . . . . . . . . . 87
4.3 Laser detection algorithm . . . . . . . . . . . . . . . . . . . . . . . 89
4.4 Stroke estimation workflow . . . . . . . . . . . . . . . . . . . . . . 90
4.5 Handheld device metaphor . . . . . . . . . . . . . . . . . . . . . . 91
4.6 Arm Gestures . . . . . . . . . . . . . . . . . . . . . . . . . . . . . . 92
4.7 Stroke Examples . . . . . . . . . . . . . . . . . . . . . . . . . . . . . 93
4.8 Gate based widget . . . . . . . . . . . . . . . . . . . . . . . . . . . 93
4.9 Gate activation . . . . . . . . . . . . . . . . . . . . . . . . . . . . . . 94
4.10 Selection Examples . . . . . . . . . . . . . . . . . . . . . . . . . . . 94
4.11 Menu Examples . . . . . . . . . . . . . . . . . . . . . . . . . . . . . 95
4.12 Annotation Menu . . . . . . . . . . . . . . . . . . . . . . . . . . . . 95
4.13 Navigation Menu . . . . . . . . . . . . . . . . . . . . . . . . . . . . 96
4.14 Transformation Menu . . . . . . . . . . . . . . . . . . . . . . . . . . 97
4.15 IMMIView collaborative example . . . . . . . . . . . . . . . . . . . 98
xviii
List of Tables
3.1 Speed Test results in seconds . . . . . . . . . . . . . . . . . . . . . 49
3.2 Anova results for the speed test . . . . . . . . . . . . . . . . . . . . 49
3.3 Precision test results in Pixels . . . . . . . . . . . . . . . . . . . . . 50
3.4 Precision Test, precision task results in Seconds . . . . . . . . . . . 51
3.5 ANOVA results for the precision test . . . . . . . . . . . . . . . . . 52
3.6 Technique classification . . . . . . . . . . . . . . . . . . . . . . . . 61
3.7 Preference ranks for the horizontal targeting task . . . . . . . . . . 68
3.8 Preference ranks for experiment 2 and 3 . . . . . . . . . . . . . . . 75
4.1 Results of ISONORM questionnaire on the scale 1 to 6. . . . . . . 101
4.2 Navigation performance data by modality. . . . . . . . . . . . . . 101
4.3 Annotation performance data by modes. . . . . . . . . . . . . . . . 102
4.4 User modality preference in navigation tasks (in percentage). . . . 103
4.5 User modality preference in annotation tasks (in percentage). . . 103
4.6 Choice of modality combinations when editing objects. . . . . . . 103
xix

LIST OF TABLES
xx
1Introduction
Recent developments in technology are changing the concept of computer byexpanding the spectrum of possible form factors. In fact, available devicesrange from the almost invisible [Ni & Baudisch, 2009] to the mobile device,tablets, desktops and, at the other side of the spectrum, very large displays[Buxton et al. , 2000]. We look at the large end of this spectrum and focus oninteraction with large-scale displays. To increase resolution, large displays areoften built using a number of desktop-size tiles. Depending on the number oftiles used, they can offer dozens of times more pixels than a desktop. There aretwo main kinds of displays namely, tabletops and display walls. Tabletops arehorizontal surfaces used by multiple users in collaboration tasks while displaywalls are vertical displays mostly used to visualize large quantities of informa-tion by one or more users.
When interacting with large displays users often take advantage of being phys-ically unrestrained to a position, as opposed to desktops which force them tobe stationary. In tabletop scenarios, users walk around the table for collabora-tion purposes or to access information available on the other side of the table.When working with display walls users approach the display either to focus onparticulars or to get a more detailed view. In both scenarios users often move
1
1: INTRODUCTION
sideways, in order to access information not in front of them. Because theyare free to move, standard input devices, such as keyboards and mice, are in-adequate for very large displays. Indeed, keyboards are cumbersome to carry,while conventional mice require a tracking surface that constrain movement.Because of this, new input devices have been proposed for interaction withlarge-scale displays.
For tabletops, touch technology is the default modality, but for vertical displaysthere has not been a single device that enjoys acceptance comparable to that ofthe touch for tabletop or the input solution in the desktop. However, pointingis likely the set of interaction techniques most commonly used with very largedisplays. When pointing, users designate information by either performing anappropriate gesture or by aligning an input device in an adequate manner to-wards the target. Pointing at large-scale displays is dependent on the inputdevice [Myers et al. , 2002] and on the pointing technique adopted [Grossman& Balakrishnan, 2005; König et al. , 2009; Tse et al. , 2007]. This duality of inputdevice and interaction technique is reflected on the previous work for point-ing interfaces for large-scale displays. Some focus on input devices [Baudischet al. , 2006; Jiang et al. , 2006; Oh & Stuerzlinger, 2002; Wilson & Cutrell, 2005]while others focus on and interaction techniques [Kobayashi & Igarashi, 2008;Nacenta et al. , 2006a; Tse et al. , 2007].
It is still not clear what affects pointing performance. For large-scale displays,the general problem is, how to interact in these scenarios? How do their charac-teristics affect the way we use input devices? What techniques better suit thosedevices to support interaction with such large surfaces? More specifically, wheninteracting with display walls, current research has not explored whether userposition and distance to display are relevant to pointing techniques. Althoughthere is research work that considers how distance affects interaction [Ball et al., 2007; Harrison & Dey, 2008; Myers et al. , 2001, 2002; Raja et al. , 2004; Usohet al. , 1999; Vogel & Balakrishnan, 2004, 2005], there is little understanding onhow large-scale displays can affect the way users interact. Within the context ofa single user working with very large displays, we state the problem as follows:
How does a user’s position affect interaction with pointing based techniques
on very large displays?
Our goal is to identify what variables affect pointing as an input technique,thus providing insights to practitioners developing pointing-based techniques
2
1: INTRODUCTION
for very large displays. To achieve our goal we took the following approach.(1) Build an environment where users interact using pointing techniques witha large-scale display. (2) Run user tests to get a basic understanding of pointingtechniques and obtain qualitative user feedback regarding the experience. (3)Apply controlled experiments to study the relation between pointing perfor-mance and external factors such as user distance, different pointing techniquesor human factors such as control type and parallax. (4) Apply these results ina real-word application to evaluate user satisfaction regarding the user experi-ence developed.
1.1 Results
Our results are described in Chapter 3 and Chapter 4. A short description ofthe main results is provided next.
Distance & Technique Preference Distance does not affect interaction as muchas the technique used or the task performed. When comparing three point-ing metaphors: Point, Grab and Vertical Mouse, we found that, for tasks thatrequire speed, Point was the fastest. However, for tasks that require preci-sion, Grab presents better results. On the same study, we asked the usersto give their preference regarding distance and effort. Users classified Grabas less tiresome and stated preference to interact on the 2 meter mark.
Control Type & Parallax We looked at how control type and parallax affect raypointing techniques. Four pointing variants were tested on a large-scaledisplay with both horizontal and vertical targeting tasks and tracing tasks.Furthermore, given the lack of distance influence, the selected user posi-tion was such that the display covered the users’ center of gaze and wholeperipheral view. The results show that (a) techniques based on rotationalcontrol perform better for targeting tasks, and (b) techniques with low par-allax are best for tracing tasks. They also show that (c) a Fitts’ law analysisbased on angles (as opposed to linear distances) better approximates peo-ple’s ray pointing performance.
User Preference for Pointing Techniques Based on the our previous findingswe developed a multi-modal pointing interface to be applied on a large-scale display within the context of architectural design review. User stud-ies conducted with architects reveal that users feel comfortable with the
3
1: INTRODUCTION
system and suggest that, for the tasks proposed, they prefer the multi-modal approach instead of more conventional interactions, such as menubased interaction.
1.2 The Evolution of the work presented
The work that will follow, was developed during a period of six years between2005 and 2011. While some of the work executed was left aside for this thesis(see Chapter 5 for a quick description on those), most work executed duringthat period found its way into this document. For clarity purposes, the timelineexecution of those work was not reproduced in the document, and the bodyof work was re-arranged according to the desired argument and flow of thedocument, instead of when (or where) it was produced.
1.2.1 Timeline
To help readers understand what was produced, but also how and when it wasproduced, we now present a timeline of the body of work described, includinghardware build to create the scenarios required for tests, direct collaborationsfor each project, context in which the work was developed and related publica-tions achieved during this period.
First Year: 2005 - 2006
The PhD program requires their applicants to execute a first year of classes,where applicants can choose from a number of possible advanced classes thatfit their intended plan of work. Therefore, the first part of the year was utilizedin attending those classes and satisfying this pre-requisite. At the same time, weinitial vision of what would be the “Lourenço Fernandes” laboratory was beingdevised. At this time, we had already understood that a Large-Scale Displaywas a requirement for the following work. With no previous expertise on howto build - from scratch - such environment, I collaborated with Bruno AraÞjoand Tiago Guerreiro, with guidance professor Joaquim A. Jorge. During thisfirst year we focus on the construction of the large-scale display, including thedeployment of a cluster of computer to power the display, physical frame tosupport the displays at the right weight to form the tile, aluminum platforms
4
1: INTRODUCTION
to fine-tune the displays position (thus creating the idea of a seamless display),the projection screen installation and, finally, the display hardware and auxil-iary computers to create an intra-net. I was personally involved in all steps, buthad direct responsibilities with the deployment of cluster and infra-structure tosupport the display. The end result was a large-scale display scenario, unique -at the time - at the academia in Portugal that would be used in the next six yearby multiple projects and presentations. This resulted in the following publica-tions:
Leme Wall: Desenvolvendo um sistema de Multi-projecção, Bruno Araujo, TiagoGuerreiro, Joaquim Jorge, João Pereira, Ricardo Jota. 13 Encontro Portuguêsde Computação Gráfica, Vila Real, Portugal, Oct 2005
Automatic Color Calibration for Commodity Multi-projection Display Walls Soares,L. P., Costa, R. J., Araujo, B. R. and Jorge, J. A. 2007. In Proceedings of the IXSymposium of Virtual Reality ( Petrópolis , RJ/Brazil , May, 2007 )
Second Year: 2006 - 2007
For the second year of the work-plan, we focus on adding input technologyto the recently created large-scale display environment. At the same time, thekickstart of the IMPROVE project (an european project with the focus on large-scale display application for design and architecture) provided us with a end-user application were we could apply our ideas. I was responsible for task anal-ysis which directly influenced the interfaces available in “Lourenço Fernandes”laboratory. During the second year, I was involved in IMPROVE, as task ana-lyst, was the primary software developer for the user interface and providedtechnical solutions to implement the pointing device within a large-scale dis-play. The work for the first two years is available as parts of Section 2.7 andChapter 4 and resulted in the following publications:
Collaborative Visualization of Sensor Data Through a Subscription based Architecture.M. Witzel, M. Andreolli, G. Conti, R. De Amicis, B. De Araujo, R. Jota e J. JorgeEurographics Italian Chapter annual event, 02/2007
IMPROVE: Designing Effective Interaction for Virtual and Mixed Reality Environ-ments. Pedro Santos, Andre Stork, Thomas Gierlinger, Alain Pagani, BrunoAraujo, Ricardo Jota, Luis Bruno, Joaquim Jorge, Joao Madeiras Pereira, Mar-tin Witzel, Giuseppe Conti, Raffaele de Amicis, Inigo Barandarian, Celine Paloc,
5
1: INTRODUCTION
Oliver Machui, Jose M. Jimenez, Georg Bodammer, Don McIntyre Fraunhofer-IGD, A2, TU-Darmstadt, FB21,GRIS, INESC-ID, GraphiTech, VICOMTech., Trivi.HCI International 2007 - 12th International Conference on Human-ComputerInteraction, July 2007, Beijing
IMPROVE: Collaborative Design Review in Mobile Mixed Reality. Pedro Santos,Andre Stork, Thomas Gierlinger, Alain Pagani, Bruno Araujo, Ricardo Jota,Luis Bruno, Joaquim Jorge, Joao Madeiras Pereira, Martin Witzel, GiuseppeConti, Raffaele de Amicis, Inigo Barandarian, Celine Paloc, Oliver Machui,Jose M. Jimenez, Georg Bodammer, Don McIntyre Fraunhofer-IGD, A2, TU-Darmstadt, FB21,GRIS, INESC-ID, GraphiTech, VICOMTech., Trivi. HCI Inter-national 2007 - 12th International Conference on Human-Computer Interaction,July 2007, Beijing
IMPROVE: Advanced Displays and Interaction Techniques for Collaborative DesignReview. Pedro Santos, Andre Stork, Thomas Gierlinger, Alain Pagani, BrunoAraujo, Ricardo Jota, Luis Bruno, Joaquim Jorge, Joao Madeiras Pereira, Mar-tin Witzel, Giuseppe Conti, Raffaele de Amicis, Inigo Barandarian, Celine Paloc,Oliver Machui, Jose M. Jimenez, Georg Bodammer, Don McIntyre Fraunhofer-IGD, A2, TU-Darmstadt, FB21,GRIS, INESC-ID, GraphiTech, VICOMTech., Trivi.HCI International 2007 - 12th International Conference on Human-ComputerInteraction, July 2007, Beijing
Third Year: 2007 - 2008
For the third year, PhD applicants are required to present a candidacy and todefend their work-plan in a public defense. Based on the early finding of IM-PROVE, the candidacy occupied the first part of the third year, was successfullydefended and resulted in Section 2. Following the candidacy defense, duringthe second semester of the year, we conducted the first pointing user studythat can be read in the first part of Chapter 3. Finally, based on the ideas pre-sented on the candidacy (the idea that user position affects interaction withlarge-scale displays) and the preliminary results of the conducted user tests, weconducted the final users tests with the IMPROVE prototype and presented theresults in the conclusion of the three year european project. The conclusions onthe user tests (Chapter 4) were obtained during this period and later revisited,through user videos, annotations and application logs, to fit the frame of thisdocument (Further finding can be found in the documents published during
6

1: INTRODUCTION
the third year). The work executed during this period resulted in the followingpublications:
IMMIView: a multi-user solution for design review in real-time. Ricardo Jota, B.Araujo, L. Bruno, J. Pereira and J. Jorge. In Journal of Real-Time Image Process-ing, Volume 5, Issue 2. Springer. 91-107
A comparative study of interaction metaphors for large-scale displays. Ricardo Jota,M. Pereira, and J. Jorge. 2009. In Proceedings of the 27th international Con-ference Extended Abstracts on Human Factors in Computing Systems. ACM,New York, NY, 4135-4140.
Fourth Year: 2008 - 2009
My fourth year was spend abroad, at the university of Calgary, under the su-pervision of Saul Greenberg. With collaboration with Miguel Nacenta, we con-ducted a new user study on pointing techniques which is detailed in the secondpart of Chapter 3. Along with the previous user study (executed in year three)this represents the theoretical contribution of this thesis and resulted in the fol-lowing publication:
A comparison of ray pointing techniques for very large displays. Ricardo Jota, M. Na-centa, J. Jorge, S. Carpendale, and S. Greenberg. 2010. In Proceedings of Graph-ics Interface 2010 (GI ’10). Canadian Information Processing Society, Toronto,Ont., Canada, Canada, 269-276.
Fifth Year: 2009 - 2010
This document was produced during the fifth year, mostly during 2010. Along-side with the writing of the thesis, two side-projects were also executed: Max-imus, a european project on large-scale display for car design review applica-tions and an internship at Microsoft Research, under the supervision of HrvojeBenko. Both of these projects are not fully integrated within this document asthey were considered not within the scope of the argument presented. How-ever, the tabletop presented in Section 2.7 is a direct result of my involvementin Maximus; it was produced with collaboration with Diogo Mariano and inte-grated in the “LourenÃgo Fernandes” laboratory. Further information regard-ing publications or work produced in these is detailed in Chapter 5. The Mi-crosoft internship produced an accepted publication at EACHI’10.
7
1: INTRODUCTION
Constructing virtual 3D models with physical building blocks. Ricardo Jota andHrvoje Benko. 2011. In Proceedings of the 2011 annual conference extendedabstracts on Human factors in computing systems (CHI EA ’11). ACM, NewYork, NY, USA, 2173-2178.
Final Year: 2010 - 2011
The thesis document was concluded during the first semester of 2011 and de-fended on September 12, 2011. Alongside with we conclusion of the thesis, Icollaborated with Pedro Lopes towards a short paper, accepted at InteractiveTabletop Surface. This work was conducted using the hardware described inthis thesis
Augmenting touch interaction through acoustic sensing. Pedro Lopes, Ricardo Jota,and Joaquim A. Jorge. 2011. In Proceedings of the ACM International Confer-ence on Interactive Tabletops and Surfaces (ITS ’11). ACM, New York, NY, USA,53-56.
1.3 Dissertation Outline
The remaining of this document is organized in four chapters. The next chap-ter presents the research background, organized around how humans interacton large-scale display scenarios. We start by defining theoretical frameworksthat provide insights on how users perceive interactive environments. This isfollowed by a classification of large-scale displays. We classify them by a num-ber of factors, including display size and orientation. Afterwards we introduceprevious work on input devices, interaction techniques and distance related re-search. We conclude with a discussion that identifies what are the issues thatwe feel require further research.
In Chapter 3 we describe in detail the two studies conducted to evaluate ourhypothesis of user position affecting interaction performance. In the first study,we tested three metaphors in three different distances. The second user studywas conducted to understand what factors affect the interaction metaphor. Inthe second study we focus on ray-pointing, the class of technique that showedthe best promise. In Chapter 4 we take the lessons learnt in the user studies andapply them to a real world design review application that uses ray pointing
8

1: INTRODUCTION
techniques to interact with a large-scale display.
Finally, in Chapter 5 we present an overall discussion of our work, delineatingconclusions and introducing perspectives for future research.
9

1: INTRODUCTION
10
2Previous Work
Interactive surface scenarios include: (1) multiple users, free to move around;(2) one or more output devices to visualize information, generally a displayis presented as the primary output device; and (3) multiple input devices tomanipulate information and control the environment. This chapter describesthe related work for each component and presents related work that focuseson distance-aware interaction. We start by describing theories that provide aninsight on how the user behaves and how distance affects user behavior, andfollow this with a classification of primary output devices, focusing on largedisplays, and input devices for interactive surface scenarios. Afterwards, wedescribe the laboratory Lourenço Fernandes, a large-scale environment where thepresented work was partially produced. Finally, we finish the chapter with adiscussion of distance-aware interaction research.
2.1 Theoretical Frameworks
Descartes suggested that the body works like a machine, that it has the materialproperties of extension and motion, and that it follows the laws of physics. Themind (or soul), on the other hand, was described as a nonmaterial entity that
11
2: PREVIOUS WORK
lacks extension and motion, and does not follow the laws of physics [Descartes,1641]. In Descartes’ view, the subject is essentially an immaterial mind havinga body. Thus, the body acts like an object for mind to control. Descartes endedup with an extreme rationalism. Trusting only mathematical reason, he general-ized his own ideal and created a world where man became a detached observerto himself. Some of the most influential 20th century attempted at breakingout of the Cartesian paradigm, in Germany by Heidegger, and in France byMerleau-Ponty.
2.1.1 Heidegger
Martin Heidegger (1889-1976) belongs to the phenomenological tradition incontinental philosophy. In “being and Time” (1927) [Heidegger, 1979] he breakswith the tradition of exploring ideas without reference to our factual existenceas human beings. In trying to develop a philosophy starting out with our fac-tual human existence, he found himself trapped in the web of meaning pro-duced by the basic assumptions of Western civilization. He found it necessaryto develop a set of new concepts better suited for the task. Heidegger is relevantfor us because of the concepts regarding tool usage: breakdown, readiness-to-hand,present-at-hand. He describes a breakdown as following:
To the person doing the hammering, the hammer as such does not exist... Thehammer presents itself as a hammer only when there is some kind of breakingdown or unreadiness-to-hand. [Heidegger, 1979]
Thus, users are only conscious of their tools when the tools do not work asexpected. The concepts readiness-to-hand and present-at-hand are related to this.A tool is ready-to-hand when it is available to the user and works as expected.In this case, the user does not perceive the tool as one, but as a part of the taskat hand. If the user becomes aware of the tool, because of a breakdown, then thetool is present-at-hand and recognized as a separate object.
2.1.2 Merleau-Ponty
Taking the study of perception as his point of departure, Merleau-Ponty wasled to recognize that one’s body (le corps propre) is not only a potential objectof study for science, but is also a permanent condition of experience; a con-stituent of the perceptual openness to the world. He underlines the fact that
12
2: PREVIOUS WORK
there is an inherence of consciousness and body, of which the analysis of per-ception should take account. The primacy of perception signifies a primacyof experience, so to speak, insofar as perception becomes an active and consti-tutive dimension. Merleau-Ponty demonstrates what he calls a “corporealityof consciousness”. He argues that the body has as much intentionality as themind and so stands in contrast with the dualist ontology of mind and bodyof René Descartes. In the Phenomenology of Perception [Merleau-ponty, 1976]Merleau-Ponty wrote:
Insofar as I have hands, feet; a body, I sustain around me intentions whichare not dependent on my decisions and which affect my surroundings in away that I do not choose. - Merleau-Ponty [Merleau-ponty, 1976]
The question concerning corporeality connects also with Merleau-Ponty’s re-flections on space (l’espace) and the primacy of the dimension of depth (la pro-fondeur) as implied in the notion of being-in-the-world (être-dans-le-monde) andof one’s own body (le corps propre). For our work, Merleau’s work has the fol-lowing relevant aspects:
• Perception is embodied. We perceive the world with and through ouractive bodies: “The body is our general medium for having a world”.
• Tool use. When we learn to use a tool, it becomes integrated into our bodyboth as potential for action and as medium for perception.
• Bodily space. When we act in the world, our body has a dual nature. Onthe one hand, we can see it as an object among other objects in the “exter-nal” world. On the other hand, it exists to us as our experiencing/livingbody (le corpse propre). As a living body, we move within a space given bythe structure and limitations of our own body; our bodily space.
2.1.3 Embodied Cognition
Embodied Cognition is a growing research program in cognitive science thatemphasizes the formative role the environment plays in the development ofcognitive processes. The general theory contends that cognitive processes de-velop when a tightly coupled system emerges from real-time, goal-directed in-teractions between organisms and their environment; the nature of these inter-actions influences the formation and further specifies the nature of the develop-
13
2: PREVIOUS WORK
ing cognitive capacities. Embodied accounts of cognition have been formulatedin a variety of different ways in each of the sub-fields comprising cognitivescience (i.e., developmental psychology, artificial life, robotics, linguistics, andphilosophy of mind), and a rich interdisciplinary research program continuesto emerge. Yet, all of these different conceptions do maintain that one necessarycondition for cognition is embodiment, where the basic notion of embodimentis broadly understood as the unique way an organism’s sensory motor capaci-ties enable it to successfully interact with its environmental niche. In addition,all of the different formulations of the general embodied cognition thesis sharea common goal of developing cognitive explanations that capture the mannerin which mind, body, and world mutually interact and influence one another topromote an organism’s adaptive success. Embodied cognition offers differentclaims [Wilson, 2002], the most prominent being the following.
1. Cognition is situated. It takes place in the context of a real-word environ-ment.
2. Cognition is time pressured. It must be understood in terms of how itfunctions under the pressures of real-time interaction with the environ-ment.
3. We off-load cognitive work onto the environment. We make the environ-ment hold or even manipulate information for us.
4. The environment is part of the cognitive system. The information flowbetween mind and world is so dense and continuous that, for scientistsstudying the nature of cognitive activity, the mind alone is not a meaning-ful unit of analysis.
5. Cognition is for action. The function of the mind is to guide action, andcognitive mechanisms such as perception and memory must be under-stood in terms of their ultimate contribution to appropriate behavior fora given situation.
6. Off-line cognition is body based. Even when decoupled from the envi-ronment, the activity of the mind is grounded in mechanisms that evolvedfor interaction with the environment.
Embodied cognition presents some claims that are already used in HCI. Thatcognition is situated and time pressured is already accepted on multimodal in-teraction, for example, where input integration has timing restrictions [Oviatt
14

2: PREVIOUS WORK
et al. , 1997]. For our work, we are more interested in claims 3 and 4. Theseclaims focus on the environment as a means to enhance our cognitive work-load. Generally humans off-load work onto the environment either by preload-ing representations acquired throughout prior learning (pre-learned models),or by making use of the environment itself in strategic ways. Moreover, claim 4defends that the environment is part of the cognitive system, creating a largersystem that includes humans plus the environment. Thus changes between theparticipants, such as humans moving to a new location or beginning interactionwith a different set of objects, affect cognition.
2.2 Theoretical Interaction Frameworks
Figure 2.1: Model Human Processor, as depicted originally on Card et al. . 1983 [Card et al. ,
1983].
Theoretical interaction frameworks can be seen as cognitive theories directlyapplied to interaction. They are too abstract to be used for practical interaction,but present concepts that allow us to understand interaction and why we inter-act the way we do. The main question is not “What is interaction?” but “Whydo we interact like this?”.
Regarding interaction frameworks, HCI research is heavily based on CognitiveScience. Indeed, Donald Norman presented a great contribution on The Design
15

2: PREVIOUS WORK
of Everyday Things and later in The Invisible Computer [Norman, 1999, 2002].There are, however, other interaction frameworks that try to explain how usersperceive interaction. Dag Svanæs presents a survey on Understanding interac-tion [Svanæs, 2000]. Out of the seven frameworks presented by Svanæs, theframeworks Cognitive Science, Speech Act Theory, and Activity Theory presentconcepts relevant to our work. Computer semiotics [Andersen, 1990] repeatconcepts, already described on other frameworks, thus will not be explainedhere. We will also describe Model Human Processor for its significant contribu-tion to HCI today.
The Model Human Processor (MHP) was published by Card et al. in 1983[Card et al. , 1983]. Figure 2.1 depicts the model. The model describes the user’scognitive architecture as consisting of three processors, four memories, 19 pa-rameters and 10 principles of operation. In their model, information reaches theperceptual processor as chunks. These pieces of information are stored in imagestore, transferred to working memory, manipulated by the cognitive processor,and some times stored in long-term memory. Some activity in the cognitive pro-cessor leads to commands being sent to the motor processor, leading to musclesbeing contracted and actions being performed. MHP is relevant because it canpredict human reactions. Given a stimulus, a reaction can be calculated accord-ing to some processing rules (cognitive processor) and background information(memory banks).
Cognitive science is defined as the study of the mind (or intelligence). In real-ity, cognitive science is a broad term used for any kind of mental operation orstructure that can be studied in precise terms. Cognitive science was “adapted”to HCI by Norman in The Design of Everyday Things [Norman, 2002]. Norman’swork has two relevant points to our work: he models user intention (Figure 2.2second step) and defends that users use multiple mental models. Furthermore,when confronted with new situations (like a new interaction device or applica-tion) users try to satisfy their intention using older mental models, constructedfor similar situations. For example, when interacting with a ambient display,users may adopt the white board mental model and try to approach the ambi-ent display and touch it. This action can be a source for incidental interaction.Moreover, Norman also presents the concept of affordance: the way objects ex-pose their function according to their form. Finally, Norman defines automaticactions as actions that the users automate. He does not go into great detailabout automatic actions except that users create them to abstract interaction.
16
2: PREVIOUS WORK
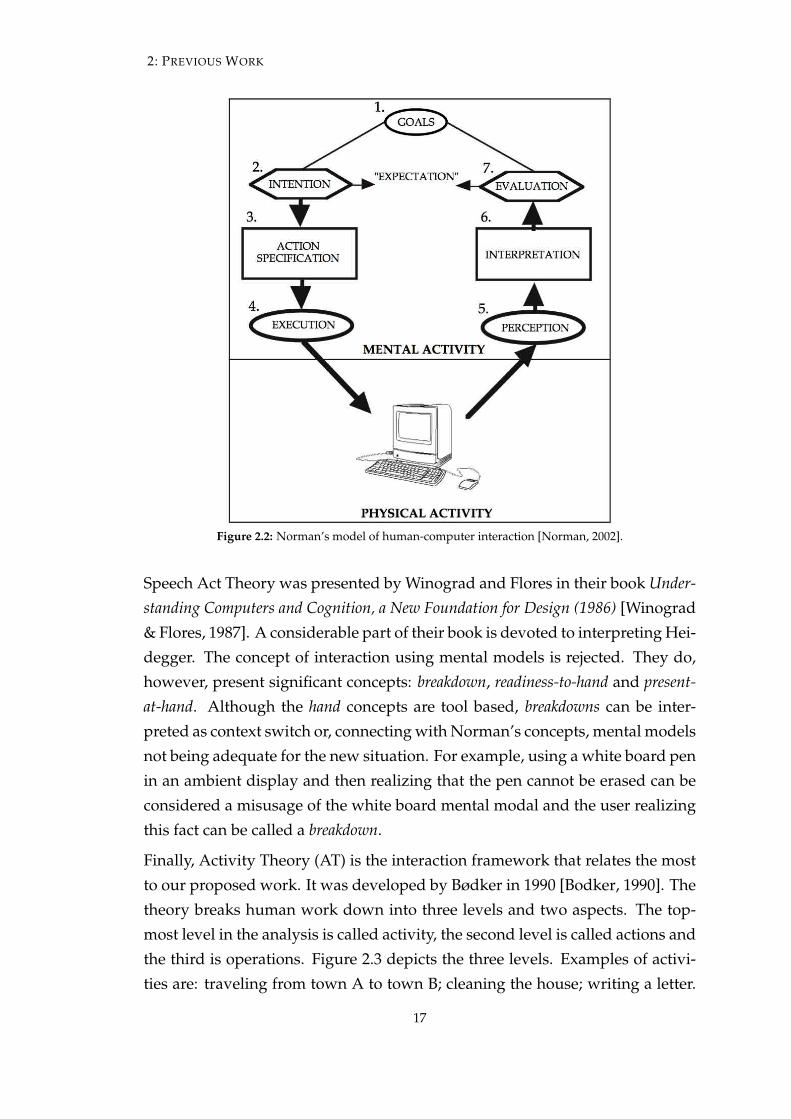
Figure 2.2: Norman’s model of human-computer interaction [Norman, 2002].
Speech Act Theory was presented by Winograd and Flores in their book Under-standing Computers and Cognition, a New Foundation for Design (1986) [Winograd& Flores, 1987]. A considerable part of their book is devoted to interpreting Hei-degger. The concept of interaction using mental models is rejected. They do,however, present significant concepts: breakdown, readiness-to-hand and present-at-hand. Although the hand concepts are tool based, breakdowns can be inter-preted as context switch or, connecting with Norman’s concepts, mental modelsnot being adequate for the new situation. For example, using a white board penin an ambient display and then realizing that the pen cannot be erased can beconsidered a misusage of the white board mental modal and the user realizingthis fact can be called a breakdown.
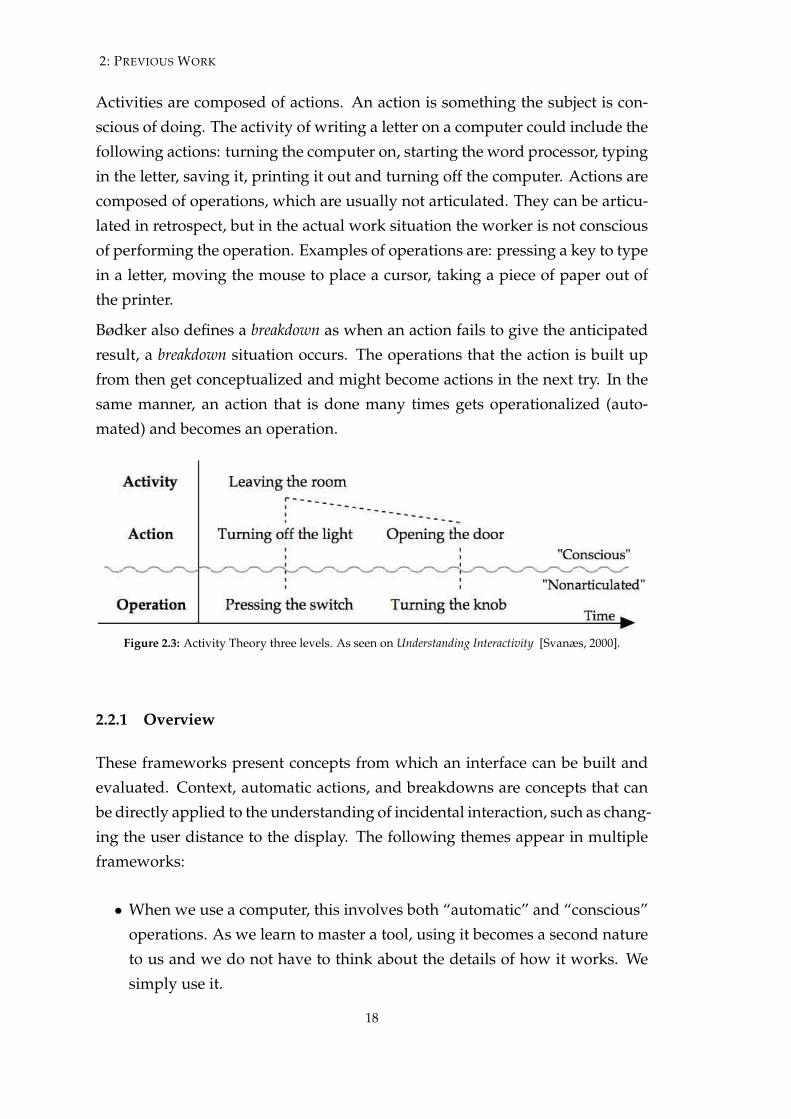
Finally, Activity Theory (AT) is the interaction framework that relates the mostto our proposed work. It was developed by Bødker in 1990 [Bodker, 1990]. Thetheory breaks human work down into three levels and two aspects. The top-most level in the analysis is called activity, the second level is called actions andthe third is operations. Figure 2.3 depicts the three levels. Examples of activi-ties are: traveling from town A to town B; cleaning the house; writing a letter.
17
2: PREVIOUS WORK
Activities are composed of actions. An action is something the subject is con-scious of doing. The activity of writing a letter on a computer could include thefollowing actions: turning the computer on, starting the word processor, typingin the letter, saving it, printing it out and turning off the computer. Actions arecomposed of operations, which are usually not articulated. They can be articu-lated in retrospect, but in the actual work situation the worker is not consciousof performing the operation. Examples of operations are: pressing a key to typein a letter, moving the mouse to place a cursor, taking a piece of paper out ofthe printer.
Bødker also defines a breakdown as when an action fails to give the anticipatedresult, a breakdown situation occurs. The operations that the action is built upfrom then get conceptualized and might become actions in the next try. In thesame manner, an action that is done many times gets operationalized (auto-mated) and becomes an operation.
Figure 2.3: Activity Theory three levels. As seen on Understanding Interactivity [Svanæs, 2000].
2.2.1 Overview
These frameworks present concepts from which an interface can be built andevaluated. Context, automatic actions, and breakdowns are concepts that canbe directly applied to the understanding of incidental interaction, such as chang-ing the user distance to the display. The following themes appear in multipleframeworks:
• When we use a computer, this involves both “automatic” and “conscious”operations. As we learn to master a tool, using it becomes a second natureto us and we do not have to think about the details of how it works. Wesimply use it.
18
2: PREVIOUS WORK
• Breakdown situations are particularly interesting from a research perspec-tive because the “silent” part of the user’s practice then becomes articu-lated and more easily available for investigation. Breakdowns are oftenfollowed by “repair” attempts, either by fixing the artifact or by learningmore about how it works. After a successful “repair”, the articulated oper-ations again become “silent” and no longer have the attention of the user.
• For most theories, the non-verbal/bodily aspects of interaction are treatedas more primitive processes, i.e. animal like. Nevertheless, they can berelevant for interaction.
• The body gives meaning to the interactions. Thus, context is also createdby the body, as a subject.
2.3 Task Models and Cognitive Architectures
Task models represent the refined knowledge on HCI. A comparison study ispresented by Limbourg and Vanderdonckt [Limbourg & Vanderdonckt, 2003].They intend to abstract actions and model how humans execute the steps re-quired for completion of a task/goal. They achieve a range of objectives [Boms-dorf & Szwillus, 1999]:
• To inform the designers about potential usability problems, as in hierarchi-cal task analysis (HTA);
• To evaluate human performance, as in Goals, Operators, Methods, and Se-lection rules (GOMS);
• To support design by providing a detailed task model describing task hier-archy, objects used and knowledge structures, as in Task Knowledge Struc-tures(TKS);
• To generate a prototype of a user interface.
Most of task models abstract user action as a method for executing a task. Fur-thermore, task models seldom acknowledge cognitive actions as relevant. Thus,task models are of no use to us, because of two main arguments: (1) they modeltask execution not interaction itself. Some, like, GOMS try to go further andmodel the lowest level of task decomposition (KLM is an example of a physicalextension to model user physical actions), but they still assume a given user
19
2: PREVIOUS WORK
interface. (2) The ones that try to model cognitive aspects of the interaction aretoo complex to be applied to simple interfaces (see Figure 2.4). Rather, they areapplied to evaluate existing user interfaces. As Limbourg and Vanderdoncktargue: task models that are primarily intended as support for evaluation anduser training, like HTA and GOMS, are not suitable for supporting user inter-face modeling. Rather, these models require an initial design of the interface.
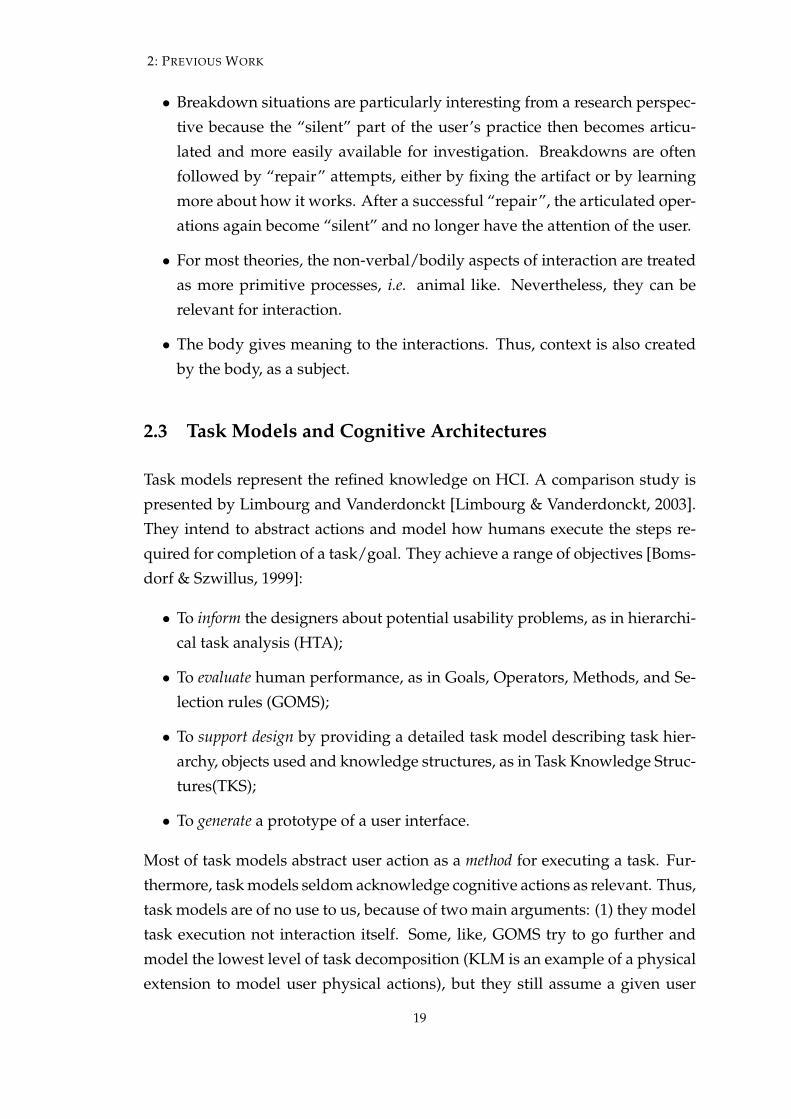
Cognitive architectures attempt to model the human cognitive system. They aredeveloped as broad theories of human cognition, based on a wide selection ofhuman experimental data. Compared to task models, they have a broader un-derstanding regarding human factors, as they may include attention, memory,problem solving, decision making, and so on. Alternatively, cognitive architec-tures, when applied to HCI, are large software systems that execute programswritten in the “language” of the cognitive architecture. This provides predictiveand quantitative information regarding user actions. Bryne [Byrne, 2003] di-vides cognitive architectures into two major groups, the past systems which in-clude Model Human Processor (MHP) and GOMS, Cognitive Complexity The-ory (CCT) and collaborative activation-based production system (CAPS). Thesecond group, which he named “contemporary architectures” include the CoL-iDes, Soar, EPIC and ATC-R/PM architectures. His concept of past systemsis similar to the previous definition of task models. They model how usersinteract, their goals and objectives. Yet they omit modeling many details ofuser behavior. In general, anything that falls outside the domains of proceduralknowledge is not modeled.
Contemporary systems are very complex, but they can be applied to model real-time predictions. However, this is limited to very simple actions, thus not yetapplicable to a physical multimodal interaction with incidental actions. Fur-thermore, some technical issues arise. Executive-Process/Interactive Control(EPIC), for example, is developed in LISP. This might present a limiting factorfor technical integration with applications not implemented in LISP. Moreover,the best characteristic of models and architectures—the predicament nature ofactions—is lost when modeling incidental interaction. The concept of inciden-tal prevents us from predicting when a user is going to execute an inciden-tal action, leaving us the option of acting upon recognizable incidental—notpredicted—actions. This may go according to the EPIC concept of sub-goaling,but it is a interpretation different from the intended one. Indeed, the best con-tribution for our work is the description of perception and motor mechanisms,
20
2: PREVIOUS WORK
relevant for identifying incidental actions.
Figure 2.4: Expressiveness versus complexity of task models. (Extracted from [Limbourg &
Vanderdonckt, 2003])
2.4 Proxemics
The term Proxemics was coined by Edward Hall [Hall, 1990]. It studies the socialnature of how people use space and how differences in space (distance) canaffect interaction between people. According to Hall the effects of proxemicsare summarized by the following:
...the influence of two bodies on each other is inversely proportional notonly to the square of their distance but possibly even the cube of the distancebetween them. - Edward Hall
Hall argues that social distance between people is correlated with physical dis-tance, as are intimate and personal distance, according to the following fourgeneral categories of space, each divided into two phases, close phase and farphase:
Intimate distance. This area begins at the person’s body and goes outto about 46cm away. It is the domain of the most intimate interactionswith people, typically a small handful of people with whom a person hasthe closest relationships. This includes kissing, hugs, whispers and closeconversation, and intimate types of touch. The close phase is between 0 cmand 15 cm and the far phase is between 15 and 46 cm.
21

2: PREVIOUS WORK
Personal space. This area begins at about 46cm away from the person bodyand goes out to about 1.2 meters. It is the domain of interactions withpeople the person knows well, such as good personal friends. Personalspace is also sometimes referenced as “personal bubble”, and is the spacethat varies the most based on culture. The close phase is between 46 cmand 76 cm and the far phase is between 76 ncm and 1.2 meters.
Social space. This area begins at about 1.2 meters away from the personbody and goes out to about 3.7 meters. It is the domain of interactionssuch as meeting someone new, greeting a familiar acquaintance, or gener-ally interacting with someone who is not particularly well known to you.The close phase is between 1.2 meters and 2.1 meters and the far phase isbetween 2.1 meters and 3.7 meters.
Public space. This area begins about 3.7 meters away and goes out to 7.6meters or more. It is the domain of public interactions such as taking astroll through the mall, walking down the street, or passing other peoplein the grocery store. The close phase is between 3.7 meters to 7.6 metersand the far phase is above 7.6 meters.
Proxemics goes further and defines types of spaces according to the way usersand object behave on that space. As such, three different kind of spaces areavailable:
1. Fixed-feature space This compromises things that are immobile, such aslarge displays, walls and boundaries.
2. Semi fixed-feature space This compromises objects that can be moved,such as mobile input devices, furniture or other movable boundaries.
3. Informal space The informal space compromises the space around thebody, that travels along with it.
These spaces vary from culture to culture and, although, not as relevantfor interaction as the social distance, it is relevant to understand that peo-ple will react differently to objects that they can move from those that arestationary.
22

2: PREVIOUS WORK
2.5 Large-Scale Displays
The display is such a fundamental piece of large-scale display scenarios thatthe environment is often named after the display technical specifications. Inthis section we describe what is a large-scale display and review the differ-ent types of large-scale display. We start by dividing large-scale displays intothe more common vertical and horizontal surfaces. Less common solutionshave also been proposed, for example the slanted table of the Perceptive Work-bench [Leibe et al. , 2000] or the combination of vertical and horizontal pre-sented in bendDesk [Weiss et al. , 2010b].
2.5.1 Vertical surfaces
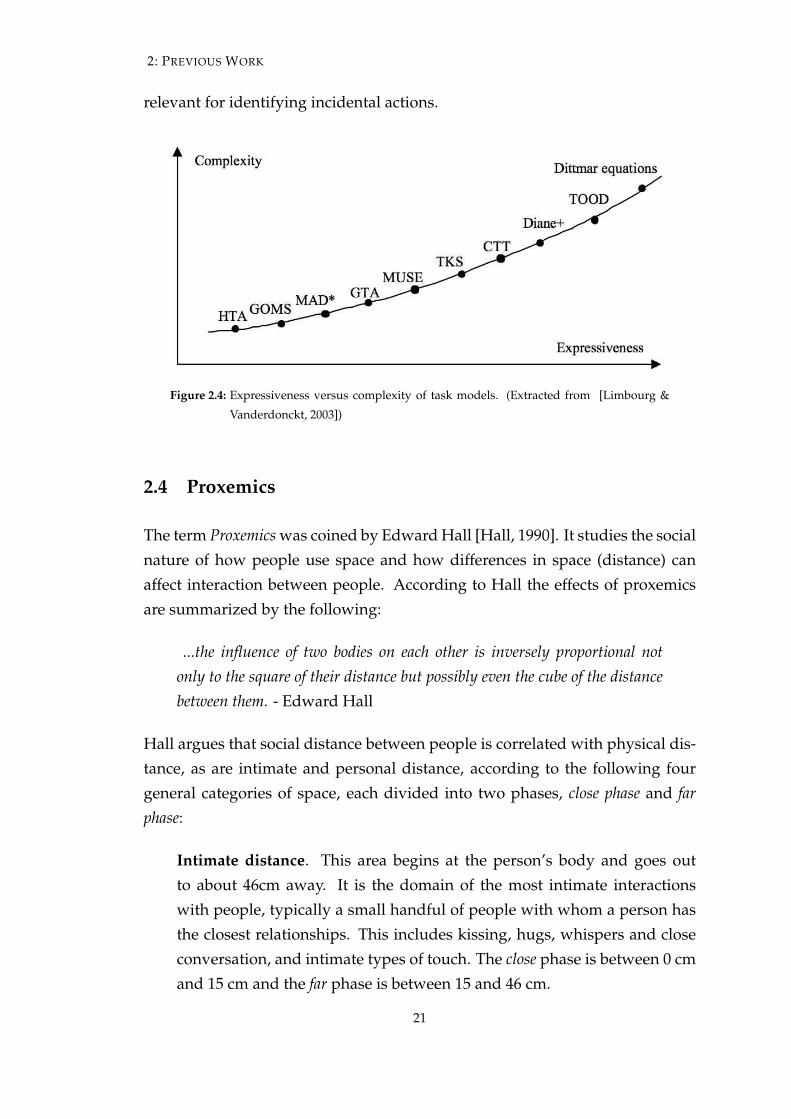
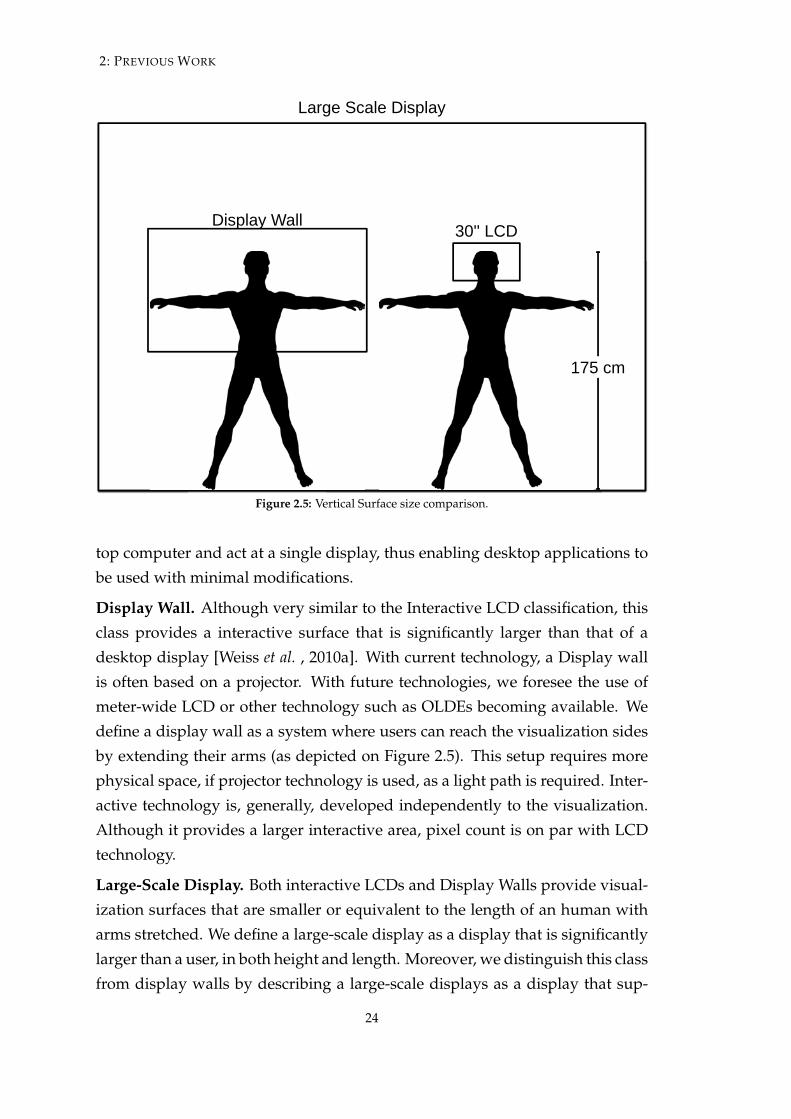
Vertical surfaces are a logic extension of display technology available in desk-top scenarios. Larger LCD screens are already classified as large-scale dis-plays [Grubert et al. , 2007]. However, initial large scale display research wasbased on a single projection augmented to a display surface, significantly largerthan a 56cm display [Bolt, 1980]. Large vertical surfaces range from 100cmLCD displays up to multi-projection environments, such as caves [Buxton et al. ,2000]. Although there are other features that can be used to define a large-scaledisplay such as high resolution or number of computers that are dedicated tovisualization, in this thesis we consider a large scale surface to be defined inrelation to a user’s reach and height. Therefore, any surface that is, at least, twothirds of user’s height and has a width of, at least, double the users arm spanis considered, by us, to be a large-scale display. Figure 2.5 depicts size compar-isons. In the related work there are multiple classifications for large displays.We present a brief definition for each classification mentioned in the relatedwork:
Interactive LCD. Some large LCDs are considered to be large-scale displays. Ingeneral, these are the smallest of the large-scale displays but may include inter-action technology, such as touch-sensitive displays. They are often positionedat shoulders height where users interact by standing in front of them. Becauseof their size, they do not provide an immersive environment or a very highpixel count. On the other hand, they are the setup that requires the least physi-cal space, for example a flat LCD positioned on a wall does not require physicalspace for a back-projection. Moreover, they are often connected to single desk-
23
2: PREVIOUS WORK
30'' LCDDisplay Wall
Large Scale Display
175 cm
Figure 2.5: Vertical Surface size comparison.
top computer and act at a single display, thus enabling desktop applications tobe used with minimal modifications.
Display Wall. Although very similar to the Interactive LCD classification, thisclass provides a interactive surface that is significantly larger than that of adesktop display [Weiss et al. , 2010a]. With current technology, a Display wallis often based on a projector. With future technologies, we foresee the use ofmeter-wide LCD or other technology such as OLDEs becoming available. Wedefine a display wall as a system where users can reach the visualization sidesby extending their arms (as depicted on Figure 2.5). This setup requires morephysical space, if projector technology is used, as a light path is required. Inter-active technology is, generally, developed independently to the visualization.Although it provides a larger interactive area, pixel count is on par with LCDtechnology.
Large-Scale Display. Both interactive LCDs and Display Walls provide visual-ization surfaces that are smaller or equivalent to the length of an human witharms stretched. We define a large-scale display as a display that is significantlylarger than a user, in both height and length. Moreover, we distinguish this classfrom display walls by describing a large-scale displays as a display that sup-
24
2: PREVIOUS WORK
ports three or more users simultaneously interacting side-by-side, as depictedon Figure 2.5. To achieve greater visualization sizes, large-scale displays use ei-ther high-end projectors that requires a large physical space for projection andincreases costs, or multiple off-the-shelf LCD which still require some physi-cal size for support structures but reduces costs. In large-scale displays, themultiple projectors are still powered by a single machine with multiple graph-ics cards. This allows developers to still use the large-scale display as a singleoutput source and push the projection details to the operating system and thegraphics drivers. Depending on the number of the displays or projectors used,pixel counts can be very large and often is two to three times bigger that displaywalls.
Powerwall. Large-scale displays are being applied to a number of researchareas. Some areas focus on the development of new projection technologies,while others have requirements that end up focusing on specific characteristicsof large-scale displays, such as high dynamic range imaging. For example, thevisualization of large quantities of data requires two things: (1) an large visu-alization surface, with a high density of pixels and (2) high processing power.This requirement led to a class of large-scale displays based on cluster comput-ing. Powerwalls are similar to the large-scale display in size but differ in im-plementation. They are powered by multiple computers, called clusters, whereeach computer is responsible for one output device. The result is a tiled dis-play powered by a high-performance cluster that is able to provide high pixelcount and visualize large sets of data such as cloud points or physics simula-tions. If presentation is not a concern, to simplify hardware implementation,standard LCDs can be used. However, visible seams will be present in the tileddisplay. When presentation is a concern, a solution is to replace the LCD withprojectors that, when accurately positioned, do not present seams and providethe illusion of a large single display. In this case, issues such as color calibra-tion become relevant [Soares et al. , 2007]. Depending on the number of outputdevices, Powerwalls can be connected to a desktop-like environment [DMX,2011] but distributed visualization tools are often used [OpenSG, 2010]. Thesetools enable the user to abstract the cluster configuration and look at the multi-ple displays as a single device. However, these tools generally require the useof a specific graphical API, such as OpenGL, for visualization.
CAVE. Cave scenarios bring a new approach to large-scale displays. Otherclasses of large-scale display focus on presenting a single display, in front of
25

2: PREVIOUS WORK
the user. Instead of a single display, CAVE scenarios provide an immersiveenvironment that surrounds the user with display technology. That is, CAVEdisplays provide visualization in front of the user, to the left, to the right, andsometimes down, up, and back. The multiple visualizations makes them moreadequate for navigation scenarios or other scenarios that benefit from an im-mersive experience. Similar to Powerwalls, CAVEs generally require multiplecomputers to power the environment and require specific distributed visualiza-tion algorithms to provide a correct scene with corner correction (to increase im-mersion). More so than Powerwalls, caves require specific developing tools andapplications developed are often developed in graphical api such as OpenSG1.
2.5.2 Horizontal surfaces
Horizontal surfaces provide different affordances that vertical surfaces. In ver-tical surfaces, two users collaborate side-by-side. With horizontal surfaces userscan collaborate face-to-face. This makes them more adequate for collaborativesupported work. The CSCW community has long adopted tabletop as a rele-vant collaborative setup for multiple users. However, horizontal surfaces havenot evolved on the same direction as vertical surfaces. In particular, althoughhorizontal surfaces have been increasing in size, thus generally vary between alarge LCD and a display wall size. This is due to the fact that horizontal surfacesare seen as workbench replacements for non-interactive tables and therefore fol-low ergonomic restrictions to how users position in collaborative environments.Indeed, bigger tables would provide more space for display and interaction but,without proper awareness techniques [Isenberg, 2009], they might not create anenvironment where users are aware of others and collaborate. Horizontal sur-faces have developed to provide interaction and collaboration support, whichwe will further expand on section 2.6.1.
Horizontal surfaces are generally a single output device environment and oftenuse projector display technology. This helps simply application developmentand cost. Although there is a slight variation on size, this can be solved bypositioning the projector farther away from the surface or use mirrors to foldthe light path. There are two main variants for projection: back-projection andfront-projection. Although very similar in results, there are some differencesbetween them.
1www.opensg.org
26

2: PREVIOUS WORK
Back-projection provides an experience similar to vertical displays where ob-jects on top of the table cannot be augmented with visualization because objectsare positioned between the viewpoint and the projection origin, thus projectionhits the back of the object. Back-projection often provides a smaller physicalfootprint, where the light path is folded and the tabletop system resembles aclosed cube or rectangle. This has implications on overall size, because theposition of the display forbids user interaction from that side and human com-fortable table height limits projection size due to light path physics. At thetime of this dissertation, LCD technology is emerging and modern LCD tablesare now available2. For argument sake, these share the same implications ofback-projection solutions, where the light path is small. Thus, they effectivelyremove ergonomic limitations of back-projection.
Front-projection allows for bigger sizes and does not hinder user movementsbecause the light path can be folded above the user interaction space and pointeddirectly down to the surface. However, it provides a projection where any ob-ject between the projector and the table creates shadows, thus occluding thevisualization. Although this might prove useful to augment objects, it can alsobe seen as an hinderance and is thus often avoided.
2.6 Interaction
The previous section describes the display; the definitive element in a large-scale display scenario. This section describes how such scenarios provide inter-activity, thus enabling users to visualize and manipulate information.
To provide interactivity, one has to capture user actions and convert them tocommands. We divide this section into two subsections: devices and tech-niques. Devices describe how to capture user information. Techniques describehow that information is converted to interaction commands.
2.6.1 Devices
A device is any kind of technological apparatus that is able to capture useractions and act an an input device. Input devices are the focus of multipleresearch communities. In this section we present input device research related
2version 2 of Microsoft surface. www.microsoft.com/surface
27
2: PREVIOUS WORK
to large-scale displays. Moreover, we divide input devices according to thedistance the user is to the display.
Close Interaction
A user is considered interacting at close distance if he or she is within arm’sreach. This kind of interaction is common on tabletops were users touch thesurface, but can also be applied to display walls.
Touch-sensitive displays. Based on capacitive or resistive technologies have beenunder research for at least 25 years [Lee et al. , 1985; Sutherland, 1963] andare now available as commodity LCD that enhance existing (non-interactive)LCD [Russell et al. , 2005]. One of the first interactive tabletop to have multi-touch support was the DiamondTouch [Dietz & Leigh, 2001]. The prototype usesmodulated electric fields which are capacitively coupled through the users toreceivers installed in the work environment to detect touches. Furthermore, bytracing the electric spike origin, the diamondTouch can identify which personis touching where. On the other hand, by using a modulated electric field,they still have hardware limitation in the number of touches they are able torecognize. The early units supported up to four users and later prototypes upto eight users.
To overcome hardware limitations regarding the number of detectable touches,research has also adopted computer-vision based solutions. At first, solutionslike Touchlight had no limitations regarding the number of touches but, as atrade-off, were less precise than electrical solutions. Touchlight [Wilson, 2004]uses simple image processing techniques to combine the output of two videocameras placed behind a semi-transparent plane in front of the user. A touchis detected whenever the two image rectified and fused and the same infor-mation appears on the same position for both images. Another example isPlayAnywhere [Wilson, 2005], where Wilson et al. used a shadow-based touchalgorithm to detect touch. Whenever the shadow fingertip size goes below athreshold, the system considers the finger to be touching a surface. In additionto touch, this prototype is also able to recognize tangibles and project on top ofphysical objects.
Touch detection solutions have matured and, at the time of writing this thesis,there are a number of solutions for multi-touch. FTIR was first introduced by
28
2: PREVIOUS WORK
Jef Han [Han, 2005]. It works by filling a sheet of acrylic with infra-red light thatbounces around inside due to total internal reflection. When a person touchesthe acrylic surface, the finger interrupts the total internal reflection by creatinga diffusive spot and frustrating the light. This results in the infrared light beingsend outside the acrylic and being captured by a camera, as a bright blob. A DIsetup shines infra-red light from the opposite side of the touch surface (back).The surface scatters the light and no reflection is re-projected to the camera (nextto the light emitter). Whenever a user touches the surface, the finger and theacrylic create a blob that reflects back the infra-red back to the camera that canbe interpreted as a touch event. DI is often used to recognize fiducially markers.Reactable [Jordà et al. , 2007], for example, uses this setup to recognize a numberof objects and provide an interactive music experience [Fu et al. , 2010; Takeokaet al. , 2010]. LLP works by creating a plane of light just above the surface,on the interaction side (front). Touches refract the laser light that navigatesthrough the acrylic to reach the infra-red camera on the other side (back) ofthe acrylic. The UnMousePad uses interpolating force sensitive resistance todetect touch [Rosenberg & Perlin, 2009]. Finally, Smart Technologies [Tech.,2010] provides frames and LCD that use DViTTM to detect a number of touches(early system detected only two).
Other devices. are also available for close interaction. Subramanian proposesmulti-layer interaction that adapts the interaction accordingly to the distanceof the user’s hand to the display and supports both hover and touch inter-action [Subramanian et al. , 2006]. Stødle proposes a gesture-based techniquebased on vertical and horizontal gestures to control applications, again, pro-viding very close to the display [Stødle et al. , 2008]. In FlowMouse, Wilsonuses hand movements as a vertical mouse to control a desktop cursor [Wil-son & Cutrell, 2005]. Finally, techniques such as acoustic sensing can also beapplied to touch detection [Paradiso et al. , 2002]. While not as accurate ascomputer vision they can recognize a number of hand actions, such as knuck-les or palm taps. With the arrival of new camera technology, such as depthcameras, new methods to enable touch surfaces are being developed. Usingthe Kinect, Wilson et al. explored how these sensors enhance non-flat surfacesand present Lightspace [Wilson & Benko, 2010], a prototype where normal (notinstrumented) surfaces are augmented using multiple depth-cameras as inputdevices. Here they use the 3D information available from the depth cameras to
29
2: PREVIOUS WORK
track users’ hand and create touch events whenever the user touches the sur-face.
Distant interaction
We define Distant Interaction as any interaction that is conducted outside armsreach. In contrast with close interaction, users cannot touch the display. There-fore, they require interaction metaphors that are not based on direct touch in-teraction. This has lead to two main solutions: gestural interfaces, based oncomputer vision, and pointing devices.
Gestural Interfaces Computer vision along with machine learning algorithmsare often used in gestural interfaces to segment skin color and detect handgestures. Several recognition methods have been documented. Quek [Quek& Zhao, 1996] and Wu [Wu & Huang, 2000] use inductive learning in orderto reduce computation time but this required a large training set. Nolker etal. [Nolker & Ritter, 1996] use Hidden Markov Model to identify simple ges-tures. By 1998, one of the first papers describing model-based tracking for ges-ture recognition was presented [Lien & Huang, 1998]: yet the main problemwith model-based tracking is that its computation algorithm weight did notallow for a real-time recognition.
More recently, some works [Oka et al. , 2002; Sato et al. , 2000; von Hardenberg& Bérard, 2001] focus on tracking fingertips as a gesture recognition strategy.Sato [Sato et al. , 2001] also presented a neural network approach, which alsorequired a good training set. In 2003, Wu et al. [Wu & Balakrishnan, 2003]published a paper using hand gestural interaction, where they use a touch sur-face to aid gesture recognition. Access to a touch surface is not always possible,thus we do not view this as a desired setup. Rivière and Guitton [de la Rivière& Guitton, 2003, 2005] use model-based tracking to recover postures and im-age moments to extract translation and rotation for 3D objects. It is not clearwhenever the work is rotation independent or if its recognition speed allowsreal-time. Kim and Fellner [Kim & Fellner, 2004] use marked fingertips and in-frared light to track hand motion and recognize gestures, where they appliedtheir work to 3D object manipulation and deformation. Malik et al. [Ma-lik & Laszlo, 2004; Malik et al. , 2005a] use hand gestures over a tabletop asa two-handed input device for large displays from a distance. They consider
30
2: PREVIOUS WORK
fingertips and gesture recognition as two completely distinct processing steps.
Lawson and Duric [Lawson & Duric, 2006] recognize gestures by analyzing thehand silhouette and convex hull. Their recognition is both scale and rotation in-dependent, but they can only recognize gestures that have non-convex silhou-ettes, thus limiting the set of identifiable gestures. Jota et al. use Cali [Fonsecaet al. , 2005], a generic recognition library initially devised for recognition in cal-ligraphic interfaces [Fonseca et al. , 2002], to identify specific shapes or gesturesfrom sketches or classify hand shapes for retrieval [Jota et al. , 2006]. Gesturalinterfaces culminate with the release of depth cameras for console gaming andits use for gesture recognition within the context of gaming [Microsoft, 2010].
Pointing Devices. Pointing can be interpreted through computer vision algo-rithms to segment the arm and obtain an interaction point [de la Hamette et al., 2002; Leubner et al. , 2001], or through the use of artifacts as pointing de-vices [Grubert et al. , 2007]. Vogel combines pointing with hand gestures toexplore freehand pointing [Vogel & Balakrishnan, 2005] and Sato proposes thesame approach but with no marker tracking [Sato et al. , 2001]. Kela presentsa study where accelerometers are used to recognize the viability of gestures asan interaction technique [Kela et al. , 2006]. Kela found gestures to be good forcommands with spatial association in design environment control. Kim sup-ports 3D object manipulation using gestures and uses a grab gesture to moveobjects [Kim & Fellner, 2004]. Others focus on interaction based on artifacts.Jiang et al. use a USB camera as a pointing device [Jiang et al. , 2006]. Thecamera tracks a distinctive cursor (a bright red dot) and moves the cursor to thecenter of the usb camera image. That is, if the cursor is detected to the left of theimage, it moves the cursor right. Effectively positioning the cursor in the gen-eral direction the user is pointing. Cao explores a colored stick as an interactionartifact for large displays [Cao & Balakrishnan, 2003] and multiple works adaptlasers for large-scale displays [Davis & Chen, 2002; Lapointe & Godin, 2005; Oh& Stuerzlinger, 2002]. Baudisch presents Soap, a pointing device based on anoptical sensor device moving freely inside a hull made of fabric. Soap behaveslike a mouse, but does not require a surface, thus is adequate for distant inter-action [Baudisch et al. , 2006]. Shoemaker presents an interaction technique thatmakes use of a perspective projection applied to a shadow representation of auser [Shoemaker et al. , 2007]. He uses a light to cast shadows onto a large-scaledisplay and, by moving towards the light, thus increasing the shadow reach,
31
2: PREVIOUS WORK
thus the user can access out-of-reach objects. Finally, Malik explores the ideaof having a small tabletop with gesture recognition to interact with the dis-play [Malik et al. , 2005b]. Pointing devices have also been developed in thegaming community. For example, the Wiimote and PS3 Move are two productsthat can be used as interaction devices in the context of gaming [Nintendo, 2011;Sony, 2011].
2.6.2 Interaction Techniques
We define an interaction technique as a different way to convert device inputinformation into an interface action. Because this thesis focuses on pointing asan interaction technique, this section will focus on pointing techniques or tech-niques that result in cursor actions. We will further focus on ray pointing tech-niques, a sub-set of pointing techniques where the cursor position is defined bya ray cast from the interaction device position. The related work presented fallsmostly into three categories. Laser pointing studies for distant displays, cursorenhancing techniques, and virtual reality techniques for object manipulation in3D worlds. In this section we also discuss modeling of targeting performanceand existing enhancements to ray pointing.
Laser Pointers for Large Displays. Thanks to the studies in this first category wenow know a great deal about laser pointing. For example, MacKenzie and Ju-soh [MacKenzie & Jusoh, 2001] and Stuerzlinger and Oh [Oh & Stuerzlinger,2002] showed that laser pointing targeting performance is poor compared tothe mouse (and around 1.4b/s vs 3.0b/s, respectively). Peck [Peck, 2001] pa-rameterized the jitter of a laser pointer spot in terms of angle, and suggests thatgrip affects it. Myers and colleagues [Myers et al. , 2001] studied the effect ofdifferent grips and postures, and found reduced jitter with a PDA-pointer heldwith two hands.
Laser Pointer Enhancements. Several enhancements have been proposed that mod-ify or improve the operation of ray pointing and distant pointing interaction.For example, laser pointers are often filtered [Davis & Chen, 2002; Vogel & Bal-akrishnan, 2005] or the CD gain altered [König et al. , 2009]. We know that someof those mechanisms may improve pointing (e.g., filtering) but these also implytrade-offs (e.g., filtering implies delay [Pavlovych & Stuerzlinger, 2009], and
32

2: PREVIOUS WORK
semantic snarfing [Myers et al. , 2001] makes it harder to operate with emptyspace). These modifications can introduce a large number of parameters thatcan change fundamental of ray pointing.
Cursor Enhancing Techniques. Given a pointing device and a cursor, one can en-hance the mouse with more that just filtering or gain. Bolt mixes pointing withspeech to create an early multi-modal interface, thus providing one of the firstlarge-scale display cursor enhancing techniques [Bolt, 1980]. The bubble cursoris target acquisition technique based on area cursors [Grossman & Balakrish-nan, 2005]. In bubble cursor, the user pointing to a desired position and thecursor automatically resizes depending on the proximity of surrounding tar-gets, such that one target is selectable at any time. This concept is further ex-plored in the speech-filtered bubble ray technique [Tse et al. , 2007], where theauthors use pointing to indicate the approximate location and speech to filtertargets inside the cursor bubble according to their visual characteristics, suchas color. The Ninja cursor technique uses multiple cursors to improve targetacquisition where each cursor moves synchronously following mouse move-ment [Kobayashi & Igarashi, 2008]. Having multiple cursors present new prob-lems, such as which cursor is the active one. Kobayashi handles this ambigu-ity by only allowing a single cursor over a target, effectively disambiguatingwhich cursor is active. However, blocking cursors may reduce the regularity ofthe cursor distribution and reduce ninja cursor effectiveness. Myers et al. uselasers to copy objects onto a handheld device and use take advantage of hand-held familiar manipulation techniques to interact with the object [Myers et al., 2001]. Finally, Apitz and Guimbretière present CrossY, a drawing applica-tion that demonstrates feasibility of goal crossing as the basis for a graphicaluser interface. Although not directly applied to large-scale displays, the cross-ing technique helps reduce jitter and provides a smooth interface for pointingbased devices [Apitz & Guimbretière, 2005].
Pointing in VR. The variety of pointing techniques studied in the Virtual Real-ity literature is broader, since image-plane techniques are easy to implement(the required tracking of head or eyes is already present). Studies compar-ing image-plane selection to ray casting (laser pointing) for manipulation of3D objects in 3D spaces have found that the image plane method is generallyfaster [Argelaguet & Andujar, 2009; Bowman & Hodges, 1997; Bowman et al.
33
2: PREVIOUS WORK
, 2001; Lee et al. , 2003; Ware & Lowther, 1997; Wingrave et al. , 2005]. This ledHill and Johnson [Hill & Johnson, 2008] to propose an interaction manipulationframework based on image-plane techniques. However, most of the above-mentioned studies concern 3D tasks, which can be radically different to the 2Dtasks that are our concern. It is not yet clear whether image-plane techniqueswill provide performance advantages for pointing to large 2D surfaces.
Modeling of the Targeting Task. Kondraske [Kondraske, 1994] suggested that ro-tational tasks (e.g. rotating a knob to a particular position) are better modeledby Fitts’s law if the angular distances are taken into account. This modeling ap-proach is relevant for ray pointing because the movement of the hand is oftenrotational, but also because, with large displays, linear measures do not repre-sent faithfully perceived distances and sizes as seen by the user (e.g., targets ofthe same size on distant areas of the display appear narrower than targets closeto the user). Kopper et al. [Kopper et al. , 2010] explored a number of models,including some based on angles, and others that include a distance parameter.To date, however, linear models for ray pointing tasks are still predominant,since there is no strong evidence supporting a substantial modeling benefit ofusing angles.
2.7 The Lourenço Fernandes environment
The Lourenço Fernandes environment is where most of the work presented inthis thesis was conducted. In order to execute future steps, the first year of thiswork-plan was applied to building this large-scale display environment.
The environment is based on a Powerwall as a primary display and a tabletopas an horizontal display. These can be used together or as separate displays,according to the needs of the project. Users have multiple interaction devicesavailable in the environment. For the Powerwall, users can use laser pens, trackobjects using a marker-based tracking system and Wiimotes. The tabletop sup-ports multi-touch interaction and can also use tracked objects as interactiondevices.
34
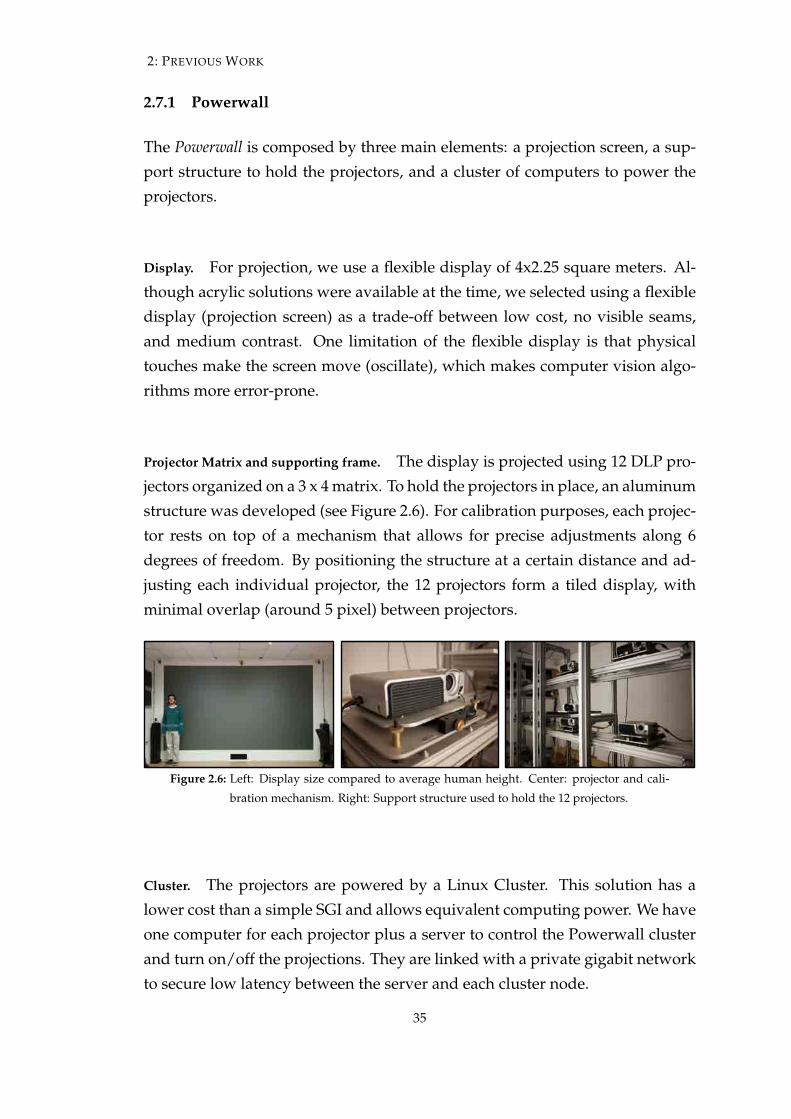
2: PREVIOUS WORK
2.7.1 Powerwall
The Powerwall is composed by three main elements: a projection screen, a sup-port structure to hold the projectors, and a cluster of computers to power theprojectors.
Display. For projection, we use a flexible display of 4x2.25 square meters. Al-though acrylic solutions were available at the time, we selected using a flexibledisplay (projection screen) as a trade-off between low cost, no visible seams,and medium contrast. One limitation of the flexible display is that physicaltouches make the screen move (oscillate), which makes computer vision algo-rithms more error-prone.
Projector Matrix and supporting frame. The display is projected using 12 DLP pro-jectors organized on a 3 x 4 matrix. To hold the projectors in place, an aluminumstructure was developed (see Figure 2.6). For calibration purposes, each projec-tor rests on top of a mechanism that allows for precise adjustments along 6degrees of freedom. By positioning the structure at a certain distance and ad-justing each individual projector, the 12 projectors form a tiled display, withminimal overlap (around 5 pixel) between projectors.
Figure 2.6: Left: Display size compared to average human height. Center: projector and cali-
bration mechanism. Right: Support structure used to hold the 12 projectors.
Cluster. The projectors are powered by a Linux Cluster. This solution has alower cost than a simple SGI and allows equivalent computing power. We haveone computer for each projector plus a server to control the Powerwall clusterand turn on/off the projections. They are linked with a private gigabit networkto secure low latency between the server and each cluster node.
35
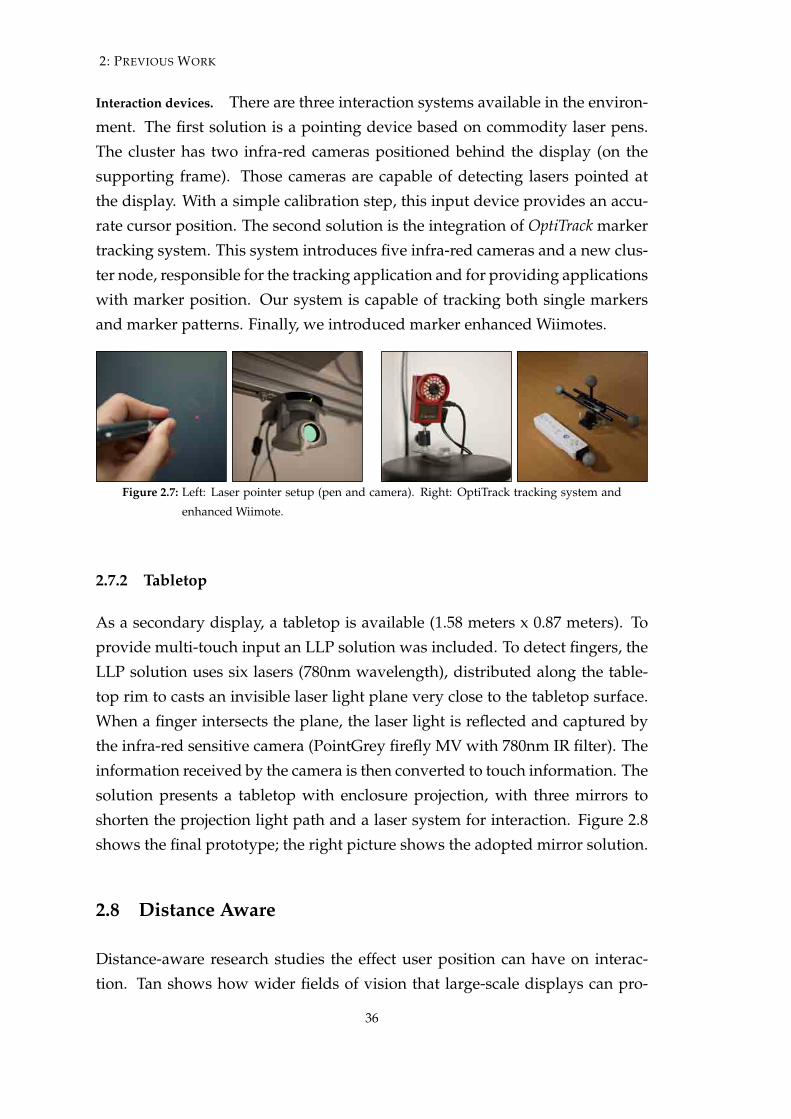
2: PREVIOUS WORK
Interaction devices. There are three interaction systems available in the environ-ment. The first solution is a pointing device based on commodity laser pens.The cluster has two infra-red cameras positioned behind the display (on thesupporting frame). Those cameras are capable of detecting lasers pointed atthe display. With a simple calibration step, this input device provides an accu-rate cursor position. The second solution is the integration of OptiTrack markertracking system. This system introduces five infra-red cameras and a new clus-ter node, responsible for the tracking application and for providing applicationswith marker position. Our system is capable of tracking both single markersand marker patterns. Finally, we introduced marker enhanced Wiimotes.
Figure 2.7: Left: Laser pointer setup (pen and camera). Right: OptiTrack tracking system and
enhanced Wiimote.
2.7.2 Tabletop
As a secondary display, a tabletop is available (1.58 meters x 0.87 meters). Toprovide multi-touch input an LLP solution was included. To detect fingers, theLLP solution uses six lasers (780nm wavelength), distributed along the table-top rim to casts an invisible laser light plane very close to the tabletop surface.When a finger intersects the plane, the laser light is reflected and captured bythe infra-red sensitive camera (PointGrey firefly MV with 780nm IR filter). Theinformation received by the camera is then converted to touch information. Thesolution presents a tabletop with enclosure projection, with three mirrors toshorten the projection light path and a laser system for interaction. Figure 2.8shows the final prototype; the right picture shows the adopted mirror solution.
2.8 Distance Aware
Distance-aware research studies the effect user position can have on interac-tion. Tan shows how wider fields of vision that large-scale displays can pro-
36

2: PREVIOUS WORK
Figure 2.8: Left: Mirror solution to fold projector image path; Center: Laser devices used to
create a IR light plane used for multi-touch support; Right: Final prototype.
vide can bring improvements for women on 3D navigation [Tan et al. , 2003].Ball argues that increased physical navigation on larger displays improves userperformance [Ball et al. , 2007]. Wigdor et al. study how the relation betweendisplay position and control space orientation affects user performance [Wig-dor et al. , 2006]. They show that users do not always prefer the display po-sition where they performed best and suggest that the trade-off between per-formance and comfort should be considered when designing multi-display en-vironments. Teather et al. present a study on the effects of user position andorientation on interaction [Teather & Stuerzlinger, 2008]. They suggest that theorientation of the device, in relation to the display, is not a relevant factor. Cock-burn et al. study the effect of visual feedback has no spatial targeting acquisi-tion [Cockburn et al. , 2011] and present three different pointing techniques.They conclude that a technique that translates the pointer from a 2D plane to ascreen positions presents the best results out of the three tested.
Another approach relevant for our study is how distance can be used to adaptthe interface. Harrison magnifies information according to the user proxim-ity to the screen [Harrison & Dey, 2008]. Ball applies the same technique tolarge-scale displays [Ball et al. , 2007] and acknowledges physical navigation asbeneficial on the tasks tested. Vogel proposes an interactive system for publicinterfaces based on distance driven context [Vogel & Balakrishnan, 2004]. Shoe-maker presents an interaction metaphor based on shadows [Shoemaker et al. ,2007]. With his shadow technique, users are required to move away from thedisplay to reach higher targets. Shoemaker et al. study how distance affects in-teraction on another paper, where he tests text input techniques for large-scaleDisplays [Shoemaker et al. , 2009]. In this study, Shoemaker defines text in-put techniques accordingly to two factors, visibility and distance, and found thatdistance-independent techniques provide better results on large-scale displays.
37
2: PREVIOUS WORK
Grubert and Myers present studies similar to ours [Grubert et al. , 2007; Myerset al. , 2002]. Grubert compares direct versus indirect input on a wall display.Although multiple techniques are studied (direct versus indirect), the studydoes not focus on understanding how distance affects each technique and doesnot provide an insight on how different techniques are affected by distance.Myers et al. tests the laser pointer metaphor on three different distances andconcludes that hand jitter affects precision. However, they only study a singletechnique (laser pointer) and focuses on reducing hand jitter. A second exper-iment adds a mouse and a handheld device as interaction metaphors but doesnot test these on different distances. Finally, Greenberg et al. presents a frame-work for proxemics in ubicomp [Greenberg et al. , 2011]. In this work, theypropose distance and orientation as dimensions and present a number of ap-plications where user distance to the display affects interaction. Although theyapproach user position as a factor, they do not focus on interaction metaphors,in particular ray-pointing, in their framework.
2.9 Discussion
Related work shows us that the way humans interact with the world is thesubject of some debate. Starting with philosophical arguments such as thoseby Merleau-Ponty and Heidegger and moving on to interaction specific frame-works, such as Norman’s model or MHP, a lot of ground work has been doneto try to understand how humans interact.
Interaction can be seen as branch of design. In fact, one main difference be-tween interaction design and equipment design is that the premise that "func-tion follows form" is weaker for interaction design3. Interaction design can thenbe described as a discipline that attempts to convey one or more functions to ob-jects that are not recognizable by form. A chair’s function, for example, is easilyrecognizable by its form, however, traditional input devices are not. A bad ex-ample in form is that of apple’s original circular puck mouse as a bad exampleof form because its round shape does not help users understand how to holdthe mouse (affordance). Changes in form can represent changes in function-ality, for example, flip phones [Wikipedia, 2011] where closing the shell turnsoff the display, and opening the shell activates the screen and makes the phoneready for use.
3Argument discussed in the documentary film Objectified
38
2: PREVIOUS WORK
In fact, recent works [Cohé et al. , 2011; Morris et al. , 2010] adopt the approachof showing the function (the initial state and the end result) and asking users toexplain the form (the gesture used to obtain the end result). Under this assump-tion, if we focus on large-scale displays, Vogel [Vogel & Balakrishnan, 2004]identify user position as form and suggest how the display function shouldchange according to the form. This was further explored by Harrison on thedesktop [Harrison & Dey, 2008] and by Ball for navigation tasks [Ball et al. ,2007]. What they identify is that making interactive environments follow socialtheories of space, such as proxemics, makes them more interesting. However,their work only focus on the information itself.
The possibility of issuing commands introduces input devices that, in turn,changes what is perceived as form. Indeed, some research works have lookedat how input devices should be used for large-scale displays [Grubert et al. ,2007; Myers et al. , 2002], but they do not describe user position as a factor forinteraction, focusing instead of the actual device and interaction technique.
We identify the intersection of user position and interaction technique to be animportant research subject for large scale displays that has yet to be fully ex-plored in the related work. In the next section we present user studies that lookat this problem. First, we present a study about the effect that user position, ata particular distance, has on interaction techniques. We follow this study withanother study that looks at what factors actually affect a specific interactiontechnique called ray-pointing, which is widely used in the related work andconsidered to be a strong solution for interaction with large-scale displays.
39

2: PREVIOUS WORK
40

3Pointing for Large-Scale Displays
Pointing is an interesting approach to interaction for large-scale displays. How-ever, very little is known on how pointing works on large-scale displays. Thissection describes the approach taken towards a better understanding of howpointing is affected by the large-scale display environment characteristics.
The approach is composed by two tests, one for external factors and anotherone for internal factors. External factors study how the relation between theuser and the display influences pointing, in particular distance and differentpointing techniques. Based on the results from the first test, the second testlooks on how human factors such as control type (the way we interpret point-ing) and at parallax (the way we perceive targets) affect pointing. This chapteris divided in three sections: the first two describe each test and correspondingdiscussion followed by an overall discussion on the findings presented.
3.1 Distance in Pointing Techniques
The way we perceive information is intrinsically related to distance. For ex-ample, in advertising billboards font size is selected according to the preview
41
3: POINTING FOR LARGE-SCALE DISPLAYS
viewing distance. Some actions require users to be physically distant from theobject at hand. Painters, for example, might move away from the canvas to geta clear view of the global composition. Moreover, they use different techniquesand tools, which might require different interaction distance, for different sec-tions of the painting. Therefore, distance is known to influence how we per-ceive the world but also what tools we select. This, however, is not applied tointeraction. Most interaction techniques assume that the user will interact atone single, pre-defined distance.
As we stand today, systems either provide interactivity at one distance andignore the rest of the distance spectrum or provide the same experience regard-less of the user’s distance to the display. This particularly affects large-scalescenarios where users are free to move around, in contrast to desktop scenar-ios, where the user is usually stationary. Few research studies take user distanceinto account when developing suitable metaphors for large-scale display inter-action. Often, the solution adopted allows user movement, but does not adaptinteraction accordingly to user position and task.
We study how distance affects interaction metaphor design for large-scale dis-plays. We selected and implemented Grab [Kim & Fellner, 2004; Malik et al., 2005b; Shoemaker et al. , 2007], Point [Grubert et al. , 2007; Leubner et al. ,2001; Myers et al. , 2002; Stødle et al. , 2008; Vogel & Balakrishnan, 2005] andMouse [Cao & Balakrishnan, 2003; Wilson & Cutrell, 2005]; three metaphors,proposed in the previous work. We then tested a simple puzzle task with usersinteracting from three distances (1.5 meters, 2 meters, and 5 meters). We con-ducted tests with 32 users, divided into two sessions. Out of those 32 users, 9were asked to execute both sessions, bringing the total of experiences to 41. Inthe first session we focused on how distance can affect how fast a user finishesa task, while on the second we focuses on how precision is affected by distance.Conducted tests show that user distance does not affect interaction. Moreover,we show that, for speed tasks, the Point metaphor yields the best results while,for precision tasks, the Grab metaphor is the most precise. Results also showthat users state preference for the 2 meter interaction distance and classify Grabas less tiresome and easy to understand.
42

3: POINTING FOR LARGE-SCALE DISPLAYS
3.1.1 Pointing Variants
An overview of the related work indicates that most interaction techniques forlarge-scale displays are inspired by familiar actions. Metaphors such as grab avirtual object or point to an area of interest are mentioned in the related workand mouse-like devices are already used to interact with large-scale displays.We implement three metaphors, featured in the related work: Grab, Point andMouse (Figure 3.1). All techniques define a pointing line using different userinformation. The intersection of the line with the display position results in thecursor position.
Figure 3.1: (From left to right: Grab, Point, and Mouse.). Grab: the cursor position is defined by
the intersection of the display with a line controlled by the user hand (perpendicular
to the display). Point: the cursor position is defined by the interaction of the display
with a line defined by the user eye and hand position. Mouse: the cursor position is
defined by mapping the user’s hand position to a display position.
The Grab metaphor defines a straight line, perpendicular to the display, fromthe user hand to the display. Therefore, the cursor is always positioned in thedisplay position closest to the user hand. This resembles how users physicallygrab objects. Imagine a user reaching for a book on a tall shelf, they are requiredto be in front of the shelf and reach the object to grab it. To move an object, auser has reach and grab it, to drop the user has to physically walk to the targetposition and release in the desired position. Because of its tactile nature, weexpect that this technique is more adequate for near interactions to the display.To provide support for different distances, grab does not require the user to beclose to the display, regardless of the user distance, the cursor will always be onthe display point closest to the hand position.
43

3: POINTING FOR LARGE-SCALE DISPLAYS
Figure 3.2: Left: Third person perspective of the pointing metaphor. Right: Over the shoulder
perspective of the pointing metaphor. Notice that cursor is positioned behind the
hand position.
The Point metaphor is based on the pointing gesture that humans execute whenthey want to refer to an object or location. It calculates a line between the user’sdominant eye and the user’s hand. The intersection of that line with the dis-play defines the cursor position. From the user’s perspective, the cursor is al-ways behind the hand position. Therefore, the user can move the cursor overan object by occluding the object with their hand (see Figure 3.2). Contraryto the Grab metaphor, with Point users are not required to physically move orbe in front of objects to select them. We expect this metaphor to be suited formedium distance. In short distance, because the objects are closer to the laser,the user has to execute a wider angle for the cursor to move to an object notin front of the user, reducing the effectiveness of this metaphor in close dis-tances. Similarly, hand jitter can be an issue when interacting in distances awayfrom the display because small hand movements are magnified because of thedistance [Myers et al. , 2002].
The Mouse metaphor works by mapping the display space to a square 50x50cm2 region parallel to the display, positioned 30cm in front of the user andcentered around the user torso height. This size and position were selected togive a conformable space without requiring the user to extend his arm in anuncomfortable way in order to move the cursor to the limits of the display. Theregion was programmed to follow the user, that is if the user position changesthe region is recalculated to reflect the user’s new position. When users movetheir hand inside this region, the cursor is moved to the correspondent positionon the screen. That is, if the user moves to the top-left position of the region,the cursor moves to the top-left of the display. Because the region follows theuser and there is a direct mapping of the region to the display, distance does
44
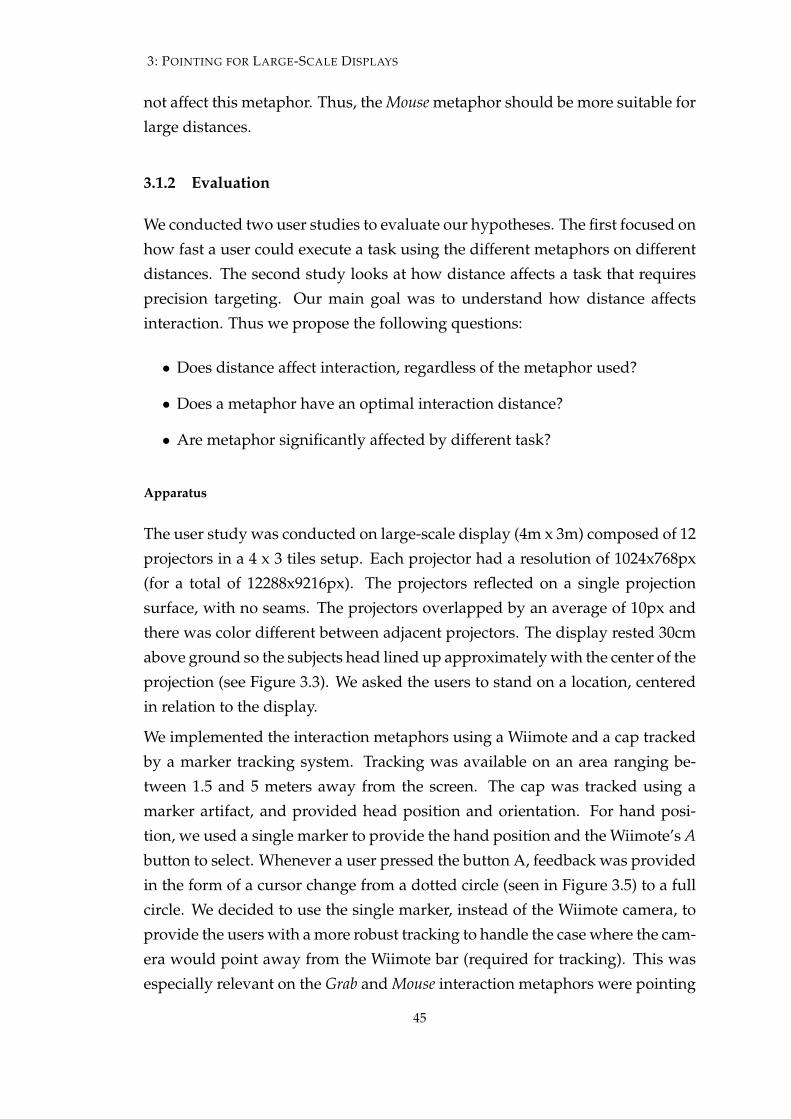
3: POINTING FOR LARGE-SCALE DISPLAYS
not affect this metaphor. Thus, the Mouse metaphor should be more suitable forlarge distances.
3.1.2 Evaluation
We conducted two user studies to evaluate our hypotheses. The first focused onhow fast a user could execute a task using the different metaphors on differentdistances. The second study looks at how distance affects a task that requiresprecision targeting. Our main goal was to understand how distance affectsinteraction. Thus we propose the following questions:
• Does distance affect interaction, regardless of the metaphor used?
• Does a metaphor have an optimal interaction distance?
• Are metaphor significantly affected by different task?
Apparatus
The user study was conducted on large-scale display (4m x 3m) composed of 12projectors in a 4 x 3 tiles setup. Each projector had a resolution of 1024x768px(for a total of 12288x9216px). The projectors reflected on a single projectionsurface, with no seams. The projectors overlapped by an average of 10px andthere was color different between adjacent projectors. The display rested 30cmabove ground so the subjects head lined up approximately with the center of theprojection (see Figure 3.3). We asked the users to stand on a location, centeredin relation to the display.
We implemented the interaction metaphors using a Wiimote and a cap trackedby a marker tracking system. Tracking was available on an area ranging be-tween 1.5 and 5 meters away from the screen. The cap was tracked using amarker artifact, and provided head position and orientation. For hand posi-tion, we used a single marker to provide the hand position and the Wiimote’s Abutton to select. Whenever a user pressed the button A, feedback was providedin the form of a cursor change from a dotted circle (seen in Figure 3.5) to a fullcircle. We decided to use the single marker, instead of the Wiimote camera, toprovide the users with a more robust tracking to handle the case where the cam-era would point away from the Wiimote bar (required for tracking). This wasespecially relevant on the Grab and Mouse interaction metaphors were pointing
45
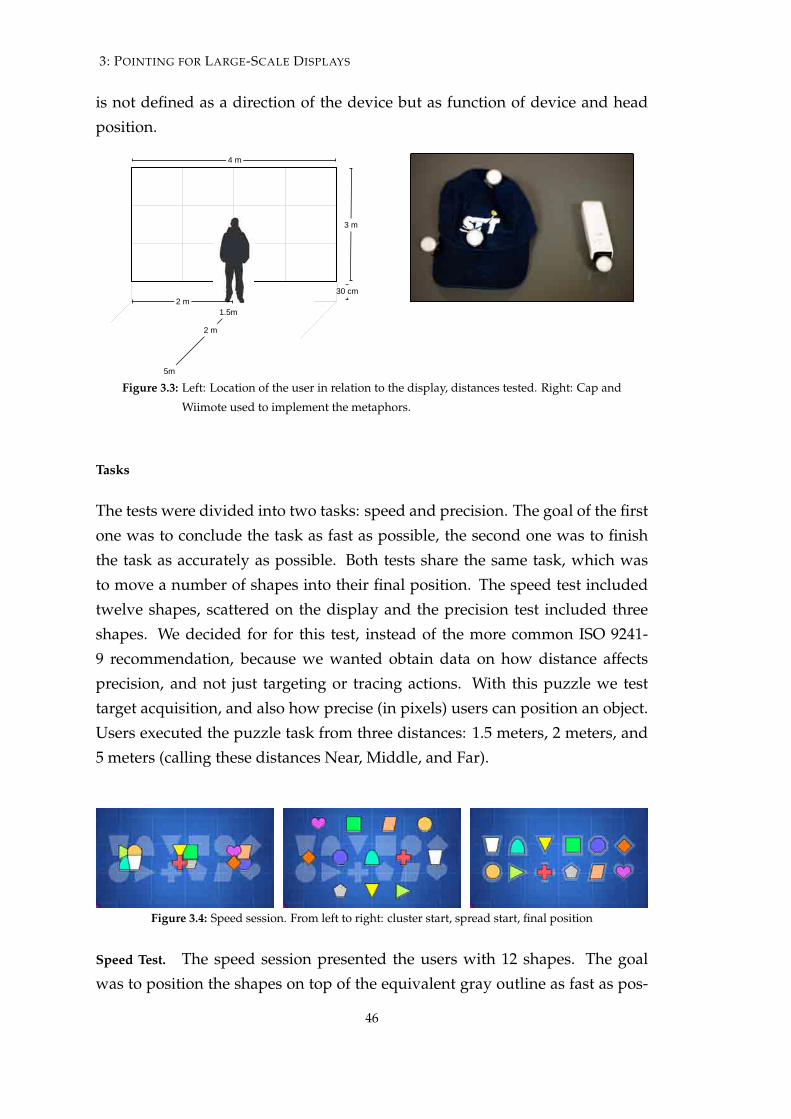
3: POINTING FOR LARGE-SCALE DISPLAYS
is not defined as a direction of the device but as function of device and headposition.
4 m
3 m
30 cm2 m
2 m
1.5m
5m
Figure 3.3: Left: Location of the user in relation to the display, distances tested. Right: Cap and
Wiimote used to implement the metaphors.
Tasks
The tests were divided into two tasks: speed and precision. The goal of the firstone was to conclude the task as fast as possible, the second one was to finishthe task as accurately as possible. Both tests share the same task, which wasto move a number of shapes into their final position. The speed test includedtwelve shapes, scattered on the display and the precision test included threeshapes. We decided for for this test, instead of the more common ISO 9241-9 recommendation, because we wanted obtain data on how distance affectsprecision, and not just targeting or tracing actions. With this puzzle we testtarget acquisition, and also how precise (in pixels) users can position an object.Users executed the puzzle task from three distances: 1.5 meters, 2 meters, and5 meters (calling these distances Near, Middle, and Far).
Figure 3.4: Speed session. From left to right: cluster start, spread start, final position
Speed Test. The speed session presented the users with 12 shapes. The goalwas to position the shapes on top of the equivalent gray outline as fast as pos-
46

3: POINTING FOR LARGE-SCALE DISPLAYS
sible. The outlines were slightly bigger that the actual shape, and users wereinstructed to position the shapes completely inside the outlines. Comparedto the other metaphors, the Grab metaphor required significant movement tomove a shape across the display, therefore, to properly evaluate the metaphors,we had two puzzle starting setups (see Figure 3.4). The first positioned theshapes close to their ultimate target (cluster sub-task), the second positionedthe shapes far away from their ultimate target (spread sub-task). Dependingon the starting position, to solve the puzzle users had to execute short paths orlong paths (respectively cluster sub-task and spread sub-task).
Figure 3.5: Precision session. From left to right: start position, examples of correct and incorrect
shape positions, final position
Precision Test. In the precision test, users had to position three shapes. The goalwas to cover the correspondent black shapes including the red border. The testwas implemented so that both color shapes and black correspondents have thesame size, therefore the color shapes would be able to hide the red border. Userswere instructed that, if the final position was missed, the red border could stillbe seen (see Figure 3.5). For this session we asked the users to conduct two tests:to position the three shapes as accurate as possible without time limit (precisionsub-task) and to position the 3 shapes within a time limit of 10 seconds (timedsub-task). The ten seconds limitation was observed during preliminary tests,to be enough to successfully conclude the task. With this test we expect to dis-cover how precise each metaphor can be and understand the relation betweenprecision and the time to successfully complete the task.
Participants
We recruited 32 users, 5 females and 27 males, nine of which executed bothtests. Twenty-one tests were conducted for the speed task and twenty for theprecision tasks. User age was between 22 and 56 years old (M=29.85, Mdn=28.00,
47

3: POINTING FOR LARGE-SCALE DISPLAYS
SD=7.93), and height between 1.51 and 1.86 meters (M=1.73, Mdn=1.75, SD=0.09).Prior experience with large-scale display interaction ranged from beginners toexperts. All subjects were right-handed.
Procedure and Design
After signing a consent form, subjects were introduced to the metaphors andexplained the task. In the case of the speed test, users were asked to solve theproblem as fast as possible. In the precision test, users were asked to positionthe shapes as accurately as possible. To prevent biasing the test outcome, in-put technique order was counterbalanced across subjects using a random Latinsquare design. Briefing lead to an open session where users got acquaintedwith the metaphors and task. Once users stated they were comfortable with thesystem, the tests would begin. During the tests, users would execute the testwithout our interference. After users concluded the test, they were presentedwith a questionnaire and debriefed regarding their experience. To conclude,users were rewarded for their time and the subject study closed.
Data Collection
During the tests we logged head and hand positions with a 60HZ frequency, thecompletion time in milliseconds, the distance in pixels to the optimal solution(for the precision session), the physical distance to the display (1.5, 2, and 5meters), the sub-tasks (cluster, spread, timed or precision), and the metaphorused (Grab, Point, Mouse).
3.1.3 Results
Our initial belief was that distance would affect interaction. Moreover, eachmetaphor would present different behaviors on the three distances and wecould infer the best metaphor based on the distance alone. Specifically, wethought that Grab was suited for near distance and precision tasks. Point, wouldfare best on middle distance and during the speed task. Finally, Mouse wouldnot be affected by distance.
48

3: POINTING FOR LARGE-SCALE DISPLAYS
Cluster sub-task Spread sub-taskGrab Point Mouse Grab Point Mouse
Near µ 43.83 30.53 34.00 57.08 36.00 41.92s 16.48 5.11 7.42 13.30 8.15 9.95
Middle µ 36.02 28.88 32.00 57.00 37.84 38.50s 8.50 6.66 7.42 13.35 7.55 9.94
Far µ 42.44 31.02 34.62 56.43 38.00 40.00s 9.72 6.32 10.01 10.30 12.08 8.31
Table 3.1: Speed Test - Results in seconds
Distance x Task F Score p-value Metaphor x Task F Score p-value
Near x Spread 22.48 < 0.001 Grab x Spread 0.01 0.98Near x Cluster 8.69 < 0.001 Grab x Cluster 2.49 0.09
Middle x Spread 4.77 < 0.001 Point x Spread 1.24 0.29Middle x Cluster 22.27 < 0.05 Point x Cluster 0.72 0.49
Far x Spread 22.84 < 0.001 Mouse x Spread 0.69 0.50Far x Cluster 9.14 < 0.001 Mouse x Cluster 0.71 0.49
Table 3.2: Anova results for the speed test. Left: Compare result metaphors by distance & task.
Right: Compare result distances by metaphor & task.
Speed
Table 3.1 shows the times obtained for both Cluster and Spread sub-tasks andTable 3.2 shows the ANOVA results for the speed test (H0: µ1 = µ2 = µ3).We used the completion time (in seconds) to evaluate the speed task and testedeach metaphor across the three distances. Contrary to our expectations, our re-sults exhibits no evidence that completion times are affected by distance (rightside of Table 3.1), that is: for the same metaphors we did not obtain significanttime differences when varying the distance. However, there is clear evidencethat the Point is the fastest on both cluster and spread sub-tasks. In addition,with the exception of the spread puzzle on the far distance, the Point presentedsmaller standard deviations (less variation between subjects). The faster timesand reduced deviations means that users were more efficient using pointingand that less users had difficulty. One reason for this result is that users seemedto understand the Point metaphor faster or were already familiar with it. More-over, the questionnaires also support this result (Figure 3.8), where 10 out of 21users selected Point as their metaphor of choice. We also point out that, on aver-age, Grab took more than ten seconds on the spread sub-task that on the cluster
49

3: POINTING FOR LARGE-SCALE DISPLAYS
Timed sub-task Precision sub-taskGrab Point Mouse Grab Point Mouse
Near µ 19.73 5.92 8.17 3.41 4.01 3.84s 28.77 2.62 13.28 0.32 0.54 0.46
Middle µ 36.31 14.42 9.25 3.39 3.90 3.97s 58.15 26.75 17.71 0.38 0.63 0.97
Far µ 25.74 19.69 14.04 3.30 4.06 4.03s 31.80 34.18 25.41 0.38 0.75 0.92
Table 3.3: Precision test results in pixels
sub-task (Figure 3.6). We explain this with the fact that the Grab metaphor re-quires users to physically move in order to position the objects in their ultimatetarget, thus significantly increasing the completion time on the spread sub-task.
Sec
onds
Cluster Spread Cluster Spread Cluster Spread
Grab Point Mouse
2030
4050
6070
Figure 3.6: Median results for the Cluster and Spread Tasks.
Precision
We evaluated the precision results by averaging the difference between the op-timal shape final position and the user’s solution (Equations 3.1.1 and 3.1.2).We collected results from two tasks: Timed (users had ten seconds to finish) andPrecision (no time limits). Table 3.3 shows the results in pixels, according to themetric in 3.1.1. Our results were validated using ANOVAs (H0: µ1 = µ2 = µ3)and are presented in Table 3.5.
50
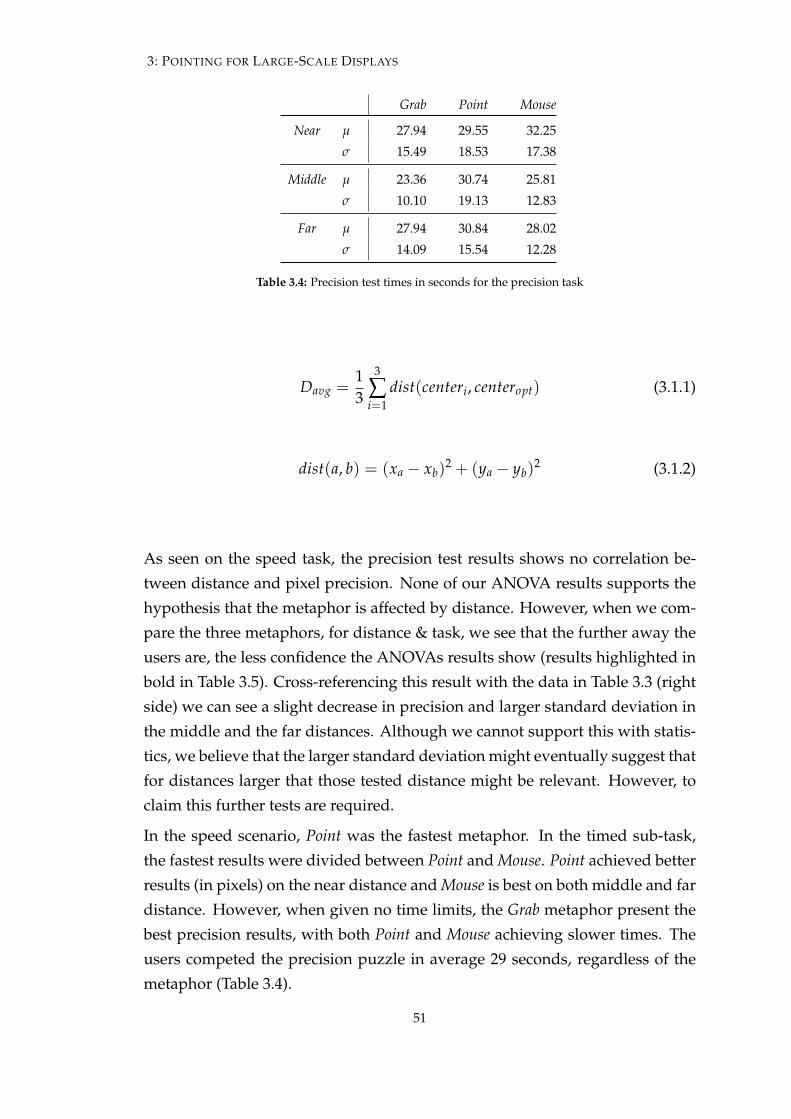
3: POINTING FOR LARGE-SCALE DISPLAYS
Grab Point Mouse
Near µ 27.94 29.55 32.25s 15.49 18.53 17.38
Middle µ 23.36 30.74 25.81s 10.10 19.13 12.83
Far µ 27.94 30.84 28.02s 14.09 15.54 12.28
Table 3.4: Precision test times in seconds for the precision task
Davg =13
3
Âi=1
dist(centeri, centeropt) (3.1.1)
dist(a, b) = (xa � xb)2 + (ya � yb)
2 (3.1.2)
As seen on the speed task, the precision test results shows no correlation be-tween distance and pixel precision. None of our ANOVA results supports thehypothesis that the metaphor is affected by distance. However, when we com-pare the three metaphors, for distance & task, we see that the further away theusers are, the less confidence the ANOVAs results show (results highlighted inbold in Table 3.5). Cross-referencing this result with the data in Table 3.3 (rightside) we can see a slight decrease in precision and larger standard deviation inthe middle and the far distances. Although we cannot support this with statis-tics, we believe that the larger standard deviation might eventually suggest thatfor distances larger that those tested distance might be relevant. However, toclaim this further tests are required.
In the speed scenario, Point was the fastest metaphor. In the timed sub-task,the fastest results were divided between Point and Mouse. Point achieved betterresults (in pixels) on the near distance and Mouse is best on both middle and fardistance. However, when given no time limits, the Grab metaphor present thebest precision results, with both Point and Mouse achieving slower times. Theusers competed the precision puzzle in average 29 seconds, regardless of themetaphor (Table 3.4).
51
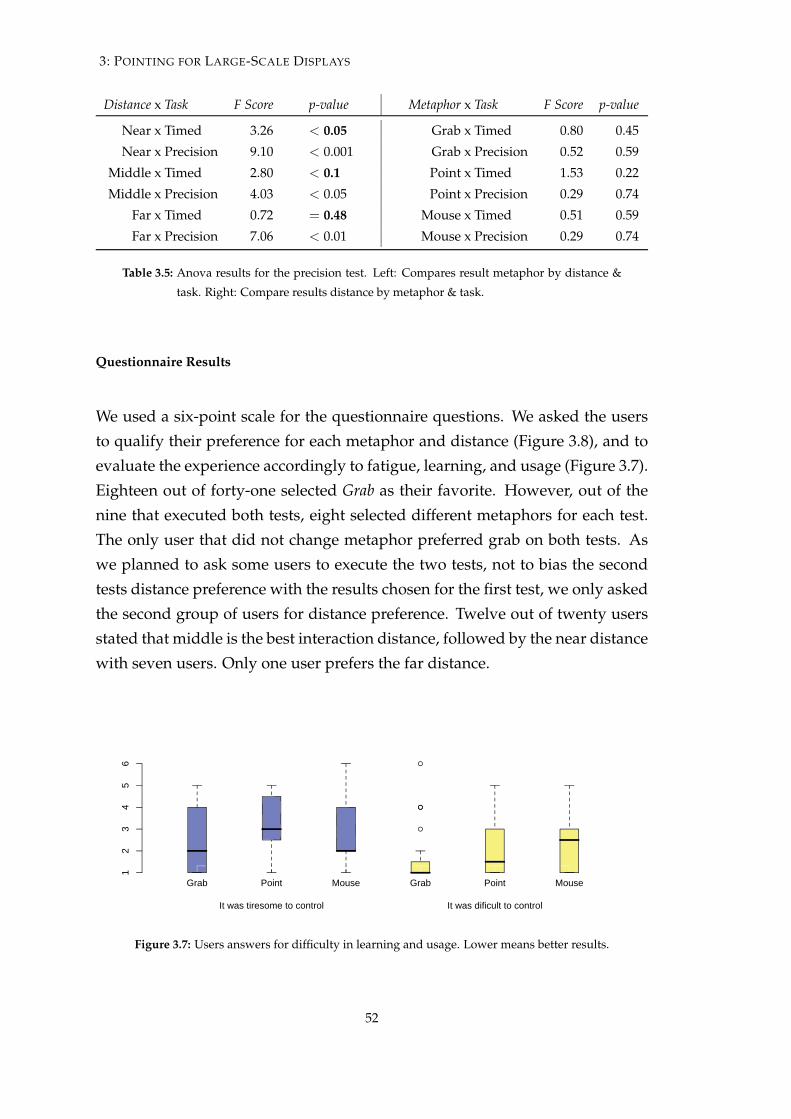
3: POINTING FOR LARGE-SCALE DISPLAYS
Distance x Task F Score p-value Metaphor x Task F Score p-value
Near x Timed 3.26 < 0.05 Grab x Timed 0.80 0.45Near x Precision 9.10 < 0.001 Grab x Precision 0.52 0.59
Middle x Timed 2.80 < 0.1 Point x Timed 1.53 0.22Middle x Precision 4.03 < 0.05 Point x Precision 0.29 0.74
Far x Timed 0.72 = 0.48 Mouse x Timed 0.51 0.59Far x Precision 7.06 < 0.01 Mouse x Precision 0.29 0.74
Table 3.5: Anova results for the precision test. Left: Compares result metaphor by distance &
task. Right: Compare results distance by metaphor & task.
Questionnaire Results
We used a six-point scale for the questionnaire questions. We asked the usersto qualify their preference for each metaphor and distance (Figure 3.8), and toevaluate the experience accordingly to fatigue, learning, and usage (Figure 3.7).Eighteen out of forty-one selected Grab as their favorite. However, out of thenine that executed both tests, eight selected different metaphors for each test.The only user that did not change metaphor preferred grab on both tests. Aswe planned to ask some users to execute the two tests, not to bias the secondtests distance preference with the results chosen for the first test, we only askedthe second group of users for distance preference. Twelve out of twenty usersstated that middle is the best interaction distance, followed by the near distancewith seven users. Only one user prefers the far distance.
Grab Point Mouse Grab Point Mouse
It was tiresome to control It was dificult to control
12
34
56
Figure 3.7: Users answers for difficulty in learning and usage. Lower means better results.
52
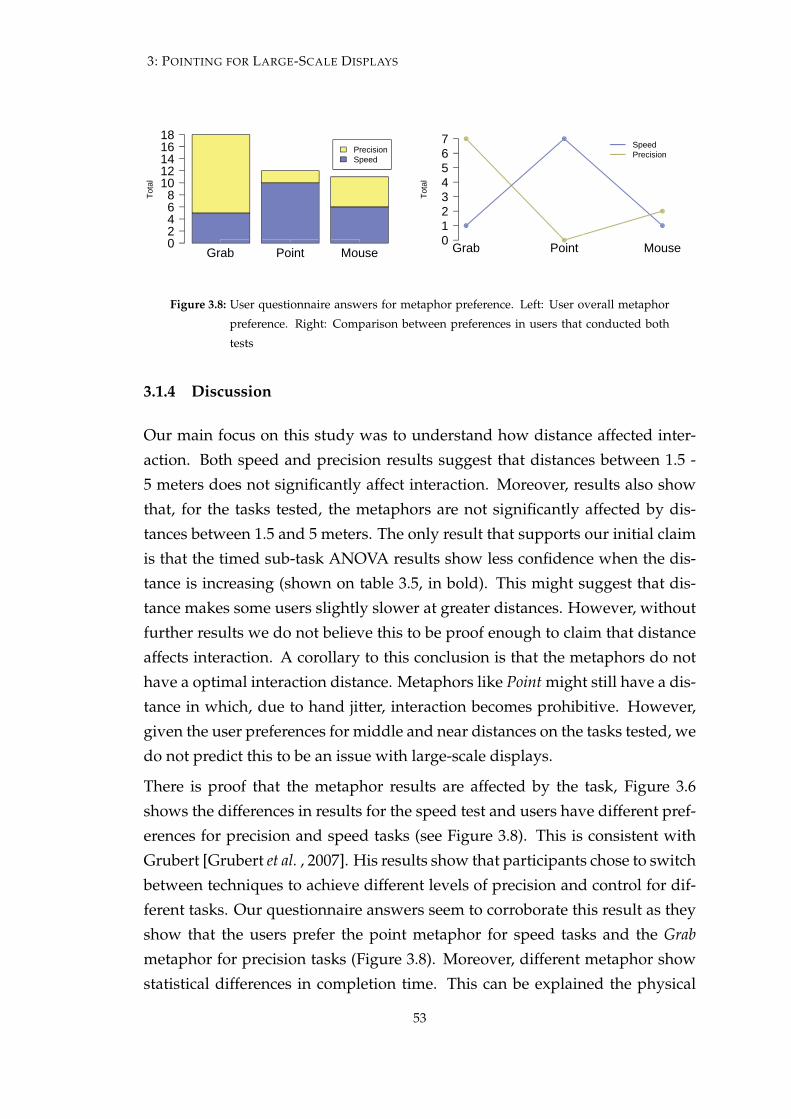
3: POINTING FOR LARGE-SCALE DISPLAYS
PrecisionSpeed
Grab Point Mouse02468
1012141618
Tota
l
Grab Point Mouse01234567
Tota
l
SpeedPrecision
Figure 3.8: User questionnaire answers for metaphor preference. Left: User overall metaphor
preference. Right: Comparison between preferences in users that conducted both
tests
3.1.4 Discussion
Our main focus on this study was to understand how distance affected inter-action. Both speed and precision results suggest that distances between 1.5 -5 meters does not significantly affect interaction. Moreover, results also showthat, for the tasks tested, the metaphors are not significantly affected by dis-tances between 1.5 and 5 meters. The only result that supports our initial claimis that the timed sub-task ANOVA results show less confidence when the dis-tance is increasing (shown on table 3.5, in bold). This might suggest that dis-tance makes some users slightly slower at greater distances. However, withoutfurther results we do not believe this to be proof enough to claim that distanceaffects interaction. A corollary to this conclusion is that the metaphors do nothave a optimal interaction distance. Metaphors like Point might still have a dis-tance in which, due to hand jitter, interaction becomes prohibitive. However,given the user preferences for middle and near distances on the tasks tested, wedo not predict this to be an issue with large-scale displays.
There is proof that the metaphor results are affected by the task, Figure 3.6shows the differences in results for the speed test and users have different pref-erences for precision and speed tasks (see Figure 3.8). This is consistent withGrubert [Grubert et al. , 2007]. His results show that participants chose to switchbetween techniques to achieve different levels of precision and control for dif-ferent tasks. Our questionnaire answers seem to corroborate this result as theyshow that the users prefer the point metaphor for speed tasks and the Grabmetaphor for precision tasks (Figure 3.8). Moreover, different metaphor showstatistical differences in completion time. This can be explained the physical
53

3: POINTING FOR LARGE-SCALE DISPLAYS
GrabH
ead
(x,z
)D
evic
e (x
,y)
Point
Display Display
Figure 3.9: Example of user movement during a test (Speed tests; spread task). Left: head and
device movement when using a grab metaphor. Right: head and device movement
when using a point metaphor.The ground is (x, z) and height is y: Head is plotted
from above (x, z), Device is plotted from perpendicular to the display (x, z).
movement that each metaphor requires to execute the same movement. Whencomparing the Grab and Point metaphors (see Figure 3.9), one can see that theGrab requires more physical movement to hit objects out-of-reach (by movingthe device to reach or walking towards the object). This has repercussions onthe completion times. Point, on the other hand, requires no head movement (nowalking) and almost no cursor movement and is, therefore, faster.
also see an increase in deviation by distance (Figure 3.3). However, this is notenough to significantly affect precision and can be overcome with interactiontechniques that either minimize jitter [Davis & Chen, 2002; Lapointe & Godin,2005] or improve target selection [Tse et al. , 2007]. When we limited the testto ten seconds, the Grab yields worst results that both the Point and the Mouse.This is consistent with the Grab metaphor that requires more physical actionsfrom the user to achieve the same result. With no time limitations, Grab presentsthe best results (in pixels) of the three metaphors. The slower movements al-low for more precise movements and is less affected by jitter. This suggests
54

3: POINTING FOR LARGE-SCALE DISPLAYS
that, although Grab is slower when moving objects, it provides more adequatemovements useful when precisely position objects. On the precision task with-out limit, all tests had similar results, regardless of the metaphor. Users tookabout 30 seconds (µ=28,49s SD=3.01s) to conclude the test. This shows thatthe users had a good understanding of the limitation for each metaphor andgave up when they realized they had reached the best possible solution foreach metaphor.
On the precision tests users felt more fatigue when using the Point that whenusing the Mouse or the Grab. We argue this is because most users point withtheir arm straight (almost locking their elbow), a position that quickly tires theuser’s arms (see Figure 3.1). For the precision test, users maintained this po-sition for up to 30 seconds. On the other hand, with Grab users could quicklyplace an object and move the arm to a resting position. Users classified Grab asthe easiest metaphor and Mouse as the hardest to control. During debriefing,most users felt that the Grab metaphor was an interesting way to interact evenif just for selected tasks. Users also stated a preference for the middle distance,even though our results do not reflect any effect of distance of interaction. Dur-ing tests, one user asked if he could change distance (move closer) because hewas having trouble executing the task (the user did not have any physical rea-son to do so nor did he had bad eye sight).
For large-scale displays, distance does not affect interaction as much as taskand the interaction metaphor. However, different metaphors seem more ade-quate to certain tasks. On our tests the Point metaphor seemed more appro-priate to cover a large distance in the minimum amount of time, and Grab isbest for precision tasks or tasks where all the objects can be reached withoutphysical movement. We also conclude users achieve a better understandingof the Point metaphor, especially when compared with Mouse, and that fatigueonly seems relevant in precision tasks, which are perhaps better executed witha Grab metaphor. Finally, our tests show the users found the metaphors easy tounderstand and seem likely to accept a system where the metaphor adapts tothe active task.
This test provided some insight on what kind of variant users expect. Theresults indicated that people prefer variants inspired in pointing to those in-spired by desktop analogies. Furthermore, based on the results obtained thereis a strong suggestion that user movement does not affect interaction. There-fore, a logical next step is to try to better understand how a user, anchored to
55
3: POINTING FOR LARGE-SCALE DISPLAYS
a position, interacts with a large-scale display using a pointing technique. Thesecond tests, discussed next, follows up on the first test results and further ex-plores pointing as an interaction technique, including discovering limitationsof pointing for a stationary user on a large-scale displays.
3.2 Control Type and Parallax
People often interact with a large digital display by distant pointing, or directlypointing at the display with their finger, laser pointer, or other input devices.Ray pointing is a class of techniques that uses ray casting (the intersection of aray with a surface) to determine where a person is pointing to, i.e., the precisecursor position on the distant display. Ray pointing is advocated as a naturalinteraction technique with these displays [Bolt, 1980; Olsen & Nielsen, 2001]as: it allows people to interact from the distance (as opposed to direct-input)[Parker et al. , 2005; Voida et al. , 2005]; it does not require any physical surfaceto operate on (as opposed to mouse-based pointing) [Oh & Stuerzlinger, 2002;Teather & Stuerzlinger, 2008]; it is easily understood by people as it builds uponeveryday pointing gestures [Voida et al. , 2005]; and it allows multiple users tointeract on the same display without their bodies physically getting in the way[Nacenta et al. , 2007]. Thus it is no surprise that ray pointing is increasinglyused in both commercial and research systems, especially for large horizontaland vertical displays [Davis & Chen, 2002; Nacenta et al. , 2007; Parker et al., 2005; Voida et al. , 2005]. Even game consoles are exploiting ray pointing forinteraction (e.g., Nintendo Wii).
As large and very large displays (i.e., wall-sized displays) become widespread,ray pointing will likely become a primary way to interact with all kinds of in-terfaces from a distance or to access hard to reach areas of the display. This iswhy there is already a significant amount of literature devoted to the perfor-mance and different modes of ray pointing; for example, different variants ofray pointing are used and studied by Virtual Reality researchers [Argelaguet& Andujar, 2009; Bowman et al. , 2001; Pierce et al. , 1997], and there have beensome efforts to characterize laser pointing (one of the possible ray pointing vari-ants) for interaction with 2D interfaces [MacKenzie & Jusoh, 2001; Myers et al., 2002; Oh & Stuerzlinger, 2002; Pavlovych & Stuerzlinger, 2009]. However, inour own design and implementation of large-display interfaces we have foundthat previous work in the area does not suffice because of several reasons. A)
56

3: POINTING FOR LARGE-SCALE DISPLAYS
Although the largest diversity of ray pointing alternatives has been studiedin VR, ray pointing tasks and setups (e.g. CAVEs, stereoscopic displays) aresubstantially different to the more common 2D tasks that we are interested in.B) Previous empirical work on 2D tasks is focused almost exclusively on laserpointing or studies only small displays [MacKenzie & Jusoh, 2001; Myers et al., 2001; Oh & Stuerzlinger, 2002]. C) With a few exceptions [Kopper et al. , 2010;Myers et al. , 2002] previous work for 2D environments does not try to provideexplanations, or general principles of the differences in ray pointing.
We build upon this previous research by contributing a new experiment thata) tests of two fundamental 2D interaction tasks (targeting and tracing), oneof which has not previously been studied in the context of ray pointing; b)compares of four different ray pointing variants (laser pointing, arrow point-ing, image-plane pointing, and fixed-origin pointing) which map to two pre-viously unstudied factors relevant to ray pointing in 2D tasks (parallax andcontrol type); and c) identifies specific issues related to the large size of the dis-plays, like the effect of the location of targets with respect to users. Our experi-mental results show that targeting performance is best explained by the controltype factor, with rotational control being generally superior to position control,whereas for tracing tasks it is the presence of parallax that better explains dif-ferences between variants. The study also contributes rigorous support for theuse of an angular formulation of Fitts’s law [Kondraske, 1994; Kopper et al., 2010] for large-displays, as opposed to the traditional linear formulation forboth tasks. These results have important implications for designers and re-searchers alike. First, designers must now consider image-plane techniquesand how the pointing device is held, especially if they want to support tracingtasks (e.g., menu selection, drawing). Second, researchers can now considerparallax and control type as important factors, and have solid evidence to startusing angular adaptations of Fitts’s law for interaction in large displays.
3.2.1 Ray Pointing Fundamentals
We define generic ray pointing as any cursor-movement technique that deter-mines the position of the cursor through the intersection of a ray with a distantobject or surface (see Figure 3.11, left). For our purposes, the distant object orsurface is a large display. We consider only monocular absolute 2D pointing.
57
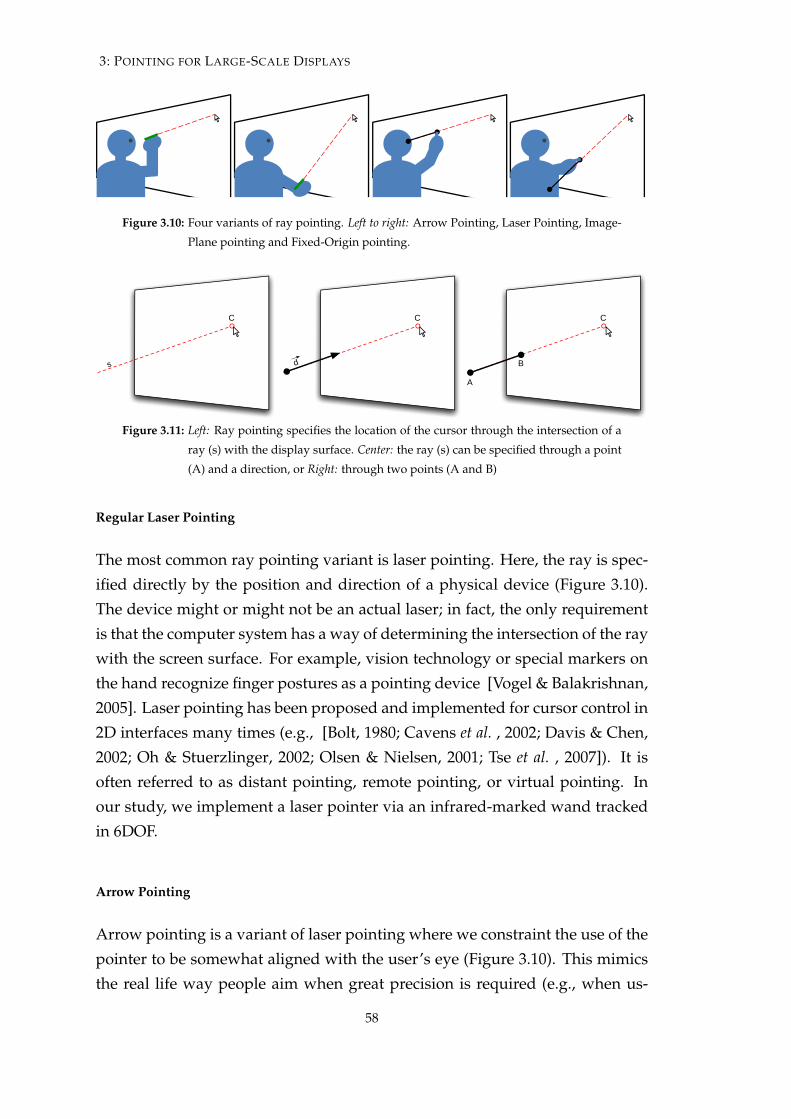
3: POINTING FOR LARGE-SCALE DISPLAYS
Figure 3.10: Four variants of ray pointing. Left to right: Arrow Pointing, Laser Pointing, Image-
Plane pointing and Fixed-Origin pointing.
C
s
C
d
C
A
B
C
Figure 3.11: Left: Ray pointing specifies the location of the cursor through the intersection of a
ray (s) with the display surface. Center: the ray (s) can be specified through a point
(A) and a direction, or Right: through two points (A and B)
Regular Laser Pointing
The most common ray pointing variant is laser pointing. Here, the ray is spec-ified directly by the position and direction of a physical device (Figure 3.10).The device might or might not be an actual laser; in fact, the only requirementis that the computer system has a way of determining the intersection of the raywith the screen surface. For example, vision technology or special markers onthe hand recognize finger postures as a pointing device [Vogel & Balakrishnan,2005]. Laser pointing has been proposed and implemented for cursor control in2D interfaces many times (e.g., [Bolt, 1980; Cavens et al. , 2002; Davis & Chen,2002; Oh & Stuerzlinger, 2002; Olsen & Nielsen, 2001; Tse et al. , 2007]). It isoften referred to as distant pointing, remote pointing, or virtual pointing. Inour study, we implement a laser pointer via an infrared-marked wand trackedin 6DOF.
Arrow Pointing
Arrow pointing is a variant of laser pointing where we constraint the use of thepointer to be somewhat aligned with the user’s eye (Figure 3.10). This mimicsthe real life way people aim when great precision is required (e.g., when us-
58
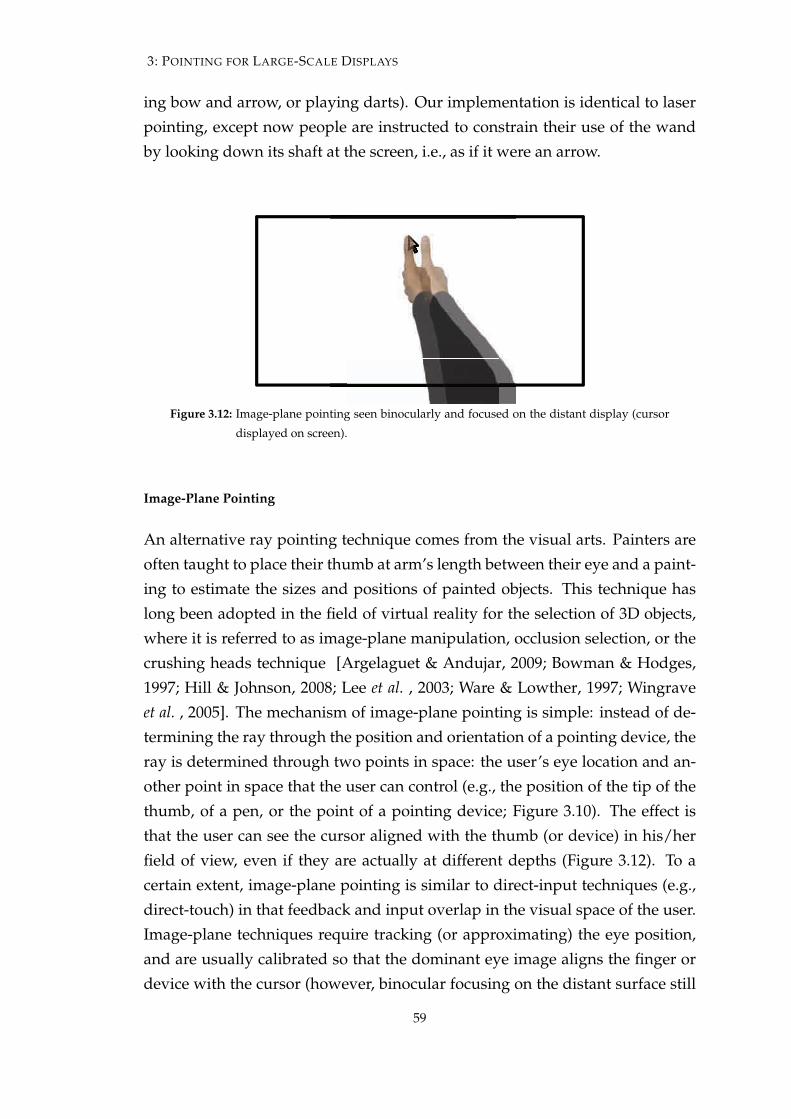
3: POINTING FOR LARGE-SCALE DISPLAYS
ing bow and arrow, or playing darts). Our implementation is identical to laserpointing, except now people are instructed to constrain their use of the wandby looking down its shaft at the screen, i.e., as if it were an arrow.
Figure 3.12: Image-plane pointing seen binocularly and focused on the distant display (cursor
displayed on screen).
Image-Plane Pointing
An alternative ray pointing technique comes from the visual arts. Painters areoften taught to place their thumb at arm’s length between their eye and a paint-ing to estimate the sizes and positions of painted objects. This technique haslong been adopted in the field of virtual reality for the selection of 3D objects,where it is referred to as image-plane manipulation, occlusion selection, or thecrushing heads technique [Argelaguet & Andujar, 2009; Bowman & Hodges,1997; Hill & Johnson, 2008; Lee et al. , 2003; Ware & Lowther, 1997; Wingraveet al. , 2005]. The mechanism of image-plane pointing is simple: instead of de-termining the ray through the position and orientation of a pointing device, theray is determined through two points in space: the user’s eye location and an-other point in space that the user can control (e.g., the position of the tip of thethumb, of a pen, or the point of a pointing device; Figure 3.10). The effect isthat the user can see the cursor aligned with the thumb (or device) in his/herfield of view, even if they are actually at different depths (Figure 3.12). To acertain extent, image-plane pointing is similar to direct-input techniques (e.g.,direct-touch) in that feedback and input overlap in the visual space of the user.Image-plane techniques require tracking (or approximating) the eye position,and are usually calibrated so that the dominant eye image aligns the finger ordevice with the cursor (however, binocular focusing on the distant surface still
59
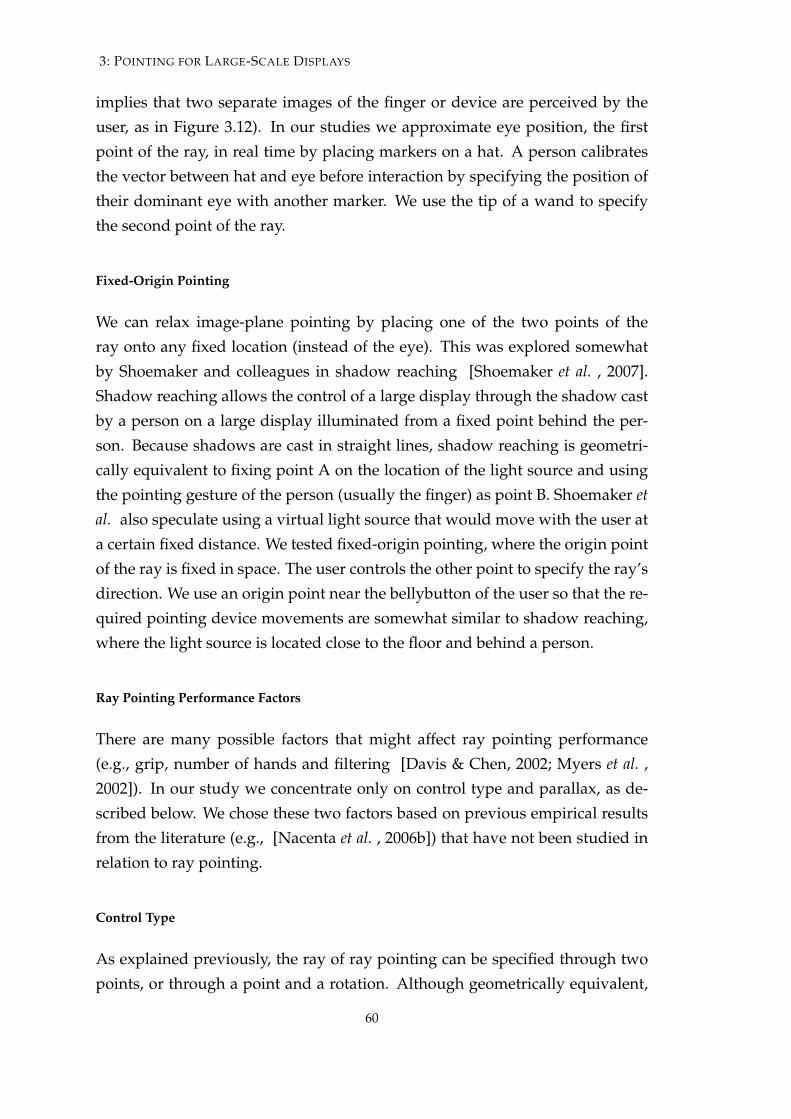
3: POINTING FOR LARGE-SCALE DISPLAYS
implies that two separate images of the finger or device are perceived by theuser, as in Figure 3.12). In our studies we approximate eye position, the firstpoint of the ray, in real time by placing markers on a hat. A person calibratesthe vector between hat and eye before interaction by specifying the position oftheir dominant eye with another marker. We use the tip of a wand to specifythe second point of the ray.
Fixed-Origin Pointing
We can relax image-plane pointing by placing one of the two points of theray onto any fixed location (instead of the eye). This was explored somewhatby Shoemaker and colleagues in shadow reaching [Shoemaker et al. , 2007].Shadow reaching allows the control of a large display through the shadow castby a person on a large display illuminated from a fixed point behind the per-son. Because shadows are cast in straight lines, shadow reaching is geometri-cally equivalent to fixing point A on the location of the light source and usingthe pointing gesture of the person (usually the finger) as point B. Shoemaker etal. also speculate using a virtual light source that would move with the user ata certain fixed distance. We tested fixed-origin pointing, where the origin pointof the ray is fixed in space. The user controls the other point to specify the ray’sdirection. We use an origin point near the bellybutton of the user so that the re-quired pointing device movements are somewhat similar to shadow reaching,where the light source is located close to the floor and behind a person.
Ray Pointing Performance Factors
There are many possible factors that might affect ray pointing performance(e.g., grip, number of hands and filtering [Davis & Chen, 2002; Myers et al. ,2002]). In our study we concentrate only on control type and parallax, as de-scribed below. We chose these two factors based on previous empirical resultsfrom the literature (e.g., [Nacenta et al. , 2006b]) that have not been studied inrelation to ray pointing.
Control Type
As explained previously, the ray of ray pointing can be specified through twopoints, or through a point and a rotation. Although geometrically equivalent,
60
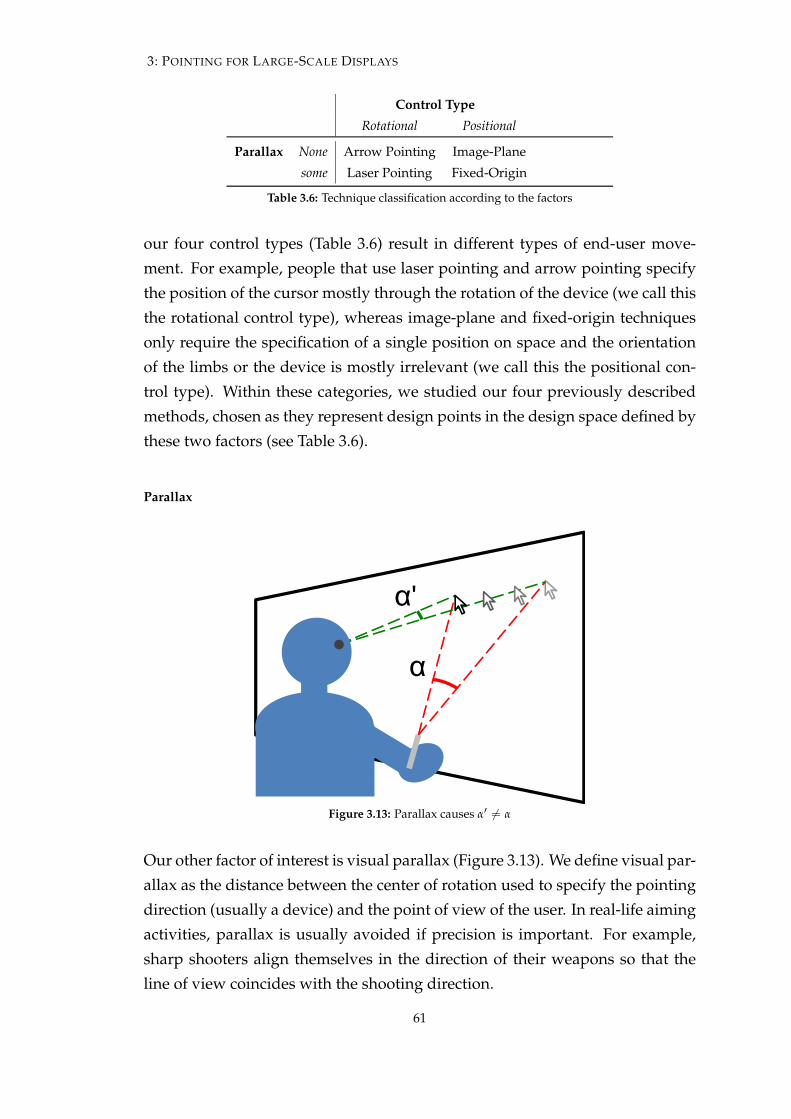
3: POINTING FOR LARGE-SCALE DISPLAYS
Control TypeRotational Positional
Parallax None Arrow Pointing Image-Planesome Laser Pointing Fixed-Origin
Table 3.6: Technique classification according to the factors
our four control types (Table 3.6) result in different types of end-user move-ment. For example, people that use laser pointing and arrow pointing specifythe position of the cursor mostly through the rotation of the device (we call thisthe rotational control type), whereas image-plane and fixed-origin techniquesonly require the specification of a single position on space and the orientationof the limbs or the device is mostly irrelevant (we call this the positional con-trol type). Within these categories, we studied our four previously describedmethods, chosen as they represent design points in the design space defined bythese two factors (see Table 3.6).
Parallax
α
α'
Figure 3.13: Parallax causes a0 6= a
Our other factor of interest is visual parallax (Figure 3.13). We define visual par-allax as the distance between the center of rotation used to specify the pointingdirection (usually a device) and the point of view of the user. In real-life aimingactivities, parallax is usually avoided if precision is important. For example,sharp shooters align themselves in the direction of their weapons so that theline of view coincides with the shooting direction.
61
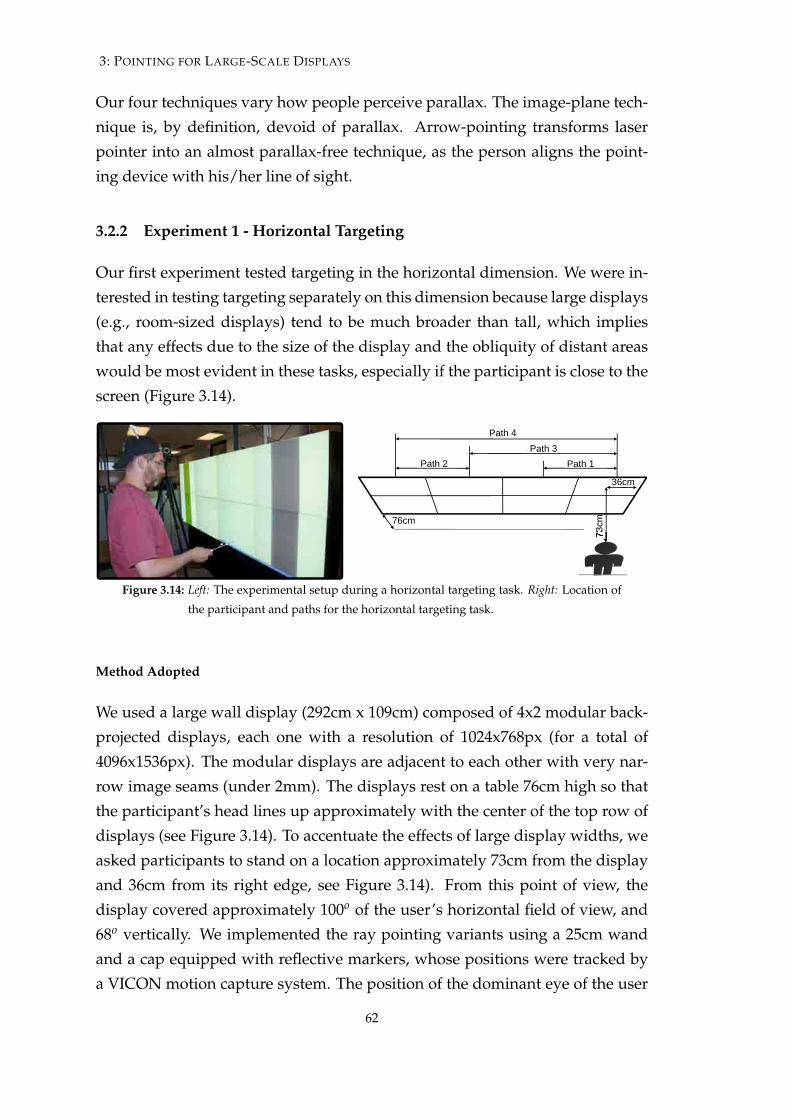
3: POINTING FOR LARGE-SCALE DISPLAYS
Our four techniques vary how people perceive parallax. The image-plane tech-nique is, by definition, devoid of parallax. Arrow-pointing transforms laserpointer into an almost parallax-free technique, as the person aligns the point-ing device with his/her line of sight.
3.2.2 Experiment 1 - Horizontal Targeting
Our first experiment tested targeting in the horizontal dimension. We were in-terested in testing targeting separately on this dimension because large displays(e.g., room-sized displays) tend to be much broader than tall, which impliesthat any effects due to the size of the display and the obliquity of distant areaswould be most evident in these tasks, especially if the participant is close to thescreen (Figure 3.14).
36cm
76cm
73cm
Path 1 Path 3
Path 4
Path 2
73cm
Figure 3.14: Left: The experimental setup during a horizontal targeting task. Right: Location of
the participant and paths for the horizontal targeting task.
Method Adopted
We used a large wall display (292cm x 109cm) composed of 4x2 modular back-projected displays, each one with a resolution of 1024x768px (for a total of4096x1536px). The modular displays are adjacent to each other with very nar-row image seams (under 2mm). The displays rest on a table 76cm high so thatthe participant’s head lines up approximately with the center of the top row ofdisplays (see Figure 3.14). To accentuate the effects of large display widths, weasked participants to stand on a location approximately 73cm from the displayand 36cm from its right edge, see Figure 3.14). From this point of view, thedisplay covered approximately 100o of the user’s horizontal field of view, and68o vertically. We implemented the ray pointing variants using a 25cm wandand a cap equipped with reflective markers, whose positions were tracked bya VICON motion capture system. The position of the dominant eye of the user
62

3: POINTING FOR LARGE-SCALE DISPLAYS
was updated in real time by using the position and orientation of the cap andthe calibration data obtained before each block that involved the image-planetechnique. Participants selected targets by clicking a mechanical button heldin their non-dominant hand (we used a separate button, as pressing a buttonon the wand could affect its stability). In all techniques, a circular cursor wasdisplayed on the screen. Our experimental software ran on a Core 2 Quad PCrunning Windows XP. The software was built on the .NET platform and usedWPF for presentation. Both image and input were refreshed at a rate well aboveinteractive rate (approximately 50Hz for display and input).
Task. The horizontal task follows the ISO 9241-9 one-direction tapping test rec-ommendation [ISONorm, 2002]. Participants had to alternately move the cur-sor onto each of the target positions that composed a path, and click withinits boundaries. The targets were vertical bands that covered the height of thedisplay ( see Figure 3.14). Targeting tasks varied in the width of the targets(100, 200, and 400px; 7.1, 14.2, and 28.5cm), the distance between target centers(1024, 2048, and 3072px; 73, 146 and 219cm), the position of the targets alongthe screen, and the direction (left-right or right-left). Figure 3.14 (right) showsa diagram with the four different paths, which multiplied by three differentwidths and two directions result in 24 distinct targeting tasks. Visual feedbackof errors was provided in the form of color changes of the target.
Participants. Twelve participants recruited from a local university (4 female, 8male; 24 to 36 years old) took part in the study for $15 remuneration. All par-ticipants were right-handed.
Procedure and Design. After signing a consent form, each participant providedsome basic demographic information, was tested for eye dominance (to deter-mine the dominant eye for the image-plane technique), and received instructionin the four ray pointing techniques.
Technique order was counterbalanced across subjects using a random Latinsquare design. Participants underwent a block of training for each technique(24 individual trials per technique involving all distances, positions, and targetwidths), and then, in the same order, two separate blocks of actual trials for eachtechnique with three repetitions per individual task. Tasks were presented in
63
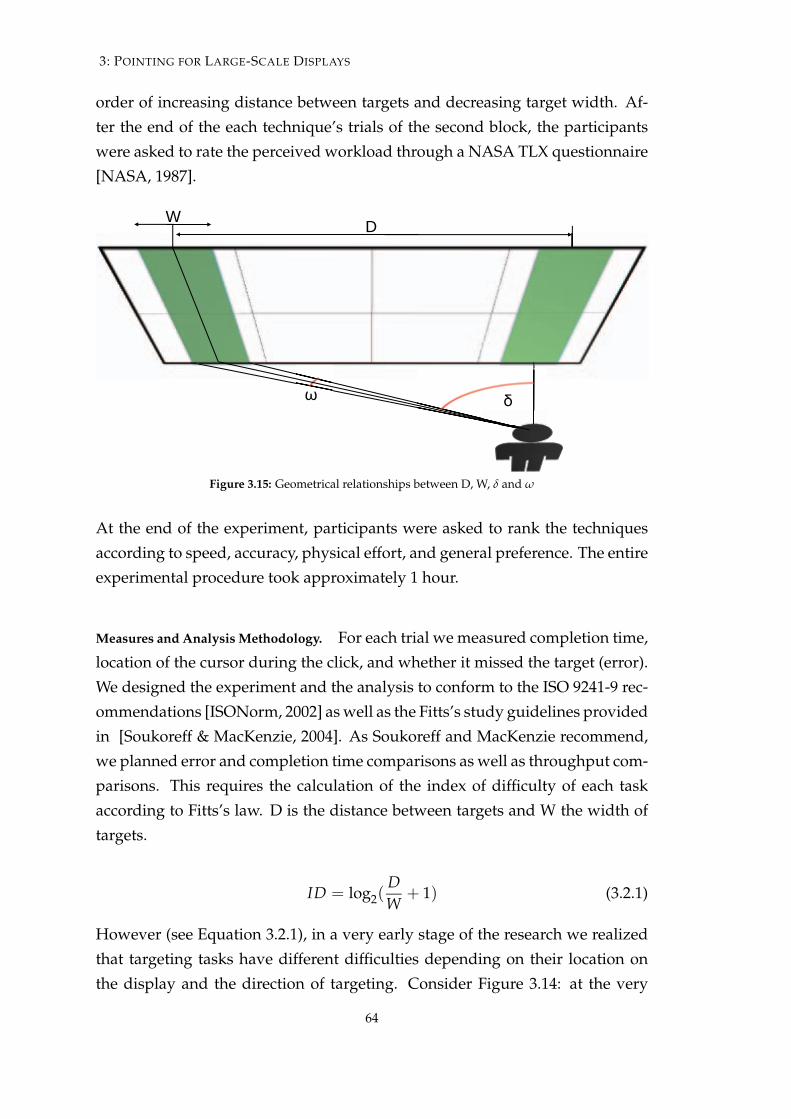
3: POINTING FOR LARGE-SCALE DISPLAYS
order of increasing distance between targets and decreasing target width. Af-ter the end of the each technique’s trials of the second block, the participantswere asked to rate the perceived workload through a NASA TLX questionnaire[NASA, 1987].
δ ω
D W
Figure 3.15: Geometrical relationships between D, W, d and w
At the end of the experiment, participants were asked to rank the techniquesaccording to speed, accuracy, physical effort, and general preference. The entireexperimental procedure took approximately 1 hour.
Measures and Analysis Methodology. For each trial we measured completion time,location of the cursor during the click, and whether it missed the target (error).We designed the experiment and the analysis to conform to the ISO 9241-9 rec-ommendations [ISONorm, 2002] as well as the Fitts’s study guidelines providedin [Soukoreff & MacKenzie, 2004]. As Soukoreff and MacKenzie recommend,we planned error and completion time comparisons as well as throughput com-parisons. This requires the calculation of the index of difficulty of each taskaccording to Fitts’s law. D is the distance between targets and W the width oftargets.
ID = log2(DW
+ 1) (3.2.1)
However (see Equation 3.2.1), in a very early stage of the research we realizedthat targeting tasks have different difficulties depending on their location onthe display and the direction of targeting. Consider Figure 3.14: at the very
64

3: POINTING FOR LARGE-SCALE DISPLAYS
least, targeting into the farthest region of the display (a distant target) shouldbe harder than targeting onto the near target. Following reasoning parallel toKopper and colleagues [Kopper et al. , 2010], we anticipated that the standardFitts’s model would not capture targeting time differences that can be derivedfrom the geometrical relationships between the person, the display, and thetarget. Therefore, we performed two regressions on the data, one with the stan-dard (linear) version of Fitts’s index of difficulty(IDLinear), and one with a vari-ant of the formula that substitutes D and W for the subtended angles of D andW (d and w, see Equation 3.2.2) from the location of the user (see Figure 3.15):
IDangular = log2(d
w+ 1) (3.2.2)
a = atan(x1dp
)� atan(x2dp
) (3.2.3)
dp α
X1
X2
Figure 3.16: Calculation of subtended angle between X1 and X2
The subtended angles are calculated through standard trigonometric proce-dures with the formula described in Equation 3.2.3. X1 and X2 correspond tothe horizontal coordinates of the extreme points of the linear distance whose an-gle we are calculating (see Figure 3.16). In our experimental setup, IDLinear andIDAngular calculations proved substantially different from each other because ofthe large size of the display and the position of the user. Figure 3.17 plots theIDLinear of all tasks against their IDAngular. If, as we hypothesize, IDAngular pre-dicts performance significantly better than IDLinear across participants, it wouldmake sense to use this instead to calculate throughput. In either case, for thethroughput calculation we apply the effective width corrections as argued in
65
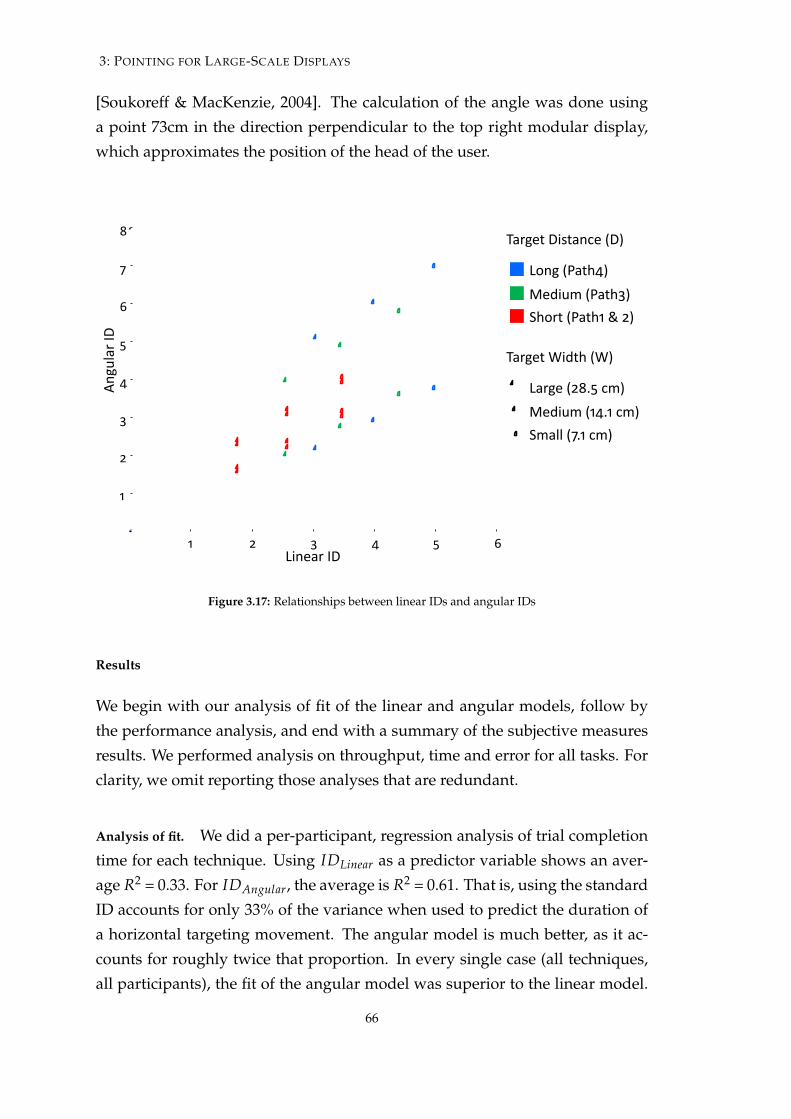
3: POINTING FOR LARGE-SCALE DISPLAYS
[Soukoreff & MacKenzie, 2004]. The calculation of the angle was done usinga point 73cm in the direction perpendicular to the top right modular display,which approximates the position of the head of the user.
8"
:
1
9
D
2
5
C
8" : 1 9 D 2
!E*F.7("G%
"
H)E/7("G%"
I7(*/,"%)J,7E3/"K%L"
H-E*"K67,+9L"
I7(*/,">)?,+"K>L"
H7(*/"K:CBD"34L"
M/?)F4"K89B8"34L"
N47.."K5B8"34L"
M/?)F4"K67,+1L"
N+-(,"K67,+8"O":L"
Figure 3.17: Relationships between linear IDs and angular IDs
Results
We begin with our analysis of fit of the linear and angular models, follow bythe performance analysis, and end with a summary of the subjective measuresresults. We performed analysis on throughput, time and error for all tasks. Forclarity, we omit reporting those analyses that are redundant.
Analysis of fit. We did a per-participant, regression analysis of trial completiontime for each technique. Using IDLinear as a predictor variable shows an aver-age R2 = 0.33. For IDAngular, the average is R2 = 0.61. That is, using the standardID accounts for only 33% of the variance when used to predict the duration ofa horizontal targeting movement. The angular model is much better, as it ac-counts for roughly twice that proportion. In every single case (all techniques,all participants), the fit of the angular model was superior to the linear model.
66
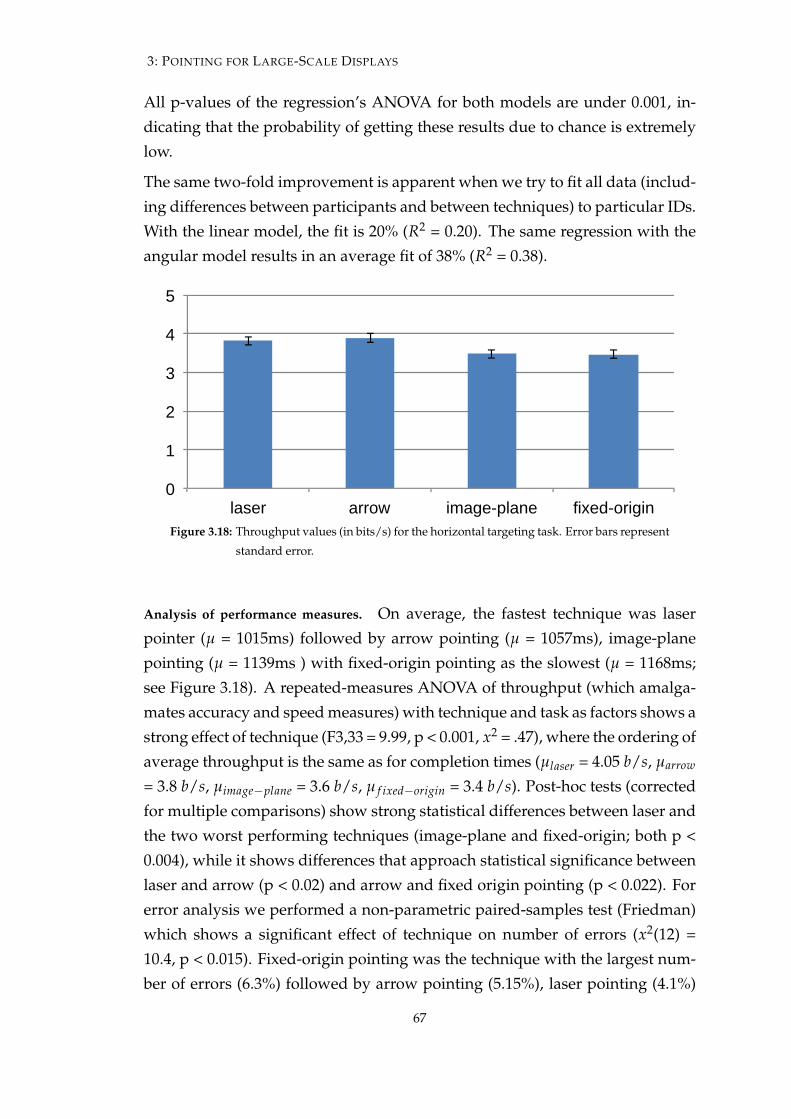
3: POINTING FOR LARGE-SCALE DISPLAYS
All p-values of the regression’s ANOVA for both models are under 0.001, in-dicating that the probability of getting these results due to chance is extremelylow.
The same two-fold improvement is apparent when we try to fit all data (includ-ing differences between participants and between techniques) to particular IDs.With the linear model, the fit is 20% (R2 = 0.20). The same regression with theangular model results in an average fit of 38% (R2 = 0.38).
0!
1!
2!
3!
4!
5!
laser! arrow! image-plane! fixed-origin!Figure 3.18: Throughput values (in bits/s) for the horizontal targeting task. Error bars represent
standard error.
Analysis of performance measures. On average, the fastest technique was laserpointer (µ = 1015ms) followed by arrow pointing (µ = 1057ms), image-planepointing (µ = 1139ms ) with fixed-origin pointing as the slowest (µ = 1168ms;see Figure 3.18). A repeated-measures ANOVA of throughput (which amalga-mates accuracy and speed measures) with technique and task as factors shows astrong effect of technique (F3,33 = 9.99, p < 0.001, x2 = .47), where the ordering ofaverage throughput is the same as for completion times (µlaser = 4.05 b/s, µarrow
= 3.8 b/s, µimage�plane = 3.6 b/s, µ f ixed�origin = 3.4 b/s). Post-hoc tests (correctedfor multiple comparisons) show strong statistical differences between laser andthe two worst performing techniques (image-plane and fixed-origin; both p <0.004), while it shows differences that approach statistical significance betweenlaser and arrow (p < 0.02) and arrow and fixed origin pointing (p < 0.022). Forerror analysis we performed a non-parametric paired-samples test (Friedman)which shows a significant effect of technique on number of errors (x2(12) =10.4, p < 0.015). Fixed-origin pointing was the technique with the largest num-ber of errors (6.3%) followed by arrow pointing (5.15%), laser pointing (4.1%)
67
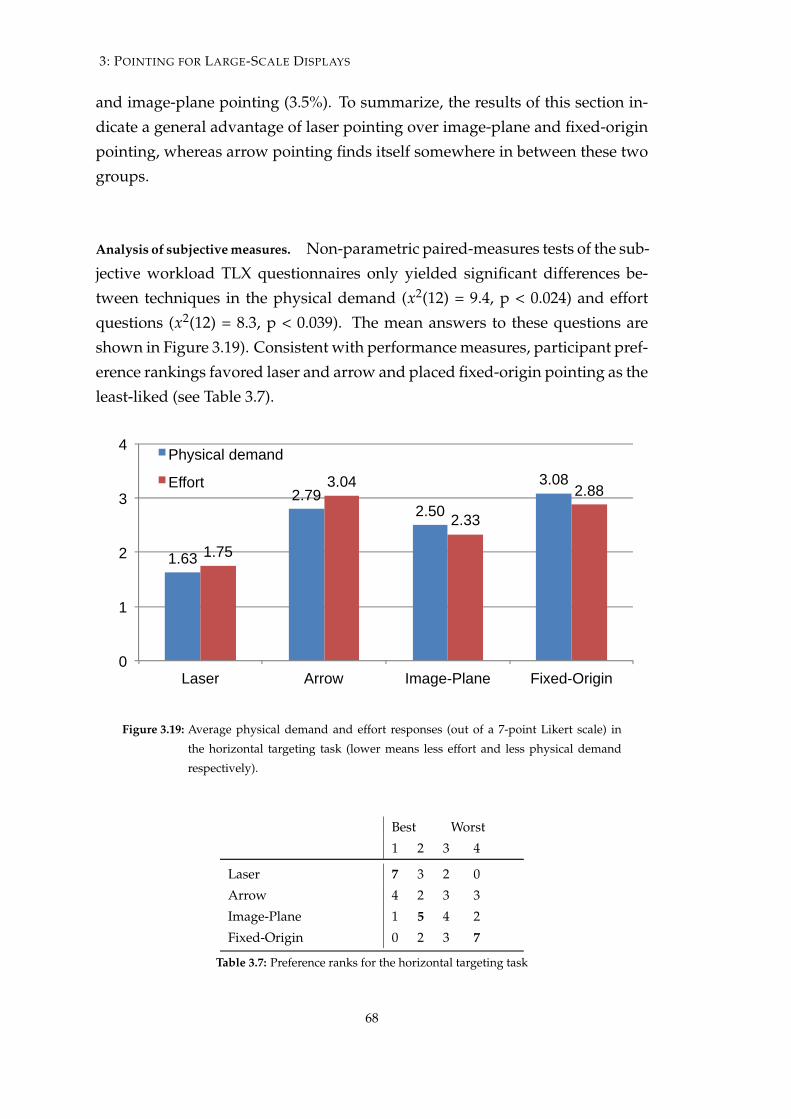
3: POINTING FOR LARGE-SCALE DISPLAYS
and image-plane pointing (3.5%). To summarize, the results of this section in-dicate a general advantage of laser pointing over image-plane and fixed-originpointing, whereas arrow pointing finds itself somewhere in between these twogroups.
Analysis of subjective measures. Non-parametric paired-measures tests of the sub-jective workload TLX questionnaires only yielded significant differences be-tween techniques in the physical demand (x2(12) = 9.4, p < 0.024) and effortquestions (x2(12) = 8.3, p < 0.039). The mean answers to these questions areshown in Figure 3.19). Consistent with performance measures, participant pref-erence rankings favored laser and arrow and placed fixed-origin pointing as theleast-liked (see Table 3.7).
1.63!
2.79!2.50!
3.08!
1.75!
3.04!
2.33!
2.88!
0!
1!
2!
3!
4!
Laser! Arrow! Image-Plane! Fixed-Origin!
Physical demand!
Effort!
Figure 3.19: Average physical demand and effort responses (out of a 7-point Likert scale) in
the horizontal targeting task (lower means less effort and less physical demand
respectively).
Best Worst1 2 3 4
Laser 7 3 2 0Arrow 4 2 3 3Image-Plane 1 5 4 2Fixed-Origin 0 2 3 7
Table 3.7: Preference ranks for the horizontal targeting task
68
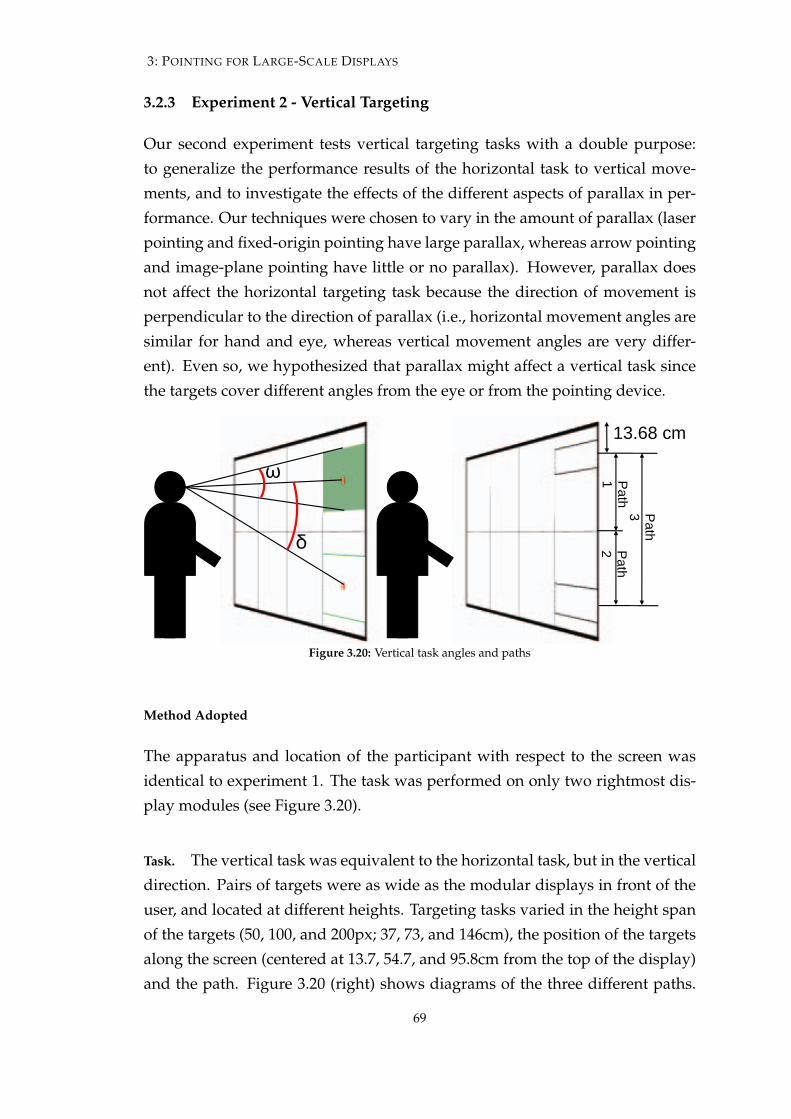
3: POINTING FOR LARGE-SCALE DISPLAYS
3.2.3 Experiment 2 - Vertical Targeting
Our second experiment tests vertical targeting tasks with a double purpose:to generalize the performance results of the horizontal task to vertical move-ments, and to investigate the effects of the different aspects of parallax in per-formance. Our techniques were chosen to vary in the amount of parallax (laserpointing and fixed-origin pointing have large parallax, whereas arrow pointingand image-plane pointing have little or no parallax). However, parallax doesnot affect the horizontal targeting task because the direction of movement isperpendicular to the direction of parallax (i.e., horizontal movement angles aresimilar for hand and eye, whereas vertical movement angles are very differ-ent). Even so, we hypothesized that parallax might affect a vertical task sincethe targets cover different angles from the eye or from the pointing device.
Path
1 P
ath 2
Path
3
13.68 cm
δ
ω
Figure 3.20: Vertical task angles and paths
Method Adopted
The apparatus and location of the participant with respect to the screen wasidentical to experiment 1. The task was performed on only two rightmost dis-play modules (see Figure 3.20).
Task. The vertical task was equivalent to the horizontal task, but in the verticaldirection. Pairs of targets were as wide as the modular displays in front of theuser, and located at different heights. Targeting tasks varied in the height spanof the targets (50, 100, and 200px; 37, 73, and 146cm), the position of the targetsalong the screen (centered at 13.7, 54.7, and 95.8cm from the top of the display)and the path. Figure 3.20 (right) shows diagrams of the three different paths.
69
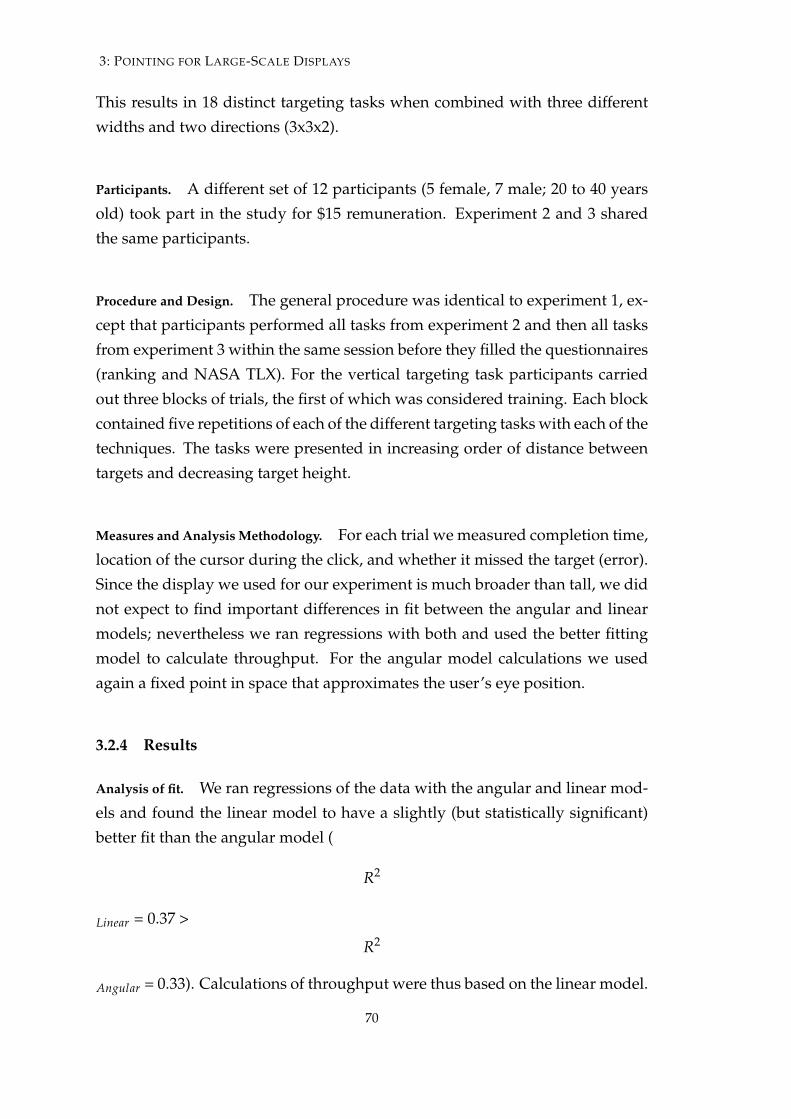
3: POINTING FOR LARGE-SCALE DISPLAYS
This results in 18 distinct targeting tasks when combined with three differentwidths and two directions (3x3x2).
Participants. A different set of 12 participants (5 female, 7 male; 20 to 40 yearsold) took part in the study for $15 remuneration. Experiment 2 and 3 sharedthe same participants.
Procedure and Design. The general procedure was identical to experiment 1, ex-cept that participants performed all tasks from experiment 2 and then all tasksfrom experiment 3 within the same session before they filled the questionnaires(ranking and NASA TLX). For the vertical targeting task participants carriedout three blocks of trials, the first of which was considered training. Each blockcontained five repetitions of each of the different targeting tasks with each of thetechniques. The tasks were presented in increasing order of distance betweentargets and decreasing target height.
Measures and Analysis Methodology. For each trial we measured completion time,location of the cursor during the click, and whether it missed the target (error).Since the display we used for our experiment is much broader than tall, we didnot expect to find important differences in fit between the angular and linearmodels; nevertheless we ran regressions with both and used the better fittingmodel to calculate throughput. For the angular model calculations we usedagain a fixed point in space that approximates the user’s eye position.
3.2.4 Results
Analysis of fit. We ran regressions of the data with the angular and linear mod-els and found the linear model to have a slightly (but statistically significant)better fit than the angular model (
R2
Linear = 0.37 >
R2
Angular = 0.33). Calculations of throughput were thus based on the linear model.
70
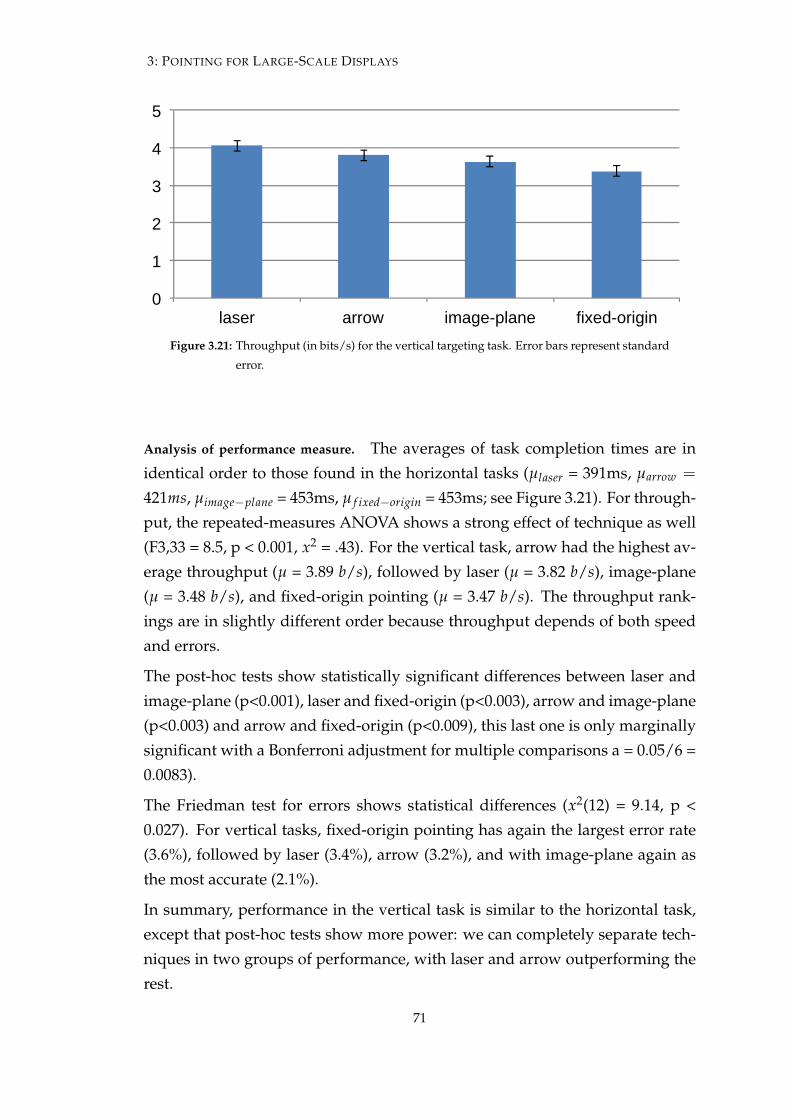
3: POINTING FOR LARGE-SCALE DISPLAYS
0!
1!
2!
3!
4!
5!
laser! arrow! image-plane! fixed-origin!Figure 3.21: Throughput (in bits/s) for the vertical targeting task. Error bars represent standard
error.
Analysis of performance measure. The averages of task completion times are inidentical order to those found in the horizontal tasks (µlaser = 391ms, µarrow =
421ms, µimage�plane = 453ms, µ f ixed�origin = 453ms; see Figure 3.21). For through-put, the repeated-measures ANOVA shows a strong effect of technique as well(F3,33 = 8.5, p < 0.001, x2 = .43). For the vertical task, arrow had the highest av-erage throughput (µ = 3.89 b/s), followed by laser (µ = 3.82 b/s), image-plane(µ = 3.48 b/s), and fixed-origin pointing (µ = 3.47 b/s). The throughput rank-ings are in slightly different order because throughput depends of both speedand errors.
The post-hoc tests show statistically significant differences between laser andimage-plane (p<0.001), laser and fixed-origin (p<0.003), arrow and image-plane(p<0.003) and arrow and fixed-origin (p<0.009), this last one is only marginallysignificant with a Bonferroni adjustment for multiple comparisons a = 0.05/6 =0.0083).
The Friedman test for errors shows statistical differences (x2(12) = 9.14, p <0.027). For vertical tasks, fixed-origin pointing has again the largest error rate(3.6%), followed by laser (3.4%), arrow (3.2%), and with image-plane again asthe most accurate (2.1%).
In summary, performance in the vertical task is similar to the horizontal task,except that post-hoc tests show more power: we can completely separate tech-niques in two groups of performance, with laser and arrow outperforming therest.
71
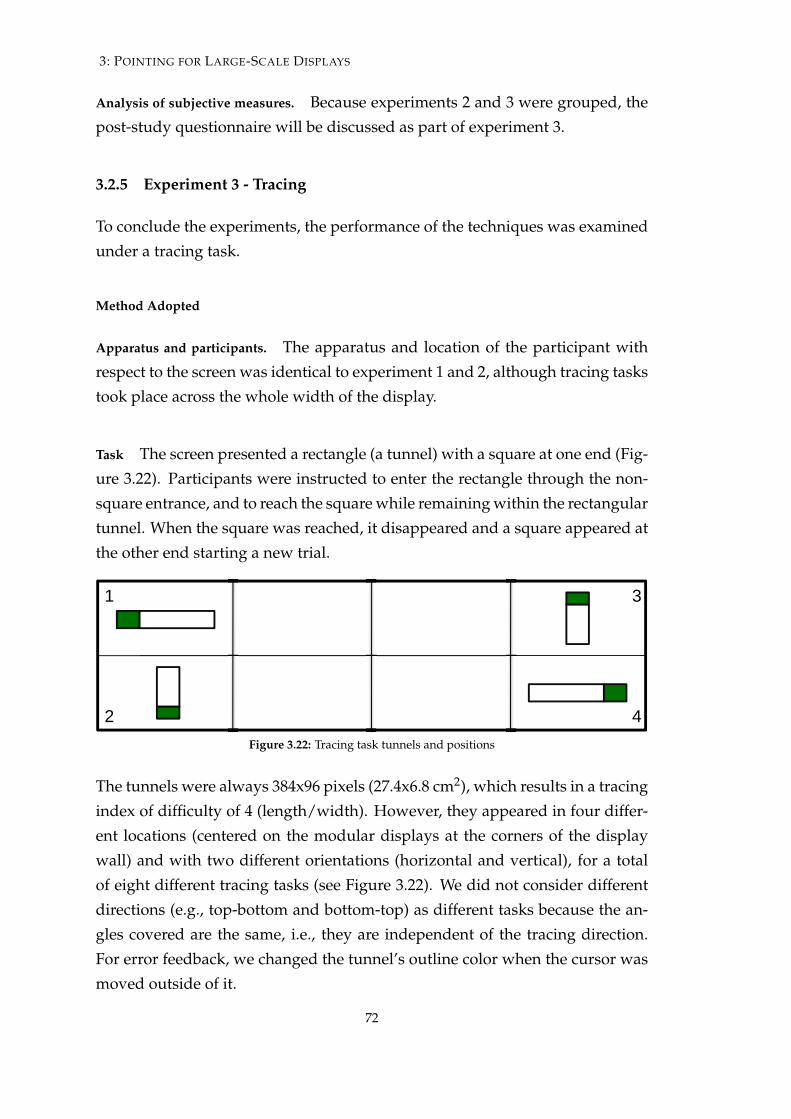
3: POINTING FOR LARGE-SCALE DISPLAYS
Analysis of subjective measures. Because experiments 2 and 3 were grouped, thepost-study questionnaire will be discussed as part of experiment 3.
3.2.5 Experiment 3 - Tracing
To conclude the experiments, the performance of the techniques was examinedunder a tracing task.
Method Adopted
Apparatus and participants. The apparatus and location of the participant withrespect to the screen was identical to experiment 1 and 2, although tracing taskstook place across the whole width of the display.
Task The screen presented a rectangle (a tunnel) with a square at one end (Fig-ure 3.22). Participants were instructed to enter the rectangle through the non-square entrance, and to reach the square while remaining within the rectangulartunnel. When the square was reached, it disappeared and a square appeared atthe other end starting a new trial.
1
2
3
4Figure 3.22: Tracing task tunnels and positions
The tunnels were always 384x96 pixels (27.4x6.8 cm2), which results in a tracingindex of difficulty of 4 (length/width). However, they appeared in four differ-ent locations (centered on the modular displays at the corners of the displaywall) and with two different orientations (horizontal and vertical), for a totalof eight different tracing tasks (see Figure 3.22). We did not consider differentdirections (e.g., top-bottom and bottom-top) as different tasks because the an-gles covered are the same, i.e., they are independent of the tracing direction.For error feedback, we changed the tunnel’s outline color when the cursor wasmoved outside of it.
72

3: POINTING FOR LARGE-SCALE DISPLAYS
Design Participants carried out three blocks of tracing tasks for each technique,with the first block for training. For each block, participants performed sixrepetitions of each of the eight tasks for each technique. Tasks were presentedalways in the same order (vertical to horizontal, top to bottom, left modulardisplay to right modular display).
Measures and Analysis Methodology. For each trial we measured completion timeand average distance to the longitudinal line of the tunnel. We tested the modelfit with linear and angular measures (analogous to those in experiment 1). Forthe calculation of ID in tracing we used the formula suggested by the ISO 9241-0 standard. D is the length of the tunnel and W is the width that the cursor canmove transversally without leaving of the tunnel (our cursor was consideredto be of zero diameter). For the angular calculations, we used approximationsbased on the perceived angles of width and length at the center of each tunnel.Angles were calculated from the same fixed point used for experiment 1. An-gular IDs for the eight tasks range from 1.27 to 12.60 b/s. As for experiment 1,we would use the IDs of the model that offered the best fit for the throughputcalculation, and apply the corresponding adjustment for accuracy.
3.2.6 Results
Analysis of fit. The angular model shows an average fit of the data comparableto the fit for the horizontal targeting task (R2 = 0.50). Since we only testedone linear index of difficulty, comparing the fit of both models is equivalent totesting whether the angular regression is significant. The ANOVA test measureof the angular regression does exactly that. This result held in all but one ofthe 48 regressions (12 participants x 4 techniques), with p < 0.002. An omnibusregression using all participants and all techniques simultaneously produced ap < 0.0001, and R2 = 0.37.
Analysis of performance measures. The repeated-measures ANOVA of throughputcalculated from the angular indexes of difficulty shows a strong main effect oftechnique (F3,33 = 12.227, p < 0.001, x2 = .53). Image-plane had, on average, thehighest throughput (µ = 107 b/s), followed by arrow (µ = 83 b/s). Laser andfixed-origin exhibited much lower performance (µlaser = 56 b/s, µ f ixed�origin =65 b/s; see Figure 3.23). Post-hoc tests statistically differentiate image-plane
73

3: POINTING FOR LARGE-SCALE DISPLAYS
0!20!40!60!80!
100!120!140!
laser! arrow! image-plane! fixed-origin!Figure 3.23: Throughput (in b/s) for the tracing task. Error bars indicate standard error.
from laser and fixed-origin (both p < 0.002), and arrow from laser (p < 0.001).Note that the throughput values for tracing are not necessarily comparable withthose of targeting, and that the adjustment for accuracy suggested in [Soukor-eff & MacKenzie, 2004] greatly increases the effective angular IDs. A repeated-measures ANOVA of the average deviation with respect to the middle of thetunnel also shows a strong effect of technique (F3,33 = 4.9, p < 0.006, x2 = 0.30).The most accurate technique was image-plane (µ = 18.4px) followed by the restin a very tight group (µarrow = 21.7px, µlaser = 22.8px, µ f ixed�origin = 22.8px).Post-hoc tests only show statistically significant (or marginally significant) dif-ferences between image-plane and the rest.
Analysis of subjective measures. As the questionnaire encompassed experiments2 and 3, the subjective measures reflect the opinions of subjects in both tasks(vertical targeting and tracing). The measures of the NASA TLX only showedstatistical differences between techniques for the physical demand question(x2(12) = 7.8, p < 0.024). Interestingly, subjects judged the arrow as the leastphysically demanding technique, whereas the horizontal targeting task arrowwas considered the second most demanding. The preference rankings (Table3.8) also show very different results than experiment 1.
3.2.7 Discussion
As large-scale display are now more available, it becomes increasingly impor-tant to develop suitable input mechanisms that account for interacting at a dis-
74
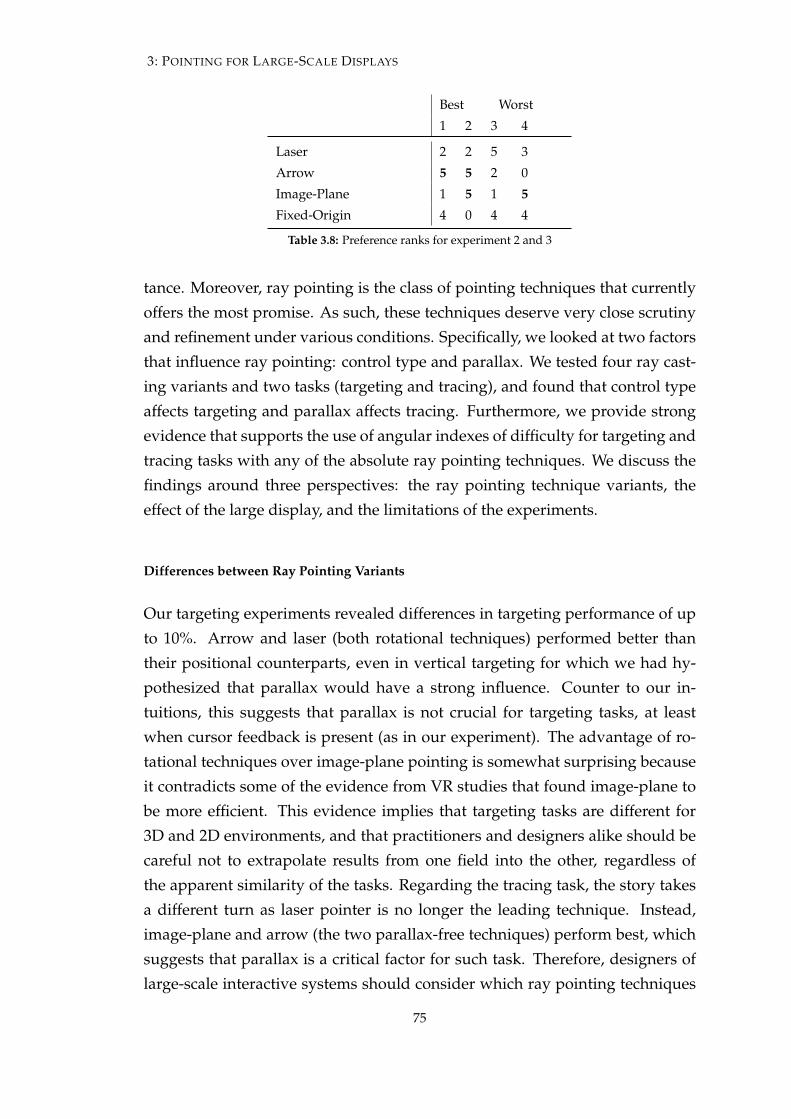
3: POINTING FOR LARGE-SCALE DISPLAYS
Best Worst1 2 3 4
Laser 2 2 5 3Arrow 5 5 2 0Image-Plane 1 5 1 5Fixed-Origin 4 0 4 4
Table 3.8: Preference ranks for experiment 2 and 3
tance. Moreover, ray pointing is the class of pointing techniques that currentlyoffers the most promise. As such, these techniques deserve very close scrutinyand refinement under various conditions. Specifically, we looked at two factorsthat influence ray pointing: control type and parallax. We tested four ray cast-ing variants and two tasks (targeting and tracing), and found that control typeaffects targeting and parallax affects tracing. Furthermore, we provide strongevidence that supports the use of angular indexes of difficulty for targeting andtracing tasks with any of the absolute ray pointing techniques. We discuss thefindings around three perspectives: the ray pointing technique variants, theeffect of the large display, and the limitations of the experiments.
Differences between Ray Pointing Variants
Our targeting experiments revealed differences in targeting performance of upto 10%. Arrow and laser (both rotational techniques) performed better thantheir positional counterparts, even in vertical targeting for which we had hy-pothesized that parallax would have a strong influence. Counter to our in-tuitions, this suggests that parallax is not crucial for targeting tasks, at leastwhen cursor feedback is present (as in our experiment). The advantage of ro-tational techniques over image-plane pointing is somewhat surprising becauseit contradicts some of the evidence from VR studies that found image-plane tobe more efficient. This evidence implies that targeting tasks are different for3D and 2D environments, and that practitioners and designers alike should becareful not to extrapolate results from one field into the other, regardless ofthe apparent similarity of the tasks. Regarding the tracing task, the story takesa different turn as laser pointer is no longer the leading technique. Instead,image-plane and arrow (the two parallax-free techniques) perform best, whichsuggests that parallax is a critical factor for such task. Therefore, designers oflarge-scale interactive systems should consider which ray pointing techniques
75

3: POINTING FOR LARGE-SCALE DISPLAYS
fits suits better to the user task (e.g.: steering vs selecting).
As observed, the same technique can produce different outcomes, which bringsup interesting research questions: will users naturally adopt the most advan-tageous use mode of the device? Alternately, how can we design a pointerthat encourages the best use of the device? Overall, our results suggest thatarrow is a good choice for both task types; it performs close to laser pointingin selection tasks, and better in steering tasks. Arrow is also relatively straight-forward to implement compared to image-plane (which requires some degreeof head-tracking). Although participants found arrow pointing tiring for thehorizontal targeting task, they did not for experiments 2 and 3. Longer termstudies should test whether physical effort is really a serious issue; however,the current data suggests that, when comparing ray-pointing techniques, userperception of effort is linked to their ability to perform up to their expectationswith that technique rather than to the differences on how the device is held.Furthermore, we anticipate that the magnitude of differences found in our ex-periments will be relevant to other research questions, e.g., when performanceis very important or errors are very costly. More extreme effects are also possi-ble for larger displays and smaller targets.
Models for Ray Pointing in Very Large Displays
We are not the first to suggest an angular adaptation of ID calculation for ray-pointing tasks. Kopper et al. [Kopper et al. , 2010] proposed a number ofalternative models for ray pointing, some of which use angular measures. Al-though their data and our results both combine to support the use of angularformulations of Fitts’s law for ray pointing, their focus was specifically on com-paring (slightly different) models for what we call laser pointing. Their fit cal-culations are performed after averaging all participants’ trials for each ID, andresult in very high fit values (R2 > .75), even for models using linear distanceand width. This approach is problematic because it eliminates most within-participant variance, and only highlights small differences in fit between mod-els that do not strongly advocate for any particular model. Instead, we decidedto compare the linear formulation against the simplest angular model, withoutartificially eliminating variance. This resulted in a more accurate estimationof the real variance explained by the models and, most importantly, on verylarge differences in fit between the two models (up to 84% increase in fit) that
76

3: POINTING FOR LARGE-SCALE DISPLAYS
strongly advocate for the use of angular models. Additionally, the differencesthat we found in model fit were consistent across all techniques (not only raypointing) and across tasks (not only targeting). This suggests that the better fitof the angular model is not only due to the rotational nature of input, but alsodue to the differences in perception of objects that are at different angles andare seen from different perspectives. Having this strong evidence to supportangular models is critical for research and design of large display interaction;using the linear model in large-display experiments (the current approach) willintroduce a large amount of noise, which can dramatically reduce the powerof statistical tests. Similarly, when using targeting and menu activation esti-mations for the design of large display interfaces, it is important to know thatdifferent locations in the display will be affected differently depending on theposition of the user.
Limitations
Any experiment is necessarily limited in the amount of conditions and factorsthat it can test, and ours is not an exception. Most notably, our experimentonly tested one distance from the display. It is possible that other models bet-ter reflect distance variability, but this remains an open question (see also thediscussion in [Kopper et al. , 2010]). Our evidence on the factors that cause tech-nique performance differences is also not definitive. For example, establishinga strong causal link between parallax and poor tracing performance requiresfurther research. Furthermore, targeting results for the laser variants might ex-hibit an exaggeration effect due to high familiarity of the device in comparisonwith the positional techniques. We added significant amounts of training to theexperiment to avoid this biasing, but this issue also requires further research.Finally, other slight variants to the test design can be addressed in order toperceive the bigger picture of ray pointing techniques, e.g., do users performdifferently if we change the location of the click button or handedness?
Lessons for Practitioners
We summarize the implications for researchers and designers in four mainpoints:
• If targeting is important, choose laser-style ray pointing;
77

3: POINTING FOR LARGE-SCALE DISPLAYS
• For modeling targeting and tracing tasks that span a large angle from thepoint of view of the user, use a performance model that takes angles intoaccount;
• For tracing tasks choose parallax-free pointing;
• Training people to use a pointing device from a location close to the eye(arrow pointing) provides good performance for both targeting and trac-ing tasks.
3.3 Overall Discussion
In this section we discuss the combined result of both user tests. The followingsection provides insights on findings related to: Large-Scale displays, interac-tion techniques, and user position in Large-Scale Display scenarios.
3.3.1 Large-scale Display
Users are comfortable with pointing as an interaction technique, even thoughthey had to maintain an upright position during the interaction. On all testsessions, users were able to finish the required tasks without major problems.The only issue detected through the tests relates directly to fatigue during pro-longed pointing interaction without no breaks (some tests amounted up to 60minutes).
Interacting while standing can bring fatigue, more so if users have to gesticu-late to issue commands. Pointing requires gestures for interaction, but somevariants do not require users to keep their arms in a constant strain. The lasertechnique is ideal for fatigue reduction. During out tests we specifically askedusers to hold the laser close to their waist, but the technique allows for a num-ber of ways to grab the device and point that can help reduce fatigue. Moreover,between pointing actions users can relax their arm and further reduce fatigueissues.
3.3.2 Distance
Our results suggest that distance does not have a direct correlation with point-ing performance. Pointing is affected by jitter, the effects of which increase
78

3: POINTING FOR LARGE-SCALE DISPLAYS
Figure 3.24: Distance exaggerate the effect or rotational control type. For example, for the same
user position, a pointing metaphor is very similar to grab for close interaction. For
distant interaction, the grab and the point metaphor show cursors with distinct
screen positions.
with distance [Myers et al. , 2002], and control type (see figure 3.24). Moreover,results for the tracing task show that subjects found it easier to interact with ob-jects in front of them (closer) that with objects in the peripheral view (slightlydistant). Users naturally dealt with all these factors and showed no visible signsof being significantly affected by them.
Our conclusion is that distance does not directly affect interaction, but there areother variables that might depend on user position (such as jitter or parallax).Therefore, to reduce the effect of these variables, it is important that users havea coherent interaction technique for all distances, and not force the users tointeract at a specific position.
3.3.3 Interaction Techniques
We tested five different pointing metaphor variants. On both tests, users se-lected the closest variant to the pointing gesture used in human to human di-alogs. Moreover, factors such as control type and parallax do seem to affectinteraction even if only for a select set of tasks. Overall, there is one set oftechniques that seems to be more useful in everyday interaction: laser-like in-teraction (vectorized control type with parallax). It provides enough freedom toreduce fatigue and allows users to move freely throughout the interaction zone.The first test suggests that grab-like metaphors are useful for close distance in-
79

3: POINTING FOR LARGE-SCALE DISPLAYS
teraction with objects that are within arms reach. However, pointing with alaser-like technique achieves similar results when close enough to the display(see figure 3.24). Therefore, if the implementation provides enough freedom tothe users, pointing can replace the grab metaphor when interacting closer tothe display.
3.3.4 Practical relevance of results
While most of the results presented should be taken into account, it is impor-tant to understand the results and where to apply them. Although we see adifference of 10% in ray pointing variants, these will not be relevant in situ-ations where speed is not of the utmost importance. Living room scenarios,where people interact to view photos or select a movie are not bottlenecked byspeed and, in this cases, fatigue or comfort should overcome performance. Onthe other hand, there are scenarios where 10% is needed. Scenarios such as air-port control towers, control rooms for armed forces or firefighters headquartersneed to take into account time to response and, at the same time, maintain alarge number of elements on-screen, and might welcome the improvement inperformance.
80

4Evaluating Pointing on a real world
scenario
This chapter explores the lessons learned on a real world scenario. We presenthow a pointing metaphor was applied to a large-scale display application fordesign review meetings. We start by describing the context in with this workwas conducted, presenting the system requirements and providing an overviewof the system architecture. We then focus on the user interface and describehow the user interface was influenced by applying the guidelines obtained inthe previous chapter. From previous experience, pointing is important to userinteraction on large-scale displays. To understand how a pointing interface in-fluences user experience, we conducted user tests with twenty-two subjects.Results suggest that our approach to pointing made it adequate both to supportdesign review and comfortable to learn. Based on these results, we concludewith observations on how users applied and adopted the interaction metaphorsduring design review meetings.
81
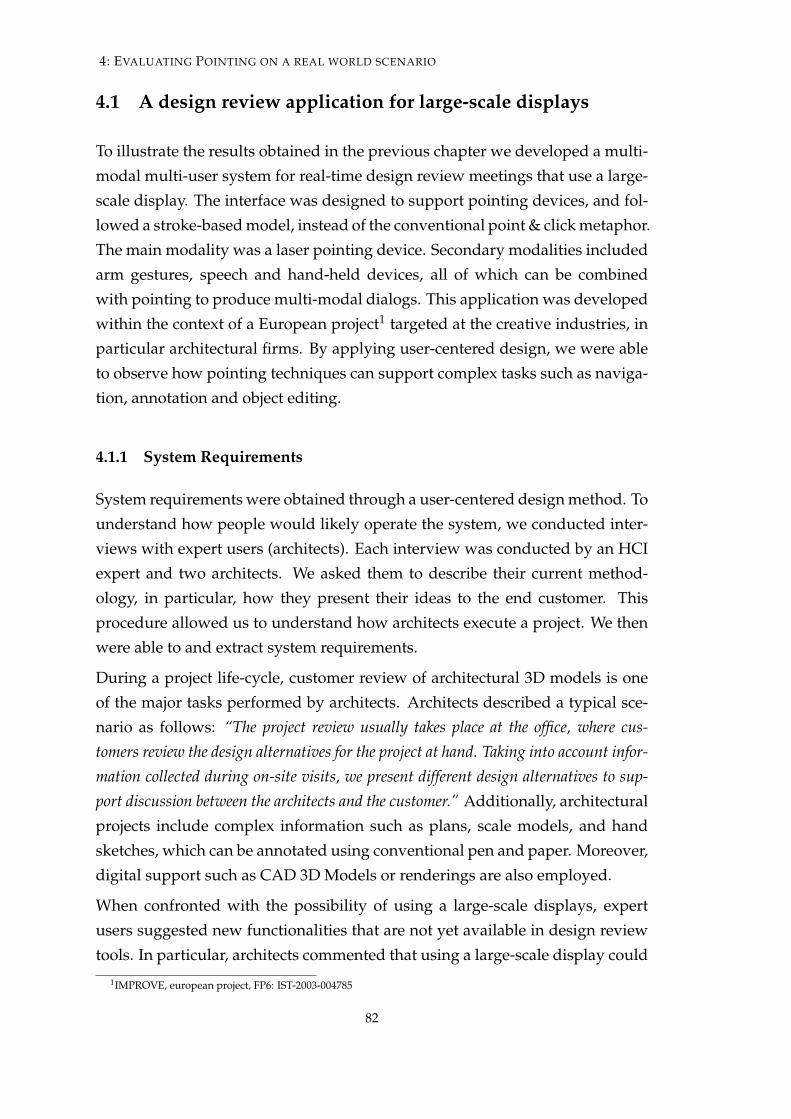
4: EVALUATING POINTING ON A REAL WORLD SCENARIO
4.1 A design review application for large-scale displays
To illustrate the results obtained in the previous chapter we developed a multi-modal multi-user system for real-time design review meetings that use a large-scale display. The interface was designed to support pointing devices, and fol-lowed a stroke-based model, instead of the conventional point & click metaphor.The main modality was a laser pointing device. Secondary modalities includedarm gestures, speech and hand-held devices, all of which can be combinedwith pointing to produce multi-modal dialogs. This application was developedwithin the context of a European project1 targeted at the creative industries, inparticular architectural firms. By applying user-centered design, we were ableto observe how pointing techniques can support complex tasks such as naviga-tion, annotation and object editing.
4.1.1 System Requirements
System requirements were obtained through a user-centered design method. Tounderstand how people would likely operate the system, we conducted inter-views with expert users (architects). Each interview was conducted by an HCIexpert and two architects. We asked them to describe their current method-ology, in particular, how they present their ideas to the end customer. Thisprocedure allowed us to understand how architects execute a project. We thenwere able to and extract system requirements.
During a project life-cycle, customer review of architectural 3D models is oneof the major tasks performed by architects. Architects described a typical sce-nario as follows: “The project review usually takes place at the office, where cus-tomers review the design alternatives for the project at hand. Taking into account infor-mation collected during on-site visits, we present different design alternatives to sup-port discussion between the architects and the customer.” Additionally, architecturalprojects include complex information such as plans, scale models, and handsketches, which can be annotated using conventional pen and paper. Moreover,digital support such as CAD 3D Models or renderings are also employed.
When confronted with the possibility of using a large-scale displays, expertusers suggested new functionalities that are not yet available in design reviewtools. In particular, architects commented that using a large-scale display could
1IMPROVE, european project, FP6: IST-2003-004785
82

4: EVALUATING POINTING ON A REAL WORLD SCENARIO
allow them to show models at scales not possible with their current tool. In-deed, physical models are built at a much smaller scale, starting from 1:200.They also commented that it would create an immersive environment whereclients could get a better feeling of the concept being presented. When specif-ically asked about possible interactions with the model, architects stated thatmobility was a crucial aspect, since current customer meetings often take placein a meeting room using the aid of paper plans and models, and a projectorpowered by a single laptop to display renderings of the proposed design. Whenprojecting a 3D model, architects often use deictic aids, including laser point-ers, to highlight design features. When changing renderings, they are requiredto operate the computer, using keyboard and mouse. This interrupts the work-flow of the presentation and creates disruptions in the dialog with the customer.After being presented with the available technology (described in Section 2.7)architects commented that an interface that would not disrupt their workflowduring presentation would be of interest.
We set to develop a design review application with large-scale displays in mind,where we would devise novel interaction techniques adequate to the task onhand. Based on the user feedback, we identified several functional require-ments for the design review application. These can be grouped in four majorcategories: navigation, annotation, object editing and collaborative support. Asfor interaction requirements, we set to take advantage of user familiarity withpen based devices such as stylus tablets, interactive pen displays, laser pointersand other pointing devices. Moreover, architects were interested in new devel-opments such as speech commands and gestures, therefore these were includedin the interface design as secondary modalities. As can be intuited, these userrequirements indicated the need for a multimodal input lexicon combining apointing devices, speech, and body gestures.
Navigation
To explore virtual scenes, we devised three different metaphors for 3D spatialinteraction: flying, walking and examining.
When flying or examining, the observer is detached from his/her physical lo-cation. This detachment provides means to reach locations without regard to“real” physical constrains. The flying mode offers a better perspective thanwalking with a maximum degree of freedom. The examining mode provides
83
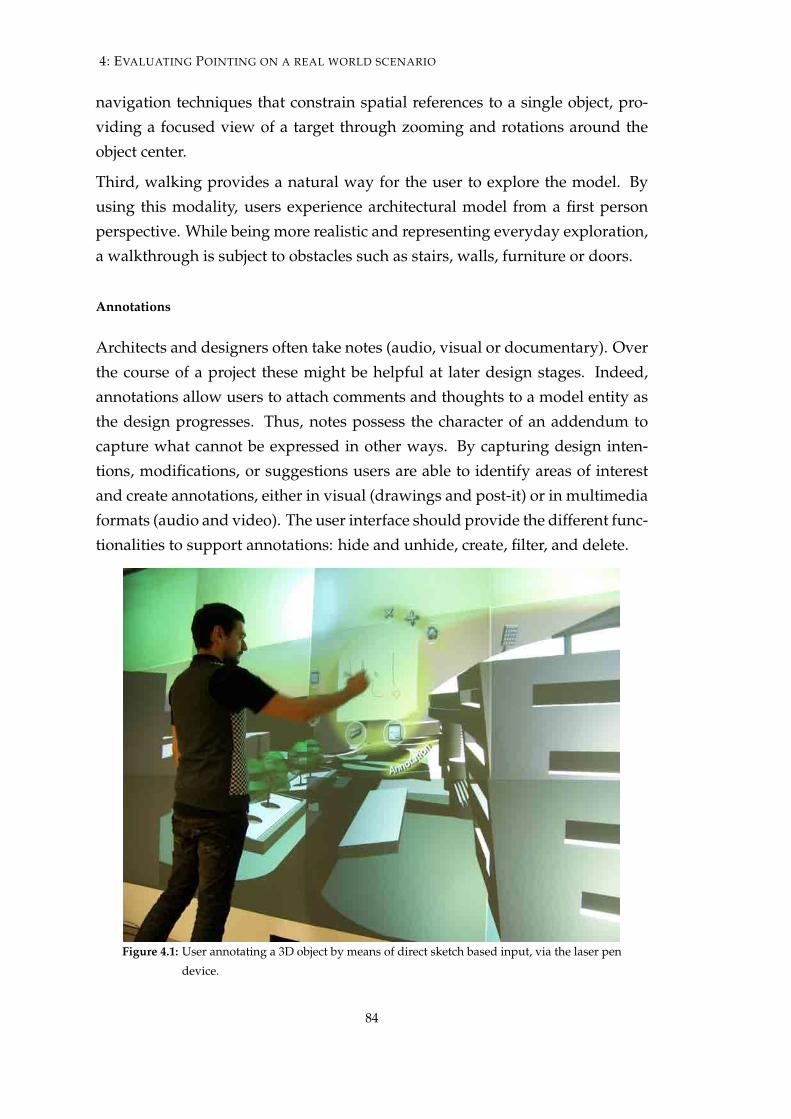
4: EVALUATING POINTING ON A REAL WORLD SCENARIO
navigation techniques that constrain spatial references to a single object, pro-viding a focused view of a target through zooming and rotations around theobject center.
Third, walking provides a natural way for the user to explore the model. Byusing this modality, users experience architectural model from a first personperspective. While being more realistic and representing everyday exploration,a walkthrough is subject to obstacles such as stairs, walls, furniture or doors.
Annotations
Architects and designers often take notes (audio, visual or documentary). Overthe course of a project these might be helpful at later design stages. Indeed,annotations allow users to attach comments and thoughts to a model entity asthe design progresses. Thus, notes possess the character of an addendum tocapture what cannot be expressed in other ways. By capturing design inten-tions, modifications, or suggestions users are able to identify areas of interestand create annotations, either in visual (drawings and post-it) or in multimediaformats (audio and video). The user interface should provide the different func-tionalities to support annotations: hide and unhide, create, filter, and delete.
Figure 4.1: User annotating a 3D object by means of direct sketch based input, via the laser pen
device.
84
4: EVALUATING POINTING ON A REAL WORLD SCENARIO
Object editing
3D scenes are one of the main deliverables of an architectural project. Thus, thesystem must provide efficient means to edit 3D objects. In particular, during de-sign review, minor modifications are often performed by experts. We identifieda strong need to support simple object geometry editing and to rapidly insertgraphics primitives such as cube, sphere, cone, cylinder, and plane. Moreover,basic geometrical transformations found in CAD applications are expected, suchas translate, scale, and rotate.
Collaborative Review
Design review meetings are rarely single user scenarios. Therefore, we mustaddress multi-user collaboration via tools and modalities that provide interac-tive capabilities to a group of architects or clients. The large-scale display servesas the natural output device for multiple users, due to its large form-factor andhigh-resolution capabilities. Thus architects or clients naturally gather aroundthe display in the course of a review session. During the review session, userstend to collaborate via annotation. Although navigation and editing are alsorelevant, there were identified as less important for collaboration during de-sign reviews.
To support freedom of movement, the system should be flexible to allow dif-ferent input modalities. Thus, a user interacting close to the screen can opt forsketch-based input via the pointing device, whereas a second user, at a largerdistance to the screen, can choose other modalities, such as gestures or speech,that may seem more appropriate to his/her situation.
4.1.2 Design Goals
Based on the user requirements briefly outlined above, we set out to design areal-world application that would allow us to assess the guidelines proposedin Chapter 3. In particular our design goals address distinct concerns:
User Domain functionality Provide a system that caters to architects’ needs dur-ing a design review meeting. The system should take into account freedom ofmovement and the size of the display when designing the interface.
85

4: EVALUATING POINTING ON A REAL WORLD SCENARIO
Pointing Develop devices and techniques that support the pointing variantsthat provide the best performance. If possible, the device is both designed tosupport multiple variants and naturally provide the user with the options toswitch between them.
Multi-Modal Provide a multi-modal interface where different modalities pro-vide natural alternatives to the pointing device. Along with pointing, gesturesand speech are often used either as stand-alone controls or as part of multi-modal dialogues designed for large-scale displays.
Models for Ray-Pointing on Large-scale displays To propose a specialized interfacefor pointing, take into account both viewing angles and user position. The in-terface would favor the display space directly in front of the user and treatperipheral display space as secondary.
User distance Provide an interactive experience where users could move freelywithin a large space, without user distance affecting the choice of appropriatemetaphor.
Without going into further details, we will now describe the system architectureand explain how it supports these goals.
4.1.3 System Architecture
Our application provides innovative multimodal interactions for 3D content vi-sualization using a bus architecture as depicted by Figure 4.2. The system relieson two frameworks: AICI [Hur et al. , 2006], for visualization and tracking,and IMMIView, for interaction. AICI is responsible for the 3D rendering, basedon [OpenSG, 2009], and was extended to support advanced lighting throughHigh Dynamic Range rendering. Furthermore, input streams are managed withOpenTracker [Reitmayr & Schmalstieg, 2005] which provides multimodal infor-mation including marker tracking (body gestures), laser input, and traditionalkeyboard and mice.
Communications and input are routed through the IMMIView framework, builtaround an event-based bus that allows other modules (tracking, keyboard, graph-ics) to publish or subscribe to events. The choice of a publish-subscribe method-
86

4: EVALUATING POINTING ON A REAL WORLD SCENARIO
Event Manager
PDA Multiple Lasers Voice
Shape
Annotation
Navigation
MultiModal BoxInteraction ConceptCALIBody Gestures
Visualization Manager
Commander
Widget Manager
Tracker 2D Pen / Mouse
Communication Backbone
ApplicationModules
Recognizers and Specialists
Input Modules
DomainModules
AICI Framework IMMIView Framework
Figure 4.2: The IMMIView System Architecture
ology facilitates handling multimodal streams and provides extensibility to al-low the inclusion of new modules and features without requiring any corechanges, easing fusion of modalities. In IMMIView logic, the event managerregisters the modules that are interested in a target event type, and once anevent is triggered, all the interested parties are forward the event notification.IMMIView modules are organized into three different classes: publishers, con-sumers and converters.
Publishers are entities that do not require further information from the IM-MIView system to update their status. Each publisher informs the event man-ager what type of events they produce. New information is published onto awaiting line of the event manager. This mechanism provides a high level ofdecoupling to allow object oriented prototyping that it is resistant to changesin modules. Modules such as the multi-user laser handler, data proxies fromhand-held devices, and body tracking modules belong to this category, sincethey only input data to the event manager.
Consumers require information to change their state. To this end, they sub-scribe to callbacks for a particular event type. For example, the visualizationmodule subscribes to navigation type events in order to change the camera pa-rameters. Typical consumer modules include: annotation manager, shape cre-ation and manipulation, and the widgets that comprise the menu interface.
Converters act as both consumers and publishers. They subscribe to multi-ple events such as laser input and speech commands and compose those com-mands to generate higher level events such as object selection or navigation
87
4: EVALUATING POINTING ON A REAL WORLD SCENARIO
actions. Modules included in this class are detailed in the next section.
User Interaction.
User interaction is supported by converter type modules that listen to events,process them and as a result, publish higher level events to the event manager.We have defined the following converter modules:
Body Gesture Recognizer. Analyzes tracking data obtained from real timemarker based motion capture and publishes body gestures. To obtain such userdata, we track the user’s head and arms and send the information to the bodygesture recognizer.
Cali Gesture Recognizer. Cali is a 2D symbol recognizer [Fonseca et al. , 2005].It receives data from 2D input devices such as pen, mouse or lasers and gener-ates events, once stroke gestures are recognized. For example, the main menucan be opened by drawing a triangle gesture.
Multimodal Box. This module provides support for multimodal dialogues viaa rule-based inference mechanism. Using the information available on the eventbus and a predefined grammar, the multimodal box is able to compose interac-tion events by combining mixed-input modalities such as body gestures withspeech, or mixing pointing interaction with actions performed using mobiledevices to create new annotations.
4.2 Input Devices
IMMIView offers several input devices to support interaction. From task anal-ysis, we selected a laser pointer as the main interaction device and speech andgestures as secondary metaphors, thus providing a multi-modal interface. Forexample, a combination of laser and speech based interaction can activate menuoptions. Additionally, combining input surfaces is also supported for annota-tion. Thus, the user can insert multimedia content and notes using both hand-held devices and laser pointer. Furthermore, the whole body can be used asan input device, allowing both to navigate and edit objects via body gestures,which can also be combined with speech to trigger complex actions.
88
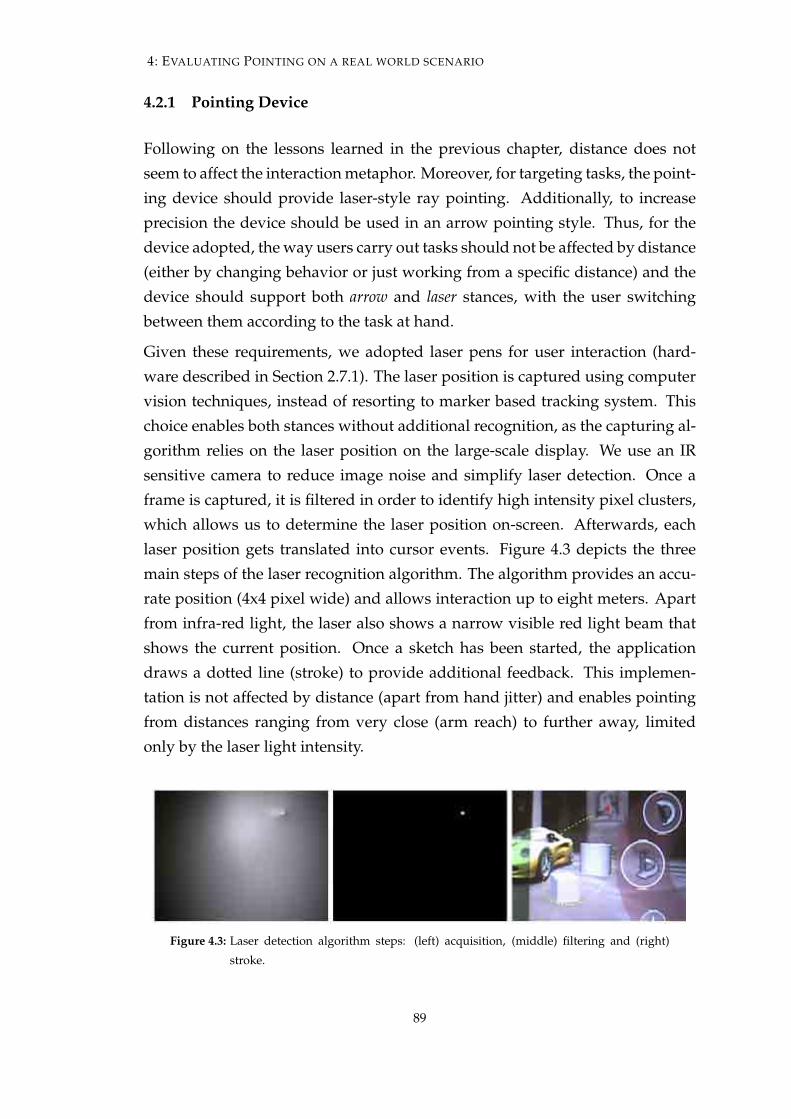
4: EVALUATING POINTING ON A REAL WORLD SCENARIO
4.2.1 Pointing Device
Following on the lessons learned in the previous chapter, distance does notseem to affect the interaction metaphor. Moreover, for targeting tasks, the point-ing device should provide laser-style ray pointing. Additionally, to increaseprecision the device should be used in an arrow pointing style. Thus, for thedevice adopted, the way users carry out tasks should not be affected by distance(either by changing behavior or just working from a specific distance) and thedevice should support both arrow and laser stances, with the user switchingbetween them according to the task at hand.
Given these requirements, we adopted laser pens for user interaction (hard-ware described in Section 2.7.1). The laser position is captured using computervision techniques, instead of resorting to marker based tracking system. Thischoice enables both stances without additional recognition, as the capturing al-gorithm relies on the laser position on the large-scale display. We use an IRsensitive camera to reduce image noise and simplify laser detection. Once aframe is captured, it is filtered in order to identify high intensity pixel clusters,which allows us to determine the laser position on-screen. Afterwards, eachlaser position gets translated into cursor events. Figure 4.3 depicts the threemain steps of the laser recognition algorithm. The algorithm provides an accu-rate position (4x4 pixel wide) and allows interaction up to eight meters. Apartfrom infra-red light, the laser also shows a narrow visible red light beam thatshows the current position. Once a sketch has been started, the applicationdraws a dotted line (stroke) to provide additional feedback. This implemen-tation is not affected by distance (apart from hand jitter) and enables pointingfrom distances ranging from very close (arm reach) to further away, limitedonly by the laser light intensity.
Figure 4.3: Laser detection algorithm steps: (left) acquisition, (middle) filtering and (right)
stroke.
89
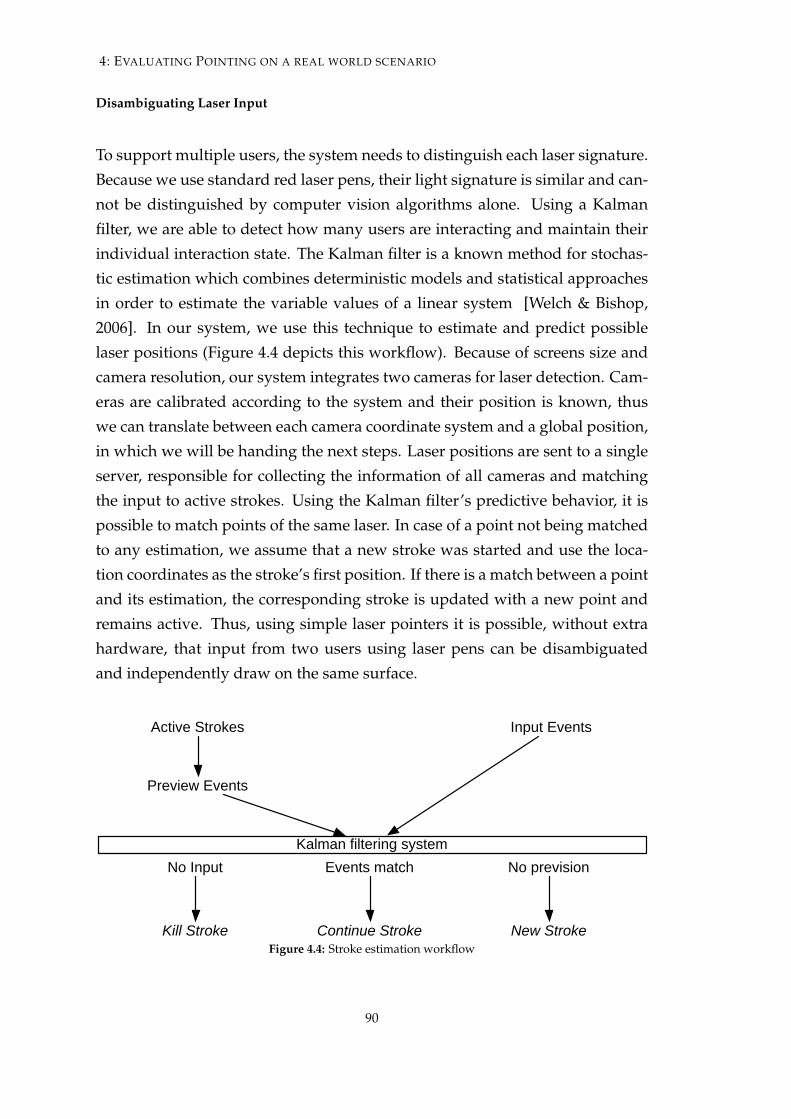
4: EVALUATING POINTING ON A REAL WORLD SCENARIO
Disambiguating Laser Input
To support multiple users, the system needs to distinguish each laser signature.Because we use standard red laser pens, their light signature is similar and can-not be distinguished by computer vision algorithms alone. Using a Kalmanfilter, we are able to detect how many users are interacting and maintain theirindividual interaction state. The Kalman filter is a known method for stochas-tic estimation which combines deterministic models and statistical approachesin order to estimate the variable values of a linear system [Welch & Bishop,2006]. In our system, we use this technique to estimate and predict possiblelaser positions (Figure 4.4 depicts this workflow). Because of screens size andcamera resolution, our system integrates two cameras for laser detection. Cam-eras are calibrated according to the system and their position is known, thuswe can translate between each camera coordinate system and a global position,in which we will be handing the next steps. Laser positions are sent to a singleserver, responsible for collecting the information of all cameras and matchingthe input to active strokes. Using the Kalman filter’s predictive behavior, it ispossible to match points of the same laser. In case of a point not being matchedto any estimation, we assume that a new stroke was started and use the loca-tion coordinates as the stroke’s first position. If there is a match between a pointand its estimation, the corresponding stroke is updated with a new point andremains active. Thus, using simple laser pointers it is possible, without extrahardware, that input from two users using laser pens can be disambiguatedand independently draw on the same surface.
Active Strokes Input Events
Preview Events
Kalman filtering systemNo Input No previsionEvents match
Kill Stroke New StrokeContinue Stroke
Figure 4.4: Stroke estimation workflow
90

4: EVALUATING POINTING ON A REAL WORLD SCENARIO
4.2.2 Speech
Speech recognition uses Microsoft Speech SDK, trained for a number of com-mands to enhance laser interaction with direct commands such as "Hide This"and in combination with body gestures. Recognition rate was around 90% forBritish native speakers. The recognizer used was configured for british accentwhich posed problems for other accents, for example, a Scottish accent reducedthe speech recognition rate down to around 75%.
4.2.3 Handheld Device
The post-it metaphor was largely mentioned whenever the annotations werediscussed during user interviews. This metaphor is available on the GUI – bywriting an annotation and dragging it to the desired location. To increase an-notation drawing resolution, a handheld device was used to simulate physicalpost-it notes. Users can sketch on a handheld device, or choose a picture, andthen using the laser point to the large-scale display position where they wantan annotation to appear (see Figure 4.5).
Figure 4.5: Handheld device metaphor example.
91

4: EVALUATING POINTING ON A REAL WORLD SCENARIO
4.2.4 Body Tracking
This component resorts to IR cameras which track parts of the body using mark-ers. For instance, using arm gestures users can navigate and edit objects. Thesedifferent modes are activated using a speech command, after which the usercan control the action using motions depicted on Figure 4.6. Our tracking setupuses four cameras with infra-red sources to capture reflective markers. To cap-ture arm gestures, users wear markers on each wrist and shoulder. The infor-mation provided by each maker position allows us to compute the geometricalrelationship between hands and shoulders. In this way, we are able to recognizedifferent postures and the corresponding gestures.
Figure 4.6: (Top row) Controlling fly mode. (Bottom row) Moving or scaling objects.
4.3 User Interface
Our approach uses laser pens to interact with the large-scale display, usingstrokes to activate interface elements, select objects or invoke menus. A strokeis a sequence of points that define a geometric shape such as lines, curves, cir-cles, laces, as depicted on Figure 4.7. These shapes can represent any number ofinteraction functionalities, such as selecting objects inside the circle or deletingan object crossed by a line.
4.3.1 Activating interface elements using strokes
Clickable desktop interface widgets such as buttons and menus assume thatusers can click to activate them. However, our laser pointers have no extrahardware for this function. We devised a basic set of widgets that are activated
92
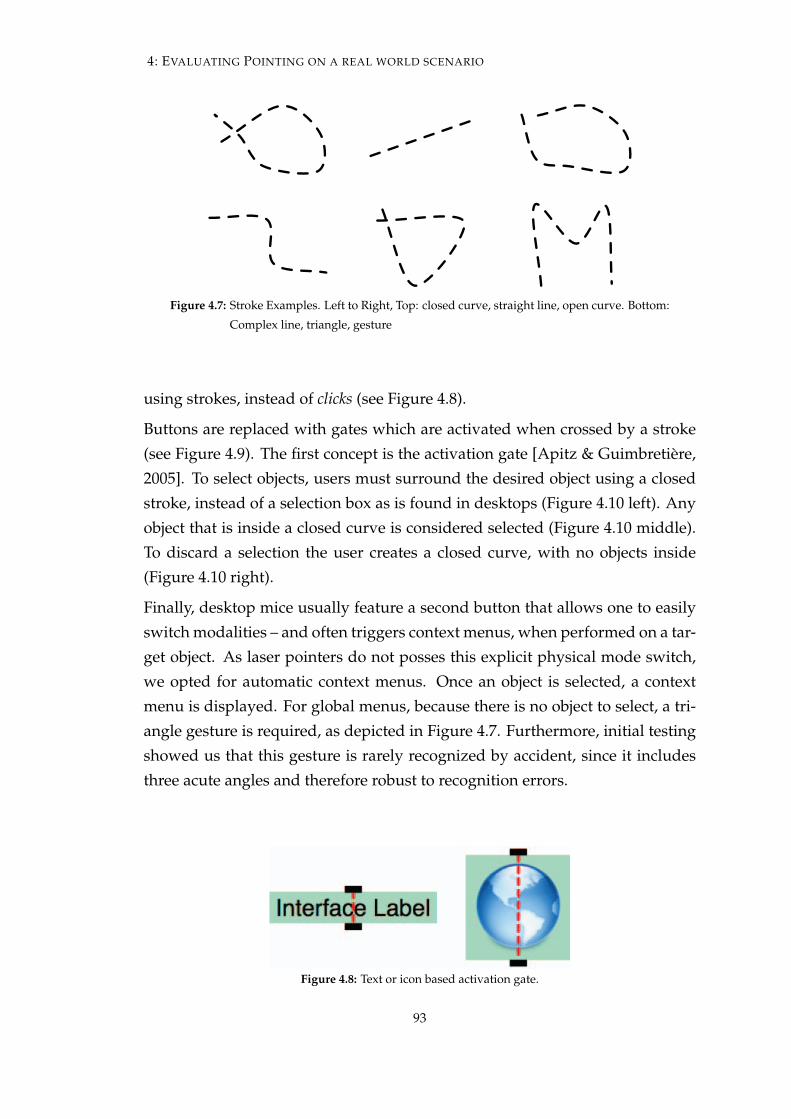
4: EVALUATING POINTING ON A REAL WORLD SCENARIO
Figure 4.7: Stroke Examples. Left to Right, Top: closed curve, straight line, open curve. Bottom:
Complex line, triangle, gesture
using strokes, instead of clicks (see Figure 4.8).
Buttons are replaced with gates which are activated when crossed by a stroke(see Figure 4.9). The first concept is the activation gate [Apitz & Guimbretière,2005]. To select objects, users must surround the desired object using a closedstroke, instead of a selection box as is found in desktops (Figure 4.10 left). Anyobject that is inside a closed curve is considered selected (Figure 4.10 middle).To discard a selection the user creates a closed curve, with no objects inside(Figure 4.10 right).
Finally, desktop mice usually feature a second button that allows one to easilyswitch modalities – and often triggers context menus, when performed on a tar-get object. As laser pointers do not posses this explicit physical mode switch,we opted for automatic context menus. Once an object is selected, a contextmenu is displayed. For global menus, because there is no object to select, a tri-angle gesture is required, as depicted in Figure 4.7. Furthermore, initial testingshowed us that this gesture is rarely recognized by accident, since it includesthree acute angles and therefore robust to recognition errors.
Figure 4.8: Text or icon based activation gate.
93
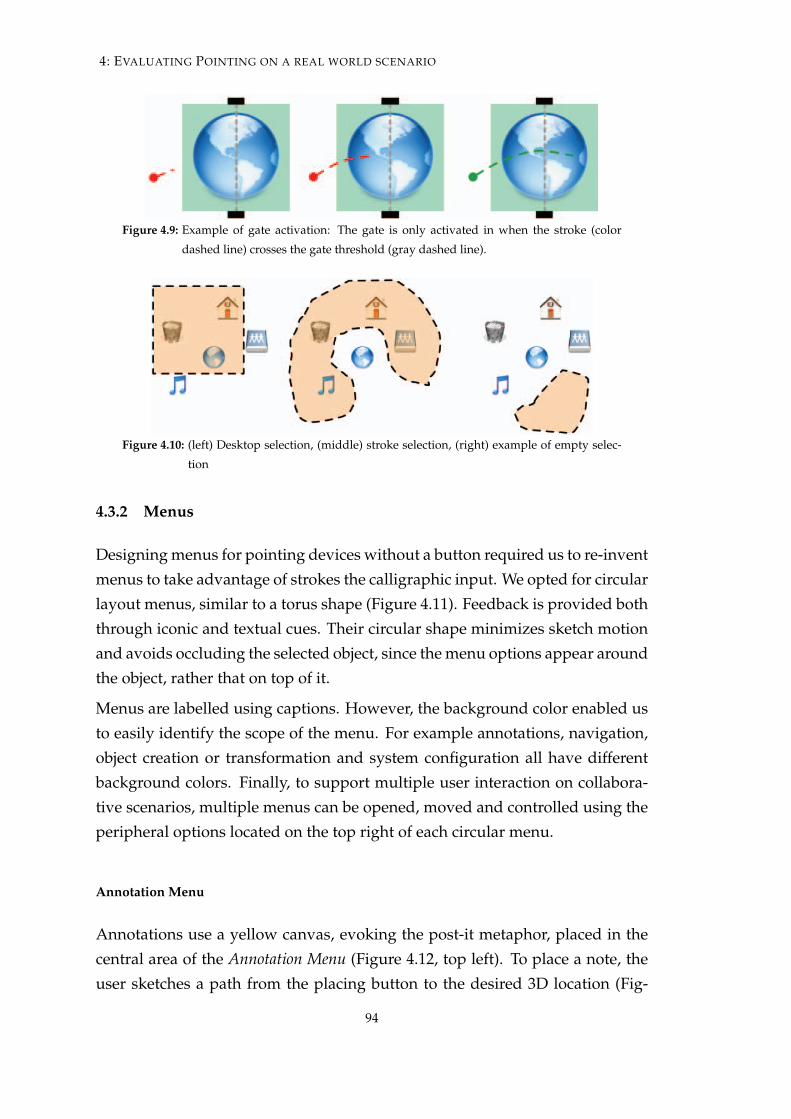
4: EVALUATING POINTING ON A REAL WORLD SCENARIO
Figure 4.9: Example of gate activation: The gate is only activated in when the stroke (color
dashed line) crosses the gate threshold (gray dashed line).
Figure 4.10: (left) Desktop selection, (middle) stroke selection, (right) example of empty selec-
tion
4.3.2 Menus
Designing menus for pointing devices without a button required us to re-inventmenus to take advantage of strokes the calligraphic input. We opted for circularlayout menus, similar to a torus shape (Figure 4.11). Feedback is provided boththrough iconic and textual cues. Their circular shape minimizes sketch motionand avoids occluding the selected object, since the menu options appear aroundthe object, rather that on top of it.
Menus are labelled using captions. However, the background color enabled usto easily identify the scope of the menu. For example annotations, navigation,object creation or transformation and system configuration all have differentbackground colors. Finally, to support multiple user interaction on collabora-tive scenarios, multiple menus can be opened, moved and controlled using theperipheral options located on the top right of each circular menu.
Annotation Menu
Annotations use a yellow canvas, evoking the post-it metaphor, placed in thecentral area of the Annotation Menu (Figure 4.12, top left). To place a note, theuser sketches a path from the placing button to the desired 3D location (Fig-
94
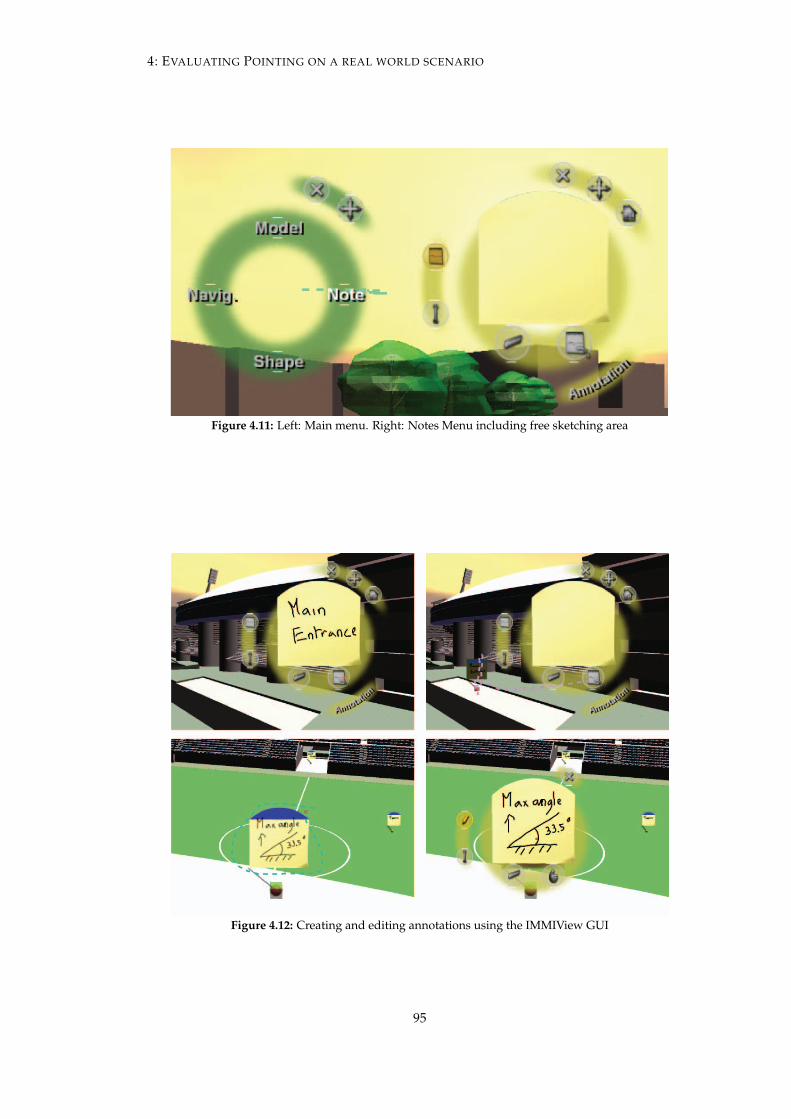
4: EVALUATING POINTING ON A REAL WORLD SCENARIO
Figure 4.11: Left: Main menu. Right: Notes Menu including free sketching area
Figure 4.12: Creating and editing annotations using the IMMIView GUI
95
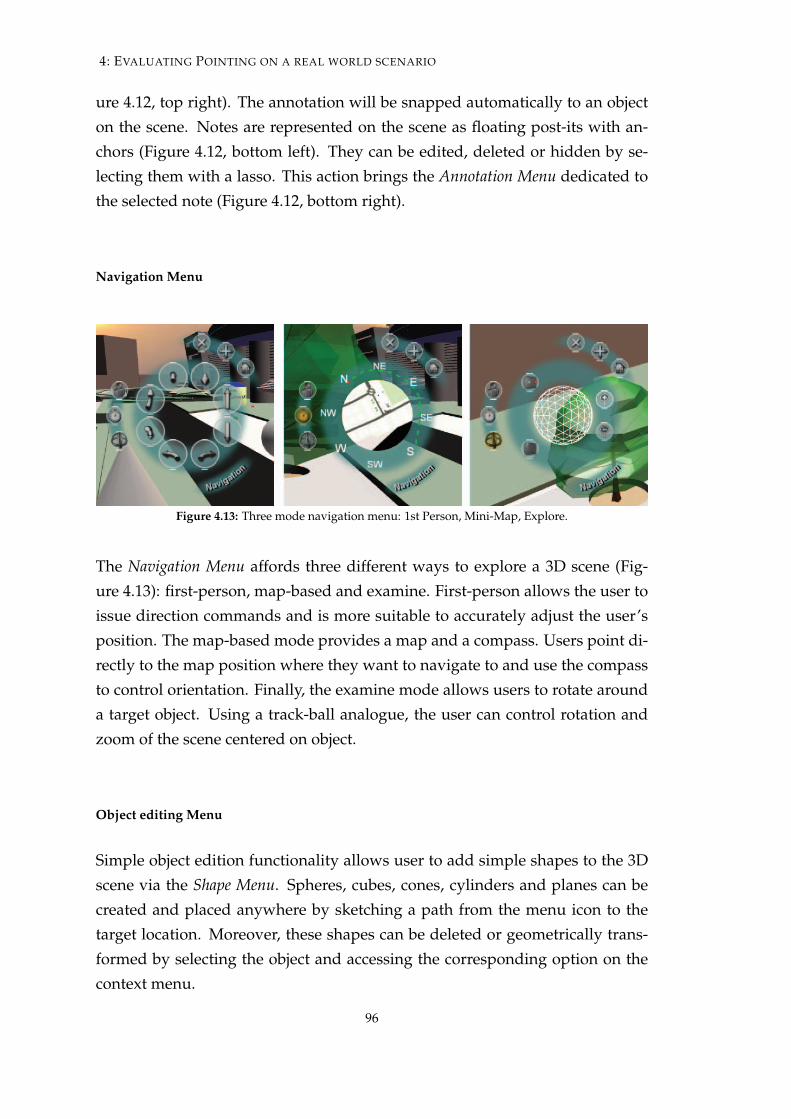
4: EVALUATING POINTING ON A REAL WORLD SCENARIO
ure 4.12, top right). The annotation will be snapped automatically to an objecton the scene. Notes are represented on the scene as floating post-its with an-chors (Figure 4.12, bottom left). They can be edited, deleted or hidden by se-lecting them with a lasso. This action brings the Annotation Menu dedicated tothe selected note (Figure 4.12, bottom right).
Navigation Menu
Figure 4.13: Three mode navigation menu: 1st Person, Mini-Map, Explore.
The Navigation Menu affords three different ways to explore a 3D scene (Fig-ure 4.13): first-person, map-based and examine. First-person allows the user toissue direction commands and is more suitable to accurately adjust the user’sposition. The map-based mode provides a map and a compass. Users point di-rectly to the map position where they want to navigate to and use the compassto control orientation. Finally, the examine mode allows users to rotate arounda target object. Using a track-ball analogue, the user can control rotation andzoom of the scene centered on object.
Object editing Menu
Simple object edition functionality allows user to add simple shapes to the 3Dscene via the Shape Menu. Spheres, cubes, cones, cylinders and planes can becreated and placed anywhere by sketching a path from the menu icon to thetarget location. Moreover, these shapes can be deleted or geometrically trans-formed by selecting the object and accessing the corresponding option on thecontext menu.
96
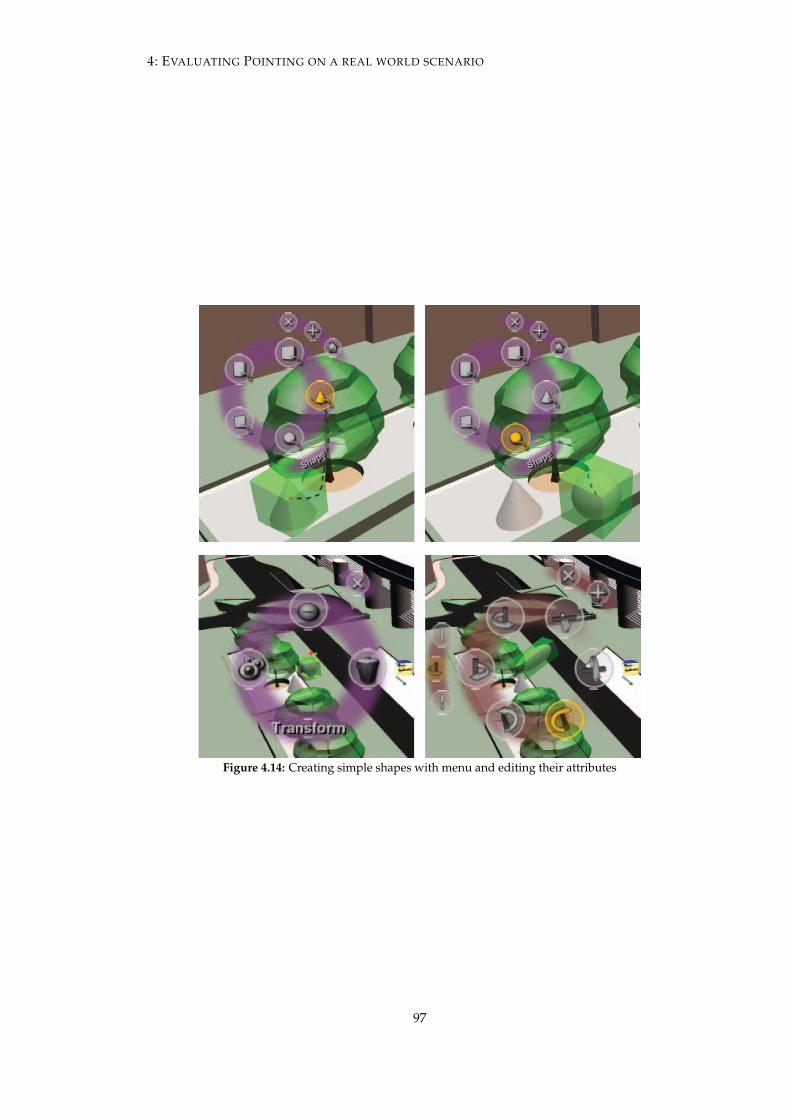
4: EVALUATING POINTING ON A REAL WORLD SCENARIO
Figure 4.14: Creating simple shapes with menu and editing their attributes
97

4: EVALUATING POINTING ON A REAL WORLD SCENARIO
4.4 User Tests
To validate our approach, the prototype was evaluated by expert users (archi-tects). In this section we describe the user tests and discuss how the pointinginteraction techniques affected user performance in this real world scenario.
4.4.1 Apparatus
The tests were conducted in a controlled environment. The large-scale display,depicted in Figure 4.15, is comprised of a 4x3 projector array with a total resolu-tion of 4096x2304 pixels over a physical area measuring 4 x 2.25 square metersand located 30 cm above the floor plane. Subjects were given a starting positiontwo meters orthogonal front, and facing, the center of the display. Participantswere free to physically move in a 4x5 square meters interaction area, which al-lowed participants to select between interaction distances ranging from close(touching the display with the laser pen) to up to five meters from the screen(long distance pointing). Gestural input was captured in a 2x2 square meterarea, due to marker tracking limitations. The area were body gestures were rec-ognized was aligned with the display and located at one meter apart from thedisplay plane.
Figure 4.15: Two users collaborating on a large-scale Display.
98
4: EVALUATING POINTING ON A REAL WORLD SCENARIO
As described in Section 4.2, we implemented pointing with a laser pen, withan on/off button. Speech was provided using a microphone earpiece, and ges-tures were recognized using a OptiTrack maker tracking system. Subjects weretagged with reflective markers in wrists and shoulders and gestures were cap-tured at a 60 hz rate. Subjects were instructed that they could remove the mi-crophone and infra-red markers, if they felt discomfort or fatigue. Software ranon a Pentium 4 running Windows XP. Both image and input were refreshed ata rate above 50Hz.
4.4.2 Participants
The tests included 22 subjects, nine female and 13 male, ranging from 22 yearsup to 45 years old with an average of 33 years. Subjects were all expert domainusers, architects whose job description include client presentations and designreview meetings with fellow architects. All subjects, except two, had no pre-vious experience with interactive large-scale displays. All of the subjects werecomfortable with laser pens, and had previously used those in presentations.While subjects were aware of speech interfaces, none had experience with mul-timodal speech and pointing devices. Four users were familiar with gesturalcontrollers such as Wiimote, but not within a large-scale display scenario.
4.4.3 Procedure and Design
Subjects were presented with a document that included a user manual explain-ing the interface, and a consent form. Before executing any task, subjects filledout a initial questionnaire to capture their profile. Afterwards, subjects wereshown the interface by an HCI expert and experimented with the system forup to 15 minutes. They were then presented with the three input methods:pointing, speech, and gestures and instructed that they could opt for whatevermethod they felt was better suited for the task on hand. Users were not in-structed regarding ideal interaction distance or optimal pointing stance.
When subjects felt comfortable with the system, evaluation tasks would begin.Each session included three single-user tasks and one multi-user collaborativetask, to be executed with a HCI expert. Single user tasks were designed withdifferent degrees of difficulty. The first one comprised two easy steps relatedto navigation, creating and editing annotations. The second one included four
99

4: EVALUATING POINTING ON A REAL WORLD SCENARIO
medium difficulty subtasks including navigation, creating, selecting and ma-nipulating notes and 3D objects. Finally, the third task added seven more spe-cific steps such as geometric transformations to 3D objects including scaling,rotation and translation. For the collaborative task, subjects were required toexecute four medium subtasks. It was up to the subject to decide how theywould split the actions between the two. To conclude, we asked subjects torevisit the third task and requested that they used a different interface (e.g., ifthey used laser to navigate, then they should use gestures). Next, after conduct-ing the tasks, users were debriefed and asked to rate the interaction techniquesthrough a final questionnaire.
4.4.4 Measures and Analysis Methodology
The data collected during the user tests come from different sources, theseinclude a usability questionnaire given to each user based on the standard-ized ISONORM 9241 Part 10, technical logs representing the laser position andmovement during tasks, feedback from user comments, experts observationtask notes and video analysis.
The standardized ISONORM 9241 - Part 10 (Ergonomic requirements for officework with visual display terminals) provides requirements and recommenda-tions related to the hardware, software and environment attributes that con-tribute to usability and the ergonomic principles underlying them. Throughthe usage of questionnaires, the goal was to obtain feedback from the users ex-perience related to the following seven principals of this standard: (1) Suitabil-ity for the task, (2) Self descriptiveness, (3) Controllability, (4) Conformity withuser expectations, (5) Error tolerance, (6) Suitability for individualization and(7) Suitability for learning. Users were asked to rate each question from 1 (theleast favorable case) to 6 (the most favorable case). The results are presented inthe Table 4.1.
4.4.5 Results
Except for error tolerance, all other principles are above the mean value of 3.5.Even though standard deviation values are relatively high, in general the sys-tem seemed suited to the tasks tested (Suitability for the task: 4.49, Conformitywith user expectations: 4.27). Users found the system easy to understand (Self
100
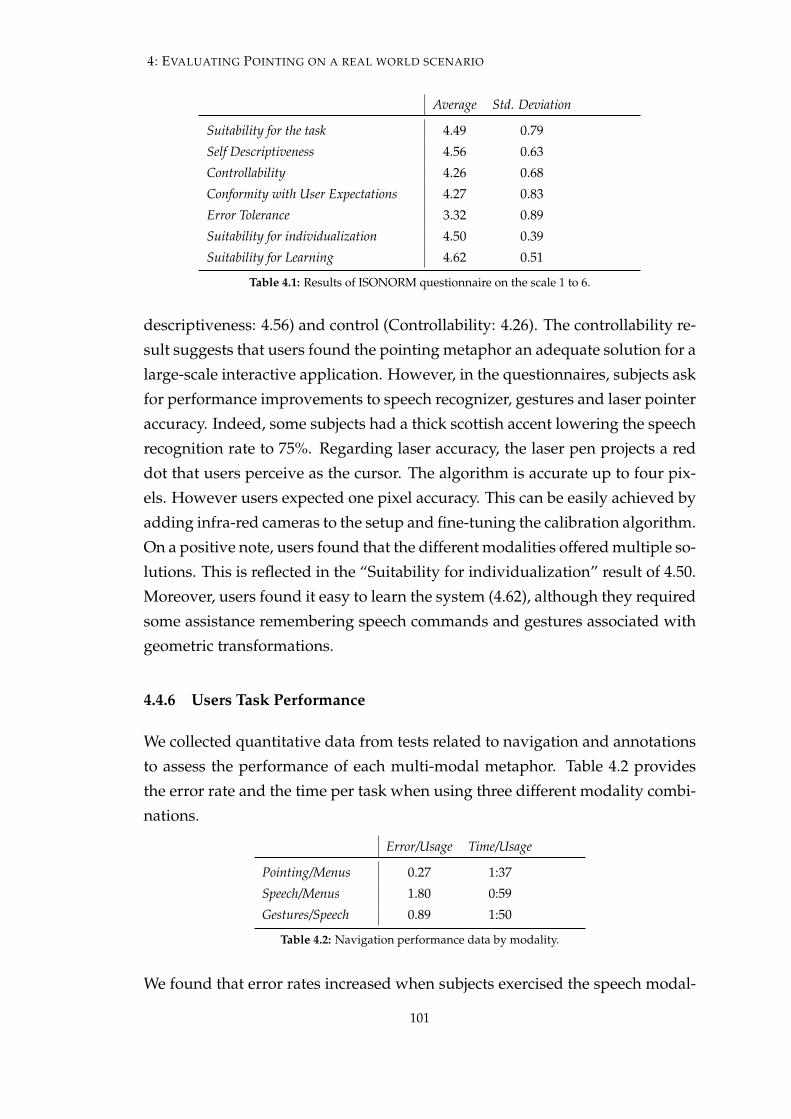
4: EVALUATING POINTING ON A REAL WORLD SCENARIO
Average Std. Deviation
Suitability for the task 4.49 0.79Self Descriptiveness 4.56 0.63Controllability 4.26 0.68Conformity with User Expectations 4.27 0.83Error Tolerance 3.32 0.89Suitability for individualization 4.50 0.39Suitability for Learning 4.62 0.51
Table 4.1: Results of ISONORM questionnaire on the scale 1 to 6.
descriptiveness: 4.56) and control (Controllability: 4.26). The controllability re-sult suggests that users found the pointing metaphor an adequate solution for alarge-scale interactive application. However, in the questionnaires, subjects askfor performance improvements to speech recognizer, gestures and laser pointeraccuracy. Indeed, some subjects had a thick scottish accent lowering the speechrecognition rate to 75%. Regarding laser accuracy, the laser pen projects a reddot that users perceive as the cursor. The algorithm is accurate up to four pix-els. However users expected one pixel accuracy. This can be easily achieved byadding infra-red cameras to the setup and fine-tuning the calibration algorithm.On a positive note, users found that the different modalities offered multiple so-lutions. This is reflected in the “Suitability for individualization” result of 4.50.Moreover, users found it easy to learn the system (4.62), although they requiredsome assistance remembering speech commands and gestures associated withgeometric transformations.
4.4.6 Users Task Performance
We collected quantitative data from tests related to navigation and annotationsto assess the performance of each multi-modal metaphor. Table 4.2 providesthe error rate and the time per task when using three different modality combi-nations.
Error/Usage Time/Usage
Pointing/Menus 0.27 1:37Speech/Menus 1.80 0:59Gestures/Speech 0.89 1:50
Table 4.2: Navigation performance data by modality.
We found that error rates increased when subjects exercised the speech modal-
101

4: EVALUATING POINTING ON A REAL WORLD SCENARIO
ity, which can be explained by the failures of the speech recognizer system toidentify commands. On the other hand, speech interaction shows a significantspeed up when opening menus; when the speech command was correctly rec-ognized, the time to activate the corresponding commands was very short.
Compared to pointing, subjects needed slightly more time to accomplish thesame task with gestures. Moreover, gestures exhibited a higher error rate. Thissuggests that the users spent more cognitive resources to adjust their positionand orientation when using gestures for navigation. The results show that therewere less errors using the pointing modality. This might be because users havemore experience with pointing devices.
Error/Usage Time/Usage
Pointing/Menus 0.00 00:30Pointing/Speech 0.84 0:51
Table 4.3: Annotation performance data by modes.
For annotation tasks, Table 4.3 provides the error rate and the time requiredwhen using each multimodal combination. Although the speech modality waschosen primarily by all users (see Table 4.5), the error rate and time requiredwere higher than pointing. In fact, pointing exhibited no errors during ourtests. The errors incurred when using speech commands were due faulty recog-nitions.
4.4.7 Multi-modal Preferences for user tasks
Throughout the experiment, subjects could interact with the system using dif-ferent modalities and were free to select the modality they felt was better suitedto the task. Next, we present user preferences for navigation, annotations andgeometric transformations.
Navigation
Table 4.4 shows modalities sorted by user preference. From it, we concludethat participants used different combinations of modalities to perform the sametask. The first choice is balanced among the three different combinations, whichillustrates the system flexibility in accommodating user preferences. Whenusers chose a second combination of modalities (40% of users chose a secondoption), a slight majority (54.55%) opted for the pointing modality.
102
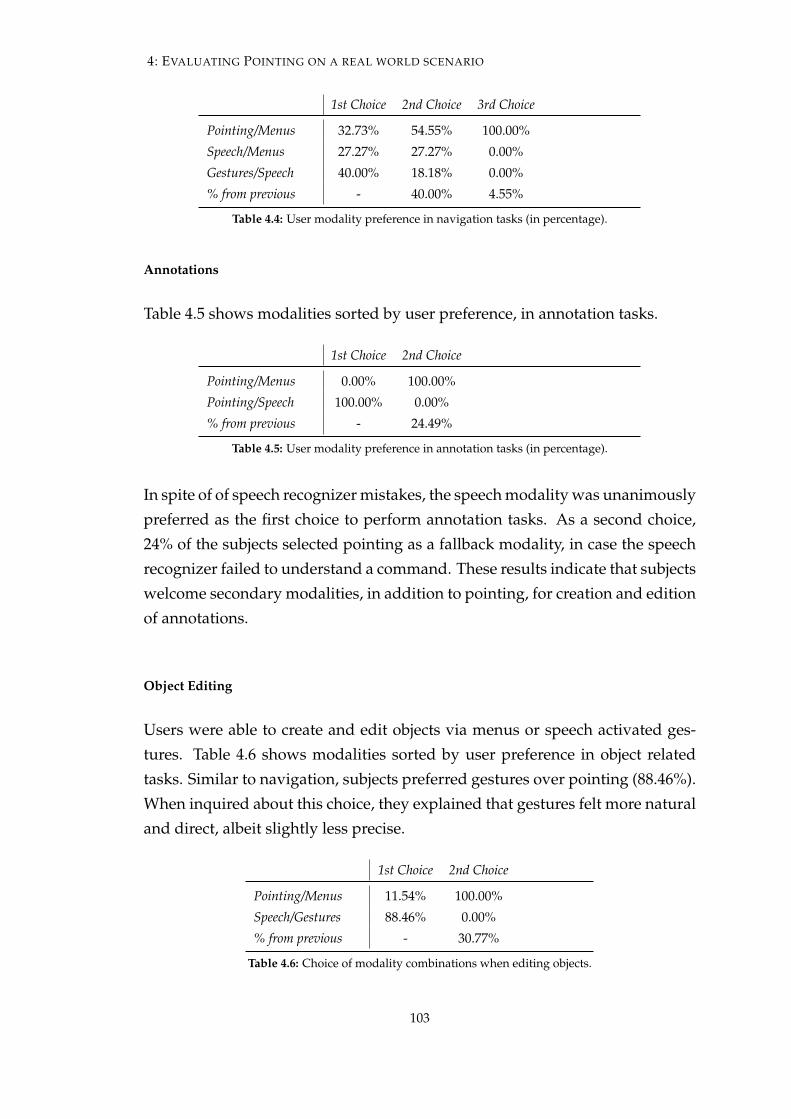
4: EVALUATING POINTING ON A REAL WORLD SCENARIO
1st Choice 2nd Choice 3rd Choice
Pointing/Menus 32.73% 54.55% 100.00%Speech/Menus 27.27% 27.27% 0.00%Gestures/Speech 40.00% 18.18% 0.00%% from previous - 40.00% 4.55%
Table 4.4: User modality preference in navigation tasks (in percentage).
Annotations
Table 4.5 shows modalities sorted by user preference, in annotation tasks.
1st Choice 2nd Choice
Pointing/Menus 0.00% 100.00%Pointing/Speech 100.00% 0.00%% from previous - 24.49%
Table 4.5: User modality preference in annotation tasks (in percentage).
In spite of of speech recognizer mistakes, the speech modality was unanimouslypreferred as the first choice to perform annotation tasks. As a second choice,24% of the subjects selected pointing as a fallback modality, in case the speechrecognizer failed to understand a command. These results indicate that subjectswelcome secondary modalities, in addition to pointing, for creation and editionof annotations.
Object Editing
Users were able to create and edit objects via menus or speech activated ges-tures. Table 4.6 shows modalities sorted by user preference in object relatedtasks. Similar to navigation, subjects preferred gestures over pointing (88.46%).When inquired about this choice, they explained that gestures felt more naturaland direct, albeit slightly less precise.
1st Choice 2nd Choice
Pointing/Menus 11.54% 100.00%Speech/Gestures 88.46% 0.00%% from previous - 30.77%
Table 4.6: Choice of modality combinations when editing objects.
103

4: EVALUATING POINTING ON A REAL WORLD SCENARIO
4.5 Observations
Questionnaire results suggest that users are comfortable with pointing as an in-teraction metaphor and like a multi-modal interface which provides redundanttechniques for the same tasks. Indeed, despite admitting a strong preference forthe first and second modalities, users switched between modalities accordinglyto the task at hand. Throughout the remainder of this section we discuss ourobservations and draw conclusions based on the test results.
Pointing
Although not being the primary choice for all tasks, pointing showed satis-factory results as it yields less errors than the other modalities tested. Fromresponses to questionnaires, we understand that pointing is a suitable modal-ity to operate large-scale displays, since it fits better within the expectations ofarchitects for a presentation/meeting scenario, as pointing devices are familiartools in such contexts.
Error tolerance is an important metric for real world applications. When we an-alyze our results from this perspective we realize that further work is requiredto improve the system robustness. In particular, pointing shows promising re-sults, since it exhibits virtually no errors and provides a high accuracy in bothnavigation and annotation tasks. Moreover, pointing suited users in need of acalligraphic tool for collaboratively annotating content on 3D scenes displayedon a large-scale display. On the other hand, speech commands are still a sourceof errors, due to a recognition rate of the recognizer. However, spoken com-mands are valuable shortcuts for navigation tasks, as tests revealed.
For navigation and object editing tasks, users selected other modalities thanpointing as first choices. However, users still manifested appreciation for point-ing, as a relevant fallback metaphor. Indeed, during tests we observed thatsubjects used both modalities to carry out tasks. For example, several subjectsused gestures, to fly to a position close to the target, and switched to pointing tofine-tune both position and camera orientation. When pointing was chosen asthe primary interaction technique, as in annotation tasks, the majority of usersonly expressed a need for an alternative technique if the first would fail. Thisclearly denotes how comfortable users felt with pointing devices.
104

4: EVALUATING POINTING ON A REAL WORLD SCENARIO
User Preference for Gestures over Pointing
For navigation and object editing, it is clear that results show a tendency to-wards more direct metaphors, such as gestures accompanied by speech com-mands, instead of pointing. This is somewhat congruent with the benefits ofdirect versus indirect control [Schmidt et al. , 2009], as users believe that ges-tures seem more natural if they are executed directly on 3D objects – e.g., a userwould prefer to scale an object by issuing a spoken speech command and con-trolling the intensity with a continuous two-arm gesture, rather than pointingto activate a menu option.
User Position, Control Type, and Parallax
Through the laser pen, our implementation provided a simple control device tosupport interaction across multiple distances. Based on the results from Chap-ter 3, the pointing device should support multiple stances. Indeed, during usertests, we observed three main stances that corroborate these results. We wereable to observe laser stance during object selection, arrow during gate activa-tion, and users holding the laser pen as a whiteboard marker (similar to thegrab metaphor) while writing annotations.
Pointing stances were strongly linked to changes in task and, in the case of an-notations, user position. That is, when we asked users to navigate to a targetposition and create annotations, they would navigate using a laser stance fromtheir current position, approach the display, switch to a whiteboard stance, andcreate the annotation. When asked why they changed their behavior, usersclaim they were not comfortable either drawing or writing annotations at a dis-tance. This seems to indicate that users naturally adopt the most advantageousmode afforded by the device, suggesting that for annotation tasks there is anoptimal interaction distance (close to the display).
Taking into account angles when modeling targeting
The interface design supports menus that open and can manually be moved toany position. When performing tasks, the majority of subjects opened or movedmenus to a position in front of them. Moreover, subjects would only move themenu to peripheral positions when they required an obstructed view (for ex-ample when selecting multiple objects). Whenever a menu was no longed re-
105

4: EVALUATING POINTING ON A REAL WORLD SCENARIO
quired, most users closed it, instead of moving it to another position. Duringcollaborative review, this behavior can be attributed to a sense of possession.However during single user tasks, such is not the case and therefore we con-clude that users were aware that interacting with objects at an angle was lessconvenient than interacting with objects placed in front of them.
Summary
In this chapter we apply our lessons learnt and guidelines of pointing, as aninteraction technique, to a collaborative design review application in a multi-modal framework, and include secondary modalities, such as speech and ges-tures. We support passive, clickless interaction devices such as laser pointers, tomake the setup simple and accessible from the non-technical user side. Basedon the guidelines elaborated in chapter 3, we developed a graphical user inter-face centered around pointing as an interaction enabler for large scale displays.To this end, the whole graphical user interface framework resorted to strokes asan activation method instead of clicks. We strove to make all modalities almostequally accessible to users so they could write annotations, select objects, drawand open menus using either pointing, speech, or gestures. We conducted userstudies to observe how architects would use pointing to execute design reviewtasks and we were able to assess how our guidelines could positively affect thearchitecture of a less contrived application that pure laboratory settings wouldallow.
106
5Conclusions
Our work focused on interaction with large-scale displays, in particular in un-derstanding the effect of user position on ray-pointing techniques for large-scale displays. Towards that end, we conducted two studies. In the first study,we tested three metaphors at three different distances and found that distanceto the display does not seem to directly affect interaction. However, we foundthat the metaphor used has a correlation with the interaction performance.Having obtained these results, we conducted a second user study to understandwhat factors affect the interaction metaphor. Moreover, we now focused on ray-pointing, the technique that showed the best promise from the first study. Also,given the initial results that distance does not seem to affect interaction, insteadof testing multiple distances we position users to the left of a large-scale dis-play. In this second study, our goal was to better understand how metaphorsare affected and to see if target position, as related to user position, affects in-teraction. We found that control type, one of the factors tested, affects targetingand that target position affects tracing tasks.
We followed the user studies with an application of pointing, as an interactiontechnique, for a design review application. The prototype included pointing asa the primary modality and secondary modalities such as speech and gestures
107
5: CONCLUSIONS
in a multi-modal setting. Based on the guidelines presented in Chapter 3, wedeveloped a graphical user interface based on pointing interaction for large-scale displays. The graphical user interface used strokes, instead of clicks, whichmade the prototype easier to use with passive pointing devices by allowingusers to select, write, draw and open menus using pointing, speech, or ges-tures. Further user studies allowed us to observe how architects use pointingto perform design review tasks, and we were able to observe how the guide-lines would affect a real-word application. The experimental results gatheredprovided us with valuable feedback regarding the validity of our approach.From these results we were able not only to confirm the value of our contribu-tions, but also to identify the limitations of our approach. In this section we willpresent and discuss both.
5.1 Contributions
Human factors research that focuses on large-scale displays is still in its in-fancy. We contribute to the community by presenting user studies on large-scale display interaction that add to the knowledge base and by evaluating thatcontribution on a real-world scenario that took into consideration the previousfindings. This allowed us to make educated choices when adopting an inputdevice, devising interaction metaphors, and designing the user interface. Thiswill provide practitioners with theoretical contributions that state what factorsshould be taken into account when designing interfaces for large-scale displaysand practical examples of how those lessons can be applied.
5.2 Limitations
The narrow focus of a Phd dissertation introduced natural limitations. Thework presented aims at a single, very specific objective. Without affecting thevalidity of the research presented, it is important not only to identify our con-tributions but also to frame the work presented and identify some of its limita-tions.
Our research provided more depth than breath. Although we set out to studyinteraction on large scale displays, our results hinge on vertical large-scale dis-plays. Although there will be some similarities, nothing can be said about the
108
5: CONCLUSIONS
applicability of our results to tabletops or even CAVE displays.
Another limitation is that, although pointing is a popular interaction technique,other metaphors exist and should be examined from a human factors point ofview. It remains to be seen whether the human factors tested here apply toother metaphors such as gestures or handheld device interaction.
We tested distances according to proxemics spaces and our results show thatdistance does not affect interaction. However, we have no proof that the resultsstill hold, if users interact at distances further away than the ones tested. How-ever, based on the literate surveyed [Greenberg et al. , 2011; Myers et al. , 2002;Vogel & Balakrishnan, 2004], this is not a likely scenario and rarely will usersinteract, using pointing devices, from distances farther that the ones tested.
Although multiple users are supported by the real-world application, our stud-ies did not take into account variables that multiple users introduce. Indeed,parameters such as occlusion, personal space versus public spaces, ownershipof information, to name a few, will surely affect the way people interact andhow information is displayed. Although we do not foresee that our results be-come invalid in multiple user scenarios, these bring forth a complexity that isbeyond the scope of this dissertation.
5.3 Other work produced
During the execution of the body of work presented, other works were alsodeveloped and published. For various reasons, they do not fit the flow of thisdocument but are an important part of the process that concluded with thisdocument. Therefore, we present a brief abstract of three main contributionsthat were not detailed here.
5.3.1 MAXIMUS project
MAXMUS is a FP7 European research project which aims to improve the de-sign review process within automotive and architectural design through dra-matically improved rendering and interaction technologies1. Over three years(between 2008 and 2011) the consortium, lead by the Fraunhofer institute, de-veloped a system that compliments the way designers work and collaborate,
1http://maximus-fp7.eu/
109
5: CONCLUSIONS
by taking advantage of high dynamic range based rendering and novel interac-tion techniques. I was main technical researcher and advised the project duringthe three years of execution in which we developed an interactive environmentfor creative industries. In particular, we constructed a multi-touch tabletop (A0size, not available on market), developed a prototype that integrated both verti-cal and horizontal surfaces, and evaluated a 3D interaction device to be utilizedduring design meetings. At the time of the writing a publication was submittedto CHI’11 regarding these advancements.
5.3.2 The continuous interaction space
During my internship in Calgary, in collaboration with Nicolai Marquadt, theContinuous interaction space was researched. This project looks at two modal-ities: 1) direct touch and multi-touch (by hand and by tangibles) directly onthe surface, and 2) hand gestures above the surface, but also at the rich inter-action space between them. The idea is that many interaction techniques canbe developed that go beyond these two modalities, where they can leveragethe space between them. That is, we believe that the underlying system shouldtreat the space on and above the surface as a continuum, where a person canuse touch, gestures, and tangibles anywhere in the space and naturally movebetween them. The project resulted in the following publication:
The continuous interaction space: Interaction techniques unifying touch and gestureon and above a digital surface. N. Marquardt, R. Jota, S. Greenberg, and J. A.Jorge. In Proceedings of the 13th IFIP INTERACT Conference, Lisbon, Portugal,September 2011.
5.3.3 StereoBlocks
The internship at Microsoft Research produced a tabletop side project. The im-mediate availability of depth cameras - not available until 2010 - allows us tocapture object information without the need to resort to simplified object rep-resentations. We combined a depth camera with a 3D projection to implementa modeling application. By treating the camera information in an analog fash-ion, instead of treating it as marker information common in VR applications,we are able to digitize all the details of the real world and re-project objectsside-by-side with real objects. We tried to re-imagine if architects had the ca-
110
5: CONCLUSIONS
pability to construct simple digital models out existing objects lying around,with no trackers, by simply adding their representation to a virtual scene. Thefollowing publication was the result of such project:
Constructing virtual 3D models with physical building blocks. Ricardo Jota andHrvoje Benko. In Proceedings of the 2011 annual conference extended abstractson Human factors in computing systems (CHI EA ’11). ACM, New York, NY,USA, 2173-2178.
5.4 Future Work
The limitations described are good indicators of possible next steps. Althoughit is not within the present research to find an ultimate solution, we believe thatour approach can evolve in those directions. The next paragraphs summarizesome of the possible paths for future work.
5.4.1 Distance
We would like to expand the distances tested, both closer to and farther awayfrom the screen. In particular, studying the distance that blends pointing totouch interfaces seems particularly relevant given the recent interest in multi-touch devices. On the other hand, even though our results conclude that dis-tance does not seem to affect interaction, we would like to understand at whatdistance does pointing stop to be an effective interaction technique.
Other Large-scale Displays Tabletops, in particular, are very in popular within theinteraction community. Therefore, we could argue that the concepts of distance,or ray-pointing as a technique, are relevant for horizontal surfaces [Parker et al. ,2005]. Moreover, the physical affordances of vertical surfaces are very differentfrom those of horizontal surfaces. For example, in horizontal surfaces users canposition tangibles, etc. This might indicate that the lessons learned on our studydo not totally transpose to horizontal surfaces, thus making future studies evenmore important.
111
5: CONCLUSIONS
Non-pointing Metaphors
Pointing is one technique amongst many. We have no information on how ges-tures are affected by field of view, for example. Extending this work to anotherclass of interaction metaphors might present opportunities for interesting find-ings.
Multiple Users
Because of their size, large-scale displays are often used in collaborative work.Indeed, our real world scenario supported multiple users in a collaborative set-ting. This path was not exhausted with this dissertation and further studies aresurely warranted. Pointing is a natural metaphor for human-to-human com-munication and therefore a good candidate for collaborative work studies. Oneexample is how people might use pointing to agree on how to execute a task,such as pin-point a target location on a map visualized on a large-scale display.
Applying lessons learned
Large-scale displays are exiting the academic labs into the real world. Indeed,they see growing use in applications such as targeted interactive advertisement,control rooms, indoor navigation for public spaces, gaming consoles, and oth-ers. Given the wide-spread use of large-scale displays, and new technologiesthat enable pointing without complex gadgets or even hands free methods2, itwould be interesting to conduct a field test for an extended period of time ina non-controlled, public environment, with almost no academic supervision,and compare the performance of pointing with user tests conducted in a con-trolled environment. With the introduction of depth sensing as an input device,and could possibly target thousands of users and provide a exciting avenue forfurther research.
2As of 2011, depth cameras are only recently available as a commodity technology
112

References
Andersen, P. B. 1990. A theory of computer semiotics: semiotic approaches to con-struction and assessment of computer systems. New York, NY, USA: CambridgeUniversity Press.
Apitz, Georg, & Guimbretière, François. 2005. CrossY: a crossing-based draw-ing application. Pages 930–930 of: ACM SIGGRAPH 2005 Papers. SIGGRAPH’05. New York, NY, USA: ACM.
Argelaguet, Ferran, & Andujar, Carlos. 2009. Visual feedback techniques forvirtual pointing on stereoscopic displays. Pages 163–170 of: Proceedings of the16th ACM Symposium on Virtual Reality Software and Technology. VRST ’09.New York, NY, USA: ACM.
Ball, Robert, North, Chris, & Bowman, Doug A. 2007. Move to improve: pro-moting physical navigation to increase user performance with large displays.Pages 191–200 of: CHI ’07: Proceedings of the SIGCHI conference on Human factorsin computing systems. New York, NY, USA: ACM Press.
Baudisch, Patrick, Sinclair, Mike, & Wilson, Andrew. 2006. Soap: a pointingdevice that works in mid-air. Pages 43–46 of: Proceedings of the 19th annualACM symposium on User interface software and technology. UIST ’06. New York,NY, USA: ACM.
Bodker, Susanne. 1990. Through the Interface: A Human Activity Approach to UserInterface Design. Mahwah, NJ, USA: Lawrence Erlbaum Associates, Inc.
Bolt, Richard A. 1980. Put-that-there: Voice and gesture at the graphics inter-face. Pages 262–270 of: SIGGRAPH ’80: Proceedings of the 7th annual conferenceon Computer graphics and interactive techniques. New York, NY, USA: ACMPress.
Bomsdorf, Birgit, & Szwillus, Gerd. 1999. Tool support for task-based user in-terface design - A CHI’99 workshop. SIGCHI Bull., 31(4), 27–29.
113
REFERENCES
Bowman, Doug A., & Hodges, Larry F. 1997. An evaluation of techniquesfor grabbing and manipulating remote objects in immersive virtual environ-ments. Pages 35–ff. of: Proceedings of the 1997 symposium on Interactive 3D graph-ics. I3D ’97. New York, NY, USA: ACM.
Bowman, Doug A., Johnson, Donald B., & Hodges, Larry F. 2001. Testbed Eval-uation of Virtual Environment Interaction Techniques. Presence: Teleoper. Vir-tual Environ., 10(February), 75–95.
Buxton, William, Fitzmaurice, George, Balakrishnan, Ravin, & Kurtenbach,Gordon. 2000. Large Displays in Automotive Design. IEEE Computer Graphicsand Applications, 20, 68–75.
Byrne, M. 2003. Cognitive Architecture.
Cao, Xiang, & Balakrishnan, Ravin. 2003. VisionWand: Interaction Techniquesfor Large Displays using a Passive Wand TRacked in 3D. UIST.
Card, Stuart K., Newell, Allen, & Moran, Thomas P. 1983. The Psychology ofHuman-Computer Interaction. Mahwah, NJ, USA: Lawrence Erlbaum Asso-ciates, Inc.
Cavens, Duncan, Vogt, Florian, Fels, Sidney, & Meitner, Michael. 2002. Interact-ing with the big screen: pointers to ponder. Pages 678–679 of: CHI ’02 extendedabstracts on Human factors in computing systems. CHI EA ’02. New York, NY,USA: ACM.
Cockburn, A., Quinn, P., Gutwin, C., Ramos, G., & Looser, J. 2011. Air pointing:Design and evaluation of spatial target acquisition with and without visualfeedback. International Journal of Human-Computer Studies, 69(6), 401 – 414.
Cohé, Aurélie, Dècle, Fabrice, & Hachet, Martin. 2011. tBox: a 3d transforma-tion widget designed for touch-screens. Pages 3005–3008 of: Proceedings of the2011 annual conference on Human factors in computing systems. CHI ’11. NewYork, NY, USA: ACM.
Davis, J., & Chen, X. 2002. LumiPoint: Multi-User Laser-Based Interaction onLarge Tiled Displays. Displays, 23(5).
de la Hamette, P., Lukowicz, P., G.Tröster, & Svoboda, T. 2002. FingerMouse: AWearable Hand Tracking System. UBICOMP.
114
REFERENCES
de la Rivière, Jean-Baptiste, & Guitton, Pascal. 2003. Hand posture recogni-tion in large display VR environments. In: Proceedings of the 5th InternationalGesture Workshop. Springer.
de la Rivière, Jean-Baptiste, & Guitton, Pascal. 2005. Image-based analysis formodel-based tracking. Mirage, March.
Descartes, René. 1641. Meditationes de prima philosophia, in qua Dei existentia etanimæ immortalitas demonstratur. René Descartes.
Dietz, Paul, & Leigh, Darren. 2001. DiamondTouch: a multi-user touch technol-ogy. Pages 219–226 of: UIST ’01: Proceedings of the 14th annual ACM symposiumon User interface software and technology. New York, NY, USA: ACM Press.
DMX. 2011. webpage: http://dmx.sourceforge.net/.
Fonseca, Manuel J., Pimentel, César, & Jorge, Joaquim A. 2002 (Mar.). CALI:An Online Scribble Recognizer for Calligraphic Interfaces. Pages 51–58 of:Proceedings of the 2002 AAAI Spring Symposium - Sketch Understanding.
Fonseca, Manuel J., Ferreira, Alfredo, & Jorge, Joaquim A. 2005 (August).Generic Shape Classification for Retrieval. In: Proceedings of the 6th. IAPRInternational Workshop on Graphics Recognition(GREC 2005).
Fu, Chi-Wing, Goh, Wooi-Boon, & Ng, Junxiang Allen. 2010. Multi-touch tech-niques for exploring large-scale 3D astrophysical simulations. Pages 2213–2222 of: Proceedings of the 28th international conference on Human factors in com-puting systems. CHI ’10. New York, NY, USA: ACM.
Greenberg, Saul, Marquardt, Nicolai, Ballendat, Till, Diaz-Marino, Rob, &Wang, Miaosen. 2011. Proxemic interactions: the new ubicomp? interactions,18(January), 42–50.
Grossman, Tovi, & Balakrishnan, Ravin. 2005. The bubble cursor: enhancingtarget acquisition by dynamic resizing of the cursor’s activation area. Pages281–290 of: Proceedings of the SIGCHI conference on Human factors in computingsystems. CHI ’05. New York, NY, USA: ACM.
Grubert, Jens, Hanckock, Mark, Carpendale, Sheelagh, Tse, Edward, & Isen-berg, Tobias. 2007 (October). Interacting with Stroke-Based Rendering on a WallDisplay. Tech. rept. 2007-882-34. Department of Computer Science, Universityof Calgary, Canada.
115

REFERENCES
Hall, Edward T. 1990. The Hidden Dimension. Anchor.
Han, Jefferson Y. 2005. Low-cost multi-touch sensing through frustrated totalinternal reflection. Pages 115–118 of: UIST ’05: Proceedings of the 18th annualACM symposium on User interface software and technology. New York, NY, USA:ACM Press.
Harrison, Chris, & Dey, Anind K. 2008. Lean and zoom: proximity-aware userinterface and content magnification. Pages 507–510 of: CHI ’08: Proceeding ofthe twenty-sixth annual SIGCHI conference on Human factors in computing sys-tems. New York, NY, USA: ACM.
Heidegger, Martin. 1979. Sein und Zeit. Tbingen: Niemeyer.
Hill, A., & Johnson, A. 2008. Withindows: A Framework for Transitional Desk-top and Immersive User Interfaces. 3D User Interfaces, 2008 IEEE Symposiumon, March, 3–10.
Hur, Hyejung, Fleisch, Timo, Kim, Taek-Bong, & On, Giwon. 2006. AICI-Advanced Immersive Collaborative Interaction Framework. Pages 20–25 of:Proceedings of the SCCE CAD/CAM Conference : Book of Abstracts & ProceedingsCD-ROM. Pyungchang, Korea: Society of CAD/CAM Engineers (SCCE).
Isenberg, Petra. 2009 (December). Collaborative Information Visualization in Co-located Environments. PhD Thesis, University of Calgary, Calgary, AB, Canada.
ISONorm. 2002. ISO. Iso 9241-9:2000(e): Requirements for non-keyboard input ISO.
Jiang, Hao, Ofek, Eyal, Moraveji, Neema, & Shi, Yuanchun. 2006. Direct Pointer:Direct Manipulation for Large-Display Interaction using Handheld Cameras.CHI.
Jordà, Sergi, Geiger, Günter, Alonso, Marcos, & Kaltenbrunner, Martin. 2007.The reacTable: exploring the synergy between live music performance andtabletop tangible interfaces. Pages 139–146 of: Proceedings of the 1st internationalconference on Tangible and embedded interaction. TEI ’07. New York, NY, USA:ACM.
Jota, Ricardo, Ferreira, Alfredo, Cerejo, Mariana, Santos, José, Fonseca,Manuel J., & Jorge, Joaquim A. 2006. Recognizing Hand Gestures with CALI.SIACG, July, 187–193.
116
REFERENCES
Kela, Juha, Korpipää;, Panu, Mäntyjärvi, Jani, Kallio, Sanna, Savino, Giuseppe,Jozzo, Luca, & Marca, Di. 2006. Accelerometer-based gesture control for adesign environment. Personal Ubiquitous Comput., 10(5), 285–299.
Kim, Hyosun, & Fellner, Dieter W. 2004. Interaction with Hand Gesture for aBack-Projection Wall. CGI, 395–402.
Kobayashi, Masatomo, & Igarashi, Takeo. 2008. Ninja cursors: using multiplecursors to assist target acquisition on large screens. Pages 949–958 of: Proceed-ing of the twenty-sixth annual SIGCHI conference on Human factors in computingsystems. CHI ’08. New York, NY, USA: ACM.
Kondraske, G. V. 1994. An Angular Motion Fitts’ Law For Human PerformanceModeling And Prediction. Proc. Engineering in Medicine and Biology Society,307.
König, Werner A., Gerken, Jens, Dierdorf, Stefan, & Reiterer, Harald. 2009.Adaptive pointing: implicit gain adaptation for absolute pointing devices.Pages 4171–4176 of: Proceedings of the 27th international conference extended ab-stracts on Human factors in computing systems. CHI EA ’09. New York, NY,USA: ACM.
Kopper, Regis, Bowman, Doug A., Silva, Mara G., & McMahan, Ryan P. 2010. Ahuman motor behavior model for distant pointing tasks. Int. J. Hum.-Comput.Stud., 68(October), 603–615.
Lapointe, Jean-François, & Godin, Guy. 2005. On-Screen Laser Spot Detectionfor Large Display Interaction. HAVE.
Lawson, Ed, & Duric, Zoran. 2006. Using Deficits of convexity to recognizehand gestures from silhouettes. VISAPP, February.
Lee, Sangyoon, Seo, Jinseok, Kim, Gerard Jounghyun, & mo Park, Chan. 2003.Evaluation of pointing techniques for ray casting selection in virtual environ-ments. In: In Third International Conference on Virtual Reality and Its Applicationin Industry.
Lee, SK, Buxton, William, & Smith, K. C. 1985. A multi-touch three dimensionaltouch-sensitive tablet. Pages 21–25 of: Proceedings of the SIGCHI conference onHuman factors in computing systems. CHI ’85. New York, NY, USA: ACM.
117
REFERENCES
Leibe, Bastian, Starner, Thad, Ribarsky, Willian, Wartell, Zachary, Krum, David,Singletary, Brad, & Hodges, Larry. 2000. The Perceptive Workbench: To-ward Spontaneous and Natural Interaction in Semi Immersive Virtual En-vironments. IEEE Virtual Reality.
Leubner, Chirstian, Brockmann, Chirstian, & Muller, Heinrich. 2001.Computer-vision-based human-computer interaction with a back projectioonwall using arm gestures. Euromicro, 27(September), 308–314.
Lien, Cheng-Chang, & Huang, Chung-Lin. 1998. Model-based articulated handmotion tracking for gesture recognition. Image and Vision Computing, Volume16(Number 2), 121–134.
Limbourg, Quentin, & Vanderdonckt, Jean. 2003. Comparing Task Models for UserInterface Design.
MacKenzie, I. Scott, & Jusoh, Shaidah. 2001. An Evaluation of Two Input De-vices for Remote Pointing. Pages 235–250 of: Proceedings of the 8th IFIP Inter-national Conference on Engineering for Human-Computer Interaction. EHCI ’01.London, UK: Springer-Verlag.
Malik, Shahzad, & Laszlo, Joe. 2004. Visual touchpad: a two-handed gesturalinput device. Pages 289–296 of: ICMI ’04: Proceedings of the 6th internationalconference on Multimodal interfaces. New York, NY, USA: ACM Press.
Malik, Shahzad, Ranjan, Abhishek, & Balakrishnan, Ravin. 2005a. Interactingwith large displays from a distance with vision-tracked multi-finger gesturalinput. Pages 43–52 of: UIST ’05: Proceedings of the 18th annual ACM symposiumon User interface software and technology. New York, NY, USA: ACM Press.
Malik, Shahzad, Ranjan, Abhishek, & Balakrishnan, Ravin. 2005b. Interactingwith large displays from a distance with vision-tracked multi-finger gesturalinput. Pages 43–52 of: UIST ’05: Proceedings of the 18th annual ACM symposiumon User interface software and technology. New York, NY, USA: ACM.
Merleau-ponty, Maurice. 1976. Phenomenologie de la perception. French & Euro-pean Pubns.
Microsoft. 2010. Kinect webpage: http://www.xbox.com/en-US/kinect.
Morris, M. R., Wobbrock, J. O., & Wilson, A. D. 2010. Understanding userspreferences for surface gestures. Pages 261–268 of: In Proceedings of Graphics
118
REFERENCES
Interface 2010. Ottawa,Ontario, Canada: Canadian Information ProcessingSociety, Toronto, Ont., Canada.
Myers, Brad A., Peck, Choon Hong, Nichols, Jeffrey, Kong, Dave, & Miller,Robert. 2001. Interacting at a Distance Using Semantic Snarfing. Pages 305–314 of: Proceedings of the 3rd international conference on Ubiquitous Computing.UbiComp ’01. London, UK, UK: Springer-Verlag.
Myers, Brad A., Bhatnagar, Rishi, Nichols, Jeffrey, Peck, Choon Hong, Kong,Dave, Miller, Robert, & Long, A. Chris. 2002. Interacting at a distance: mea-suring the performance of laser pointers and other devices. Pages 33–40 of:Proceedings of the SIGCHI conference on Human factors in computing systems:Changing our world, changing ourselves. CHI ’02. New York, NY, USA: ACM.
Nacenta, Miguel A., Sallam, Samer, Champoux, Bernard, Subramanian, Sriram,& Gutwin, Carl. 2006a. Perspective cursor: perspective-based interaction formulti-display environments. CHI, 289–298.
Nacenta, Miguel A., Sallam, Samer, Champoux, Bernard, Subramanian, Sriram,& Gutwin, Carl. 2006b. Perspective cursor: perspective-based interaction formulti-display environments. Pages 289–298 of: Proceedings of the SIGCHI con-ference on Human Factors in computing systems. CHI ’06. New York, NY, USA:ACM.
Nacenta, Miguel A., Pinelle, David, Stuckel, Dane, & Gutwin, Carl. 2007. Theeffects of interaction technique on coordination in tabletop groupware. Pages191–198 of: Proceedings of Graphics Interface 2007. GI ’07. New York, NY, USA:ACM.
NASA. 1987. NASA. NASA Human Performance Research Group. Task Load Index(NASA-TLX).
Ni, Tao, & Baudisch, Patrick. 2009. Disappearing mobile devices. Pages 101–110of: Proceedings of the 22nd annual ACM symposium on User interface software andtechnology. UIST ’09. New York, NY, USA: ACM.
Nintendo. 2011. Wiimote webpage: wii.com.
Nolker, C., & Ritter, H. 1996. Illumination independent recognition of deiticarm postures. Proc. 24th Annual conf. of the IEEE Indutrial Electronics Society.
Norman, Donald A. 1999 (September). The Invisible Computer. MIT Press.
119
REFERENCES
Norman, Donald A. 2002. The Design of Everyday Things. Basic Books.
Oh, Ji-Young, & Stuerzlinger, Wolfgang. 2002. Laser Pointers as CollaborativePointing Devices. CHI.
Oka, Kenji, Sato, Yoichi, & Koike, Hideki. 2002. Real-Time Tracking of MultipleFingertips and Gesture Recognition for Augmented Desk Interface Systems.Page 429 of: FGR ’02: Proceedings of the Fifth IEEE International Conference on Au-tomatic Face and Gesture Recognition. Washington, DC, USA: IEEE ComputerSociety.
Olsen, Jr., Dan R., & Nielsen, Travis. 2001. Laser pointer interaction. Pages 17–22of: Proceedings of the SIGCHI conference on Human factors in computing systems.CHI ’01. New York, NY, USA: ACM.
OpenSG. 2009. OpenSG: OpenSource SceneGraph. http://www.opensg.org.
OpenSG. 2010. OpenSG Project webpage :http://www.opensg.org/.
Oviatt, Sharon, DeAngeli, Antonella, & Kuhn, Karen. 1997. Integration andsynchronization of input modes during multimodal human-computer inter-action. Pages 415–422 of: CHI ’97: Proceedings of the SIGCHI conference on Hu-man factors in computing systems. New York, NY, USA: ACM.
Paradiso, J.A., Leo, Che King, Checka, N., & Hsiao, Kaijen. 2002. Passive acous-tic sensing for tracking knocks atop large interactive displays. Sensors, 2002.Proceedings of IEEE, 1, 521–527 vol.1.
Parker, J. Karen, Mandryk, Regan L., & Inkpen, Kori M. 2005. TractorBeam:seamless integration of local and remote pointing for tabletop displays. Pages33–40 of: Proceedings of Graphics Interface 2005. GI ’05. School of Computer Sci-ence, University of Waterloo, Waterloo, Ontario, Canada: Canadian Human-Computer Communications Society.
Pavlovych, Andriy, & Stuerzlinger, Wolfgang. 2009. The tradeoff between spa-tial jitter and latency in pointing tasks. Pages 187–196 of: Proceedings of the1st ACM SIGCHI symposium on Engineering interactive computing systems. EICS’09. New York, NY, USA: ACM.
Peck, Choon Hong. 2001. Useful parameters for the design of laser pointerinteraction techniques. Pages 461–462 of: CHI ’01 extended abstracts on Humanfactors in computing systems. CHI EA ’01. New York, NY, USA: ACM.
120
REFERENCES
Pierce, Jeffrey S., Forsberg, Andrew S., Conway, Matthew J., Hong, Seung,Zeleznik, Robert C., & Mine, Mark R. 1997. Image plane interaction tech-niques in 3D immersive environments. Pages 39–ff. of: Proceedings of the 1997symposium on Interactive 3D graphics. I3D ’97. New York, NY, USA: ACM.
Quek, F. K. H., & Zhao, M. 1996. Inductive learning in hand pose recognition.Page 78 of: FG ’96: Proceedings of the 2nd International Conference on AutomaticFace and Gesture Recognition (FG ’96). Washington, DC, USA: IEEE ComputerSociety.
Raja, Dheva, Bowman, Doug A., Lucas, John, & North, Chris. 2004. Explor-ing the Beneficts of Immersion in Abstract Information Visualization. Proc. ofImmersive Projection Technology Workshop.
Reitmayr, Gerhard, & Schmalstieg, Dieter. 2005. OpenTracker: A flexible soft-ware design for three-dimensional interaction. Virtual Reality, 9(1), 79–92.
Rosenberg, Ilya, & Perlin, Ken. 2009. The UnMousePad: an interpolating multi-touch force-sensing input pad. ACM Trans. Graph., 28(July), 65:1–65:9.
Russell, Daniel M., Streitz, Norbert A., & Winograd, Terry. 2005. Building dis-appearing computers. Commun. ACM, 48(March), 42–48.
Sato, Yoichi, Kobayashi, Yoshinori, & Koike, Hideki. 2000. Fast Tracking ofHands and Fingertips in Infrared Images for Augmented Desk Interface. Page462 of: FG ’00: Proceedings of the Fourth IEEE International Conference on Auto-matic Face and Gesture Recognition 2000. Washington, DC, USA: IEEE Com-puter Society.
Sato, Yoichi, Saito, Makiko, & Koik, Hideki. 2001. Real-Time Input of 3D Poseand Gestures of a User’s Hand and Its Applications for HCI. Page 79 of: VR’01: Proceedings of the Virtual Reality 2001 Conference (VR’01). Washington, DC,USA: IEEE Computer Society.
Schmidt, Dominik, Block, Florian, & Gellersen, Hans. 2009. A Comparisonof Direct and Indirect Multi-touch Input for Large Surfaces. Pages 582–594of: Gross, Tom, Gulliksen, Jan, Kotzé, Paula, Oestreicher, Lars, Palanque,Philippe, Prates, Raquel, & Winckler, Marco (eds), Human-Computer Inter-action – INTERACT 2009. Lecture Notes in Computer Science, vol. 5726.Springer Berlin / Heidelberg. 10.1007/978-3-642-03655-265.
121
REFERENCES
Shoemaker, Garth, Tang, Anthony, & Booth, Kellogg S. 2007. Shadow reaching:a new perspective on interaction for large displays. Pages 53–56 of: Proceedingsof the 20th annual ACM symposium on User interface software and technology. UIST’07. New York, NY, USA: ACM.
Shoemaker, Garth, Findlater, Leah, Dawson, Jessica Q., & Booth, Kellogg S. 2009.Mid-air text input techniques for very large wall displays. Pages 231–238 of:Proceedings of Graphics Interface 2009. GI ’09. Toronto, Ont., Canada, Canada:Canadian Information Processing Society.
Soares, Luciano P, Jota, Ricardo, Araújo, Bruno, & Jorge, Joaquim. 2007. Auto-matic Color Calibration for Commodity Multi-projection Display Walls. Sym-posium on Virtual and Augmented Reality.
Sony. 2011. PS3 Move webpage: http://us.playstation.com/ps3/playstation-move/.
Soukoreff, R. William, & MacKenzie, I. Scott. 2004. Towards a standard for point-ing device evaluation, perspectives on 27 years of Fitts’ law research in HCI.Int. J. Hum.-Comput. Stud., 61(December), 751–789.
Stødle, Daniel, Hagen, Tor-Magne Stien, Bjørndalen, John Markus, & Anshus,Otto J. 2008. Gesture-Based, Touch-Free Multi-User Gaming on Wall-Sized,High-Resolution Tiled Displays. Journal of Virtual Reality and Broadcasting, 5(10).urn:nbn:de:0009-6-15001,, ISSN 1860-2037.
Subramanian, Sriram, Aliakseyeu, Dzimitry, & Lucero, Andrés. 2006. Multi-layerinteraction for digital tables. Pages 269–272 of: UIST ’06: Proceedings of the 19thannual ACM symposium on User interface software and technology. New York, NY,USA: ACM.
Sutherland, Ivan E. 1963. Sketchpad: a man-machine graphical communicationsystem. Pages 329–346 of: Proceedings of the May 21-23, 1963, spring joint computerconference. AFIPS ’63 (Spring). New York, NY, USA: ACM.
Svanæs, Dag. 2000. Understanding Interactivity: Steps to a phenomenology of Human-Computer Interaction. Monograph, Computer Science Department, Monograph,Computer Science Department, ISBN 82-471-5201-0, NTNU, Trondheim.
Takeoka, Yoshiki, Miyaki, Takashi, & Rekimoto, Jun. 2010. Z-touch: a multi-touchsystem for detecting spatial gestures near the tabletop. Pages 57:1–57:1 of: ACMSIGGRAPH 2010 Talks. SIGGRAPH ’10. New York, NY, USA: ACM.
122
REFERENCES
Tan, Desney S., Czerwinski, Mary, & Robertson, George. 2003. Women go withthe (optical) flow. Pages 209–215 of: CHI ’03: Proceedings of the SIGCHI conferenceon Human factors in computing systems. New York, NY, USA: ACM Press.
Teather, R. J., & Stuerzlinger, W. 2008. Assessing the Effects of Orientation andDevice on (Constrained) 3D Movement Techniques. Pages 43–50 of: Proceedingsof the 2008 IEEE Symposium on 3D User Interfaces. 3DUI ’08. Washington, DC,USA: IEEE Computer Society.
Tech., Smart. 2010. Smart Technologies: http://smarttech.com/.
Tse, Edward, Hancock, Mark, & Greenberg, Saul. 2007. Speech-filtered bubbleray: improving target acquisition on display walls. Pages 307–314 of: Proceedingsof the 9th international conference on Multimodal interfaces. ICMI ’07. New York,NY, USA: ACM.
Usoh, Martin, Arthur, Kevin, Whitton, Mary C., Bastos, Rui, Steed, Anthony,Slater, Mel, & Frederick P. Brooks, Jr. 1999. Walking > walking-in-place > flying,in virtual environments. Pages 359–364 of: SIGGRAPH ’99: Proceedings of the 26thannual conference on Computer graphics and interactive techniques. New York, NY,USA: ACM Press/Addison-Wesley Publishing Co.
Vogel, Daniel, & Balakrishnan, Ravin. 2004. Interactive public ambient displays:transitioning from implicit to explicit, public to personal, interaction with mul-tiple users. Pages 137–146 of: UIST ’04: Proceedings of the 17th annual ACM sym-posium on User interface software and technology. New York, NY, USA: ACM.
Vogel, Daniel, & Balakrishnan, Ravin. 2005. Distant freehand pointing and click-ing on very large, high resolution displays. Pages 33–42 of: Proceedings of the 18thannual ACM symposium on User interface software and technology. UIST ’05. NewYork, NY, USA: ACM.
Voida, Stephen, Podlaseck, Mark, Kjeldsen, Rick, & Pinhanez, Claudio. 2005.A study on the manipulation of 2D objects in a projector/camera-based aug-mented reality environment. Pages 611–620 of: Proceedings of the SIGCHI con-ference on Human factors in computing systems. CHI ’05. New York, NY, USA:ACM.
von Hardenberg, Christian, & Bérard, François. 2001. Bare-hand human-computer interaction. Pages 1–8 of: PUI ’01: Proceedings of the 2001 workshopon Perceptive user interfaces. New York, NY, USA: ACM Press.
123
REFERENCES
Ware, Colin, & Lowther, Kathy. 1997. Selection using a one-eyed cursor in a fishtank VR environment. ACM Trans. Comput.-Hum. Interact., 4(December), 309–322.
Weiss, Malte, Voelker, Simon, & Borchers, Jan. 2010a. The BendDesk demo: multi-touch on a curved display. Pages 317–317 of: ACM International Conference onInteractive Tabletops and Surfaces. ITS ’10. New York, NY, USA: ACM.
Weiss, Malte, Voelker, Simon, Sutter, Christine, & Borchers, Jan. 2010b. Bend-Desk: dragging across the curve. Pages 1–10 of: ACM International Conference onInteractive Tabletops and Surfaces. ITS ’10. New York, NY, USA: ACM.
Welch, Greg, & Bishop, Gary. 2006. An Introduction to the Kalman Filter. Tech. rept.University of North Carolina.
Wigdor, Daniel, Shen, Chia, Forlines, Clifton, & Balakrishnan, Ravin. 2006. Ef-fects of display position and control space orientation on user preference andperformance. Pages 309–318 of: CHI ’06: Proceedings of the SIGCHI conference onHuman Factors in computing systems. New York, NY, USA: ACM Press.
Wikipedia. 2011. Wikipedia entry on flipPhones: en.wikipedia.org/wiki/Flip( f orm.
Wilson, Andrew D. 2004. TouchLight: An Imaging Touch Screen and Display forGesture-Based Interaction. ICMI.
Wilson, Andrew D. 2005. PlayAnywhere: A Compact Interactive TabletopProjection-Vision System. UIST.
Wilson, Andrew D., & Benko, Hrvoje. 2010. Combining multiple depth camerasand projectors for interactions on, above and between surfaces. Pages 273–282of: Proceedings of the 23nd annual ACM symposium on User interface software andtechnology. UIST ’10. New York, NY, USA: ACM.
Wilson, Andrew D., & Cutrell, Edward. 2005. FlowMouse: A Computer Vision-Based Pointing and Gesture Input Device. Interact.
Wilson, M. 2002. Six views of embodied cognition. Psychon Bull Rev, 9(4), 625–636.
Wingrave, Chadwick A., Tintner, Ryan, Walker, Bruce N., Bowman, Doug A., &Hodges, Larry F. 2005. Exploring Individual Differences in Raybased Selection;Strategies and Traits. Pages 163–170 of: Proceedings of the 2005 IEEE Conference2005 on Virtual Reality. VR ’05. Washington, DC, USA: IEEE Computer Society.
124
REFERENCES
Winograd, Terry, & Flores, Fernando. 1987. Understanding Computers and Cogni-tion: A New Foundation for Design. Boston, MA, USA: Addison-Wesley LongmanPublishing Co., Inc.
Wu, Mike, & Balakrishnan, Ravin. 2003. Multi-finger and whole hand gesturalinteraction techniques for multi-user tabletop displays. UIST, 193–202.
Wu, Ying, & Huang, Thomas S. 2000. View-Independent Recognition of HandPostures. CVPR - IEEE Computer Society Conference on Computer Vision and Pat-tern Recognition, Volume 2(June), 2088.
125