Embed Size (px)
Citation preview

Understanding the capacity for biofuel production in Africa and Latin America
Luís CortezProfessor FEAGRI - UNICAMPAdjunct Coordinator of Special Programs- FAPESP
The Royal SocietyLondonSept 25-27, 2013

Presentation
•Present situation of Bioethanol produtionin Brazil
•The Global Sustainable Bioenergy Project-GSB/FAPESP Collaboration
•LACAf/FAPESP Project Diagnosis on Food/Energy Situation in Latin America and Africa

Present situation of Bioethanol produtionin Brazil

Where does Brazil plant Sugarcane?
• Not in the Amazon• Best land for cane:
– Northeast coast • Oldest (XVI century)
– Southeast • highest productivity
– Centralwest • main expansion area
>82 ton/ha
55 ton/ha
25052010; iac-abc-workshop-25052010.pptx;chbritocruz & BIOEN

Sugarcane for ethanol uses 0.4% of Brazil’s total area
Area used for sugarcane for ethanol (3.4 MHa, 0.4%)
Area used for agriculture (76.7 MHa, 9%)
Rural properties area (355 MHa, 42%)
Total country area (851 MHa, 100%)
Source: Horta Nogueira and Seabra (2008)
Small bioenergy footprint

Sugarcane Ethanol Learning Curve in Brazil

Expected Evolution of Energy Supply in Brazil
Source: EPE-MME, Brazil (2010)
Wood and
Charcoal
Petroleum and
Derivates
Hydro and
Electricity
Sugarcane Products
NuclearCoal
Natural Gas
Other Renewables
Source: EPE-MME (2010)
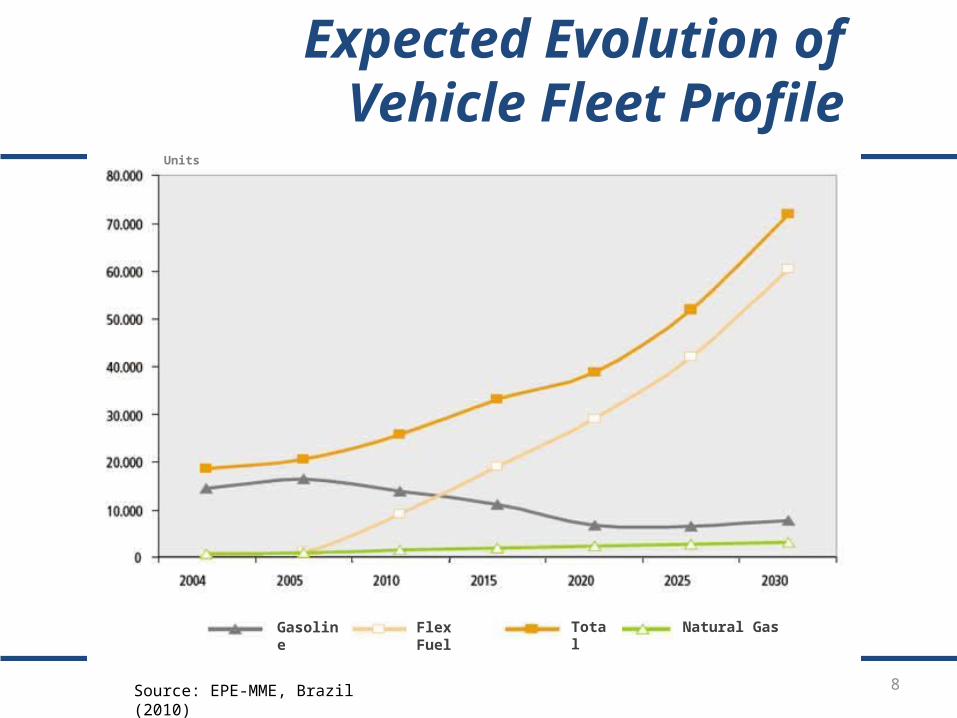
Source: EPE-MME, Brazil (2010)
Expected Evolution of Vehicle Fleet Profile
until 2030 in Brazil
Gasoline Flex Fuel Total Natural Gas
Units
8

- Brazil established a dynamic relation between Research and Production particularly after 1975, involving govmt and private sectors
- Sugarcane, an excellent energy crop
- Creation of the “Brazilian Model” combining efficient sugar and ethanol production
Brazilian Ethanol: reasons for success

10
Yield by Brazilian Regions
30
40
50
60
70
80
90
77
/78
79
/80
81
/82
83
/84
85
/86
87
/88
89
/90
91
/92
93
/94
95
/96
97
/98
99
/00
01
/02
03
/04
Harvest Seasons
Yie
ld(t
/ha)
São Paulo
Center-SouthBrazil
Northeast
Cane Productivity (t/ha) New Cane Varieties
RENDIMENTO FERMENTATIVO(%)
82
83
84
85
86
87
88
89
90
91
92
1975 1980 1985 1990 1995 2000 2005SAFRA
(%)
Fermentation Yield (%) No Burning/Mechanization

The Global Sustainable Bioenergy Project-GSB/FAPESP Collaboration
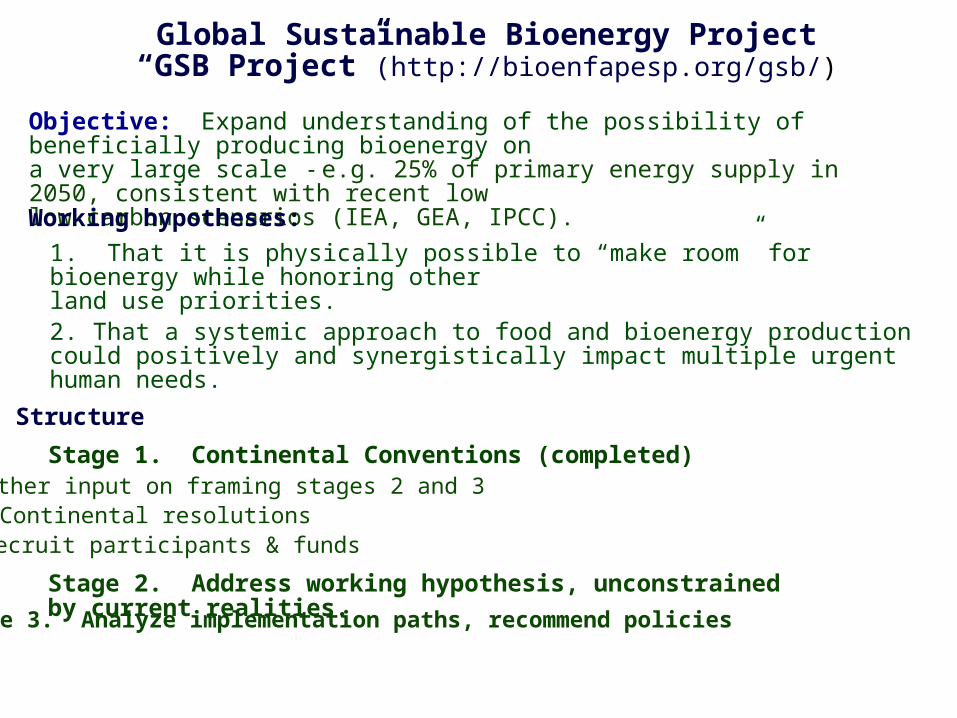
Global Sustainable Bioenergy Project“GSB Project”(http://bioenfapesp.org/gsb/)
Objective: Expand understanding of the possibility of beneficially producing bioenergy ona very large scale - e.g. 25% of primary energy supply in 2050, consistent with recent lowlow carbon scenarios (IEA, GEA, IPCC).
Structure
Stage 1. Continental Conventions (completed) • Gather input on framing stages 2 and 3• Continental resolutions• Recruit participants & funds
Stage 2. Address working hypothesis, unconstrained by current realities.Stage 3. Analyze implementation paths, recommend policies
Working hypotheses: 1. That it is physically possible to “make room” for bioenergy while honoring otherland use priorities.
2. That a systemic approach to food and bioenergy production could positively and synergistically impact multiple urgent human needs.

GSBGlobal Sustainable Bioenergy
Global Sustainable Bioenergy (GSB) Project(http://bioenfapesp.org/gsb/)
Brazilian scholars studying abroad
Several days to a year
Scholar Exchange Program (accessed from http://bioenfapesp.org/gsb/)
International scholars studying in Brazil
Supported by the Sao Paulo Research Foundation (FAPESP) BIOEN Program
Next meeting: Nov 12-14, 2013Atibaia, Brazil

LACAf/FAPESP ProjectDiagnosis on Food/Energy Situation
in Latin America and Africa
http://bioenfapesp.org/gsb/lacaf/index.php/lacaf-cane-i

Food (Grains) and Energy (Gasoline) Dependence in Latin America
Source: FAO (2008), IEA (2008)
Brazil - 196
Argentina - 100
Colombia - 39Mexico - 75
Peru - 17Bolivia - 33Guatemala - 2
Costa Rica - 1
Nicaragua - 3
Jamaica - 0.2
Paraguay - 16
Cuba - 3
-150%
-100%
-50%
0%
50%
100%
150%
-150% -100% -50% 0% 50% 100% 150%
Energy (in)dependence - GasolineExport - Import / Consumption
Ag
ric
ult
ura
l (i
n)d
ep
en
de
nc
e -
Gra
ins
Exp
ort
- Im
po
rt /
Co
nsu
mp
tion
Brazil - 196
Argentina - 100
Colombia - 39
Mexico - 75
Peru - 17
Bolivia - 33
Guatemala - 2
Costa Rica - 1
Nicaragua - 3
Guyana - 1
J amaica - 0.2
Paraguay - 16
Cuba - 3
Food Independence and
Gasoline Dependence
Food and Gasoline Independence
Food and Gasoline Dependence
Food Dependenceand
Gasoline Independence
Pasture and Prairie Land (Mha)

Ethanol production in Latin America
NPNPNP
6172329
122128
174174
232348
22,8
BoliviaNicaraguaHondurasUruguayMexico
Costa RicaCubaPeru
ParaguayJamaica
ArgentinaGuatemala
ColombiaBrazil
Ethanol Fuel Production - 2011 (Ml)
Source: EIA, 2013 @ In 2011/2012 Brazil produced 22.8 Billion liters
Doesn't produce (NP)

South Africa - 84
Mozambique -44
Malawi - 2
Tanzania - 24Zambia - 20
Kenya - 21
Madagascar - 37
Ghana- 8Senegal- 6
-100%
-50%
0%
50%
100%
-150% -100% -50% 0% 50% 100% 150%
Energy (in)dependence - GasolineExport - Import / Consumption
Ag
ric
ult
ura
l (i
n)d
ep
en
de
nc
e -
Gra
ins
Exp
ort
- Im
po
rt /
Co
nsu
mp
tion
South Africa - 84
Mozambique -44
Malaw i - 2
Tanzania - 24
Zambia - 20
Kenya - 21
Mauritius - 0.007
Reunion- 0.02
Madagascar - 37
Ghana- 8
Senegal- 6
Food Independence and
Gasoline Dependence
Food and Gasoline Independence
Food and Gasoline Dependence
Food Dependenceand
Gasoline Independence
Pasture and Prairie Land (Mha)
Food (Grains) and Energy (Gasoline) Dependence in Africa
Source: FAO (2008), IEA (2008)
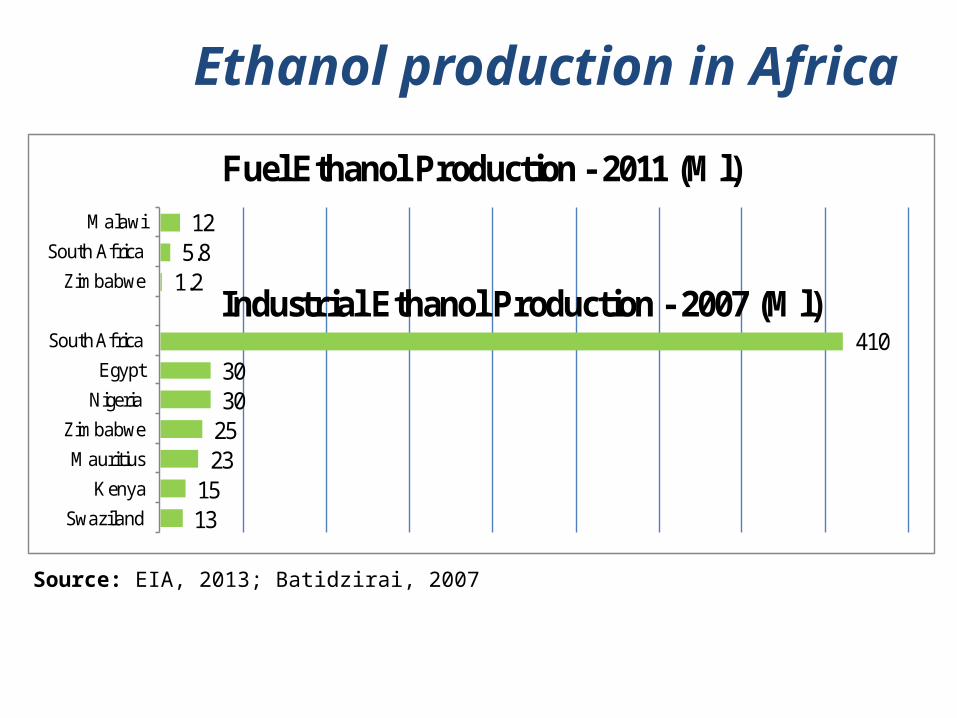
Ethanol production in Africa
1315
23253030
410
1.25.812
Swaziland
Kenya
Mauritius
Zimbabwe
Nigeria
Egypt
South Africa
Zimbabwe
South Africa
Malawi
Fuel Ethanol Production - 2011 (Ml)
Industrial Ethanol Production - 2007 (Ml)
Source: EIA, 2013; Batidzirai, 2007

Land Availability for bioenergy in LA and AF
Sources: Doornbosch and Steenblik (2007) , FAOSTAT (2008), IICA (2009), www.eclac.org. 2009

This map: without irrigation
Source: Leite et al. (2009)
A similar estimate for BrazilArea classification Prodvty No irrigation W. irrigationPotential (ton/ha) MHa % MHa %High > 80 7,9 2,2 37,9 10,5Medium >73 113,9 31,5 98,0 27,1Low > 65 149,2 41,3 167,7 46,4Inadequate < 65 90,6 25,1 58,0 16Total - 361,6 100 361,6 100

Pasture/Cattle integration with Sugarcane Expansion in Brazil
• Pasture land in Brazil 150-200 Mha (extensive 1 head/ha)• IBGE (2006) 159 Mha with 151 kg (live weight)/ha (54% yield), results
24,000 Mkg live weight beef/year • CTBE-CGEE (2010): if same beef production with integrated
production beef/sugarcane: needs 53 Mha of pasture instead of 159 Mha (estimated beef productivity 452 kg/ha instead of 151 kg/ha)
• Integration pasture/sugarcane: 1:1. Therefore 52 Mha of integrated sugarcane could be necessary to produce ethanol and supply enough balanced feed for the 53 Mha of integrated pasture land.
• The integrated 159 Mha can yield: 53 Mha of integrated intensified pasture land + 52 Mha of sugarcane (300 billion liters of ethanol), and leaving extra 54 Mha for other crops
Source: Leite et al. (2011)

CEPAL estimate for area requirement in LA countries for E90
Source: Sugarcane-based bioethanol : energy for sustainabledevelopment / coordination BNDES and CGEE – Rio de Janeiro :BNDES, 2008
http://www.bioetanoldecana.org/en/download/bioetanol.pdf

LACAf/FAPESP Project
Analyzing ethanol production in case study countries (Colombia,
Guatemala, South Africa and Mozambique)

Sugarcane Ethanol in Latin America Colombia:• The world’s second-largest sugarcane ethanol producer• Governmental regulations established a mandatory blend (E10)• Current ethanol production covers 85% of the local needs • Colombia has a great potential for sugarcane ethanol production
in the East part of the country (expected lower yield than Cauca Valley)
Guatemala:• Number one producer of sugarcane in Central America • In 2009, Guatemala produced 2.38 million tons of raw sugar, of
which 1.3 million tons were exported• 5 out of the 14 sugar mills are also producing ethanol, whose
production reached 265 million liters in 2008• All of the ethanol is exported, mainly to Europe and the U.S. • The domestic market for biofuels consumption has not been
developed yet Sources: IICA (2009); USDA (2010)

Sugarcane Ethanol in Africa South Africa:• Is the largest producer of sugarcane in the continent• The Industrial Development Corporation and the Central Energy
Fund announced plans to invest US$ 437 million in 5 biofuels projects• Ethanol Africa, South African commercial maize farmers, invested in 8
ethanol new plants. Has investments in Angola, Zambia, Tanzania and Mozambique to produce biofuels from corn and sugarcane
Mozambique:• Is set to become one of a major biofuels producer in Africa • ProCana will process its cane in a Brazilian-built sugar-ethanol factory• Last year Central African Mining & Exploration has invested U$ 150
million in a plant of ethanol, and Petromoc spends U$ 550 million to develop biofuels
• The potential for sugarcane ethanol production is great, both for domestic use or exports. It enjoys tax exemption to export to Europe
Sources: DFID (2007), Jumbe et al. (2009); allafrica.com/biofuel/2010

LACAf FAPESP Project: a contribution to the GSB Project
1. Diagnosis of Energy and Food Situation in LA and AF & Integrated analysisCoordinator: Luiz Augusto Horta Nogueira (UNIFEI/UNICAMP)
- Why should Latin American and African countries get involved in a global effort to increase biofuels production? (Horta, Regis, Furtado, Emile, Rincon)
- How can countries in LA and AF implement the necessary actions: the cases of Colombia, Guatemala, South Africa and Mozambique? (Horta, Emile, Rincon)
- What is the present and expected future situation of energy and food security in Latin America and Africa? (Horta, Regis, Emile, Rincon)
- Integrating analysis for AL and AF (Horta, Regis, Emile, Rincon)

LACAf-FAPESP Project: a contribution to the GSB Project
2. Determining the Physical Potential for Sugarcane Ethanol Production in Latin America and AfricaCoordinator: Edgar Beauclair (Esalq/USP)
- Identify potential areas to sugarcane production in African and Latin American countries; (Fernando-CTC team)
- Quantify the different production potential of sugarcane crops in these countries; (Fernando-CTC team)
- Assess the land use impacts of biofuels production in Latin America and Africa: the cases of Colombia, South Africa and Mozambique (André Nassar-AGROICONE team)
- Use a Sugarcane Crop Model and Estimate Total Sugarcane Ethanol Production in LA and AF (Edgar Beauclair)
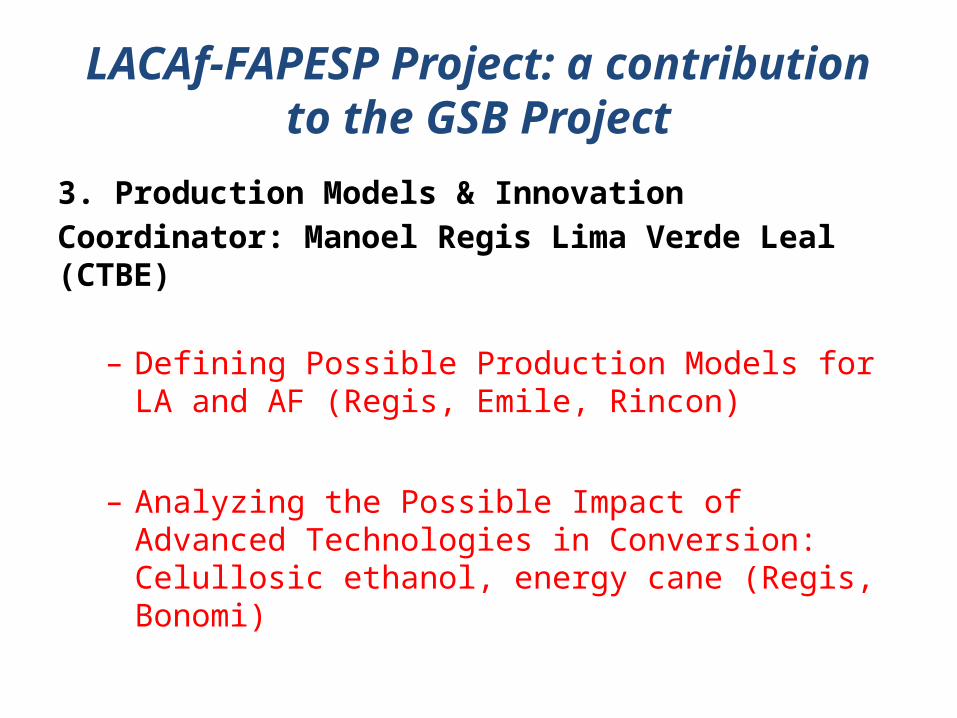
LACAf-FAPESP Project: a contribution to the GSB Project
3. Production Models & InnovationCoordinator: Manoel Regis Lima Verde Leal (CTBE)
– Defining Possible Production Models for LA and AF (Regis, Emile, Rincon)
– Analyzing the Possible Impact of Advanced Technologies in Conversion: Celullosic ethanol, energy cane (Regis, Bonomi)

25052010; iac-abc-workshop-25052010.pptx;chbritocruz & BIOEN
LACAf Program/Bioen/FAPESP (August 15th, 2013)

Sugarcane Bioethanol: R&D for Productivity and Sustainability
• Lauched Sept 2010• 992 pages• 76 chapters• 139 authors• Publisher:• Ethanol PP Project:Sales by Amazon
Conclusions
• There are good oportunities for bioenergy in Latin America and Africa reconciling food and energy securities.
• Brazil (bioethanol) is a good example for biofuels production but may be a different model must be created, particularly in Africa.
• Need to understand specific situation for selected countries: the FAPESP/LACAf project intends to be a contribution to GSB project, verifying its potential and constraints.

1st Brazilian Bioenergy Science & Technology Conference - BBEST
• Venue: Campos do Jordão, SP, Brazil• August 14-18, 2011
http://www.bbest.org.br/
32

Brazil: Gasoline and Ethanol consumption
CE6655665alCE6655665alCE6655665alCE6655665alCE6655665alCE6655665alCE6655665alCE6655665alCE6655665alCE6655665al -
5,000,000
10,000,000
15,000,000
20,000,000
25,000,000 EtanolGasolina Automotiva
mil
m3
Fonte: ANP/SPP 1Inclui as vendas de etanol hidratado e anidro misturado na gasolina C. 2Inclui apenas a gasolina A. Exclui o etanol anidro misturado à gasolina C.
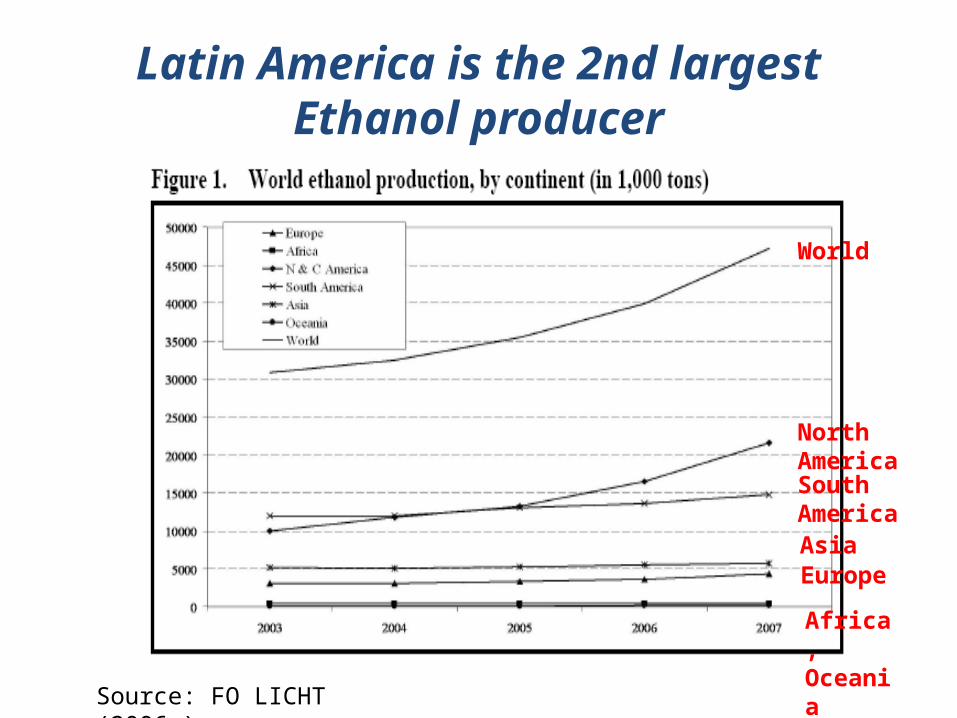
Latin America is the 2nd largest Ethanol producer
Source: FO LICHT (2006a)
World
North AmericaSouth AmericaAsiaEurope
Africa, Oceania

Reference quantities
2004 2050
Gasoline consumption (1) 1,200 GL 2,200 GL
Ethanol consumption 30 GL
Ethanol substituting 15% gasoline 400 GL
Ethanol substituting 100% gasoline 2,650 GL(1) Source: National Energy Information Center (NEIC)
Source: iac-abc-workshop-25052010.pptx;chbritocruz & BIOEN
Area available in South & Central America by 2050: 0,25 GhaArea available in Africa by 2050: 0,18 Gha(both according to Doornbosch & Steenblik, OECD, 2007)So. And Central America + Africa: 0,430 Gha10% of 0.43GHa @ 10kL/Ha.yr 430 GL /yr (in 2005: 40 GL)
Potential for substituting for 15% of the world gasoline demand considering only the available area in South and Central America and Africa

Integrated Bioenergy-Inclusive Development Strategies
• Ground-breaking – Development& integration of models that extend intellectual frontier
• Impactful - Multiple social & environmental benefits
Predictive Pasture& Crop Intensification
ModelsPredictive Energy Crop Yield
Models
Improved databases
Predictive SocialImpact Models
Predictive Environmental
Models
Bioenergy potential
Increased food potential
Evaluation & maximization of environtmental benefits
Evaluation & maximization ofsocial benefits
Better tools, facilitating Integratedanalysis
Predictive Production
Models
Key words for GSB & LACAf: Convergent, Predictive, Ground-Breaking, Integrated, Impactful, Analysis
Spared landpotential
Note: Economic analysisimplicit in most models

Comparative intensification potential: pastured livestock stocking density, wheat and maize yields
Application to Pastured Animal Production
J Sheehan, A Morishige, L Lynd,, N Mueller, J Gerber, J Foley, G Martha, jr, J Rocha, WE Sheehan, C West. Evaluation of the Global Pasture Performance Gap Using Climate Bins. Submitted.

Sheehan et al., in preparation
Minimum Performance(% Attainable Maximum)
50
Added Production a) Maize-Wheat Average
0.12
b) Pasture
1.16
Ratio (a/b)
10.1
Application to Pastured Animal ProductionComparative intensification potential: pastured livestock stocking density, wheat and maize yields

Application to Pastured Animal Production
Sheehan et al., in preparation
Added Production a) Maize-Wheat Average b) Pasture Ratio (a/b)
Minimum Performance(% Attainable Maximum)
50 0.22 1.19 10.175 0.34 1.96 5.890 0.53 2.50 4.7100 0.68 2.83 4.2
Comparative intensification potential: pastured livestock stocking density, wheat and maize yields

1985 2006 % Change
Pasture area 179 159 -11.2(106 Ha) Production 2.22 6.89 +310(106 tons)
Yield 12.4 43.3 +349(kg/ha) = 1000*Production/area
Stocking 0.71 1.11 +156Density (head/ha)
Animal 17.4 40.13 +231Performance (kg/head)
Data courtesy G. Martha, EMBRAPA
Brazil: Important and Instructive Example of Pasture Intensification
• Less land, more production
• Per ha yield more than tripledin 21 years
• Intensification potentials presented thus far have beenbased on stocking density only,and are thus likely quite conservative. Factor of 2?
• Stocking density is responsible for less than halfof the observed yield gain
40

Three fronts at FAPESP
• Scientific and Technology roadmap– Research Project in Public Policy Program (PPP Ethanol)
• Bioenergy Research Program (BIOEN)– Research program; 5-10 anos– Basic research core– Conections to application through partnership with
companies
• Bioenergy State Research Center– Hubs in the three state universities – USP, Unicamp, Unesp– Funding: State Government, FAPESP and the Universities
25052010; iac-abc-workshop-25052010.pptx;chbritocruz &
BIOEN41

FAPESP’s Research Program on Bioenergy (BIOEN): 5 areas
• Improvements in the feedstock: building a better cane plant for
energy - EnergyCane
• Production of Ethanol and other products: hydrolysis, pyrolysis,
gasification, fermentation, distillation
• New processes in alcohol-chemistry
• Ethanol based engine and fuel cell developments
• The Economics of Ethanol, Ethanol production and the environment,
Social impacts, the new agriculture of food and energy25052010; iac-abc-workshop-25052010.pptx;chbritocruz &
BIOEN42
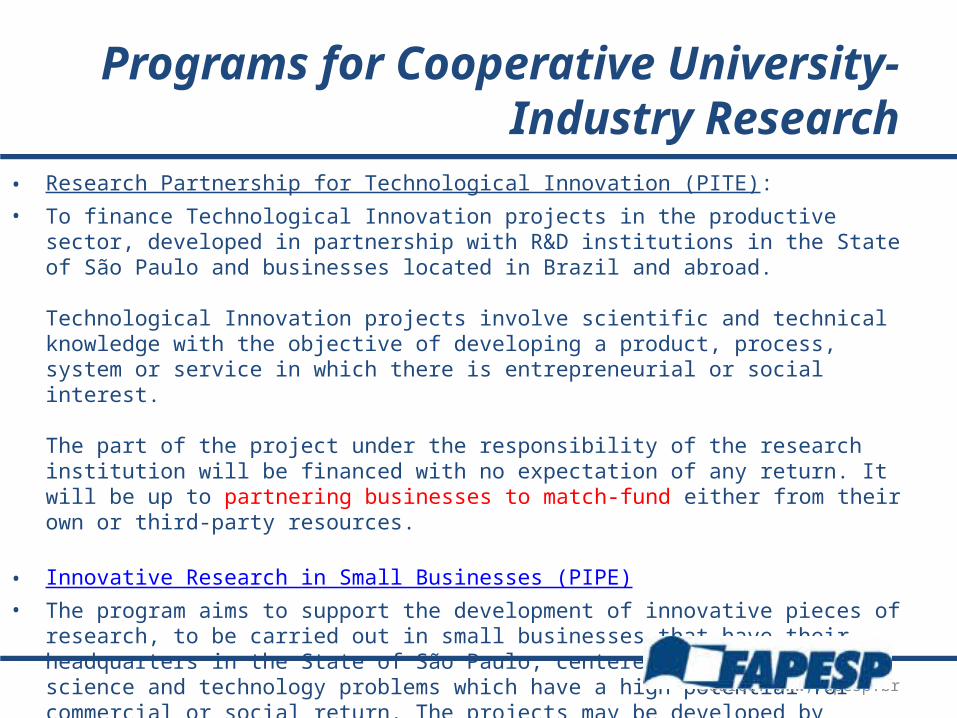
Programs for Cooperative University-Industry Research
• Research Partnership for Technological Innovation (PITE):• To finance Technological Innovation projects in the productive sector, developed in partnership with
R&D institutions in the State of São Paulo and businesses located in Brazil and abroad.
Technological Innovation projects involve scientific and technical knowledge with the objective of developing a product, process, system or service in which there is entrepreneurial or social interest.
The part of the project under the responsibility of the research institution will be financed with no expectation of any return. It will be up to partnering businesses to match-fund either from their own or third-party resources.
• Innovative Research in Small Businesses (PIPE)• The program aims to support the development of innovative pieces of research, to be carried out in
small businesses that have their headquarters in the State of São Paulo, centered on significant science and technology problems which have a high potential for commercial or social return. The projects may be developed by researchers who have links to the small businesses or which are associated with them for the implementation of the project.
Source: www,fapesp.br

Main Partnerships FAPESP-industry in bioenergy
FAPESP-DEDINI: Ethanol Production (US$ 60 million)FAPESP-BRASKEM/IDEOM: Green Polymers (US$ 5 million)FAPESP-OXITENO: Alcoholchemistry and SugarchemistryFAPESP-VALE: Biodiversity
www.fapesp.br
25052010; iac-abc-workshop-25052010.pptx;chbritocruz &
BIOEN

Ethanol PP Project: www.apta.sp.gov.br/cana
46
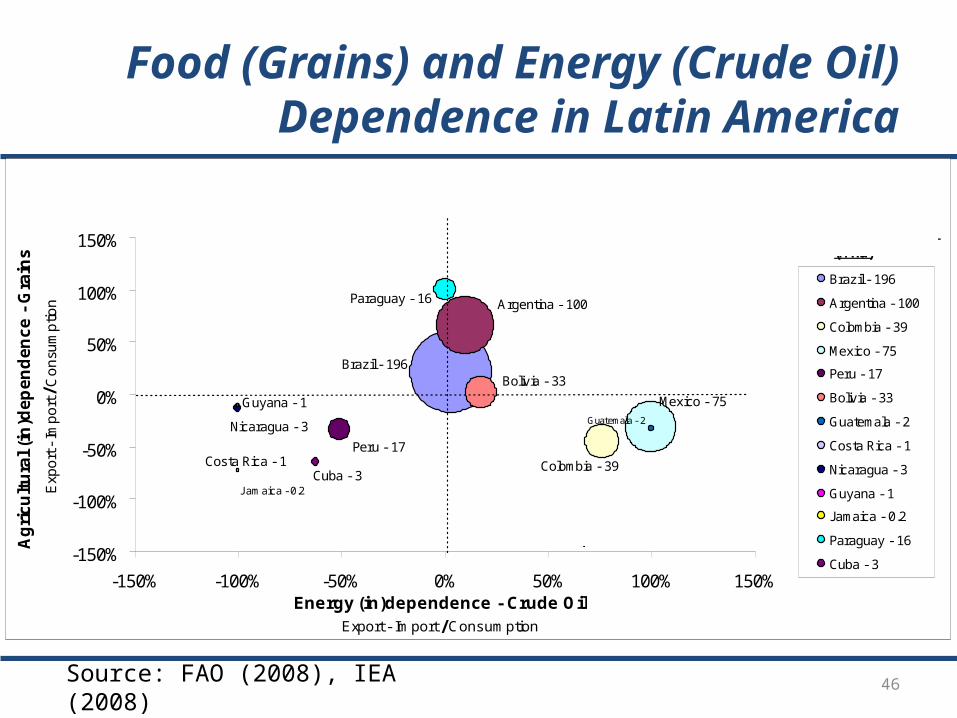
Food (Grains) and Energy (Crude Oil) Dependence in Latin America
Source: FAO (2008), IEA (2008)
Brazil - 196
Argentina - 100
Colombia - 39
Mexico - 75
Peru - 17
Bolivia - 33
Guatemala - 2
Costa Rica - 1
Nicaragua - 3
Guyana - 1
J amaica - 0.2
Paraguay - 16
Cuba - 3
-150%
-100%
-50%
0%
50%
100%
150%
-150% -100% -50% 0% 50% 100% 150%Energy (in)dependence - Crude Oil
Export - Import / Consumption
Ag
ric
ult
ura
l (i
n)d
ep
en
de
nc
e -
Gra
ins
Exp
ort
- Im
po
rt /
Co
nsu
mp
tion
Brazil - 196
Argentina - 100
Colombia - 39
Mexico - 75
Peru - 17
Bolivia - 33
Guatemala - 2
Costa Rica - 1
Nicaragua - 3
Guyana - 1
Jamaica - 0.2
Paraguay - 16
Cuba - 3
Food Independence andOil Dependence
Food and Oil Independence
Food and Oil Dependence
Food Dependence and Oil Independence
Pasture and Prairie Land (Mha)

Food (Grains) and Energy (Crude Oil) Dependence in Africa
South Africa- 84
Mozambique - 44
Malawi -2
Tanzania- 24
Zambia- 20
Kenya - 21
Madagascar - 37
Ghana - 8
Senegal- 6
-50%
-25%
0%
25%
50%
-150% -100% -50% 0% 50% 100% 150%Energy (in)dependence - Crude Oil
Export - Import / Consumption
Ag
ric
ult
ura
l (i
n)d
ep
en
de
nc
e -
Gra
ins
Exp
ort
- Im
po
rt / C
on
sum
ptio
n
South Africa- 84
Mozambique - 44
Malaw i -2
Tanzania- 24
Zambia- 20
Kenya - 21
Mauritius- 0.007
Reunion - 0.02
Madagascar - 37
Ghana - 8
Senegal- 6
Food Independence andOil Dependence
Food and Oil Independence
Food and Oil dependence
Food Dependence and Oil independence
Pasture and Prairie Land (Mha)
Source: FAO (2008), IEA (2008)

Sugarcane, Products and Trade in Selected Latin American & Caribbean Countries
Sources: ISO (2010), FAO (2008), FAO (2009)

Estimating ethanol production from C sugar and molasses in Latin America
Country
C sugar Molasses
Available Raw
Material
106 ton
Ethanol
Produced
106 liters
Available Raw
Material
106 ton
Ethanol
Produced
106 liters
Argentina 1.59 550 1.10 263
Bolivia 0.40 137 0.28 67
Brazil 36.78 12,696 25.86 6,208
Colombia 2.05 708 1.44 347
Costa Rica 0.22 75 0.16 39
Cuba 0.79 274 0.55 133
Guatemala 1.14 395 0.47 112
Guyana 0.19 64 0.12 28
Jamaica 0.11 36 0.08 20
Mexico 2.72 940 1.57 377
Nicaragua 0.29 100 0.17 40
Paraguay 0.27 94 0.18 44
Peru 0.54 186 0.38 91
Using:Anhydrous Ethanol from C Sugar = 18.4 l/tcProduction of Molasses = 37.5 kg/tcProduction of Ethanol from Molasses = 240 l/t of molasses
Source: CASTANHEDA AYARZA, J., (2007)

50
Table 6. Sugarcane, Products and Trade in Selected African Countries
Country **Sugarcane production
x106 ton
**Sugarcane harvested
x10³ ha
Sugar Production
x 103 ton
Sugar Consumption
x 10³ ton
Sugar Import
x 10³ ton
Sugar Export
x 10³ ton
*Molasses Export
x 10³ ton
*Molasses Import
x 10³ ton
Ghana 0.15 6 0 245 245 0 0 14
Kenya 5.11 55 585 850 375 20 1.78 11.24
Madagascar 2.6 82 16 153 152 15 0 8.6
Malawi 2.5 23 310 191 NAD 119 5.43 1.3
Mauritius 4.53 62 495 43 15 467 73.35 0.6
Mozambique 2.45 180 400 200 NAD 200 16.22 13 @Reunion 1.77 25 NAD NAD NAD NAD NAD NAD
Senegal 0.84 7 100 220 120 NAD 2.94 2.2
South Africa 20.5 314 2,270 1,980 260 550 68 173.4
Tanzania 2.37 23 335 425 140 50 25.93 23.99
Zambia 2.5 24 450 130 NAD 320 6.42 1.1
Source: ISO (International Sugar Organization), 2010 *FAO, 2008 **FAO, 2009
NAD= Not Available Data @ French Overseas Territory
Sugarcane, Products and Trade in Selected African Countries

Estimating ethanol production from C sugar and molasses in Africa
Country
C sugar
Molasses
Available Raw
Material
106 ton
Ethanol
Produced
106 liters
Available Raw
Material
106 ton
Ethanol
Produced
106 liters
Ghana 0.01 3 0.02 5
Kenya 0.27 94 0.20 48
Madagascar 0.14 48 0.11 25
Malawi 0.13 46 0.09 22
Mauritius 0.24 83 0.10 23
Mozambique 0.13 45 0.09 21
Reunion 0.09 33 0.07 16
Senegal 0.04 15 0.03 7
South Africa 1.09 377 0.87 210
Tanzania 0.13 44 0.09 21
Zambia 0.13 46 0.09 21
Anhydrous Ethanol from C Sugar = 18.4 l/tcProduction of Molasses = 37.5 kg/tcProduction of Ethanol from Molasses = 240 l/t of molasses
Source: DFID (2007) Jumbe et al (2009)

Pre-Estimating ethanol production from C sugar and molasses in LA and AF
Region
C sugar
Molasses
Available Raw
Material
106 ton
Ethanol
Produced
106 liters
Available Raw
Material
106 ton
Ethanol
Produced
106 liters
Latin America & Caribbean 49.38 17,048 33.73 8,094
Africa 4.95 1,709 3.07 738
Sources: CASTANHEDA AYARZA, J.(2007); DFID (2007) Jumbe et al (2009)