Embed Size (px)
Citation preview
Understanding scalability and performance requirements of I/O intensive applicationson future multicore servers
Shoaib Akram, Manolis Marazakis, and Angelos BilasFoundation for Research and Technology - Hellas (FORTH)
Institute of Computer Science (ICS)100 N. Plastira Av., Vassilika Vouton, Heraklion, GR-70013, Greece
Email: {shbakram,maraz,bilas}@ics.forth.gr
I. ABSTRACT
Today, there is increased interest in understanding theimpact of data-centric applications on compute and storageinfrastructures as datasets are projected to grow dramatically.In this paper, we examine the storage I/O behavior of twelvedata-centric applications as the number of cores per servergrows. We configure these applications with realistic datasetsand examine configuration points where they perform signifi-cant amounts of I/O. We propose using cycles per I/O (cpio)as a metric for abstracting many I/O subsystem configurationdetails. We analyze specific architectural issues pertaining todata-centric applications including the usefulness of hyper-threading, sensitivity to memory bandwidth, and the potentialimpact of disruptive storage technologies.
Our results show that today’s data-centric applications arenot able to scale with the number of cores: moving from oneto eight cores, results in 0% to 400% more cycles per I/Ooperation. These applications can achieve much of their per-formance with only 50% of the memory bandwidth availableon modern processors. Hyper-threading is extremely effectiveand applications perform with in 15% of what is achievedwith full cores instead of hyper-threading. Further, DRAM-type persistent memory has the potential to solve scalabilitybottlenecks by reducing or eliminating idle and I/O completionperiods and improving server utilization. Projecting in thefuture for an increasing numbers of cores, at 4096 processors,servers would require between 250-500 GBytes/s per serverand we will need about 2.5M servers that will consume 24BKWh of energy to do a single pass over the projected 35Zeta Bytes of data around 2020.
II. INTRODUCTION AND MOTIVATION
Recently, there has been increased interest in examininghow modern data-centric infrastructures will cope with thealarming rate of data growth; Published reports [1] evaluatethe trends in data growth and show that by 2020 we willneed to cope with 35 Zeta Bytes (ZB) of stored information.This growth is mainly driven by our ability to generateand collect more information at all levels of human activityand by new business models and services. In this context,there are increasing concerns that existing applications andinfrastructures will not be able to cope with this growth indata, limiting our ability to process available information.These trends are represented by data-centric applications that
are currently driving the shift towards the design of systemsthat process data rather than perform computation on memoryresident datasets [2]. A particular concern when designing suchsystems is the efficiency and scalability of the I/O stack dueto the I/O intensive nature of most data-centric applications.
For this reason, there has been work in understandinghow our data processing infrastructures will cope with dataas well as how they are projected to scale in the future,mainly with processor technology and the number of cores.The predominant approach for scaling modern applications tomany cores is to improve our current system and softwarestacks for handling parallelism better. Wickizer et al. [3]report many scalability bottlenecks in today’s system stacks.However, this approach of scaling the underlying system tolarger numbers of cores is not straight-forward. For this reason,another possible approach, as advocated e.g. by Salomie etal. [4], is to “distribute” multiple instances of the sameapplication as a means of utilizing additional cores.
To date, little attention has been paid to how I/O activity inapplications scales with the number of cores and the resultingimplications on data-centric applications and infrastructures.For instance, results reported in [3] consider only I/O toan in-memory filesystem. Moreover, lately there has beenincreased interest and work on projecting I/O requirementsto the 2020 timeframe [5], [6]. These projections mainly aimto identify I/O requirements at the infrastructure and server-level and estimate potential limitations or set design targets.However, existing studies use market growth rate for storageand processing capability to project storage I/O requirementsof servers and infrastructures making it difficult to examinethe impact of specific optimizations and techniques.
In this work we tackle these issues by examining twelveapplications that operate on data. We perform extensive mea-surements for calculating and understanding cpio for theseapplications that are currently used for servicing, profiling,analyzing and managing data (SPAMD). We start from mea-surements on servers representative of most modern data-centric infrastructures. We ensure that applications are oper-ating at configuration points where they perform significantamount of I/O operations while generating maximum loadfor the processor. This is not a straight-forward step as mostapplications require extensive tuning or modifications to reachthis state. Further, it requires extensive effort to tune the run-time parameters and collect datasets that are representative of
future workloads. We characterize each application and presentan analysis of its behavior with respect to I/O.
We first examine data-centric applications scale with thenumber of cores from an I/O point of view. We examinethe impact of hardware multi-threading, sensitivity to memorybandwidth, and the impact of memory-based persistent I/O. Wepropose using cycles per I/O (cpio) as an overall metric thatabstracts system-level details and is able to capture applicationbehavior. We discuss how we measure cpio and then we useit to investigate the issues above by performing measurementson a real system with realistic workloads. We focus on thefollowing questions:
• How does the amount of I/O performed by applicationsincreases with the number of cores and what happens tothe number of cycles per I/O?
• Should processors targeted for data-centric applicationssupport hyper-threading?
• What is the impact of memory bandwidth on applicationbehavior?
• To what extent can “storage-class-memories” improve thescalability of modern applications to many cores?
Then, we perform a range of projections for infrastructuresize and server I/O requirements as datasets and the numberof cores per server grows in the 2020-timeframe. We use ourmeasurements and a simple linear model to set targets forI/O requirements in future servers and to also provide a firstapproximation of the infrastructure size that will be required toprocess the data produced in 2020. We focus on the followingquestions:
• What I/O requirements, in terms of throughput and IOPS,will a server have as the number of cores grows?
• What infrastructure size in terms of the number ofservers/cores and energy will be required to process datain the 2020-timeframe?
We compare our projections using cpio with estimates frommarket growth and find that the two approaches result in com-patible numbers. However, unlike market growth information,our approach using cpio allows for projecting the impact ofnew designs and techniques on application and infrastructureI/O efficiency.
Overall, our work is a step towards building a methodologyfor evaluating and understanding the impact of architecturaland systems software optimizations and extensions on data-centric applications and infrastructures. Our results indicatethat:
• Compared to one core, applications spend from 0% up to400% more cycles per I/O with 8 cores.
• On average, for twelve data-centric workloads, there isonly a 15% increase in cycles per I/O when hyper-threading is used instead of full cores.
• On average, for seven data-centric workloads, there isonly a 20% increase in cycles per I/O, when memorybandwidth per core is reduced by 37%.
• Persistent storage operating at the speed of DRAM isable to fully eliminate periods from the execution time
where applications merely wait for I/Os to complete.Idle periods, although not fully, but to a great extent areeliminated from the execution time.
• If applications scale according to our optimistic assump-tions, servers with 4096 cores will need to support storageI/O throughput between 250-500 GB/s.
• A one pass over the entire dataset that will be producedin 2020 will require 18 billion kWh given current serverpower, idle power, and scalability trends. This energy willbe consumed by 2.5 million servers operating for one yearat low utilization levels observed today. We show that,whereas architectural improvements such as reducing idlepower and minimizing total server power will result in upto 2x saving in energy consumption, scaling applicationsto reduce per I/O overhead has the potential to reduceenergy consumption by a factor of 100x.
The rest of this paper is structured as follows. In Section III,we describe a methodology for characterizing and projectingI/O behavior. Section IV describes a set of applications that op-erate with big datasets. Section V discusses our experimentalplatforms and observed behavior of applications. Section VIprovides measurements from experiments and Section VIIprovides projections for future. Finally, Section VIII discussesrelated work and Section IX concludes the work.
III. METHODOLOGY
In this section we describe our methodology for character-izing I/O behavior based on cycles per I/O.
A. Using cpio to characterize data-centric applications
Characterizing I/O is a complicated process. This is particu-larly true today, with storage systems that include many layers,components, and perform complex functions transparently tothe applications. For this reason it is important to use metricsthat can abstract the details of today’s storage subsystems andtheir interaction with applications. We propose using cyclesper I/O operation (cpio ) as a metric to quantify applicationbehavior from an I/O point of view. We also propose to usecpio for projecting the scalability and requirements of data-centric applications.
We calculate cpio for each application by running eachapplication in a meaningful configuration; applications whenrun, should generate I/O traffic. For instance, cases where theworkload fits in the available memory and exhibit low I/O areprobably not typical of future configurations since the demandfor data grows faster than DRAM capacity. For this purpose,we select datasets that are big enough to not fit in memoryand generate I/O throughout execution.
We measure the average execution time breakdown asreported by the OS consisting of user, system, idle, andwait time. Linux reports the CPU utilization numbers in“USER HZ” which is 100 ms on our systems. The conversionfrom USER HZ to physical cycles is straightforward given thefrequency of each core is known. We also note the number ofI/Os (NIOS) that occurred during the same interval countingboth read and write operations. There are two issues related
to the cpio calculation. First, what each of the componentsmeans and second which ones should be taken into accountto come up with a meaningful metric. We next briefly explainwhat each component of the breakdown means.
User time refers to the time an application spends executingcode in the user space. When the user application requestservices by the OS, the time spent is classified as systemtime. The time an application spends waiting for I/Os tocomplete is classified as iowait time. Idle time refers to thetime during which the application either has no more work toperform within its allocated quantum or because it is waitingfor resources that are not available, for instance, locks.
Given this, cpio can be calculated as follows: Either dividethe total number of cycles with the number of I/Os includingidle and iowait time or by excluding these two components.The first approach is valid for cases where it is difficult toscale the application and consume all available CPU cycles.This is common today given the complexity of applicationsand the increasing number of cores. This first approach isalso more representative of systems where idle cycles costsignificantly (disproportionally) in terms of energy which isthe situation today [7]. However, given that one of our goalsis to quantify issues in a longer timeframe and that thereis currently significant research interest in providing energyproportionality in future systems, we choose to exclude idleand wait cycles from the cpio calculation, assuming that thesecycles have no cost.
A second issue is what should be used as the number ofI/Os. Typically in I/O intensive applications, there are multipleparameters that can characterize I/O behavior: the size of eachI/O (e.g. small vs. large), the type of I/O (read or write), theaccess pattern (e.g. sequential vs. random), and the number ofoutstanding I/Os. In many cases it is difficult or impossible tocapture this behavior and associate this to application behavior.In our work, we use a fixed and predefined size of 512 bytesas the number of I/Os that occur during execution. We choosethe size to be 512 bytes which is a typical size for the sectorsin many (but not all) storage devices. The main implicationis that the overhead per I/O in an application that does largeI/Os will appear to be smaller per I/O. We consider this tobe a desirable situation, since an application (or system) thatstrives to achieve large I/Os should be perceived as a goodcase. Finally, note that the CPU utilization and I/O numbers werefer to are cumulative for the whole system and the executionwindow we consider regardless of the number of cores ordifferent phases in the application.
Thus, cpio is calculated by dividing the user plus systemcycles as reported by the OS with the total number of sectorsread and written throughout the execution of application. In allour measurements, we run applications long enough to capturetheir typical behavior.
The advantages of using cpio as a metric to examine data-centric applications are: 1) Application-level metrics, such astransactions or events do not represent the actual volume ofdata that pass through the I/O subsystem. cpio , on the otherhand, takes both compute and I/O resources consumed into
account. 2) Individual components of cpio are able to pointtowards inefficiencies in different components of today’s com-plex software stacks. For instance, the ability to quantify user-level versus system-level overheads. 3) Given the peak and idlepower of a server, cpio can be converted to energy consumedper I/O operation. 4) When running multiple applications eachwith its performance metric, it is difficult to analyze the overallsystem performance. cpio serves as a system-wide metric ofefficiency in such scenarios. 5) cpio has predictive value and isable to project future infrastructure requirements as discussedin the next section.
B. Using cpio as the basis for projections
We use cpio to project application requirements, as follows.A multi-core processor with N cores, each with a frequencyF , has a total capacity of Cn physical cycles during an intervalT , given by Cn= N ∗ F ∗ T . We define the CPU utilization,µ, as Cp/ Cn, where Cpis the sum of user and system cyclesduring execution. NIOS is the total number of 512-byte I/Osperformed by an application during an interval T. Using theabove, cpio can be expressed as:
cpio = (µ ∗N ∗ F ∗ T )/NIOS. (1)
To calculate IOPS that I/O subsystems will need to supportwith increasing number of cores, we use the following equa-tion:
IOPS = (µ ∗N ∗ F )/cpio. (2)
Note that, in Equation 1, IOPS = NIOS/T .We assume a frequency of 2 GHz for each core in future
servers, opting for the current trend of a larger number ofslower cores. To estimate the size of infrastructures in data-centres we use Equation 2 to find throughput of applications.We then assume a particular size for the dataset and a timeframe with in which to process the dataset. This provides uswith the number of cores (or servers) required to process theprojected amount of data. We then use various assumptionsabout the power of mid-range servers in 2020 to estimateenergy consumption of all the servers.
IV. SPAMD APPLICATIONS
In this section we discuss how we configure the applicationswe use to perform large amounts of I/O and the datasets weuse. Table I summarizes these characteristics.
Asynchronous direct I/O (zmIO) is an in-house micro-benchmark able to provide data rates close to maximum stor-age bandwidth, using the asynchronous I/O API of the Linuxkernel to issue concurrent I/Os at low CPU utilization. It servesas a reference point quantifying the maximum achievableperformance in today’s systems [8].
File system stress tests can reveal the behaviour of metadata-intensive workloads. We use a modified version of fs mark [9]to stress filesystem operations individually. Each fs markthread performs a sequence of operations on a private filewithin a shared directory.
Checkpointing of high performance computing (HPC) ap-plications generates large amounts of I/O. We use IOR [10]
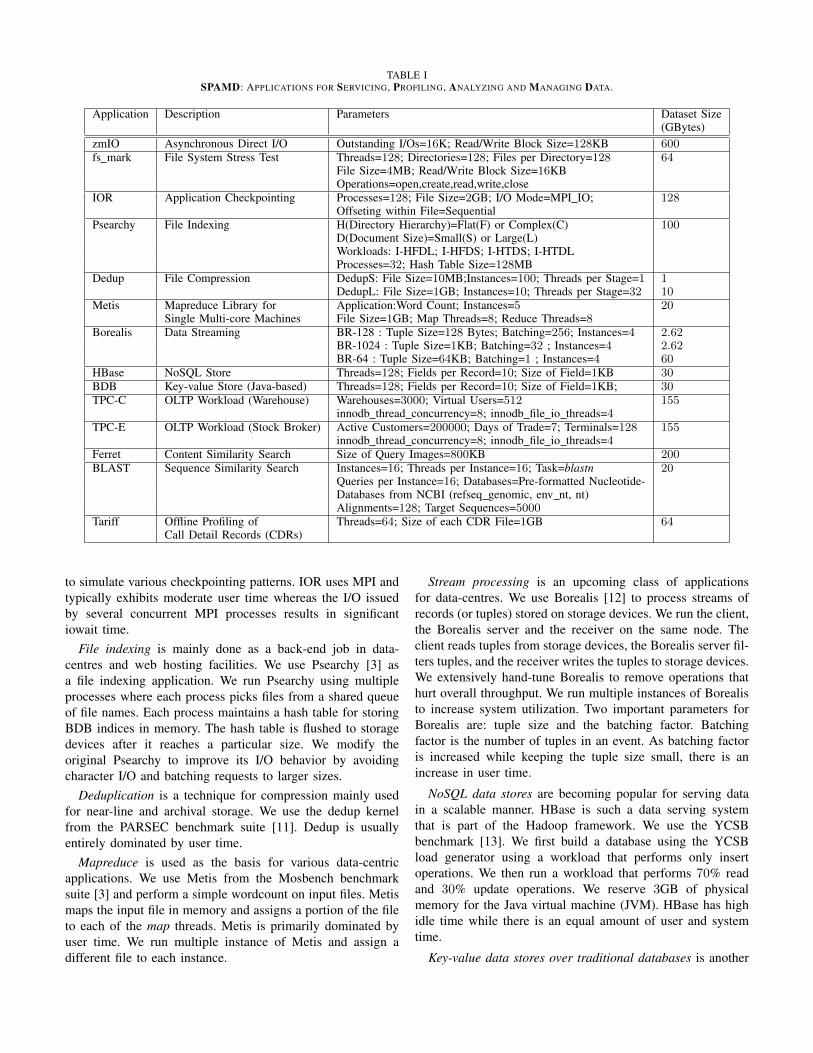
TABLE ISPAMD: APPLICATIONS FOR SERVICING, PROFILING, ANALYZING AND MANAGING DATA.
Application Description Parameters Dataset Size(GBytes)
zmIO Asynchronous Direct I/O Outstanding I/Os=16K; Read/Write Block Size=128KB 600fs mark File System Stress Test Threads=128; Directories=128; Files per Directory=128 64
File Size=4MB; Read/Write Block Size=16KBOperations=open,create,read,write,close
IOR Application Checkpointing Processes=128; File Size=2GB; I/O Mode=MPI IO; 128Offseting within File=Sequential
Psearchy File Indexing H(Directory Hierarchy)=Flat(F) or Complex(C) 100D(Document Size)=Small(S) or Large(L)Workloads: I-HFDL; I-HFDS; I-HTDS; I-HTDLProcesses=32; Hash Table Size=128MB
Dedup File Compression DedupS: File Size=10MB;Instances=100; Threads per Stage=1 1DedupL: File Size=1GB; Instances=10; Threads per Stage=32 10
Metis Mapreduce Library for Application:Word Count; Instances=5 20Single Multi-core Machines File Size=1GB; Map Threads=8; Reduce Threads=8
Borealis Data Streaming BR-128 : Tuple Size=128 Bytes; Batching=256; Instances=4 2.62BR-1024 : Tuple Size=1KB; Batching=32 ; Instances=4 2.62BR-64 : Tuple Size=64KB; Batching=1 ; Instances=4 60
HBase NoSQL Store Threads=128; Fields per Record=10; Size of Field=1KB 30BDB Key-value Store (Java-based) Threads=128; Fields per Record=10; Size of Field=1KB; 30TPC-C OLTP Workload (Warehouse) Warehouses=3000; Virtual Users=512 155
innodb thread concurrency=8; innodb file io threads=4TPC-E OLTP Workload (Stock Broker) Active Customers=200000; Days of Trade=7; Terminals=128 155
innodb thread concurrency=8; innodb file io threads=4Ferret Content Similarity Search Size of Query Images=800KB 200BLAST Sequence Similarity Search Instances=16; Threads per Instance=16; Task=blastn 20
Queries per Instance=16; Databases=Pre-formatted Nucleotide-Databases from NCBI (refseq genomic, env nt, nt)Alignments=128; Target Sequences=5000
Tariff Offline Profiling of Threads=64; Size of each CDR File=1GB 64Call Detail Records (CDRs)
to simulate various checkpointing patterns. IOR uses MPI andtypically exhibits moderate user time whereas the I/O issuedby several concurrent MPI processes results in significantiowait time.
File indexing is mainly done as a back-end job in data-centres and web hosting facilities. We use Psearchy [3] asa file indexing application. We run Psearchy using multipleprocesses where each process picks files from a shared queueof file names. Each process maintains a hash table for storingBDB indices in memory. The hash table is flushed to storagedevices after it reaches a particular size. We modify theoriginal Psearchy to improve its I/O behavior by avoidingcharacter I/O and batching requests to larger sizes.
Deduplication is a technique for compression mainly usedfor near-line and archival storage. We use the dedup kernelfrom the PARSEC benchmark suite [11]. Dedup is usuallyentirely dominated by user time.
Mapreduce is used as the basis for various data-centricapplications. We use Metis from the Mosbench benchmarksuite [3] and perform a simple wordcount on input files. Metismaps the input file in memory and assigns a portion of the fileto each of the map threads. Metis is primarily dominated byuser time. We run multiple instance of Metis and assign adifferent file to each instance.
Stream processing is an upcoming class of applicationsfor data-centres. We use Borealis [12] to process streams ofrecords (or tuples) stored on storage devices. We run the client,the Borealis server and the receiver on the same node. Theclient reads tuples from storage devices, the Borealis server fil-ters tuples, and the receiver writes the tuples to storage devices.We extensively hand-tune Borealis to remove operations thathurt overall throughput. We run multiple instances of Borealisto increase system utilization. Two important parameters forBorealis are: tuple size and the batching factor. Batchingfactor is the number of tuples in an event. As batching factoris increased while keeping the tuple size small, there is anincrease in user time.
NoSQL data stores are becoming popular for serving datain a scalable manner. HBase is such a data serving systemthat is part of the Hadoop framework. We use the YCSBbenchmark [13]. We first build a database using the YCSBload generator using a workload that performs only insertoperations. We then run a workload that performs 70% readand 30% update operations. We reserve 3GB of physicalmemory for the Java virtual machine (JVM). HBase has highidle time while there is an equal amount of user and systemtime.
Key-value data stores over traditional databases is another
approach to building NoSQL stores. BDB is a library thatprovides support for building data stores based on key-valuepairs. Our evaluation methodology for BDB is similar to thatfor HBase. Since BDB is an embedded data store, the YCSBclients and the BDB code share the same process addressspace. We reserve 6GB of physical memory for the JVM.We configure YCSB to use 3GB for the YCSB clients and3GB for BDB. BDB is dominated by user time but there isconsiderable system time.
Online transaction processing (OLTP) is an important classof workloads for data-centres. We use TPC-C and TPC-E asOLTP workloads. TPC-C models an order-entry environmentof a wholesale supplier while TPC-E models transactions thattake place in a stock brokerage firm. We run both TPC-Cand TPC-E using MySQL and specify runtime parameters thatresult in high concurrency. We use an open-source version ofTPC-C called Hammerora [14]. We run the hammerora clientsand the MySQL database server on the same machine. Weobserve that hammerora clients consume very little percentageof the entire CPU utilization in our experiments. We run TPC-C with 6GB RAM which results in realistic amount of I/O forour chosen database. We observe that using MySQL databaseserver results in high idle time for both TPC-C and TPC-E.
Content similarity search is used in data-centres that hoste.g. social networking services [11]. We use Ferret fromthe PARSEC benchmark suite. Ferret is compute intensiveand performs sustained but small amount of I/O. We fit thedatabase of image signatures against which queries are run inmemory. Ferret is dominated by user time.
Comparative genomics leverages the tremendous amountof genomic data made possible by advances in sequencingtechnology. We use BLAST [15] for Nucleotide-Nucleotidesequence similarity search. We run multiple instances ofBLAST each executing a different set of queries on a separatedatabase. We use random query sequences of 5KB, whichis a common case in proteome/genome homology searches.BLAST is I/O intensive and the execution time is dominatedby user time.
Profiling of call detail records (CDRs) by telecommunica-tion service providers is performed for analyzing the feasibilityof various usage plans. We use TariffAdvisor (Tariff) that doesoffline profiling of CDRs using machine learning models. Theinput to Tariff is a set of files that each contains differentplans offered by the operator to the users. Tariff analyzes therecords covering a period of time and outputs the plans that arefinancially productive. Tariff uses PostgreSQL as the databasemanagement system. Tariff is an I/O intensive application andits runtime is dominated by user time.
V. EXPERIMENTAL PLATFORM
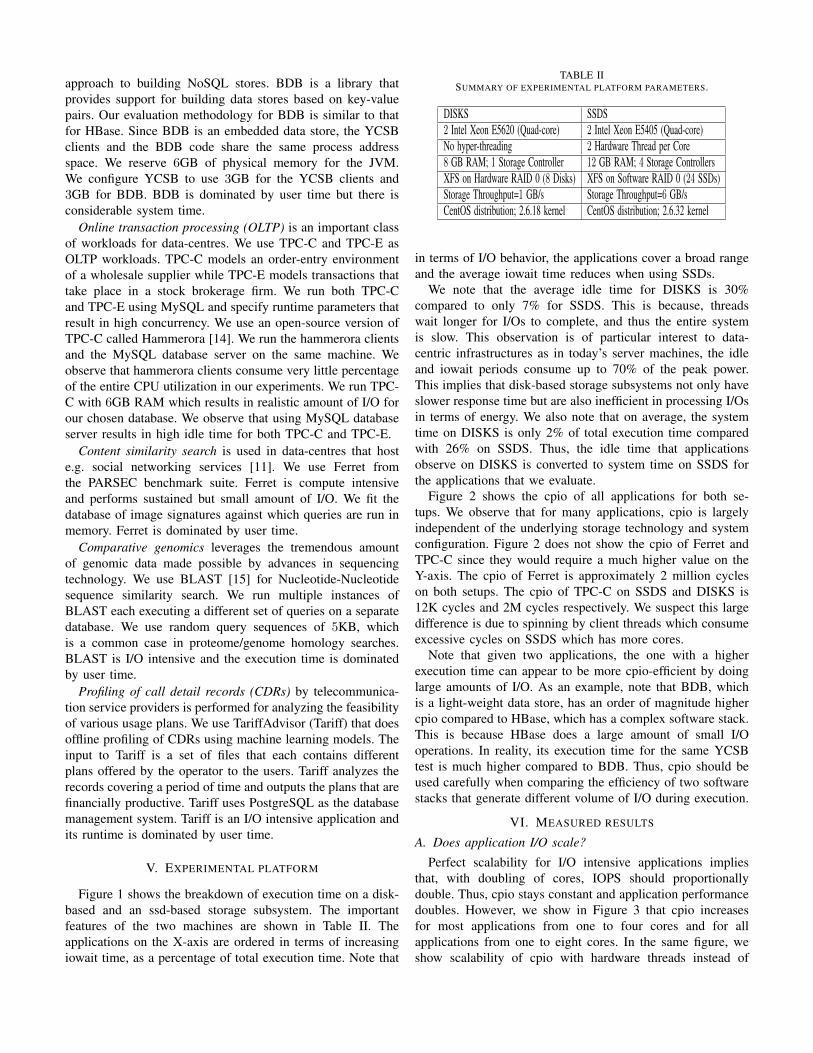
Figure 1 shows the breakdown of execution time on a disk-based and an ssd-based storage subsystem. The importantfeatures of the two machines are shown in Table II. Theapplications on the X-axis are ordered in terms of increasingiowait time, as a percentage of total execution time. Note that
TABLE IISUMMARY OF EXPERIMENTAL PLATFORM PARAMETERS.
DISKS SSDS2 Intel Xeon E5620 (Quad-core) 2 Intel Xeon E5405 (Quad-core)No hyper-threading 2 Hardware Thread per Core8 GB RAM; 1 Storage Controller 12 GB RAM; 4 Storage ControllersXFS on Hardware RAID 0 (8 Disks) XFS on Software RAID 0 (24 SSDs)Storage Throughput=1 GB/s Storage Throughput=6 GB/sCentOS distribution; 2.6.18 kernel CentOS distribution; 2.6.32 kernel
in terms of I/O behavior, the applications cover a broad rangeand the average iowait time reduces when using SSDs.
We note that the average idle time for DISKS is 30%compared to only 7% for SSDS. This is because, threadswait longer for I/Os to complete, and thus the entire systemis slow. This observation is of particular interest to data-centric infrastructures as in today’s server machines, the idleand iowait periods consume up to 70% of the peak power.This implies that disk-based storage subsystems not only haveslower response time but are also inefficient in processing I/Osin terms of energy. We also note that on average, the systemtime on DISKS is only 2% of total execution time comparedwith 26% on SSDS. Thus, the idle time that applicationsobserve on DISKS is converted to system time on SSDS forthe applications that we evaluate.
Figure 2 shows the cpio of all applications for both se-tups. We observe that for many applications, cpio is largelyindependent of the underlying storage technology and systemconfiguration. Figure 2 does not show the cpio of Ferret andTPC-C since they would require a much higher value on theY-axis. The cpio of Ferret is approximately 2 million cycleson both setups. The cpio of TPC-C on SSDS and DISKS is12K cycles and 2M cycles respectively. We suspect this largedifference is due to spinning by client threads which consumeexcessive cycles on SSDS which has more cores.
Note that given two applications, the one with a higherexecution time can appear to be more cpio-efficient by doinglarge amounts of I/O. As an example, note that BDB, whichis a light-weight data store, has an order of magnitude highercpio compared to HBase, which has a complex software stack.This is because HBase does a large amount of small I/Ooperations. In reality, its execution time for the same YCSBtest is much higher compared to BDB. Thus, cpio should beused carefully when comparing the efficiency of two softwarestacks that generate different volume of I/O during execution.
VI. MEASURED RESULTS
A. Does application I/O scale?
Perfect scalability for I/O intensive applications impliesthat, with doubling of cores, IOPS should proportionallydouble. Thus, cpio stays constant and application performancedoubles. However, we show in Figure 3 that cpio increasesfor most applications from one to four cores and for allapplications from one to eight cores. In the same figure, weshow scalability of cpio with hardware threads instead of

0%
20%
40%
60%
80%
100%
Ferret
DedupL
TPC-C
zmIO
BR-128
BR-1024
I-HTD
L
HBase
I-HTD
S
fsmark
BLAST
IOR
I-HFD
S
DedupS
BR-64
I-HFD
L
BDB
TPC-E
Metis
Tariff
user system idle iowait
(a) DISKS
0%
20%
40%
60%
80%
100%
BR-128
zmIO
BR-1024
BR-64
Ferret
Tariff
Metis
DedupL
DedupS
BLAST
TPC-C
BDB
TPC-E
HBase
I-HFD
S
I-HTD
S
IOR
I-HTD
L
I-HFD
L
fsmark
user system idle iowait
(b) SSDS
Fig. 1. Breakdown of execution time in terms of user, system, idle, and iowait time on DISKS and SSDS.
0
5
10
15
20
25
zmIO
fsm
ark
I-H
FDL
I-H
TDL
HB
ase
BR
-64
I-H
TDS
I-H
FDS
TPC
-E
Tho
usa
nd
s
cpio (SSDS)
cpio (DISKS)
0
50
100
150
200
250
IOR
BD
B
BR
-10
24
Tari
ff
De
du
pL
De
du
pS
BR
-12
8
Me
tis
Tho
usa
nd
s
cpio (SSDS)
cpio (DISKS)
Fig. 2. cpio on DISKS and SSDS.
cores. In Figure 3(b), we use one and two cores per socket onSSDS and enable hyper-threading to experiment with four andeight hardware threads. We note that the scalability trend is thesame with increasing hardware threads as seen with increasingcores.
Next we show how well applications are able to use cyclesmade available by more cores for processing additional I/Os.Figure 5 shows how µ changes from one to multiple cores.From one to eight cores, µ drops for most applications, and upto 0.68 from one. Further, from one to 16 hardware threads, µdrops to below 0.5 for HBase, BDB, TPC-C and I-HFDL. Thisdrop is because as more cores are added, either iowait and/oridle time increases. Thus, as applications strive to performmore I/O operations with increasing number of cores, synchro-nization overhead becomes one of the primary bottlenecks toscalability. For other workloads, in particular Dedup, Metis,Tariff, and BR-1024, µ does not drop significantly.
B. Are hyper-threads effective?
In this subsection we show the effectiveness of hyper-threading for data-centric applications. Schone et al., recentlyshowed the (slightly) negative impact of hyper-threading onperformance [16]. However, they experimented with all coresand hyper-threading enabled. With all cores utilized, it isdifficult to analyze if any particular feature is the bottleneck.Therefore, we evaluate hyper-threading with different numberof cores. Figure 6 shows cpio for different number of coresboth with and without hyper-threading enable (normalized tocpio with four cores). We note that, for most applications, thereis no significant increase in cpio using four cores with hyper-threading (4C+HT) instead of eight cores (8C). In particular,most applications observe only a 20% increase in cpio when
0
1
2
3
4
5
Metis
BR-1024
I-HFD
L
TPC-E
TPC-C
Ferret
DedupL
IOR
HBase
BDB
Tariff
fsmark
4 8
(a) Cores
0
1
2
3
4
5
Metis
BR-1024
I-HFD
L
TPC-E
TPC-C
Ferret
DedupL
IOR
HBase
BDB
Tariff
fsmark
4 8
(b) Hardware Threads
Fig. 3. Increase in cpio (Y-axis) normalized to the cpio with one core (a)and with one hardware thread (b).
0
100
200
300
400
500
600
700
Metis
BR-1024
I-HFD
L
TPC-E
TPC-C
DedupL
IOR
HBase
BDB
Tariff
fsmark
1024 2048 4096
Fig. 4. Increase in cpio (Y-axis) from 1 to many cores normalized to cpiowith one core.
hardware threads are used instead of full cores thus achievingperformance within 80% of performance with full core.
This figure also shows that, for half of the workloads, cpioincreases significantly with 16 hardware threads. Given ourearlier observation that cores and hardware threads follow asimilar scalability trend, we believe that, what we observed for16 hardware threads, will be the case for 16 cores. Our resultsindicate that the increase in cpio is contributed both by theuser and system component. Thus, we infer that the I/O stackin current systems do not scale because of resource contentionfor shared resources, for instance, a single page cache sharedacross all software threads.
C. How much memory bandwidth?
An important question for data-centric applications is howmuch memory bandwidth is sufficient for scalability to manycores. We answer this question by analyzing the sensitivityof applications to memory bandwidth. Scientific applicationsare known to be less sensitive to memory bandwidth, becausecomputing complex addresses generated by these applicationshides the memory latency [17]. Since it is difficult to estimate

0.00
0.10
0.20
0.30
0.40
0.50
0.60
0.70
0.80
0.90
1.00
0 2 4 6 8 10 12 14 16
α
Number of Cores
Metis
Bor1024
HFDL
TPC-E
TPC-C
Ferret
DedupL
IOR
HBase
BDB
Tarrif
fsmark
Fig. 5. Drop in CPU utilization (µ) from 1 to 16 cores.
0%10%20%30%40%50%60%70%80%90%100%
00.5
11.5
22.5
33.5
44.5
5
TPC
-C
fsm
ark
TPC
-E
BD
B
Ferr
et
IOR
HB
ase
BR
-10
24
I-H
FDL
De
du
pL
4C 2C+HT 8C 4C+HT 8C+HT 8C Vs. 4C+HT
Fig. 6. Effectiveness of hyper-threading for data-centric applications.
what future technologies might be capable of providing, weproject memory bandwidth demand in future that is sufficientfor scaling current performance standards to many cores. First,the maximum bandwidth on SSDS is 21 GB/s. This implies abandwidth of 1.3125 GB/s per core. We measure the increasein cpio by a decrease in memory bandwidth. For this, wewrote a microbenchmark modeled after STREAM [18] calledmstress that stresses the memory subsystem. We run multipleinstances of mstress along with an application from Table I.We note the aggregate memory bandwidth consumed by themstress instances. Figure 7 shows the percentage increase incpio of the application when part of the memory bandwidthis taken by mstress. Note that most applications suffer a 20%increase in cpio but then require from 6% up to 65% lessmemory bandwidth.
D. What will be the impact of DRAM-type persistent storage?
An emerging challenge in the storage domain is to examinehow things might evolve when storage class memories [5] startto appear in real systems. Although there are various types ofmemories proposed in this category, we make a first order ap-proximation and take the simplistic approach that these mem-ories will appear comparable to DRAM. However, we assumethat applications will still perform I/O via the traditional I/Opath, since this would be a first step in the evolution towardsusing storage class memories and in addition, complex data-centric applications such as transactional databases will requirefundamental changes to avoid the traditional I/O path whengoing to persistent memory. For this study, we wrote a kernelmodule (kram) that simulates a block device. kram completesI/O operations in-place without using any re-scheduling ofI/Os. The size of kram is 54 GB and the physical memory inthese experiments is 12 GB. The experiments are performed
0%10%20%30%40%50%60%70%80%90%100%
0
0.2
0.4
0.6
0.8
1
1.2
1.4
De
du
pL
I-H
TDS
Me
tis
HB
ase
fsm
ark
BR
-64
Ferr
et
BR
-10
24
I-H
FDL
IOR
GB
/s/C
ore
GB/s/Core (Sufficient) GB/s/Core (Today) % increase in cpio
Fig. 7. Memory bandwidth per core today and after tolerating an increasein cpio.
0%
20%
40%
60%
80%
100%
fsmark
I-HFD
L
I-HFD
S
I-HTD
S
I-HTD
L
BR-64
BR-128
BR-1024
IOR
HBase
BDB
TPC-C
User System Idle iowait
Fig. 8. Impact of DRAM-based storage on application behavior.
on DISKS and datasets are adjusted to fit in the availablememory.
Figure 8 shows the breakdown of execution time for selectedapplications with high iowait and idle times on SSDS. First,we see that iowait time disappears for all applications. Thisis expected since I/Os now complete upon issue without theissuing thread leaving the executing core. We note that, forcertain applications, there is still idle time either due to severeimbalances or other form of synchronization. Our observa-tions on idle time with DRAM-storage strongly indicate thatapplication scaling on many-core systems will not be simpleeven for data-centric applications that in principle exhibit largeamounts of concurrency.
VII. PROJECTED RESULTS
In this section, we use cpio to project I/O-related require-ments consumption to the 2020 time-frame. In our results,wherever we show averages for all applications, we do notinclude zmIO, fsmark, and Ferret.
A. How many cycles per I/O?
Figure 4 shows the projected increase in cpio for 1024,2048 and 4096 cores using the measured values today. Notethat, workloads such as I-HFDL, which observe only a smalloverhead in cpio with eight cores will end up spending100 times more cycles per I/O with 4096 cores. This is animportant observation given that future systems and serversthat will process data are expected to have a large number ofcores in a single enclosure.
B. How much storage bandwidth?
We calculate millions of IOPS (MIOPS) using Equation 2and use it to examine how much I/O we will need to provide

TABLE IIIMILLIONS OF IOPS (MIOPS) REQUIRED FOR DATA-CENTRIC APPLICATIONS WITH 4096 CORES.
Scenario Millions of IOPS with 4096 Coress(µ, cpio) zmIO fsmark Ferret I-HFDL I-HFDS I-HTDS I-HTDL Metis DedupS DedupL BR-64 BR-128 BR-1024 IOR Tariff BLAST HBase BDB TPC-C TPC-E Averages(l, p) - 4.56 0.02 12 - 0.67 - 1 0.60 5 2 0.4 8 35 5 - 12 2 6 9 7.5s(h, p) - 92 0.02 65 - 424 - 1 0.87 8 40 40 38 49 5 - 107 12 16 14 59s(l, t) 1228 1272 3 2207 163 151 1183 36 61 95 711 26 145 1522 128 147 563 103 321 535 476s(h, t) 14297 5038 3 4509 412 425 2822 37 68 99 812 40 183 1991 135 153 1405 215 680 743 818s(l, d) - 1297 27 2540 - 146 - 79 74 132 811 25 140 3735 87 - 644 104 797 1743 969s(h, d) - 7629 28 5941 - 405 - 80 83 148 989 38 186 5014 93 - 1652 218 1699 2469 1810
0
5
10
15
Backend DataStores
OLTP Average
s(l,t) s(h,t) % Increase
0
100
200
300
400
500
Backend DataStores
OLTP Average
s(l,t) s(h,t) % Increase
128 Cores 4096 Cores
66% 78%
143%
83% 78%
143%
83% 66%
Fig. 9. GB/s (Y-axis) required by OLTP, Data Stores, and Backendapplications in 2020. The solid line shows % increase in storage I/O froms(l, t) to s(h, t).
per server when running data-centric applications on many-core processors. Note that in Equation 2, µ and cpio, asa combination, leads to various scenarios, which we calls(µ, cpio). In this work, we consider s(l, p), s(h, p), s(l, t),s(h, t), s(h, d), s(l, d); where l and h stands for low and highutilization respectively whereas t, p and d stands respectivelyfor cpio measured today with 16 cores, projected cpio fromreal measurements and desired cpio measured with one core.
We use 100% for calculations with high utilization. Forlow utilization, we take the measured utilization with 16cores for s(l, t) and project it to many cores for s(l, p).Note again that utilization could be low for several reasonsincluding I/O bottlenecks and excessive synchronization. Thus,it is important to quantify all scenarios that may appear infuture. The variation in server utilization is also observedin today’s data-centres: The peak levels are characterized byhigh utilization, while mostly, servers operate at low levels ofutilization [19].
We consider three values for cpio for a many-core processorin 2020. The measured value with 1 core is the most optimisticassumption for a many-core processor as it is challengingto completely eradicate contention and synchronization over-heads. On the other hand, projecting from measured valuesis a very pessimistic scenario. Therefore, the measured valuewith 16 cores provides an interesting middle-ground betweenthe two extremes.
Table III shows the MIOPS per server for the four scenariosassuming applications run on a single server with 4096 cores.s(l, p) results in the lowest MIOPS characterized both by lowlevels of server utilization and high cpio. s(h, p) improvesµ and thus results in increased IOPS by a factor of 4 (onaverage). This implies that even if cpio continues to increase,applications can exploit the large amounts of raw cycles toperform more I/O Operations per second. The more desirablescenarios result with measured cpio. Further, IOPS for s(h, t)is, on average, twice the IOPS for s(l, t) showing the im-
portance of improving server utilization. Finally, using cpiowith one core (s(l, d) and s(h, d)) results in twice the IOPScompared to projected cpio.
There are workloads in Table III for which projected cpiobecomes stable with increasing cores. For instance, note thatBR-128 and I-HTDS generate the same IOPS for s(h, t) ands(h, p). These workloads observe utilization today between40%-50%. Still, note the adverse drop in throughput reportedby s(l, p) owing to increasing iowait time and idle time withmore cores.
Figure 9 shows storage throughput in terms of GB/s forall workloads grouped into three categories. We show thethroughput for a server with 128 cores and one with 4096cores. We note that all workloads require 10s of GB/s with 128cores assuming high utilization. However, for 4096 cores, therequirement is up to 500 GB/s for s(h, t) and up to 250 GB/sfor s(l, t). With the current annual growth in disk throughput,this will require thousands of disks per server. Thus, fasterand area-efficient storage devices will be required if modernapplications are able to scale to many cores. Also, providingper socket memory and I/O bandwidth in the range of 100s ofGB/s will be challenging. The servers in today’s data-centresuse network-attached storage via Ethernet or Fibre Channellinks. Thus, packaging servers with enough network cardscapable of providing multiple TB/s within expected powerbudgets will require tremendous efforts. Overall, improvingapplication stacks for better CPU utilization and less overheadper I/O, will open up new and challenging problems in thestorage and I/O domain.
C. How much energy?
We show the energy that will be needed to sweep through(in one year) all data produced in 2020. We show the energyassuming both today’s CPU utilization and full CPU utiliza-tion. We calculate energy considering idle power consumptionin servers today (70% of full power) and assuming zero idlepower. We use the measured, desired and projected cpio. Wediscard the case with projected cpio where CPU utilizationis low since it is unrealistic to have a processor with 4096cores which is mostly idle and applications spend 100x thecycles per I/O compared to what they spend on one core. Wemake different assumptions in Table IV for full power of amid-range server in 2020: a) Energy-star based server powerin 2006 (675W per server), which would correspond to about0.1 Watt per core for a 4096 core server, if achievable, b) Thesame number projected to 2020 using Energy-star’s projection(1.25 KW per server), which would correspond to about 0.2
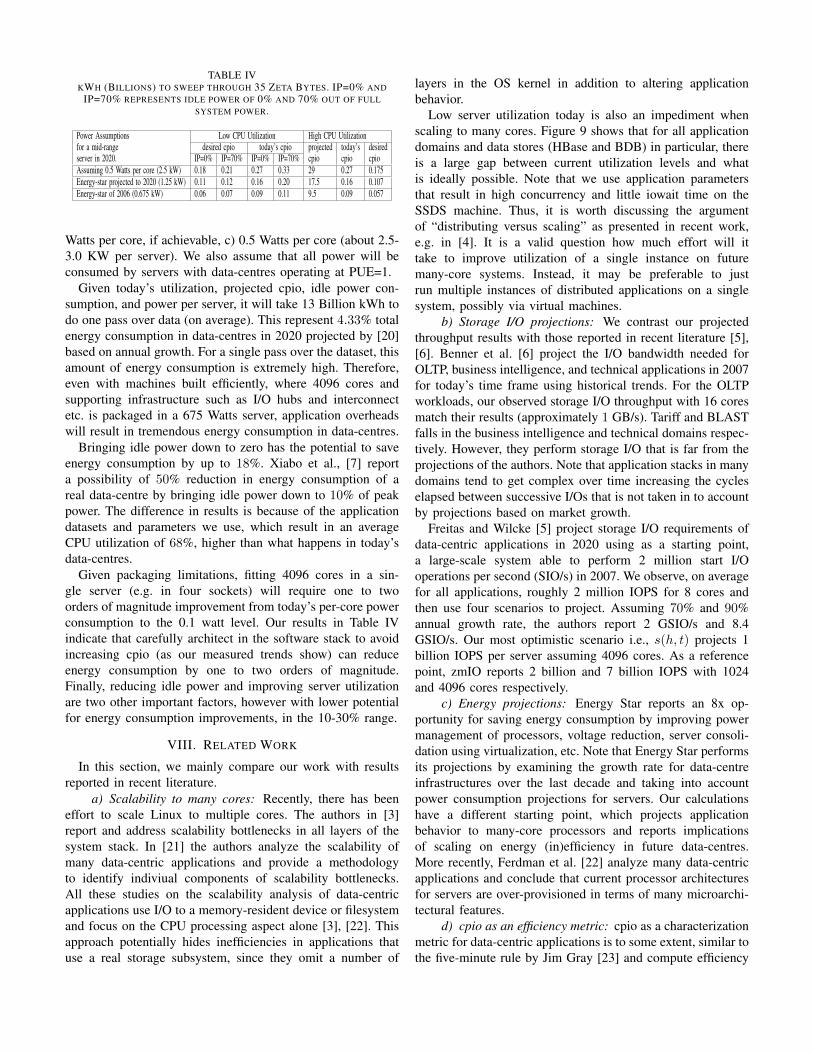
TABLE IVKWH (BILLIONS) TO SWEEP THROUGH 35 ZETA BYTES. IP=0% AND
IP=70% REPRESENTS IDLE POWER OF 0% AND 70% OUT OF FULLSYSTEM POWER.
Power Assumptions Low CPU Utilization High CPU Utilizationfor a mid-range desired cpio today’s cpio projected today’s desiredserver in 2020. IP=0% IP=70% IP=0% IP=70% cpio cpio cpioAssuming 0.5 Watts per core (2.5 kW) 0.18 0.21 0.27 0.33 29 0.27 0.175Energy-star projected to 2020 (1.25 kW) 0.11 0.12 0.16 0.20 17.5 0.16 0.107Energy-star of 2006 (0.675 kW) 0.06 0.07 0.09 0.11 9.5 0.09 0.057
Watts per core, if achievable, c) 0.5 Watts per core (about 2.5-3.0 KW per server). We also assume that all power will beconsumed by servers with data-centres operating at PUE=1.
Given today’s utilization, projected cpio, idle power con-sumption, and power per server, it will take 13 Billion kWh todo one pass over data (on average). This represent 4.33% totalenergy consumption in data-centres in 2020 projected by [20]based on annual growth. For a single pass over the dataset, thisamount of energy consumption is extremely high. Therefore,even with machines built efficiently, where 4096 cores andsupporting infrastructure such as I/O hubs and interconnectetc. is packaged in a 675 Watts server, application overheadswill result in tremendous energy consumption in data-centres.
Bringing idle power down to zero has the potential to saveenergy consumption by up to 18%. Xiabo et al., [7] reporta possibility of 50% reduction in energy consumption of areal data-centre by bringing idle power down to 10% of peakpower. The difference in results is because of the applicationdatasets and parameters we use, which result in an averageCPU utilization of 68%, higher than what happens in today’sdata-centres.
Given packaging limitations, fitting 4096 cores in a sin-gle server (e.g. in four sockets) will require one to twoorders of magnitude improvement from today’s per-core powerconsumption to the 0.1 watt level. Our results in Table IVindicate that carefully architect in the software stack to avoidincreasing cpio (as our measured trends show) can reduceenergy consumption by one to two orders of magnitude.Finally, reducing idle power and improving server utilizationare two other important factors, however with lower potentialfor energy consumption improvements, in the 10-30% range.
VIII. RELATED WORK
In this section, we mainly compare our work with resultsreported in recent literature.
a) Scalability to many cores: Recently, there has beeneffort to scale Linux to multiple cores. The authors in [3]report and address scalability bottlenecks in all layers of thesystem stack. In [21] the authors analyze the scalability ofmany data-centric applications and provide a methodologyto identify indiviual components of scalability bottlenecks.All these studies on the scalability analysis of data-centricapplications use I/O to a memory-resident device or filesystemand focus on the CPU processing aspect alone [3], [22]. Thisapproach potentially hides inefficiencies in applications thatuse a real storage subsystem, since they omit a number of
layers in the OS kernel in addition to altering applicationbehavior.
Low server utilization today is also an impediment whenscaling to many cores. Figure 9 shows that for all applicationdomains and data stores (HBase and BDB) in particular, thereis a large gap between current utilization levels and whatis ideally possible. Note that we use application parametersthat result in high concurrency and little iowait time on theSSDS machine. Thus, it is worth discussing the argumentof “distributing versus scaling” as presented in recent work,e.g. in [4]. It is a valid question how much effort will ittake to improve utilization of a single instance on futuremany-core systems. Instead, it may be preferable to justrun multiple instances of distributed applications on a singlesystem, possibly via virtual machines.
b) Storage I/O projections: We contrast our projectedthroughput results with those reported in recent literature [5],[6]. Benner et al. [6] project the I/O bandwidth needed forOLTP, business intelligence, and technical applications in 2007for today’s time frame using historical trends. For the OLTPworkloads, our observed storage I/O throughput with 16 coresmatch their results (approximately 1 GB/s). Tariff and BLASTfalls in the business intelligence and technical domains respec-tively. However, they perform storage I/O that is far from theprojections of the authors. Note that application stacks in manydomains tend to get complex over time increasing the cycleselapsed between successive I/Os that is not taken in to accountby projections based on market growth.
Freitas and Wilcke [5] project storage I/O requirements ofdata-centric applications in 2020 using as a starting point,a large-scale system able to perform 2 million start I/Ooperations per second (SIO/s) in 2007. We observe, on averagefor all applications, roughly 2 million IOPS for 8 cores andthen use four scenarios to project. Assuming 70% and 90%annual growth rate, the authors report 2 GSIO/s and 8.4GSIO/s. Our most optimistic scenario i.e., s(h, t) projects 1billion IOPS per server assuming 4096 cores. As a referencepoint, zmIO reports 2 billion and 7 billion IOPS with 1024and 4096 cores respectively.
c) Energy projections: Energy Star reports an 8x op-portunity for saving energy consumption by improving powermanagement of processors, voltage reduction, server consoli-dation using virtualization, etc. Note that Energy Star performsits projections by examining the growth rate for data-centreinfrastructures over the last decade and taking into accountpower consumption projections for servers. Our calculationshave a different starting point, which projects applicationbehavior to many-core processors and reports implicationsof scaling on energy (in)efficiency in future data-centres.More recently, Ferdman et al. [22] analyze many data-centricapplications and conclude that current processor architecturesfor servers are over-provisioned in terms of many microarchi-tectural features.
d) cpio as an efficiency metric: cpio as a characterizationmetric for data-centric applications is to some extent, similar tothe five-minute rule by Jim Gray [23] and compute efficiency

metric discussed by Anderson and Tucek [24]. A performancecomparison of different ways for managing disks in a virtual-ized environment by VMware [25] uses a metric called MHzper I/Ops which is similar to cpio. In this work, we show thatcpio is able to characterize application behavior in terms ofefficiency and scalability and it has predictive value.
IX. CONCLUSIONS
In this work we first discuss the scaling of data-centricapplication to an increasing number as well as the impact ofhyper-threading, memory bandwidth, and DRAM-type persis-tent memories to data-centric applications. Then, we discussprojections for I/O requirements in 2020 timeframe. We pro-pose using cycles per I/O (cpio) as the basis for characterizingapplications at a high-level and projecting requirements tothe future and discuss implication of different approaches tocalculate cpio.
Our measured results show that applications do not scalewell with an increasing number of cores, despite the factthat they are designed to incur high concurrency. In addition,hyper-threading works very well for these applications, whiletoday’s servers are over-provisioned in terms of memorythroughput. Finally, although DRAM-type persistent memorycan help reduce idle time in applications, it is not enough tocompletely eliminate it.
Our projections show that future servers, under scalingassumptions, will need to support 250-500 GBytes/s of I/Othroughput and that in 2020 we will need about 2.5M serversof 4096 cores and 24 BKWh of energy to do a single passover the estimated 35 ZBytes of data that will be producedwithin 2020.
Overall, our methodology is able to abstract applicationbehavior and to characterize a broad range of applications.For many cases, our methodology results in projections thatare inline with published numbers, however, using measureddata rather than market growth information. This makes ourmethodology useful as a tool to also evaluate the impactof system and architectural optimizations by examining theimpact on cpio .
X. ACKNOWLEDGEMENTS
We thankfully acknowledge the support of the EuropeanCommission under the 7th Framework Programs through theIOLANES (FP7-ICT-248615), HiPEAC2 (FP7-ICT-217068),and SCALUS (FP7-PEOPLE-ITN-2008-238808) projects. Weare thankful to Neurocom LTD, Greece for providing us thecode for TariffAdvisor and to Victor Molino and MartinaNaughton for their feedback on the paper.
REFERENCES
[1] J. F. Gantz, D. Reinsel, C. Chute, W. Schlichting, J. Mcarthur,S. Minton, I. Xheneti, A. Toncheva, and A. Manfrediz, “IDC- The Expanding Digital Universe: A Forecast of WorldwideInformation Growth Through 2010 (updated in 2010, 2011).”Mar. 2007. [Online]. Available: http://www.emc.com/collateral/analyst-reports/expanding-digital-idc-white-paper.pdf
[2] R. Joshi, “Data-Centric Architecture: A Model for the Era of Big Data,”http://drdobbs.com/web-development/229301018 .
[3] S. Boyd-Wickizer, A. T. Clements, Y. Mao, A. Pesterev, M. F. Kaashoek,R. Morris, and N. Zeldovich, “An analysis of linux scalability to manycores,” in Proceedings of the 9th USENIX conference on Operatingsystems design and implementation, ser. OSDI’10. Berkeley, CA,USA: USENIX Association, 2010, pp. 1–8. [Online]. Available:http://portal.acm.org/citation.cfm?id=1924943.1924944
[4] T.-I. Salomie, I. E. Subasu, J. Giceva, and G. Alonso, “Databaseengines on multicores, why parallelize when you can distribute?”in Proceedings of the sixth conference on Computer systems, ser.EuroSys ’11. New York, NY, USA: ACM, 2011, pp. 17–30. [Online].Available: http://doi.acm.org/10.1145/1966445.1966448
[5] R. F. Freitas and W. W. Wilcke, “Storage-class memory: the nextstorage system technology,” IBM J. Res. Dev., vol. 52, pp. 439–447,July 2008. [Online]. Available: http://dx.doi.org/10.1147/rd.524.0439
[6] A. Benner, P. Pepeljugoski, and R. Recio, “A roadmap to 100g ethernetat the enterprise data center,” Communications Magazine, IEEE, vol. 45,no. 11, pp. 10 –17, november 2007.
[7] X. Fan, W.-D. Weber, and L. A. Barroso, “Power provisioning for awarehouse-sized computer,” in ISCA ’07: Proceedings of the 34th annualinternational symposium on Computer architecture. New York, NY,USA: ACM, 2007, pp. 13–23.
[8] “Kernel Asynchronous I/O (AIO) Support for Linux,”http://lse.sourceforge.net/io/aio.html .
[9] R. Wheeler, “fs mark,” sourceforge.net/projects/fsmark/.[10] llnl.gov, “ASC Sequoia Benchmark Codes,” https://asc.llnl.gov.[11] C. Bienia, S. Kumar, J. P. Singh, and K. Li, “The parsec
benchmark suite: characterization and architectural implications,”in Proceedings of the 17th international conference on Parallelarchitectures and compilation techniques, ser. PACT ’08. NewYork, NY, USA: ACM, 2008, pp. 72–81. [Online]. Available:http://doi.acm.org/10.1145/1454115.1454128
[12] M. Cherniack, H. Balakrishnan, M. Balazinska, D. Carney, U. etintemel,Y. Xing, and S. Zdonik, “Scalable distributed stream processing,” in InCIDR, 2003.
[13] B. F. Cooper, A. Silberstein, E. Tam, R. Ramakrishnan, and R. Sears,“Benchmarking cloud serving systems with ycsb,” in Proceedingsof the 1st ACM symposium on Cloud computing, ser. SoCC ’10.New York, NY, USA: ACM, 2010, pp. 143–154. [Online]. Available:http://doi.acm.org/10.1145/1807128.1807152
[14] Steve Shaw, “hammerora,” http://hammerora.sourceforge.net.[15] S. Altschul, W. Gish, W. Miller, E. Myers, and D. Lipman, “Basic local
alignment search tool,” Journal of Molecular Biology, vol. 215, pp. 403–410, 1990.
[16] R. Schone, D. Hackenberg, and D. Molka, “Simultaneous multithreadingon x86 64 systems: an energy efficiency evaluation,” in Proceedingsof the 4th Workshop on Power-Aware Computing and Systems, ser.HotPower ’11. New York, NY, USA: ACM, 2011, pp. 10:1–10:5.[Online]. Available: http://doi.acm.org/10.1145/2039252.2039262
[17] R. Murphy, “On the effects of memory latency and bandwidth onsupercomputer application performance,” in Proceedings of the 2007IEEE 10th International Symposium on Workload Characterization, ser.IISWC ’07. Washington, DC, USA: IEEE Computer Society, 2007,pp. 35–43.
[18] John D. McCalpin, “STREAM: Sustainable Memory Bandwidth in HighPerformance Computers,” http://www.cs.virginia.edu/stream/ .
[19] A. Vasan, A. Sivasubramaniam, V. Shimpi, T. Sivabalan, and R. Subbiah,“Worth their watts? - an empirical study of datacenter servers,” jan. 2010,pp. 1 –10.
[20] U. E. P. Agency, “Report to congress on server and data center energyefficiency,” www.energystar.gov.
[21] S. Eyerman, K. D. Bois, and L. Eeckhout, “Speedup stacks: Identifyingscaling bottlenecks in multi-threaded applications,” in ISPASS, 2012.
[22] M. Ferdman, A. Adileh, O. Kocberber, S. Volos, M. Alisafaee, D. Jevd-jic, C. Kaynak, A. D. Popescu, A. Ailamaki, and B. Falsafi, “Clearingthe Clouds: A Study of Emerging Workloads on Modern Hardware,”Tech. Rep., 2011.
[23] J. Gray and F. Putzolu, “The 5 minute rule for trading memoryfor disc accesses and the 10 byte rule for trading memory for cputime,” SIGMOD Rec., vol. 16, pp. 395–398, December 1987. [Online].Available: http://doi.acm.org/10.1145/38714.38755
[24] E. Anderson and J. Tucek, “Efficiency matters!” SIGOPS Oper. Syst.Rev., vol. 44, pp. 40–45, March 2010.
[25] VMware, “Performance characterization of vmfs and rdm using a san,”www.vmware.com.