Embed Size (px)
Citation preview

Understanding genetic association
studies
Peter Kamerman

Outline
CONCEPTS UNDERLYING GENETIC ASSOCIATION STUDIES
Genetic concepts:
- Underlying principals
- Genetic variants
- Linkage disequilibrium
- Population genetics and stratification
Study design:
- Types of studies
- Assessing a genetic association study
o Quality control
o Analysis and statistical power

What is the purpose of a genetic
association study?


Phenotype
variability
Genetic variability
Genetic variability

Phenotype
variability
Genetic variability
Environmental variability
Genetic variability
Environmental variability

Genetic contribution to extreme phenotypes
Rare, catastrophic monogenic mutations

GENETIC LINKAGE ANALYSIS
Genetic contribution to extreme phenotypes

Genetic contribution to “non-extreme”
phenotypes
Complex phenotype = multigenic

Genetic variation forms the basis
of genetic epidemiology
GENETIC ASSOCIATION ANALYSIS
Population-based Family-based

Genetic contribution to “non-extreme”
phenotypes
A few loci of moderate effect and
intermediate (5-20%) to high
(>20%) minor allele frequency,
each explaining several percent of
disease risk in a population
Gibson, 2012

Genetic contribution to “non-extreme”
phenotypes
Many common alleles of
intermediate (5-20%) to low (1-5%)
frequency with moderate to low
effect, respectively
(infinitesimal model)
Gibson, 2012; Park et al., 2011

Genetic contribution to “non-extreme”
phenotypes
A few rare alleles (<1%) with
moderate to high effects (GRR > 2)
(rare allele model)
Gibson, 2012

Allele frequency vs. effect size
Manolio et al., 2009

Genetic variants

Genetic variation
Single-nucleotide polymorphisms (SNPs)
Human genome: ~3 billion base-pairs (haploid)
10-30 million SNPs in the human population
~0.1% variability in SNPs between unrelated individuals (~3 million SNPs)

Only 1-5% of SNPs are functional (causative) mutations
Non-synonymous SNP = missense or nonsense
Promotor region SNPs
The rest are non-functional mutations
Synonymous SNP = no amino acid change
Single nucleotide polymorphisms
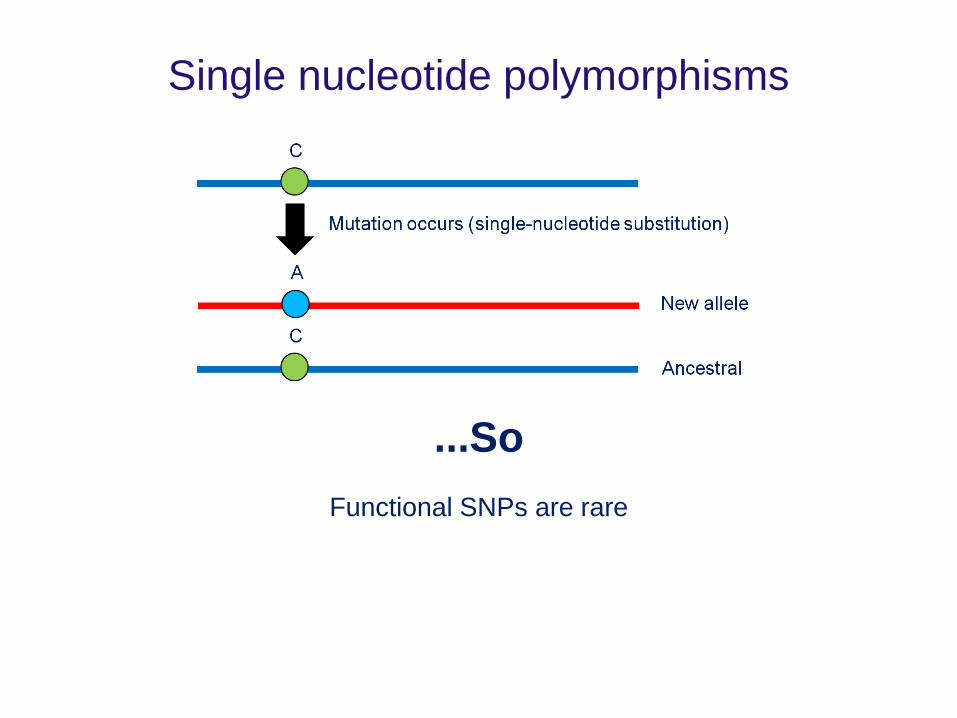
...So
Functional SNPs are rare
Single nucleotide polymorphisms

...So
Functional SNPs are rare
...and are hard to identify
Single nucleotide polymorphisms

...AND
Non-functional SNPs are abundant
Single nucleotide polymorphisms

...So
Non-functional SNPs are abundant
…but are they useful?
Single nucleotide polymorphisms

Linkage disequilibrium

Linkage disequilibrium
Non-random association between alleles at two or
more loci
Can use the location of one SNP to “TAG” the
presence of another or many other SNPs

Linkage disequilibrium

Linkage disequilibrium
locus A far
from locus M/N
locus B close
to locus M/N
XXXX X
recombination

Linkage disequilibrium
locus A far
from locus M/N
locus B close
to locus M/N
XXXX X
many generations
linkage equilibrium
with alleles at locus A
linkage disequilibrium
with B1 allele
at locus B
recombination

Linkage disequilibrium
r2=1 r2=0.9 r2=0.5 r2=0.1
Correlations decay with number of recombination events:
• Distance
• Population history
Slide courtesy of Chris Spencer, Wellcome Trust Centre for Human Genetics

Linkage disequilibrium (LD) plots
Shows correlations between SNPs
Low LD (r2)
High LD (r2)
Haplotype block
Recombination
“hot-spot”
tagSNPs
Slide courtesy of Chris Spencer, Wellcome Trust Centre for Human Genetics

Population genetics

PaleoPlaybook
Population-based genetic variation

Tishkoff and Williams, 2002
Population-based genetic variation
Founder effect

Adapted from McVean et al., 2005
Recom
bin
ation
hots
pots
Africa (YRI)
Position on chromosome
White (CEU)
Asian (CHN)
Population-based genetic variation

GTP cyclohydrolase gene (GCH1) tagSNPs
CEU
• 25 SNPs MAF > 0.1
• 8 tagSNPs (r2 >0.8)

GTP cyclohydrolase gene (GCH1) tagSNPs
YRI
• 32 SNPs MAF > 0.1
• 19 tagSNPs (r2 >0.8)

Population-based genetic variation
High LD:
European
Low LD:
African
Palmer and Cardon, 2005

Population-based genetic variation
Palmer and Cardon, 2005

Population-based genetic variation
Palmer and Cardon, 2005

Population stratification
Slide courtesy of Dominic Kwiatkowski, Wellcome Sanger Institute

Population stratification
Discrete: Populations that are remotely related (e.g.,
Europeans, Africans and Asians).
Admixed: Admixed ancestry (e.g., African Americans, Cape
Coloureds) with different individuals having
different degrees of admixture.
Hierarchical: Both discrete and admixed population structures.
Hierarchical population structures may be seen in
studies that involve multi-ethnic cohorts.
Types of population structure

Population stratification
Primary methods for correcting for population structure
Self-reported ethnicity
Genomic control
Principal components analysis

Population stratification
Assessing for population structure
Q-Q plots
Price et al., 2010

Population stratification
Self-reported ethnicity
Teo et al., 2010

Population stratification
Genomic control
Apply a correction factor (λGC) to correct for the difference between observed
and expected Chi-square statistic.
Let down by:
• Not conservative enough when few markers used (↑false positives)
• Too conservative if many markers used (↑ false negatives)
• Cannot deal with large deviations
Price et al., 2010

Population stratification
PCA
PCA transforms a number of (possibly) correlated variables into a (smaller)
number of uncorrelated variables (principal components).
The PCA method identifies principal components that represent the
population structure based on genetic correlations among individuals.
Notes:
• Need to prune regions with long-range high LD
• Need to remove related individuals
Teo et al., 2010

Study design

Types of genetic studies for complex traits
Family-based vs. Population-based

Population-based designs
Cordell and Clayton, 2005
Types of genetic studies for complex traits

Family-based designs
Cordell and Clayton, 2005
Types of genetic studies for complex traits

Types of genetic studies for complex traits
Family-based vs. Population-based
Benefits of family-based
Protection against population substructure
Improved genotyping quality control
Allow estimates of parent-of-origin (imprinting) effects
Can assess whether an allele is inherited or de novo
Drawbacks of family-based designs
Difficult sample collection, especially for older onset traits (e.g., diabetes)
Less power than case-control studies
Requires more genotyping
Requires at least one parent to be heterozygote

Types of genetic studies for complex traits
Candidate gene vs. Genome-wide
Hypothesis driven
Focuses on gene(s) identified through our
understanding of a disease
Efficient use of resources
Tailored marker selection
Hypothesis-free
Scans the whole genome for possible
associations between polymorphisms and
disease of interest
Only assesses common genetic variants
Can be semi-tailored

Assessing genetic association studies

Assessing genetic association studies
1. How appropriate was the choice of candidate genes/markers?
2. What quality control measures were used?
3. Was the analysis appropriate

Assessing genetic association studies
How appropriate was the choice of candidate genes/markers?
How well do we know the mechanisms of a disease - Evidence from animal models and in vitro studies
- Evidence from clinical studies
- Evidence from linkage studies
Markers selection - “Functional” polymorphisms
- Evidence from the literature of previous association
- TagSNP selection criteria (r2>0.8, appropriate population, MAF)

Assessing genetic association studies
What quality control measures were used?
Lab QC - Assigning cases and controls to each plate
- Running duplicates (same plate and across plates)

Assessing genetic association studies
What quality control measures were used?
QC per individual (GWAS) - Identification of discordant sex information
- Identification of poor DNA quality
- Identification of duplicated or related individuals
- Identification of individuals of divergent ancestry
QC per marker - Identification of SNPs with excessive missing genotypes
- Identification of SNPs showing significant deviation from Hardy-
Weinberg equilibrium (HWE)
- Identification of SNPs with different rates of missingness between
cases and controls
- Removal of markers with very low minor MAF
Anderson et al., 2010

Assessing genetic association studies
Identification of SNPs showing significant deviation from Hardy
Weinberg equilibrium (HWE)
Under HWE, alleles segregate randomly in the population, allowing expected
genotype frequencies to be calculated from allele frequencies:
Alleles: G and T
Genotypes: GG GT TT
Expected frequencies of genotypes: G2 2GT T2
Departures from HWE in control samples may be caused by the following:
1. Genotyping error. (calling heterozygotic individuals is challenging)
2. Population stratification
3. Selection, therefore assess HWE in controls only
Anderson et al., 2010

Assessing genetic association studies
What quality control measures were used?
QC per individual (GWAS) - Identification of discordant sex information
- Identification of poor DNA quality
- Identification of duplicated or related individuals
- Identification of individuals of divergent ancestry
QC per marker - Identification of SNPs with excessive missing genotypes
- Identification of SNPs showing significant deviation from Hardy-
Weinberg equilibrium (HWE)
- Identification of SNPs with different rates of missingness between
cases and controls
- Removal of markers with very low minor MAF
Anderson et al., 2010

Assessing genetic association studies
Was the analysis appropriate?
Basic analysis of bi-allelic markers (SNPs)
AA aA aa
Cases a c e
Controls b d f
Genotypic model

Assessing genetic association studies
Was the analysis appropriate?
Allelic (multiplicative)
AA aA aa
Cases a c e
Controls b d f
AA aA aa
A a
Cases 2a+c 2e+c
Controls 2b+d 2F+d

Assessing genetic association studies
Was the analysis appropriate?
Dominant model
AA aA aa
Cases a c e
Controls b d f
AA aA+aa
Cases a c+e
Controls b d+f
AA aA aa

Assessing genetic association studies
Was the analysis appropriate?
Recessive model
AA aA aa
Cases a c e
Controls b d f
AA+aA aa
Cases a+c e
Controls b+d F
AA aA aa

Assessing genetic association studies
Was the analysis appropriate?
Cochrane-Armitage test for trend
AA aA aa
Cases a c e
Controls b d f
AA aA aa
AA aA aa
Cases a c e
Controls b d f

Assessing genetic association studies
Was the analysis appropriate?
Did they correct for multiple comparisons?
Type I error is the probability of rejecting the null hypothesis when it is true.
The significance level (e.g., a ≤ 0.05) indicates the proportion of false positives that
an investigator is willing to tolerate in his or her study.
1 million comparisons at an a ≤ 0.05 50 000 false positives

Assessing genetic association studies
Was the analysis appropriate?
Did they correct for multiple comparisons?
Agreed upon significance threshold: GWAS 1.5*10-7
Bonferroni correction (a/n) and Sidak (1 − (1 −a)1/n): too conservative, and assume
SNPs are independent
False discover rate (FDR): control for the expected proportion of false positives
among SNPs declared significant, and assumes SNPs are independent
Permutation testing

Adapted from Tegeder et al., 2006
Assessing genetic association studies
Was the analysis appropriate?
Did they analyze individual markers or haplotypes?

Assessing genetic association studies
Was the analysis appropriate?
Did they correct for covariates?

And finally,
what are the three most important issues in
genetic association studies?

Phenotype!
Phenotype!
Phenotype!