Embed Size (px)
Citation preview
Understanding FSA Reports
Introduction
This document has been prepared to help you understand the score reports for the Florida Standards
Assessments (FSA). It includes explanation of individual student reports, information that is available in the
parent portal in Skyward, and a glossary of the terms used in these reports. The explanations provided for the
sample reports apply to all grade levels except where otherwise noted.
ELA, Mathematics, and End Of Course Assessments - T Scores and Percentile Ranks
Both T scores and percentile ranks are reported for FSA ELA, Mathematics, and EOC tests because the standard
setting process, which establishes the cut scores for proficiency levels 1-5, will not be completed by the time
scores are required to be reported.
Students will receive a T Score that falls between 20 to 80 on a T score scale. This scale, which is only used to
report results when a test is given for the first time is a special scale used only in this instance. On the T score
scale, a score of approximately 50 is the statewide average.
Students will also receive a percentile rank, which will show how they performed on each grade level/subject
area test compared to all other students in Florida who took the same test. The percentile rank is based on the
student’s T score. If a student’s percentile rank is 62, then the student scored higher on the test than 62% of
his/her same-grade peers in the state. The percentile ranks range from 1 to 99.
Percentile ranks are included in the FSA Individual Student Report. T scores are reported in Skyward
Family/Student Access but are not included in the FSA Individual Student Report.

Guide to FSA Student Assessment Data in Skyward Family Access
Directions on how to view FSA Results in Skyward Family/Student Access: 1. Select Test Scores from the left hand menu. 2. Select the FSA test and click on (Show Scores).
FSA Tests: FSARO-FSAELAReading FSAMO-FSAMathematics FSAE1-FSAEOCAlgebra1 FSAE2-FSAEOCAlgebra2 FSAE3-FSAEOCGeometry
3. Section: Admin indicates School Number and Student Grade 4. Section: Scores indicates the T Score achieved and the state percentile of the assessment and points earned
and possible on each of the standards/skills assessed.
In addition to the information in the section above, a passing indicator indicating that the high school requirements has been met is displayed for ELA Grade 10 and Algebra 1.
1.
2.
3.
4.
Guide to the FSA Individual Student Report
The FSA Individual Student Report is a paper copy of your students’ FSA results. This report will be available for
pick up at the school where your student took the FSA in the spring of 2015. Individual Student Reports should
be available by the end of October.
All Subjects and Grade Levels (except ELA Grade 10 and Algebra 1)
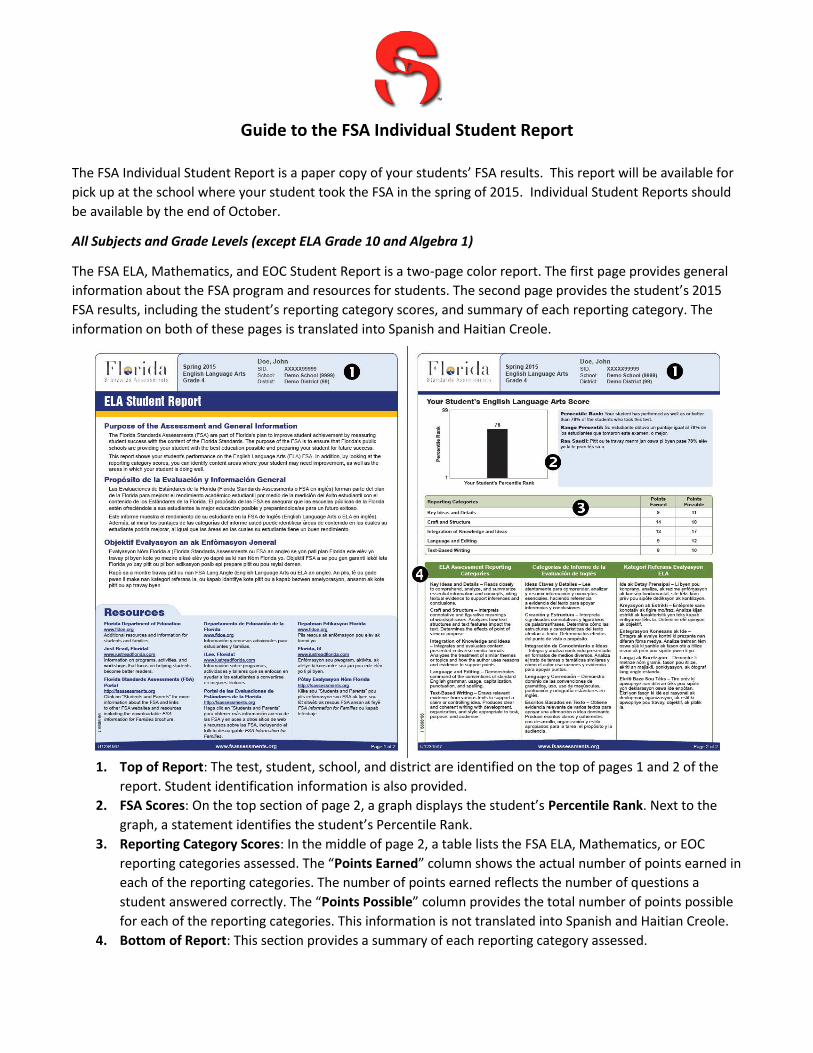
The FSA ELA, Mathematics, and EOC Student Report is a two-page color report. The first page provides general
information about the FSA program and resources for students. The second page provides the student’s 2015
FSA results, including the student’s reporting category scores, and summary of each reporting category. The
information on both of these pages is translated into Spanish and Haitian Creole.
1. Top of Report: The test, student, school, and district are identified on the top of pages 1 and 2 of the
report. Student identification information is also provided.
2. FSA Scores: On the top section of page 2, a graph displays the student’s Percentile Rank. Next to the
graph, a statement identifies the student’s Percentile Rank.
3. Reporting Category Scores: In the middle of page 2, a table lists the FSA ELA, Mathematics, or EOC
reporting categories assessed. The “Points Earned” column shows the actual number of points earned in
each of the reporting categories. The number of points earned reflects the number of questions a
student answered correctly. The “Points Possible” column provides the total number of points possible
for each of the reporting categories. This information is not translated into Spanish and Haitian Creole.
4. Bottom of Report: This section provides a summary of each reporting category assessed.

ELA Grade 10 and Algebra 1
Readers reviewing their FSA ELA Student Report (grade 10) or FSA EOC Student Report (Algebra 1) should refer
to the section above for general descriptions of the sections included in their report.
In addition to the information in the section above, a graduation requirement indicator is displayed next to the
FSA Percentile Rank graph. A statement appears indicating whether the student met the graduation
requirement.
For additional information regarding your student’s FSA results, please contact your school principal.