Embed Size (px)
Citation preview
1
PN 775136A
1
Understanding Flow Cytometry
The Basic Concepts
Maree BagnaraProducts Sales Specialist/Account ManagerFlow Cytometry
PN775136
PN 775136A
2
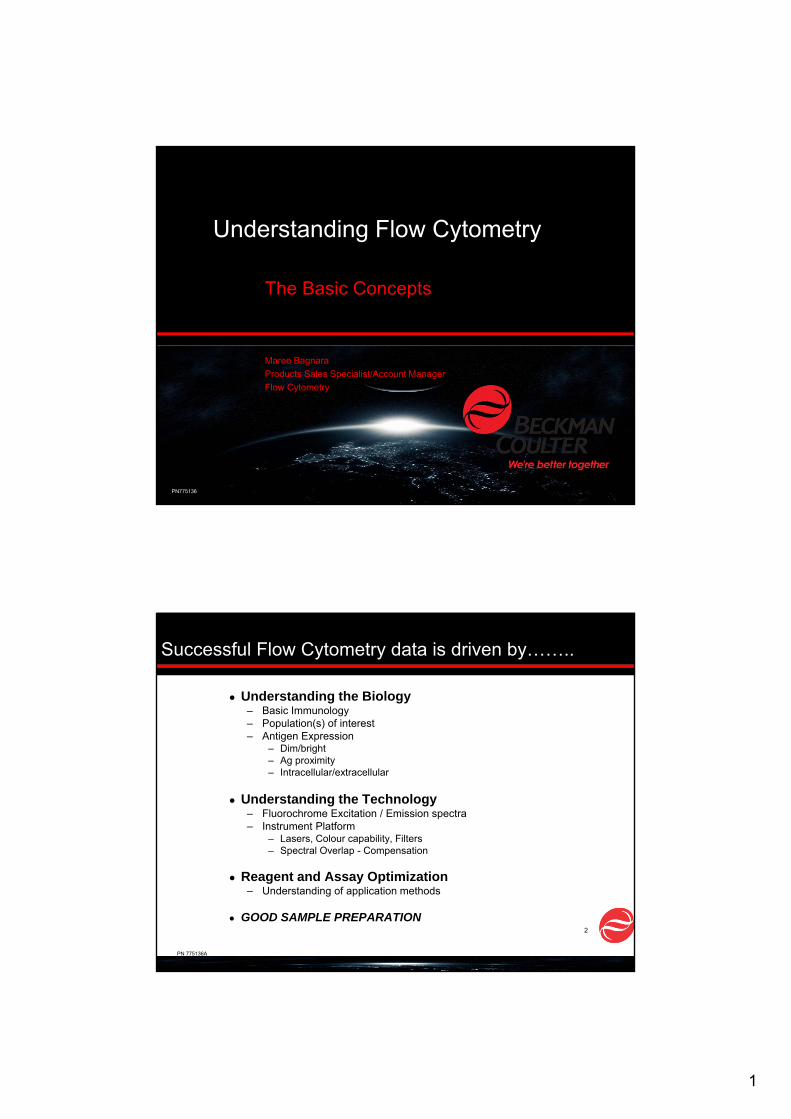
Successful Flow Cytometry data is driven by……..
● Understanding the Biology– Basic Immunology– Population(s) of interest– Antigen Expression
– Dim/bright– Ag proximity– Intracellular/extracellular
● Understanding the Technology– Fluorochrome Excitation / Emission spectra – Instrument Platform
– Lasers, Colour capability, Filters– Spectral Overlap - Compensation
● Reagent and Assay Optimization– Understanding of application methods
● GOOD SAMPLE PREPARATION
2
PN 775136A
3
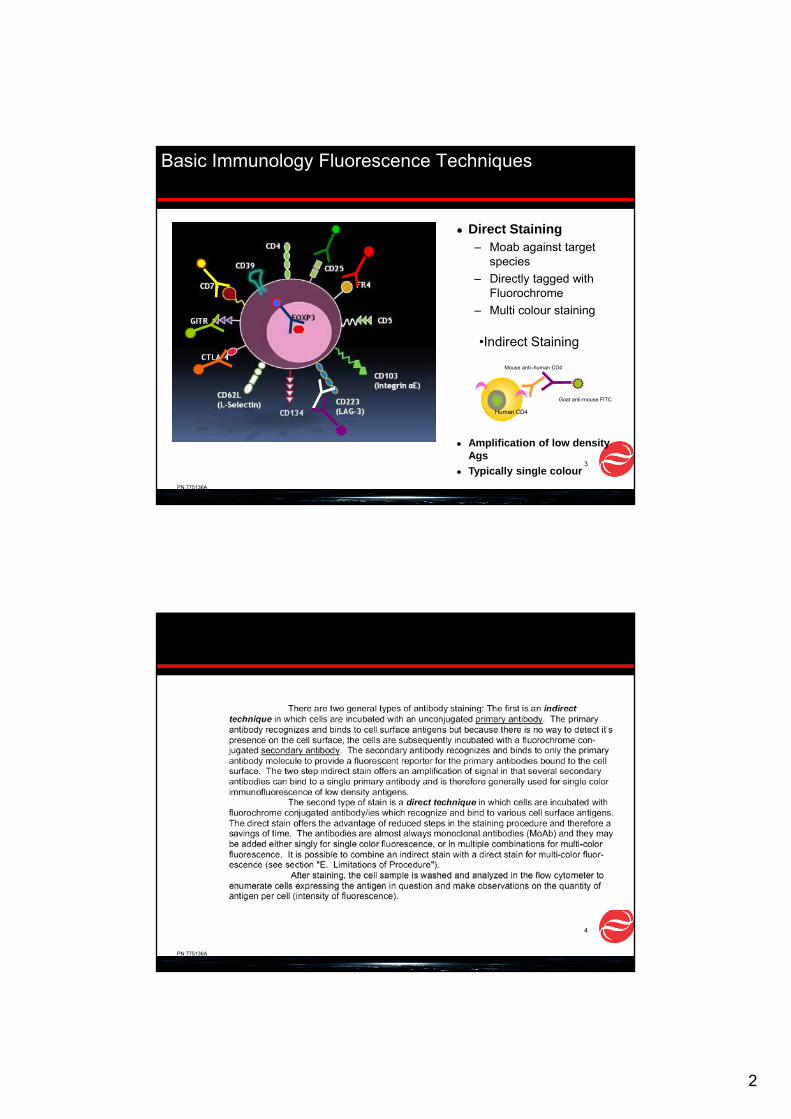
● Direct Staining– Moab against target
species– Directly tagged with
Fluorochrome– Multi colour staining
Basic Immunology Fluorescence Techniques
Mouse anti–human CD4
Human CD4
Goat anti-mouse FITC
● Amplification of low density Ags
● Typically single colour
•Indirect Staining
PN 775136A
4
3
PN 775136A
5
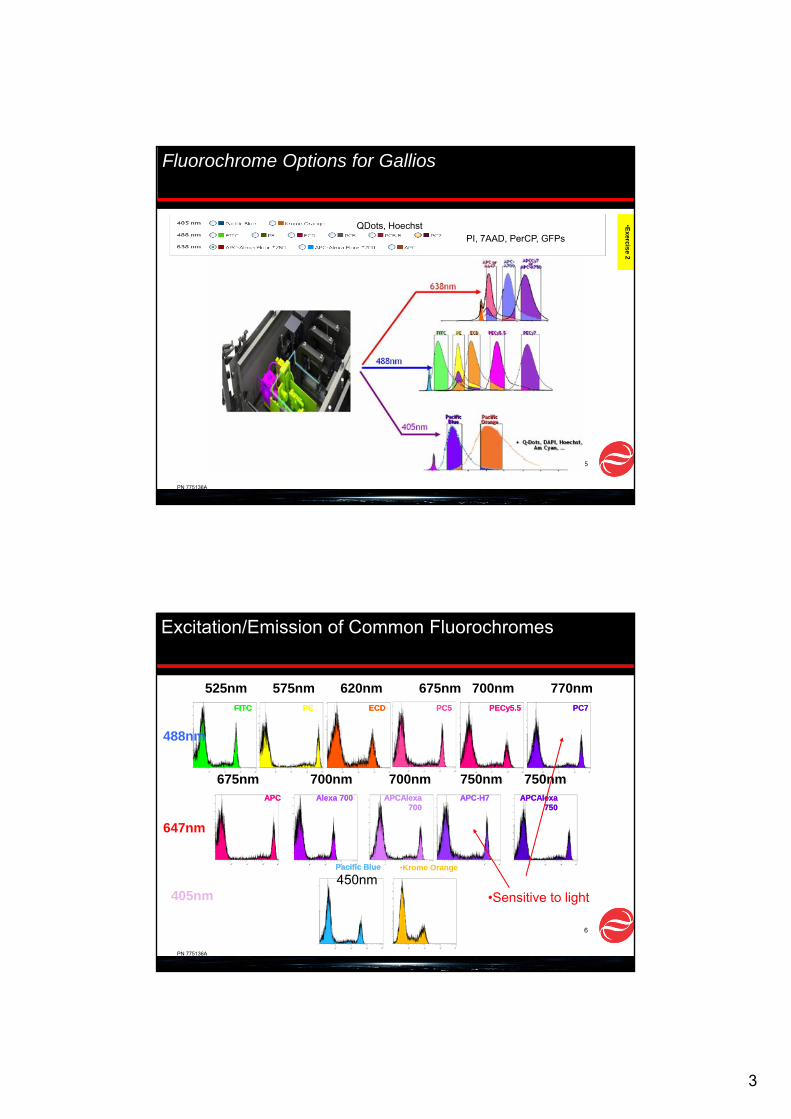
Fluorochrome Options for Gallios•Exercise 2
PI, 7AAD, PerCP, GFPsQDots, Hoechst
PN 775136A
6
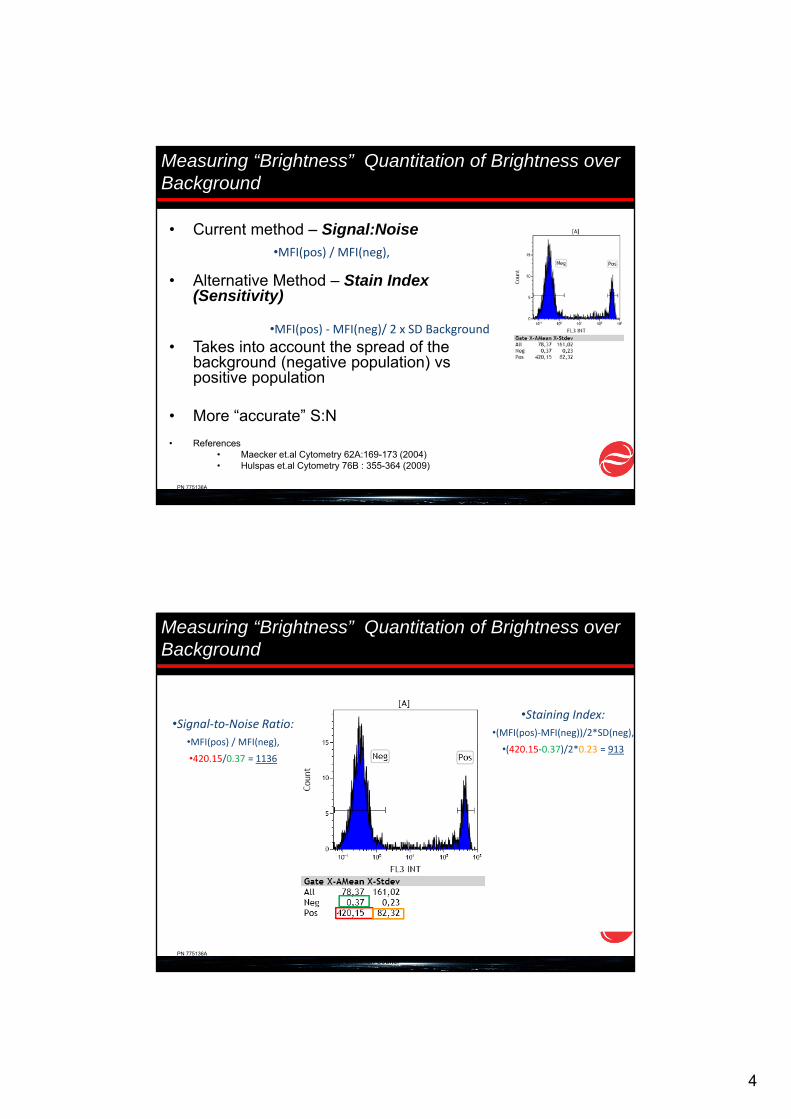
Excitation/Emission of Common Fluorochromes
FITCFITC PEPE ECDECD PC5PC5 PECy5.5PECy5.5 PC7PC7
APCAPC Alexa 700Alexa 700 APCAlexa 700
APCAlexa 700
APC-H7APC-H7 APCAlexa 750
APCAlexa 750
Pacific BluePacific Blue Pacific OrangePacific Orange
525nm 575nm 620nm 675nm 700nm 770nm
450nm
675nm 700nm 700nm 750nm 750nm
488nm
647nm
405nm
•Krome Orange
•Sensitive to light
4
PN 775136A
• Current method – Signal:Noise
• Alternative Method – Stain Index (Sensitivity)
• Takes into account the spread of the background (negative population) vs positive population
• More “accurate” S:N• References
• Maecker et.al Cytometry 62A:169-173 (2004)• Hulspas et.al Cytometry 76B : 355-364 (2009)
•MFI(pos) / MFI(neg),
•MFI(pos) ‐MFI(neg)/ 2 x SD Background
Measuring “Brightness” Quantitation of Brightness over Background
PN 775136A
•Signal‐to‐Noise Ratio:•MFI(pos) / MFI(neg),
•420.15/0.37 = 1136
•Staining Index:•(MFI(pos)‐MFI(neg))/2*SD(neg),
•(420.15‐0.37)/2*0.23 = 913
•Information provided courtesy of Dr Michael Kapinsky, Beckman Coulter
Measuring “Brightness” Quantitation of Brightness over Background
5
PN 775136A
9
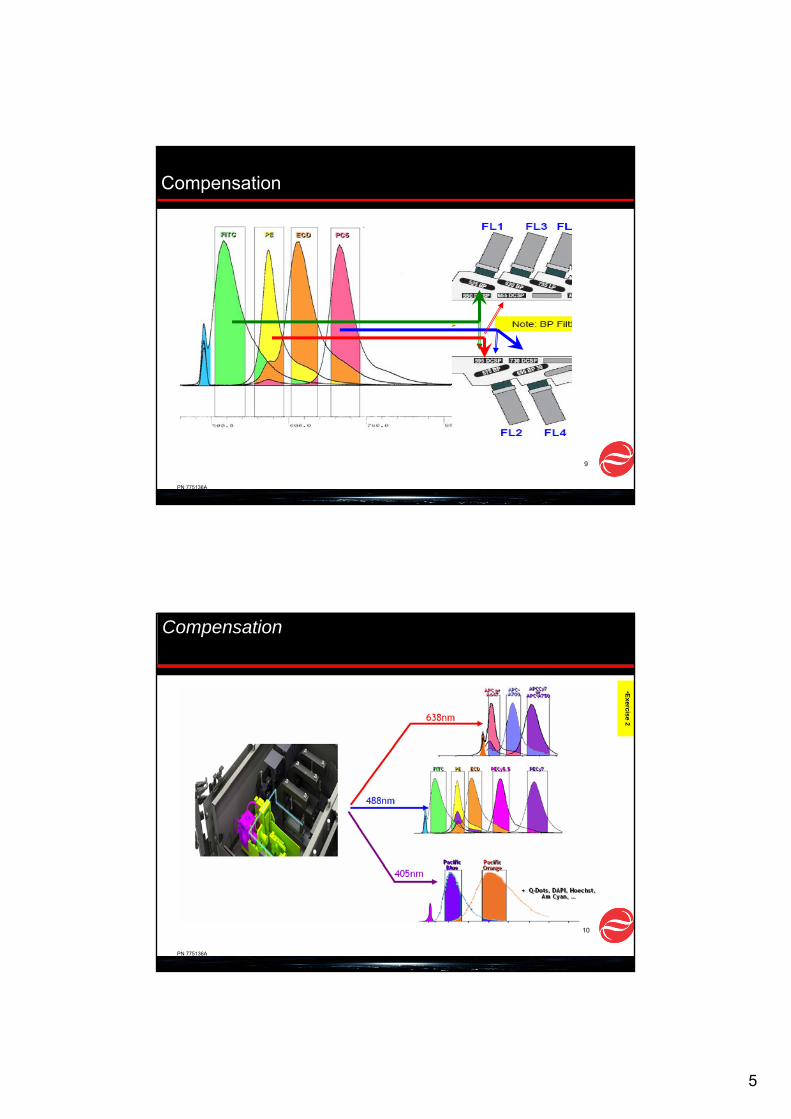
Compensation
PN 775136A
10
Compensation
•Exercise 2
6
PN 775136A
11
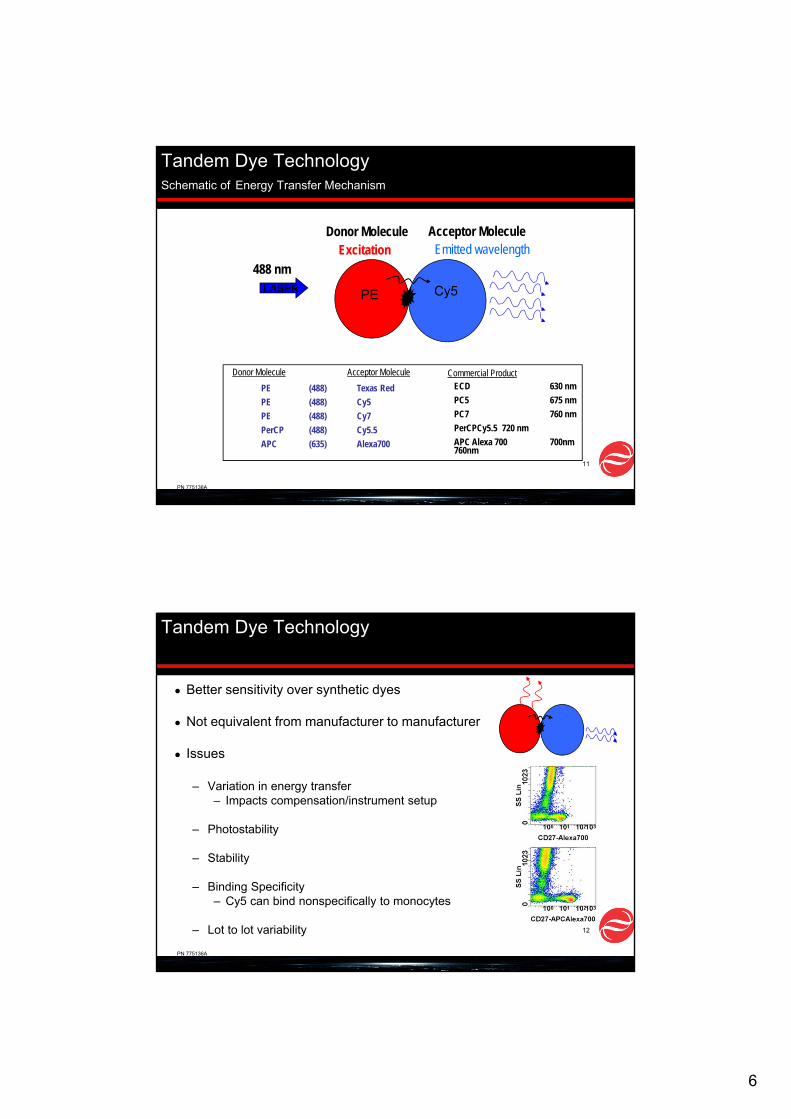
Tandem Dye TechnologySchematic of Energy Transfer Mechanism
Donor Molecule Acceptor Molecule
LASER
ECD 630 nmPC5 675 nmPC7 760 nmPerCPCy5.5 720 nmAPC Alexa 700 700nm760nm
PE (488) Texas RedPE (488) Cy5PE (488) Cy7PerCP (488) Cy5.5APC (635) Alexa700
Commercial Product
488 nmEmitted wavelength
Donor Molecule Acceptor MoleculeExcitation
PE Cy5
PN 775136A
12
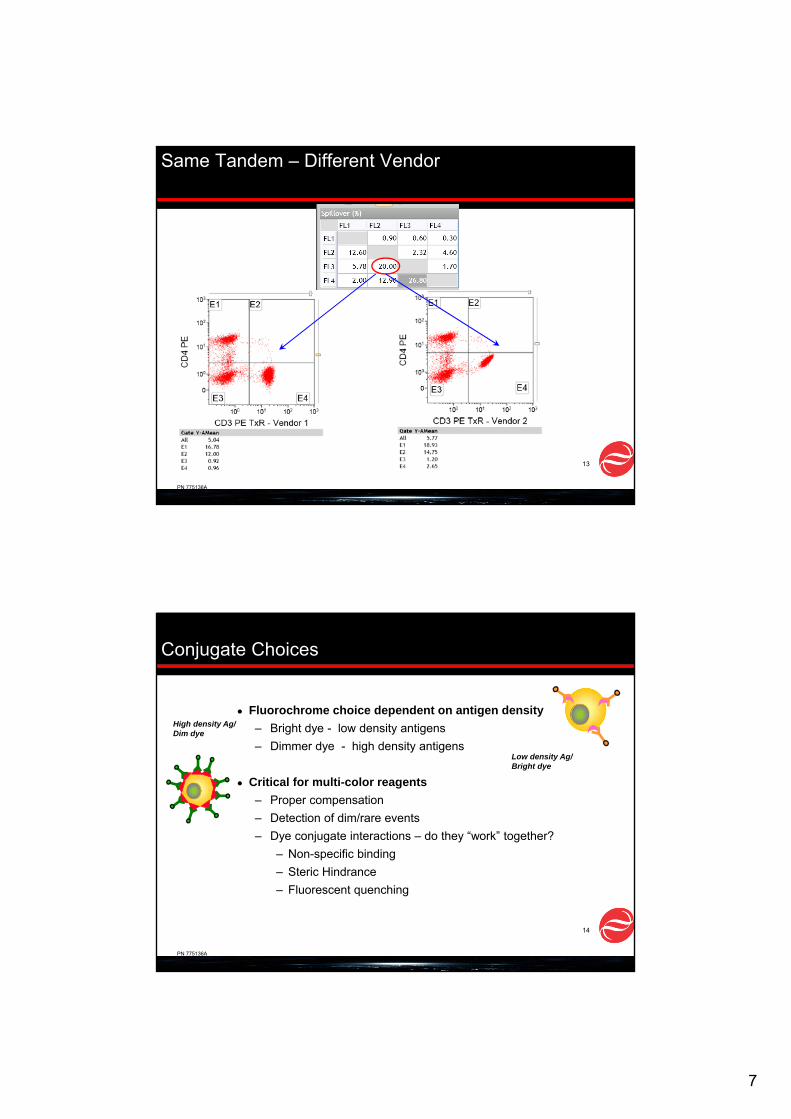
Tandem Dye Technology
● Better sensitivity over synthetic dyes
● Not equivalent from manufacturer to manufacturer
● Issues
– Variation in energy transfer– Impacts compensation/instrument setup
– Photostability
– Stability
– Binding Specificity– Cy5 can bind nonspecifically to monocytes
– Lot to lot variability
7
PN 775136A
Same Tandem – Different Vendor
13
PN 775136A
14
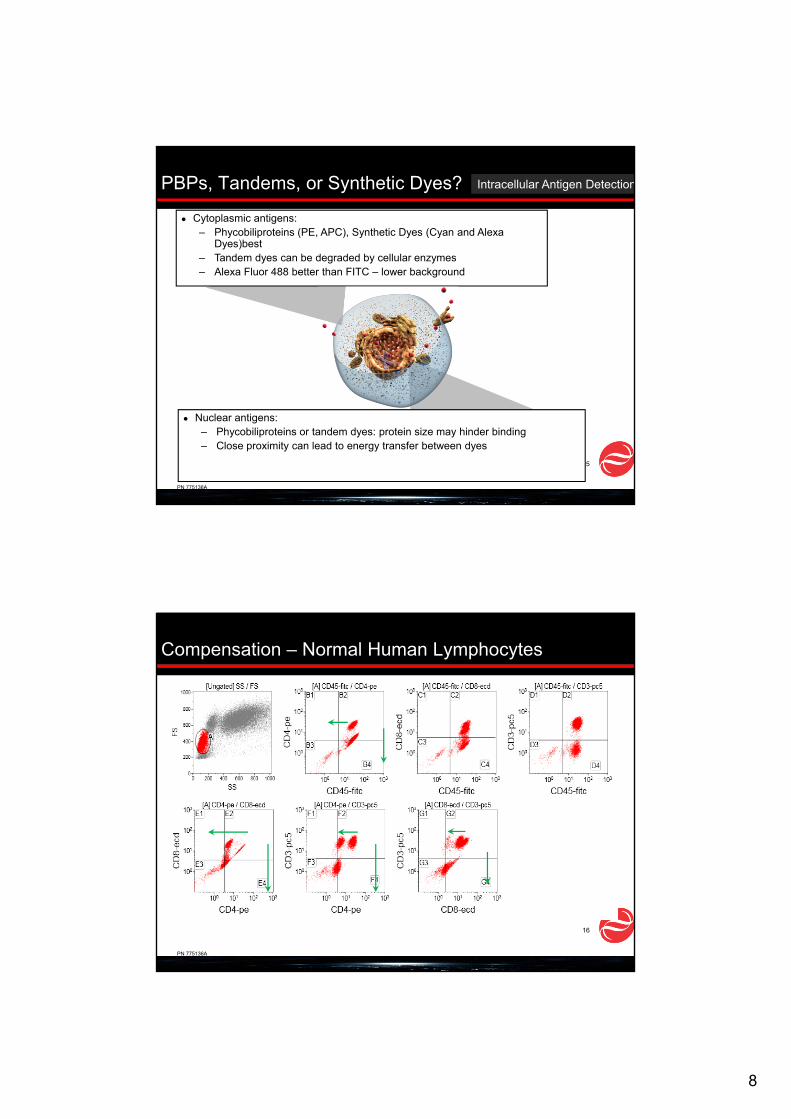
Conjugate Choices
● Fluorochrome choice dependent on antigen density– Bright dye - low density antigens– Dimmer dye - high density antigens
● Critical for multi-color reagents– Proper compensation– Detection of dim/rare events – Dye conjugate interactions – do they “work” together?
– Non-specific binding– Steric Hindrance– Fluorescent quenching
High density Ag/Dim dye
Low density Ag/Bright dye
8
PN 775136A
15
PBPs, Tandems, or Synthetic Dyes?
● Cytoplasmic antigens:– Phycobiliproteins (PE, APC), Synthetic Dyes (Cyan and Alexa
Dyes)best– Tandem dyes can be degraded by cellular enzymes– Alexa Fluor 488 better than FITC – lower background
Intracellular Antigen DetectionIntracellular Antigen Detection
● Nuclear antigens:– Phycobiliproteins or tandem dyes: protein size may hinder binding– Close proximity can lead to energy transfer between dyes
PN 775136A
16
Compensation – Normal Human Lymphocytes
9
PN 775136A
17
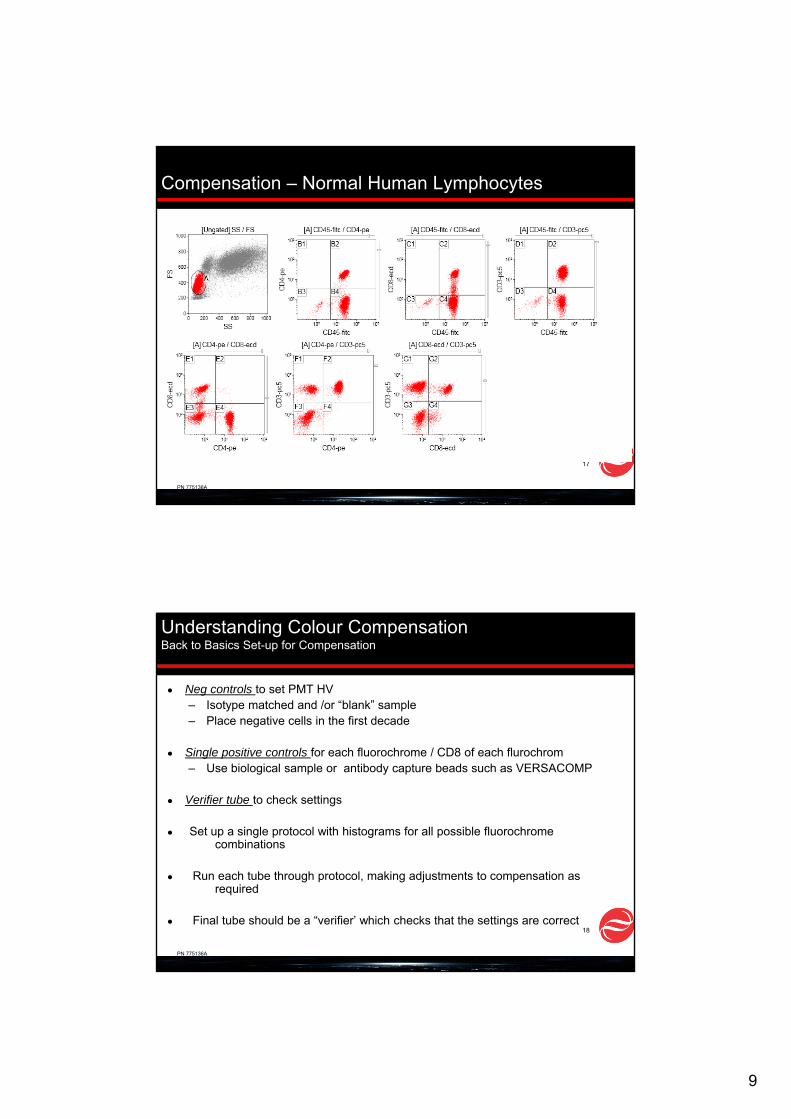
Compensation – Normal Human Lymphocytes
PN 775136A
18
Understanding Colour CompensationBack to Basics Set-up for Compensation
● Neg controls to set PMT HV – Isotype matched and /or “blank” sample– Place negative cells in the first decade
● Single positive controls for each fluorochrome / CD8 of each flurochrom– Use biological sample or antibody capture beads such as VERSACOMP
● Verifier tube to check settings
● Set up a single protocol with histograms for all possible fluorochrome combinations
● Run each tube through protocol, making adjustments to compensation as required
● Final tube should be a “verifier’ which checks that the settings are correct

10
PN 775136A
19
PN 775136A
Compensation Matrix
20
11
PN 775136A
21
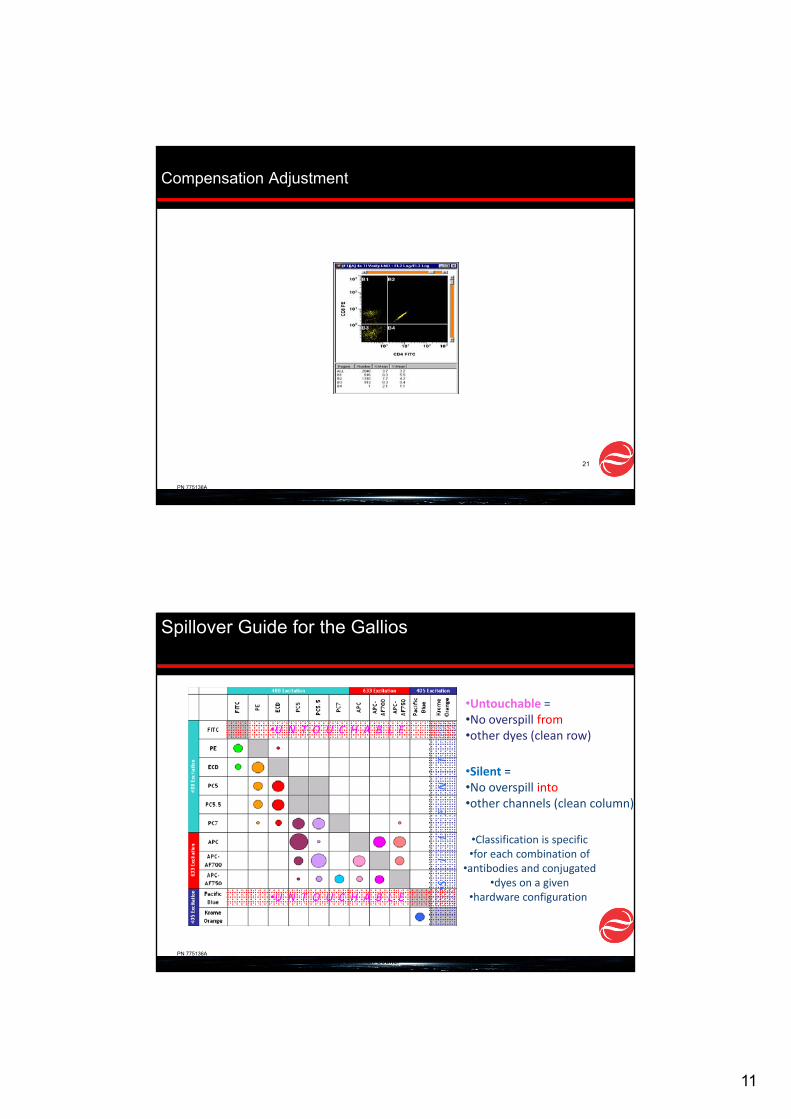
Compensation Adjustment
PN 775136A
•S I L E N T
•U N T O U C H A B L E
•U N T O U C H A B L E
•Classification is specific•for each combination of
•antibodies and conjugated•dyes on a given
•hardware configuration
•Untouchable =•No overspill from•other dyes (clean row)
•Silent =•No overspill into•other channels (clean column)
•Information provided courtesy of Dr Michael Kapinsky, Beckman Coulter
Spillover Guide for the Gallios
12
PN 775136A
23
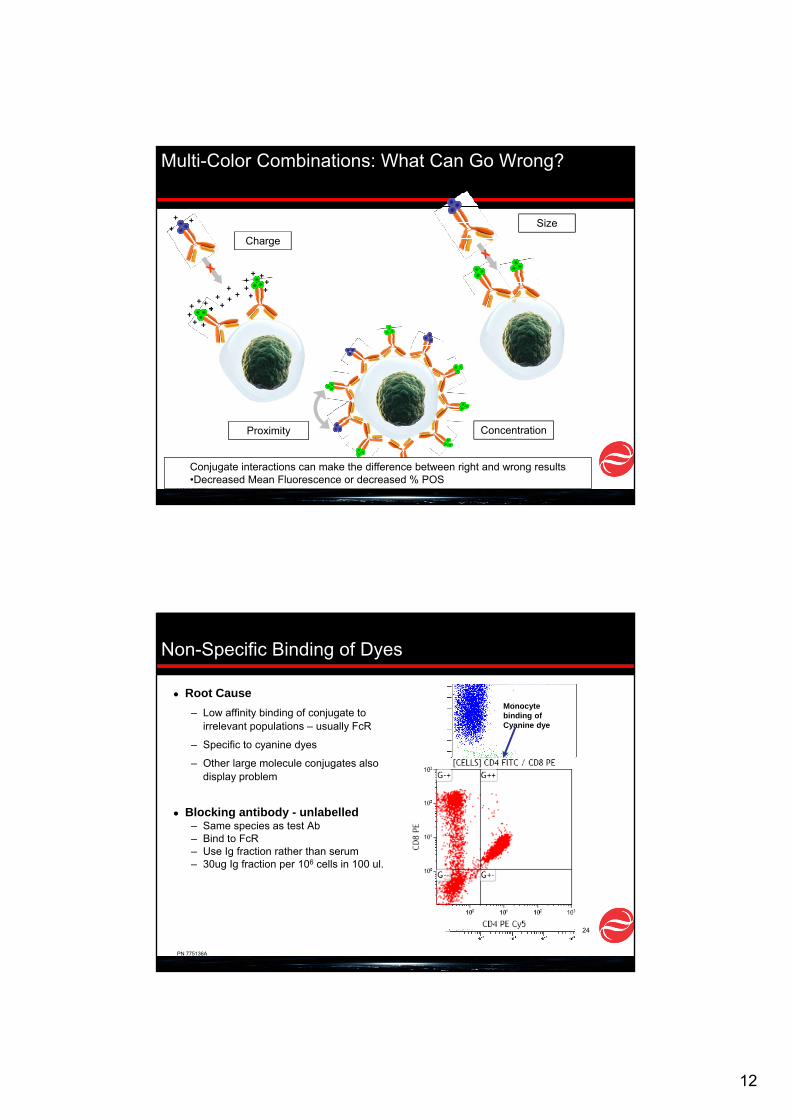
Multi-Color Combinations: What Can Go Wrong?
Size
+
++ +
+
++
+
+
+
+++
++
+
+++
Charge
++
+
ConcentrationProximity
Conjugate interactions can make the difference between right and wrong results •Decreased Mean Fluorescence or decreased % POS
PN 775136A
24
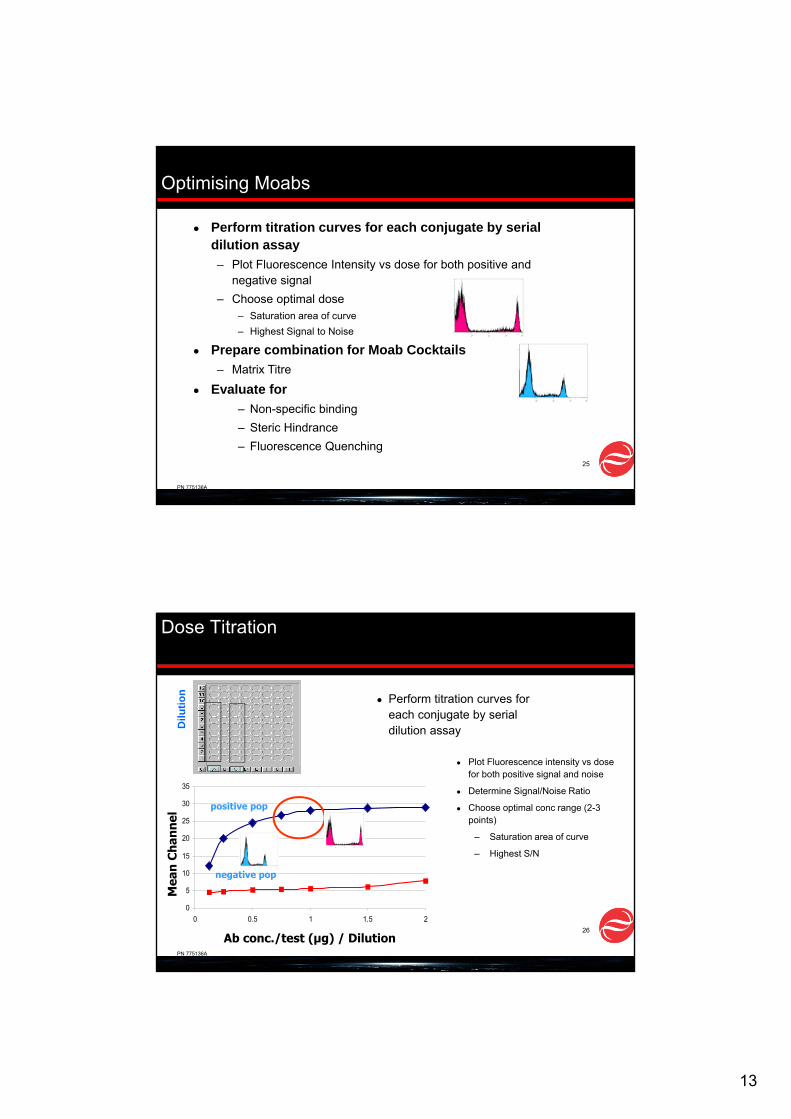
Non-Specific Binding of Dyes
● Root Cause– Low affinity binding of conjugate to
irrelevant populations – usually FcR
– Specific to cyanine dyes
– Other large molecule conjugates also display problem
● Blocking antibody - unlabelled– Same species as test Ab– Bind to FcR– Use Ig fraction rather than serum– 30ug Ig fraction per 106 cells in 100 ul.
Monocyte binding of Cyanine dye
13
PN 775136A
25
Optimising Moabs
● Perform titration curves for each conjugate by serial dilution assay– Plot Fluorescence Intensity vs dose for both positive and
negative signal – Choose optimal dose
– Saturation area of curve– Highest Signal to Noise
● Prepare combination for Moab Cocktails– Matrix Titre
● Evaluate for– Non-specific binding– Steric Hindrance– Fluorescence Quenching
PN 775136A
26
Dose Titration
● Perform titration curves for each conjugate by serial dilution assay
MoAb conjugate
Dilu
tion
● Plot Fluorescence intensity vs dose for both positive signal and noise
● Determine Signal/Noise Ratio
● Choose optimal conc range (2-3 points)
– Saturation area of curve
– Highest S/N
NEAT
1:21:41:8
Mea
n C
hann
el
0
5
10
15
20
25
30
35
0 0.5 1 1.5 2
Ab conc./test (μg) / Dilution
positive pop
negative pop
Mea
n C
han
nel
14
PN 775136A
27
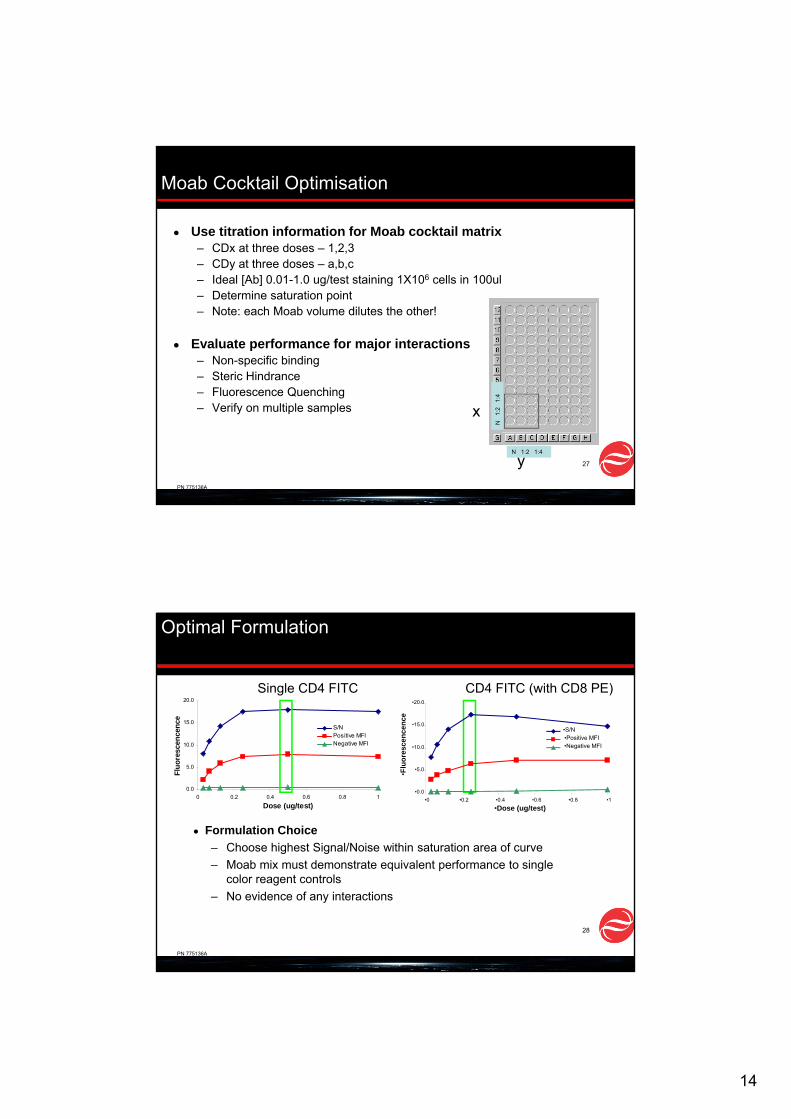
Moab Cocktail Optimisation
● Use titration information for Moab cocktail matrix– CDx at three doses – 1,2,3– CDy at three doses – a,b,c– Ideal [Ab] 0.01-1.0 ug/test staining 1X10⁶ cells in 100ul– Determine saturation point– Note: each Moab volume dilutes the other!
● Evaluate performance for major interactions– Non-specific binding– Steric Hindrance– Fluorescence Quenching– Verify on multiple samples
N 1:2 1:4
x
y
N
1:2
1:4
PN 775136A
28
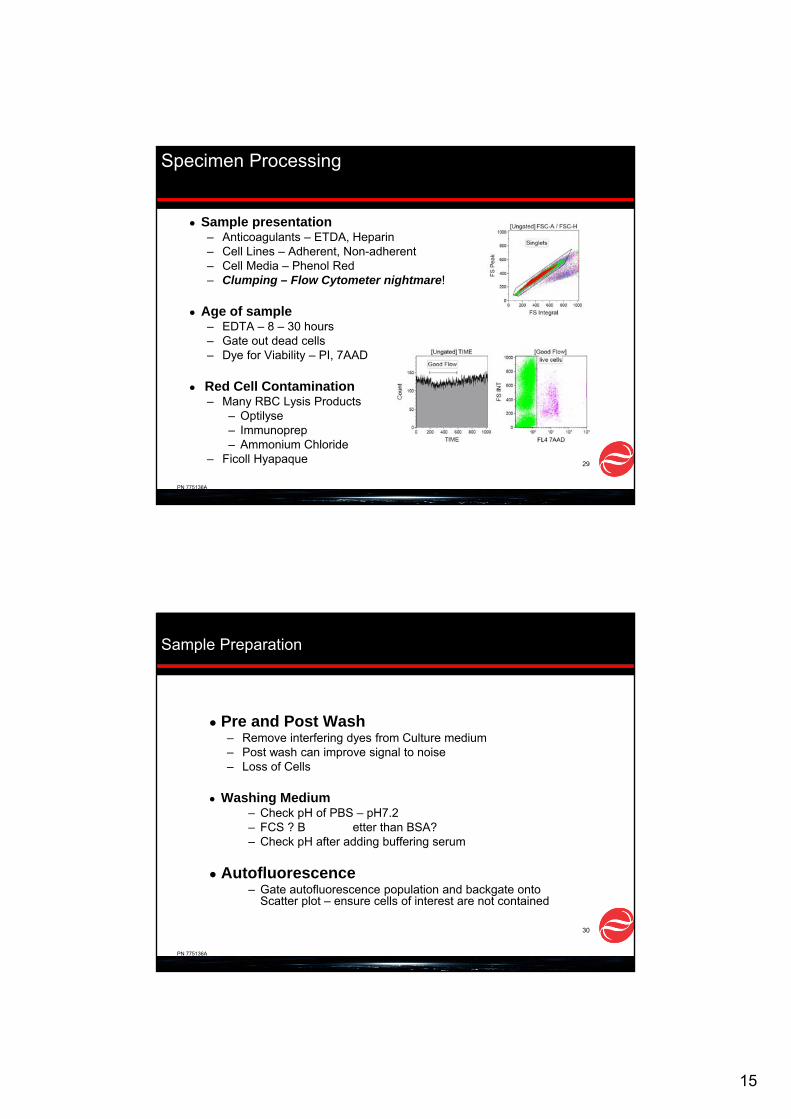
Optimal Formulation
● Formulation Choice– Choose highest Signal/Noise within saturation area of curve– Moab mix must demonstrate equivalent performance to single
color reagent controls– No evidence of any interactions
0.0
5.0
10.0
15.0
20.0
0 0.2 0.4 0.6 0.8 1
Dose (ug/test)
Fluo
resc
ence
nce
S/NPositive MFINegative MFI
Single CD4 FITC CD4 FITC (with CD8 PE)
•0.0
•5.0
•10.0
•15.0
•20.0
•0 •0.2 •0.4 •0.6 •0.8 •1
•Dose (ug/test)
•Flu
ores
cenc
ence
•S/N•Positive MFI•Negative MFI
15
PN 775136A
29
Specimen Processing
● Sample presentation– Anticoagulants – ETDA, Heparin– Cell Lines – Adherent, Non-adherent– Cell Media – Phenol Red– Clumping – Flow Cytometer nightmare!
● Age of sample– EDTA – 8 – 30 hours– Gate out dead cells– Dye for Viability – PI, 7AAD
● Red Cell Contamination– Many RBC Lysis Products
– Optilyse– Immunoprep– Ammonium Chloride
– Ficoll Hyapaque
PN 775136A
30
Sample Preparation
● Pre and Post Wash– Remove interfering dyes from Culture medium– Post wash can improve signal to noise– Loss of Cells
● Washing Medium– Check pH of PBS – pH7.2– FCS ? B etter than BSA?– Check pH after adding buffering serum
● Autofluorescence– Gate autofluorescence population and backgate onto
Scatter plot – ensure cells of interest are not contained
16
PN 775136A
Sample Preparation
● Antibody-Antigen binding is a dynamic process– Influenced by three parameters
– Time– 1min – 15mins– Size of fluorochrome, cocktail size, Ag density
– Temperature– Room Temperature. If delay - refrigerate
– Concentration of Moab– Use in excess rather than less– Are you using adequate Moab for the “worst" case scenario– Questionable data?
» Use it at manufacturer’s recommendation on a normal specimen.» Run Moabs as a SINGLE stain if using in a cocktail
31
PN 775136A
32
Inhouse Cocktails!
● Do not store pre-mixes for extended periods of time– Do NOT dilute / pre-mix Moab in original vial– Do a time course study– Add protein
● Dark vials
● When in doubt – run a normal control specimen!
17
PN 775136A
33
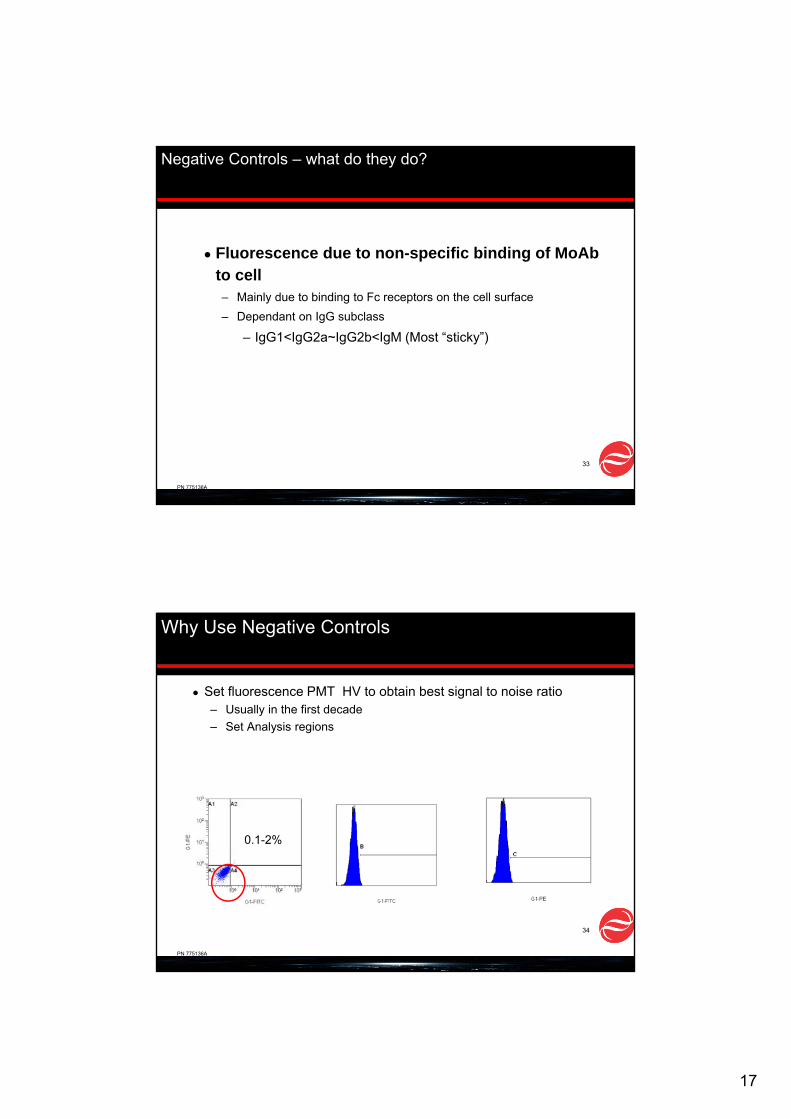
Negative Controls – what do they do?
● Fluorescence due to non-specific binding of MoAb to cell– Mainly due to binding to Fc receptors on the cell surface– Dependant on IgG subclass
– IgG1<IgG2a~IgG2b<IgM (Most “sticky”)
PN 775136A
34
Why Use Negative Controls
● Set fluorescence PMT HV to obtain best signal to noise ratio– Usually in the first decade– Set Analysis regions
0.1-2%
18
PN 775136A
35
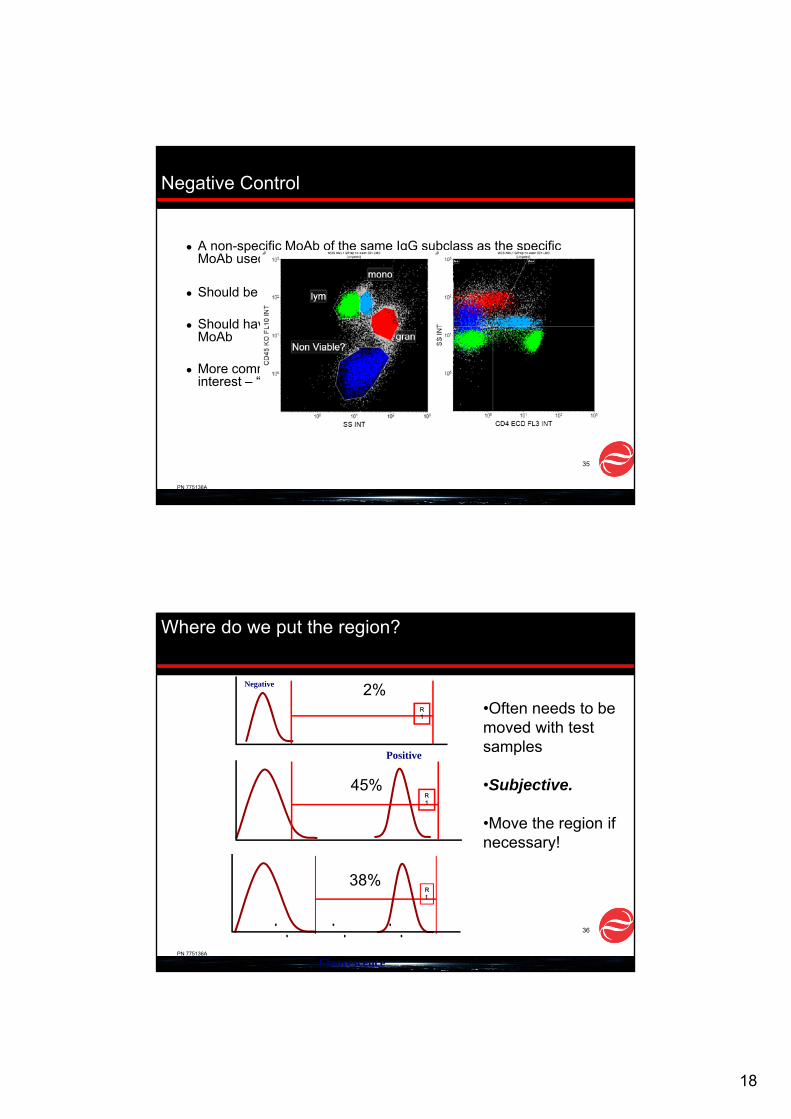
Negative Control
● A non-specific MoAb of the same IgG subclass as the specific MoAb used to assess positive staining
● Should be at the same protein concentration as the MoAb
● Should have the same Fluorchrome/Protein ratio as the specific MoAb
● More common to use the cells that stain negative for the moab of interest – “internal Control”
PN 775136A
36
Where do we put the region?
Negative
R1
Positive
Fluorescence
R1
R1
45%
38%
2%•Often needs to be moved with test samples
•Subjective.
•Move the region if necessary!
19
PN 775136A
37
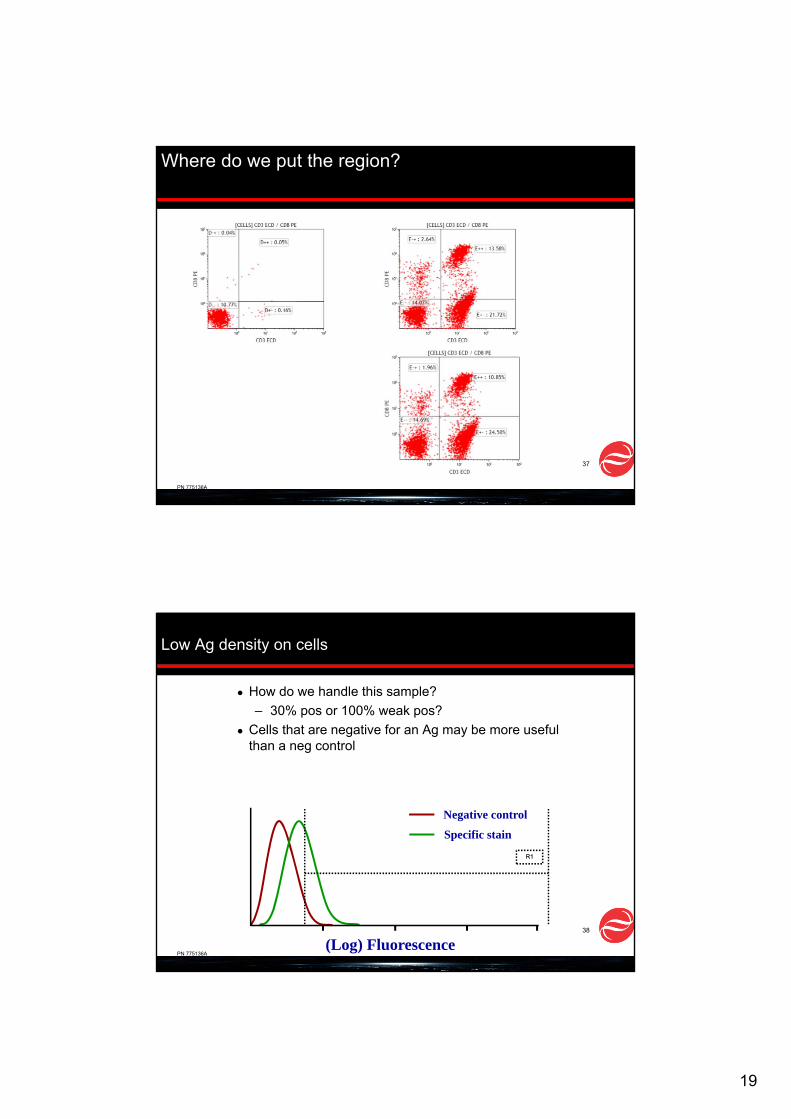
Where do we put the region?
PN 775136A
38
Low Ag density on cells
● How do we handle this sample?– 30% pos or 100% weak pos?
● Cells that are negative for an Ag may be more useful than a neg control
(Log) Fluorescence
Negative control
Specific stain
R1
20
PN 775136A
39
Application Standardisation
● Standardise the fluorescent light emitting from the Photo Multiplier Tubes
● Enables data comparison between samples and across instruments
● Maintain compensation settings
PN 775136A
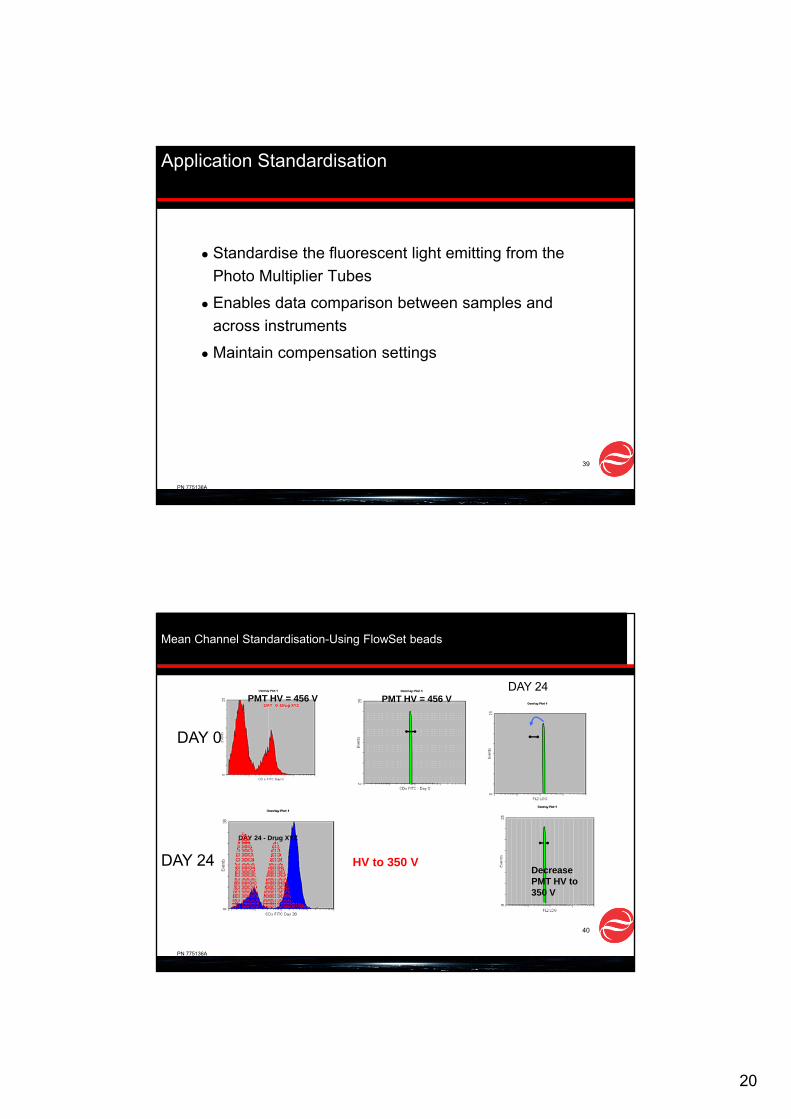
40
PMT HV = 456 V
DAY 0
DAY 24DAY 24 - Drug XYZ
HV to 350 V
Mean Channel Standardisation-Using FlowSet beads
Decrease PMT HV to 350 V
DAY 24PMT HV = 456 V
21
PN 775136A
41
Standards In Cytometry