Embed Size (px)
Citation preview
Understanding factor analysis R. J. RURIMEL Department of Political Science, U n i ~ e ~ s i t y of Huaai i
Int~*oduct ion analysis can silnultaneously nlallage over a
Thousallds of variables have been pro- posed to explain or describe the complex variety and i~lterco~lnectiolls of social and illternatio~lal relations. Perhaps an equal number of hypotheses and theories linkillg these variables have been suggested.
The few basic variables and propositions central to ullderstalldillg remain to be deter- mined. The systematic dependencies and correlations among these variables have been charted only roughly, if at all, and many, if not most, call be ~lleasurecl only on presence-absence or rank order scales. And to take the data on any one variable at face value is to beg questions of validity, reliability, and comparability.
Confronted with entangled behavior. unkno\vn interdependencies, nlasses of qualitative and cluantitative variables, and bad data, many social scientists are turning toward factor analysis to uncover major social and internatio~lal pa t terns .Vactor
hundred variables, conlpellsate for random error and invalidity, and disentangle com- plex interrelationships into their major and distinct regularities.
Factor analysis is not without cost, ho\\-- ever. It is lnathe~llatically complicated and entails diverse and numerous consideratio~~s in application. Its technical vocabulary in- cludes strange terms such as e i g e ~ z ~ n l u e s , iv iate , dim,e~zsions, orthogonal, londingr, and co~rrn11~nality. Its results usually absorb a dozen or so pages in a given report, leaving little room for a methodological iiltroductio~l or explanation of terms. Add to this the fact that students do not ordi-
narily learn factor allalysis in their formal
training, and the stun is the major cost of
factor analysis: most laymen, social scien-
tists, and policy-makers find the nature ant1 significance of the results incomprehensible.
The problem of cornn~unicati~lg factor analysis is especially crucial for peace re-
search. Scholars in this field are clraw~l An invitec1 paper for The Jolrrncll of Conflict frolll clisciplines alld professions, alld
Resolt~tion. Prepared in connection with re- search supported by the National Sciencc Fotun- f ? ~ them are acquainted with thr dation. GS-1230. For many helpful comments method. made on a previous draft. I wish to thank As our empirical kllowledge of conflict Henry Kariel, hlichael Haas, Robert Hefner:
processes, behavior, conditions, and pattelns \Voocly Pitts, and J. David Singer. Portions of the article are taken from Rummel ( 1968). beconle illcreasi~lgly expressed in factor-
"or a bibliography of applications of factor analvtic terms, those who need this knowl- analysis in the social sciences (esclucling psy- edge lnost in order to make illforlned chology), see Rummel (1968). A bibliography of a ~ ~ l i c a t i o n s to conflict and inte~national decisions may be those who are most
A A
relations is given in the ~~ppenclis below. deterred by the packaging. Indeed, they

UNDERSTANDING FACTOR AMAL1-SIS
are unlikely to know that this knowledge exists."
h conceptual map, therefore, is needed to guide the consumers of findings in con- flict and international relations through the terminological obstacles and quantitative obstructions presented by factor studies. The aim of this paper is to help dram such a map. Specifically, the aim is to enhance the understanding and utilization of the results of factor analysis. Instead of describ- ing how to apply factor analysis or discuss- ing the mathematical model involved, I
shall try to clarify the technical parapher- nalia which may conceal important substan-
tive data, propositions, or scientific lans.
By way of orientation, the first section of this paper will present a brief conceptual
review of factor analysis. In the second section the scientific context of the method \\rill be discussed. The major uses of factor analysis will be listed and its relation to induction and deduction, description and inference, causation and explanation, and classification and theo~y will be considered.
To aid understanding, the third section will outline the geometrical and algebraic factor models, and the fourth section will define
the factor matrices and their elements-the vehicles for presenting factor results. Since
comprehending factor rotation is important for interpreting the findings, the fifth and
final section is devoted to clarifying its significance.
h bibliography of factor analysis texts and applications to conflict and interna- tional relations is given in an appendix.
Wow many readers know that over a decade ago Raymond Cattell (1949) gave us the first comprehensive findings on the extent to which foreign and clomestic conflict behaviors have 13een correlated with many socioeconomic and political characteristics of nations?
1. Conceptual Ozjervieu:
Factor analysis is a means by which the regularity and orcler in phenomena can be clisceined. As phenomena co-occur in space or in time, they are patterned; as these co-occurring phenomena are independent of each other, there are a number of distinct patterns. Patterned phenomena are the essence of workaday concepts such as "table," "chair," and "house," and-at a less trivial level-patterns structure our scientific theories and hypotheses. We as- sociate a pattern of attitudes, for example, with businessmen and another pattern with farmers. "Economic development" assumes a pattern of characteristics, as does the concept of "Communist political system." The notion of conflict itself embodies a pattern of elements, i.e., two or more parties and a perception of mutually exclusive or contradictory values or goals. And to men- tion phenomena that everyone talks about, weather also has its patterns.
What factor analysis does is this: it takes thousands and potentially millions of measurements and qualitative observations and resolves them into distinct patterns of occurrence. It makes explicit and more precise the building of fact-linkages going on continuously in the human mind.
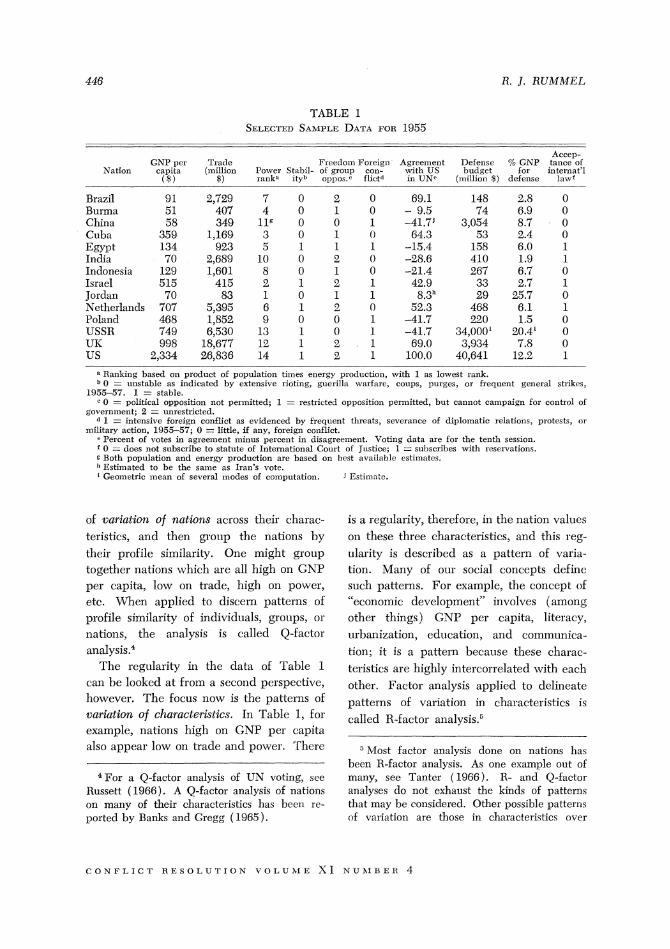
Let us look at a concrete example. Table 1 presents information on fourteen nations for ten characteristics. The nations are selected to reflect major regional, political, economic, and cultural groupings; the characteristics reflect different facets of each nation, including domestic instability and foreign conflict. The table thus con- tains 14 X 10, or 140 pieces of information for 1955. Factor analysis addresses itself to this question: "\+'hat are the patterns of relationship among these data?"
These patterns can be viewed from two perspectives. One can look at the pattern
446 H . J . RUAIMEL
TABLE 1 SELECTED SAMPLE DATA FOR 1955
Accep- GNP per Trade Freedom Foreign Agreement Defense 70 GKP tance of
Xation capita (million Power Stabil- of group con- with US budget for internat'l ( $ ) $) rank" ity"ooppos.r flict" in UN' (million $) defense law*
Brazil 9 1 Burma 51 China 58 Cuba 359 Egypt 134 India 70 Indonesia 129 Israel 515 Jordan 70 Netherlands 707 Poland 468 USSR 749 UK 998 US 2,334
Ranking based on product of population times energy production, with 1 as lowest rank. b 0 = unstable as indicated by extensive rioting, guerilla warfare, coups, purges, or frequent general strikes,
1955-57. 1 = stable. 0 = political opposition not permitted; 1 = restricted opposition permitted, but cannot campaign for control of
government; 2 = unrestricted. '1 1 = intensive foreign conflict as evidenced by frequent threats, severance of diplomatic relations, protests, or
military action, 1955-57; 0 = little, if any, foreign conflict. 'Percent of votes in agreement minus percent in disagreement. Voting data are for the tenth session. f 0 = does not subscribe to statute of International Court of Justice; 1 = subscribes with reservations, g Both population and energy production are based on best available estimates. "Estimated to be the same as Iran's vote. ' Geo~netric mean of several nodes of computation. J Estimate.
of uariatior~ of nations across their charac- teristics, and then group the nations by their profile similarity. One might group together nations which are all high on GNP per capita, low on trade, high on power, etc. TT'hen applied to discein patterns of profile similarity of individuals, groups, or nations, the analysis is called Q-factor ana ly~ i s .~
The regularity in the data of Table 1 can be looked a t from a second perspective, however. The focus now is the patterns of oariation of characteristics. In Table 1, for example, nations high on GNP per capita also appear low on trade and power. 'Thcre
4For a Q-factor analysis of UN voting, see Russett (1966). A Q-factor analysis of nations on many of their characteristics has been re- ported by Banks and Gregg ( 1965).
is a regularity, therefore, in the nation values on these three characteristics, and this reg- ularity is described as a pattern of varia- tion. Many of our social concepts define such patteins. For example, the concept of "economic development" in\ oh es (among other things) GNP per capita, literacy, urbanization, education, and communica- tion; it is a pattern because these charac- teristics are highly intercorrelated with cach other. Factor analysis applied to delineate patterns of hariation in characteristics i 4
called R-factor analysis.'
"Most factor analysis done on nations has been R-factor analysis. As one example out of many, see Tanter (1966). R- and Q-factor analyses do not exhaust the kinds of patterns that may be considered. Other possible patterns of variation are those in characteristics over

UATUERSTANDING FACTOR ANALYSIS 447
FIG. 1. The four nlajor kinds of regularity in the interrelationships between the cha~acteristics T?ofc.c.r, US coting agreement, foreign conflict, and interr~utional lute; (see Tablc 1 ) .
What actual patterns of characteristics
are revealed for the data in Table 1 by factor analysis? Figure 1 displays the four major kinds of regularity in the interrelation- ships between the characteristics: potcer, U S voting agreement, foreign conflict, and infe~nntionnl law. They involve, respec- tively, 27.6, 21.0, 16.2, and 15.3 percent -- --
time units for a spccified nation (this identifies similar time periods); in nations over time units for a characteristic (this identifies nations iimilarly changing on a characteristic); and in time units ovcr nations for a characteristic (this identifies similar time periods for nations chang- ing on a characteristic). For a discussion of these varieties of analysis, see Rummel ( 19 6f3 ) , ch. 8.
of the \-ariationo in the 140 pieces of in- fo~mation in Table 1; added together, these patterns indicate that 80.1 percent of this information has an underlying regularity.
Each pattern in Figure 1 is laid out in three isobars. The central isobar includes characteristics with at least 75 percent of their variation involved in the pattern. These arc most central to interpreting the pattern. The two remaining isobars define charactelistics related to the pattern in the range of 50-74 percent and 25-49 percent of their variation, respectively. These groups of isobars show (1) what patterns
GSection 4.2, below, discusses how such percentage figures are derived from the factor results.

R. J . R U M M E L
exist in the data and how they overlap, (2 ) what characteristics are involved in what pattern and to what degree, and (3 ) what characteristics are involved in more than one pattern.
To display another perspective, Figure 2 plots these four patterns as profiles for the nations in Table 1. On the horizontal axis, nations are ordered from low to high power- pattern values. Magnitudes on the vertical axis are in standard scores. The average score is zero and 95.5 percent of the four- teen nations will (if normally distributed) fall between scores of +2.00 and -2.00; 68.3 percent of them will fall between scores of $1.00 and -1.00. Each pattern has a different shape, which illustrates what is meant by saying that factor analysis divides the regularity in the data into its distinct patterns. If each of the ten characteristics in Table 1 were plotted as was done for the patterns in Figure 2, and those characteristics with similarly-shaped plots were grouped together, there would be four major groups, and the modal plot within each group would correspond to each of the patterns shown. Figures 1 and 2 are alternative representations of the results of factoring Table 1.
2. F a c t o ~ Analysis and Scientific Method
Factor analysis can be applied in order to explore a content area, structure a do- main, map unknown concepts, classify or reduce data, illuminate casual nexuses, screen or transform data, define relation- ships, test hypotheses, formulate theories, control variables, or make inferences. Our consideration of these various overlapping usages will be related to several aspects of scientific method: induction and deduction; description and inference; causation, ex- planation, and classification; and theory.
2.1 USES OF FACTOR ANALYSIS
This section will outline factor-analysis applications relevant to various scientific and policy concerns. Many of the uses described below overlap. My aim is not to avoid redundancy but explicitly to relate factor analysis to the diverse interests of readers.
Interdependency and pattern delineation. If a scientist has a table of data-say, UK votes, personality characteristics, or answers to a questionnaire-and if he suspects that these data are interrelated in a con~plex fashion, then factor analysis may be used to untangle the linear relationships into their separate patterns. Each pattern will appear as a factor delineating a distinct cluster of interrelated data.
Parsimony or data redziction. Factor analysis can be useful for reducing a mass of information to an economical description. For example, data on fifty characteristics for 300 nations are unwieldy to handle, descriptively or analytically. The manage- ment, analysis, and understanding of such data are facilitated by reducing them to their common factor patterns. These factors co~lcentrate and index the dispersed in- formation in the original data and can therefore replace the fifty characteristics without much loss of information. Nations can be more easily discussed and compared on economic development, size, and totali- tarianism dimensions, for example, than on the hundreds of characteristics each dimen- sion involves.
Structure. Factor analysis may be em- ployed to discover the basic structure of a domain. As a case in point, a scientist may want to uncover the primary independent lines or dimensions-such as size, leader- ship, and age-of variation in group charac- teristics and behavior. Data collected on a
C O L F L I C T R E S O L U T I O N V O L U \ I E X I N U > f B E R 4

UNDERSTANDING FACTOR ASALYSIS
Standard scores
AGREEMENT WITH U . S .

large sample of groups and factor-analyzed can help disclose this structure.
Classification o~ description. Factor anal- ysis is a tool for developing an empirical typology.' It can be used to group inter- dependent variables into descriptive cat- egories, such as ideology, revolution, liberal voting, and authoritarianism. It can be used to classify nation profiles into types ~vi th similar characteristics or behavior. Or it can be used on data matrices of a transac- tion type or a social-choice type to show how individuals, social groups, or nations cluster on their transactions with or choices of each other.
Scaling. A scientist often wishes to develop a scale on which individuals, groups, or nations can be rated and com- pared. The scale may refer to such phe- nomena as political participation, voting behavior, or conflict. A problem in develop- ing a scale is to weight the characteristics being combined. Factor analysis offers a solution by dividing the characteristics into independent sources of variation (factors). Each factor then represents a scale based on the empirical relationships among the characteristics. As additional findings, the factor analysis will give the weights to employ for each characteristic when com- bining them into the scales. The factor score results (see section 4.5 below) are actually such scales, developed by combin- ing characteristics in terms of these weights.
Hypotlqesis testing. Hypotheses abound regarding dimensions of attitude, person-
'For example, see Borgatta and Cottrell's classificatory work on groups (1935) and Schuessler and Driver's on tribes ( 1936 ). Selvin and Hagstrom (1963) show, through an example, how to use factor analysis to develop a classification of groups. Using factor analysis, Russett classifies nations into their regional groups (1967) and their UN voting blocs ( 1966 ) .
ality, group, social behavior, voting, and conflict. Since the meaning usually as- sociated with "dimension" is that of a cluster or group of highly intercorrelated characteristics or behavior, factor analysis inay be used to test for their empirical existence. Which characteristics or behavior should, by theory, be related to which di- mensions can be postulated in advance and statistical tests of significance can be ap- plied to the factor-analysis results.
Besides those relating to dimensions, there are other kinds of hypotheses that nlay be tested. To illustrate: if the concern is with a relationship between economic development and instability, holding other things constant, a factor analysis can be done of economic and instability variables along with other variables that nlay affect (hide, mediate, depress) their relationship. The resulting factors can be so defined (rotated) that the first several factors in- volve the mediating measures ( to the maxi- mum allo~ved by the empirical relation- ships). A remaining independent factor can be calculated to best define the pos- tulated relationships between the economic and instability measures. The magnitude of involvement of both variables in this pattern enables the scientist to see whether an economic development-instability pat- tern actually exists when other things are held constant.
Data transfo~mation. Factor analysis can be used to transform data to meet the assumptions of other techniques. For in- stance, application of the nlultiple regres- sion technique assumes (if tests of signif- icance are to be applied to the regression coefficie~~ts) that predictors-the so-called independent variables-are statistically un- related (Ezekiel and Fox, 1959, pp. 283- 84) . If the predictor variables are cor- related in violation of the assumption, factor
C O S F L I C T R E S O L U T I O K V O L U X I E X I K U h f D E R 4
L~NDERSTANDING FACTOR AKLIL1-SIS
analysis can be employed to reduce them to a smaller set of uncorrelnted factor scores. The scores may be used in the regression analysis in place of the original variables with the knowledge that the meaningful ~ariat ion in the original data has not been lost.s Likewise, a large number of depen- dent variables also can be reduced through factor analysis.
Exploration. In a new domain of scien- tific interest like peace research, the complex interrelations of phenomena have undergone little systematic investigation, The unknown domain may be explored through factor analysis. I t can reduce complex interrela- tionships to a relatively simple linear expres- sion and it can uncover unsuspected, per- haps startling, relationships. Usually the social scientist is unable to manipulate variables in a laboratory but must deal with the manifold complexity of behaviors in their social setting. Factor analysis thus fulfills some functions of the laboratory and enables the scientist to untangle interrela- tionships, to separate different sources of variation, and to partial out or control for undesirable influences on the variables of concern.'
Mapping. Besides facilitating explora- tion, factor analysis also enables a scientist to map the social terrain. By mapping I mean the systematic attempt to chart major empirical concepts and sources of variation. These concepts may then be used to de- scribe a domain or to serve as inputs to further research. Some social domains, such
For practical applications of this two-step design, see Buckatzsch (1947) and Berry (1960).
"11 this and related points, see the par- ticulally excellent chapters 19 and 20 in Cattell ( 1952). Cattell ( 1966) has recently elaboldtecl the position that factor analysis IS, among o the~ things, an experimental method.
as international relations, family life, and public administration, have yet to be charted. In some other areas, however, such as personality, abilities, attitudes, and cognitive meaning, considerable mapping has been done.
Theory. As will be discussed i11 section 2.5 below, the analytic framework of social theories or models can be built from the geometric or algebraic structure of factor analysis.
2.2 INDUCTION AND DEDUCTION
The use of "and" rather than "versus" in the headings of this and the following subsection emphasizes that these different \slays of interpreting or using factor analysis are not mutually exclusive. They are dif- ferent sides of the same coin. The side evident in a particular set of results depends upon the interpretation.
Factor analysis is most familiar to rc- searchers as an exploratory tool for unearth- ing the basic empirical concepts in a field of investigation. Representing patterns of relationship between phenomena, these basic concepts may corroborate the reality of prevailing concepts or may be so new and strange as to defy immediate labeling. Factor analysis is often used to discover such concepts reflecting unsuspected in- fluences at work in a domain. The delinea- tion of these interrelated phenomena enables generalizations to be made and hypotheses posed about the underlying influences bringing about the relationships. For cx- ample, if a political scientist were to factor the attributes and votes of legislators and were to find a pattern involving urban constituencies and liberal votes, he could use this finding to develop a theory linking urbanism and liberalism. The ability to relate data in a meaningful fashion is a
prime aspect of induction and, for this, factor analysis is useful and efficient.
Factor analysis may also be employed deductively, in two ways. One way is to elaborate the geo~netric or algebraic struc- ture of factor analysis as part of a theory. Within the theory the factor analysis nlodel can then be used to arrive at deductions about phenomena. This approach is cle- scribed more fully in section 2.5 below.
The second deductive approach is to hypothesize the existence of particular dinlensions and then to factor-analyze the data to see whether these dimensions emerge.'' Although factor analysis is not often used this way, the restraint is not due to methodology but to research tradi- tion. If, as an example, scholars believe that ideology, power, and trade are the primary patteins of international behavior, then this proposition can be tested. Data can be collected on those variables that index international relations in its greatest diversity, and those specific x~ariables dis- tinguishing (by theory) the ideology, power, and trade patterns should be defined. To test whether these patterns actually exist is the factor-analysis task.
UN General Assembly session can bc analyzed to describe the voting patterns of ~lations for that session, as did Alker (1964), or the voting blocs into which nations were grouped, as did Russett (1966).
Description may be only an intermediate goal, however. The ultimate goal may be to connect a number of descriptive studies to make getzeralizations about what patterns exist for such phenomena as, say, legislati\ e voting, foreign conflict, political systems, personality, or role behavior.ll Althougll generalization froill a number of descriptive studies is a form of inference, it need not be statistical inference in the sense that some statistical test of significance is ap- plied. In fact, factor analysis is seldom employed for statistical inference, although inany social scientists consider it a statistical method. The statistical requirement of a
representative sample is usually met by the research design, but the additional statistical assuinptions such as a normal frequency distribution are seldom satisfied. Indeed, the canonical factor model (section 3 below) which has been formulated to allo\v statistical inference is seldom used, and tests of significance for factor loadings are vir- 2.3 DESCRIPTION AKD IKFERENCE tually unln~own in the applied literature.
A data matrix alone be of ~ r i l l l a r ~ Description, then, and generalization interest. Research is then centered on from a llumber of descriptive studies have describing the regularities in these data,
been the tradition in applied factor analysis, Statistical problems like the type of underly-
Although tests of significance can be deter- ing frequency distribution, sample size, and
mined for the factors and loadings of a randomness of selection are not part (and
particular sample, factor analysis itself does need not be part) of the research design. As cases in point, all roll call votes in a a 1 extended discussion of description and
explanation with regard to factor analysis in See the discussion on the relationship be- psychology is given by Henrysson ( 1957).
tween hypotheses and factor analysis in Cattell Thurstone (1947, ch. 6 ) discusses factors as (1952, pp. 13-14). For an application of factor explanatory concepts in terms of a demonstra- analysis to test a hypothesis about the supposed tion problem involving the dimensions of cylin- dimensions of urban areas, see van Arsdol, ders. His illustration of this problem is helpful Camilleri, and Schmid ( 1958 ) . for understanding factor analysis in practice.
C O S F L I C T R E S O L U T I O K V O L U h I E X I X U 3 1 l 3 E R 4

UNDERSTAND1h7G FACTOR ANALYSIS
not require such tests.12 Factor analysis is a mathenlatical tool as is the calculus, and not a statistical technique like the chi- square, the analysis of variance, or sequen- tial analysis.
2.4 ~AUSATIOS, CXPLANATIOX,
AND CLASSIFICATION
The idea of "cause" has had a strange fascination for scientists. Books and schol- arly papers have been devoted to iust the meaning and usage of the terin.13 No won- der, then, that the relationship between causation and factor analysis has been controversial in factor-analysis literature. The issue centers on whether a factor pat- tern represents a causal nexus.''
Modern science conceives of causation as a temporal regularity of phenomena or, inore precisely, a functional (mathematical) relationship between phenomena. The term "cause" is then simply an expression of uniform relationships, that is, of a generally
The distinction being drawn here is be- tween descriptive and inferential statistics, not between description ancl statistics.
l-ome of the more excellent treatments are those by Frank (1955, ch. l ) , Kaufmann (1958, ch. 6 ) , the essays by Russell, Feigl, and Nagel in Part V of Feigl and Brodbeck (1953), ancl Nagel ( 1961).
l4 "It would seem that in general the variables highly loaded in a factor are likely to be the causes of those which are less loaded, or at least that the most highly loaded measures- the factor itself-is causal to the variables that loacled on it" (Cattell, 195z, p. 362). Cattcll and Sullivan ( 1962) conducted a demonstration experiment by factoring data on cups of coffee to determine arhether patterns corresponding to known causal influences could be delineated. They found a strong correlation betwcen the known patterns of influences and those definecl by the factor analysis. With like results a similar experiment m8as conducted on the dy- namics of balls (Cattell and Dickman, 1962). These artificial experiments are helpful in understandillg applied factor analysis.
observed concurrence or concomitance of phenomena. Even though this interpreta- tion drops out interesting connotations like "to bring about," or "to influence," it re- moves a fuzziness from the concept and gives it a denotation consonant with scien- tific method and philosophy.
Does factor analysis define factors, then, that can be called causes of the patterns they represent? The answer must be yes.'" Each of the variables analyzed is mathemat- ically related to the factor patterns. The regularities in the phenomena are described by these patterns, and it is these regularities that indicate a causal nexus. Just as the pattern of alignment of steel filings near a magnet can be described by the concept of magnetism, for example, so the concept of magnetism can be turned around and be said to cause the alignment. Likewise, an economic development pattern delineated by factor analysis can be called a cause. In this sense, an authoritarianisill factor causes certain attitudes, a turmoil factor causes riots, and an urbanism factor causes liberal voting.
The term explmzafiotz adds nothing to the term cause. Although laden in the social sciences with a surplus meaning associated with ue~,stelze?~, a feeling of understanding or getting the sense of some- thing,'' the explanation of phenomena is nothing more than being able to predict or n~atlzemaiically relate phenomena. To ex- plain an event is to be able to predict it (see Hempel, 1965, ch. 12 and, for contrast, Hanson, 1959). To explain that the Ronlan Empire fell because of disuility and moral decay is to say that, given the presence of
I" Positive empirical evidence for this view is referred to in note 14.
See the clear and explicit analysis by Abel (1953) of the operation of ve~stehen in the social sciences.
these two elemelits in an empire wit11 the characteristics of the Roman Empire, the empire will break up or be conquered.
Prediction itself is based an the identi- fication of causal relations, i.e., regularit!.. Therefore, if a factor can be called a cause, it can be called an explanation.
If one wants to avoid controversy over causation, on the other hand, factor patterns may be treated as purely descriptive or classificatory. .A factor name like "turmoil" will then be a noun describing phenomena sharing one characteristic: appearance in time or space with a certain uniformity. "House," "horse," "social group," "legisla- ture," and "nation" are such nouns, and factors may be conceived likewise. "Eco- nomic development" or "size," as factors actually delineated through factor analysis (Rummel et al., 1968), can be descriptive categories subsuming a pattern of telephones per capita, GNP per capita, and vehicles per capita as distinct from a pattein of population, area, and nationaI income.
The aim of science is theory. Facts or data are nleaningless in themselves. They must be linked through propositions which confer meaning. M7ere inan unable to per- ceive such relationships, his capacity to manipulate, process, or understand facts ~vould be overwhelmed. Relationships re- curring with high probability become scien- tific laws that may be incorporated into a theory covering the domain in which they are applicable.
-4 scientific theory consists of hvo com- ponents:17 analytic and empirical. The
l7 One of the best discussions of theory is given by Nagel (1961, ch. 6 ) . That throry corlstruction consists of two parts is argued by Einstein. See the essays on Einstein's philos- ophy by Frank, Lenzen, ancl Northrup in Schilpp ( 1949).
analytic conlponent is the linking of sym- bolic statements through chains of reasoning that obey logical or mathematical rules but that have little or no operational-empirical content. The symbols involved may refer to line, atom, dimension, force, power (mechailical or social), group, or ideology. Statements involving these symbols may be associated through verbal reasoning, sym- bolic logic, or mathematics. Whatever thc symbols or mode of reasoning, this analytic
a ion component of theories can be the cre t ' of the scientist's imagination, the distillati011 of a scholar's experience with the subject matter, or a tediously built structure slon~ly erected on a foundation of nunlerous esperi- ments, inr,estigation, and findings.
The empirical component of theories is
operational. I t fastens the abstract analytic part of a theory to the facts. While the analytic part need have no empirical inter- pretation, the enlpirical component nlust verifiably link to data for a thcory to apply to "reality."
il co~lfusion between the empirical and analytic parts of a theory may have militated against a more theoretical use of factor analysis in the literature. The geometric or
algebraic nature of the factor moclel call structure the analytic framework of theory. The factors themselves can be postulated. From them, operational deductions n it11 cmpi~ical content can be derived and tested.'' The factor model represents a mathematical formalisnl departing from the calculus functions of classical physics. The
All exciting theoretical use of factor analysis hns been publishecl by Cattell (19152). He describes n role behavior nloclel potentially rooted in empirical data, tying together person- ality, struct~~rc, and syntal group dimensions. A theoretical elnboclilnent of factor analysis to relate the attributes ancl behavior of social unit5 is described in Rulnmel ( 1965).
U S D E R S T A X D I N G FACTOR .1XALYSIS
analytic part of the factor model is akin ttc; that of quantum theory.lg Vectors and their position, linear operators, and the dimen- sions (factors) of a system are the focus of concern.
Since factor analysis incorporates analytic possibilities as a theory and empirical tech- niques for connecting the theory to social phenomena, its potentiality promises much theoretical development for the social sciences. Looking ahead for a century, I suggest that factor analysis and the comple- mentary multiple regression model are initiating a scientific revolution in the social sciences as profound and far-reaching as that initiated by the development of the calculus in physics.
3. The Factor Model
In application, there are not one but several factor models which differ in signif- icant respects. A model most often applied in psychology is called common factor analysis. Indeed, psychologists usually re- serve the term "factor analysis" for just this model. Common factor analysis is con- cerned with defining the patteins of com- m o n variation among a set of variables. Variation unique to a variable is ignored. In contrast, another factor model called component factor analysis is concerned with patterning all the variation in a set of variables, whether common or unique.
Other factor models are image analysis, canonical analysis, and alpha analysis.
'"lie relationship between classical physics and quantum theory, or between Cartesian analvsis ancl Hilbertian analvsis as related to factor analysis, is discussed by Ahmavaara ( Alima\~aara ancl Markkanen, 1958, pp. 48-63 ) . This analysis is the nlost refreshing and pro- vocative the author has read on the subject. See also footnote 25, below.
Image analysis has the same purpose as common factor analysis, but more elegant mathematical properties. Canonical analysis defines common factors for a sample of cases that are the best estimates of those for the population; it enables tests of signif- icance. Alpha analysis defines common factors for a sample of variables that are the best estimates of those in a universe of content.
It would be beyond the purpose of this paper to discuss these models in any detail. (For such a discussion, see Rummel, 1968, ch. 5 . ) In the following sections only their gencral mathematical properties \\>ill be outlined. These properties clearly distill- guish the factor-analysis models froin others used in the social sciences, such as analysis of variance and multiple regression, ancl justify our consideration of these properties in reference to a generalized factor model.
3.1 GEOAIETRIC MODEL
i in understanding of the patteriis definer1 by factor analysis can be enhanced through a geometric interpretation. Each nation of Table 1 can be thought of as defining n
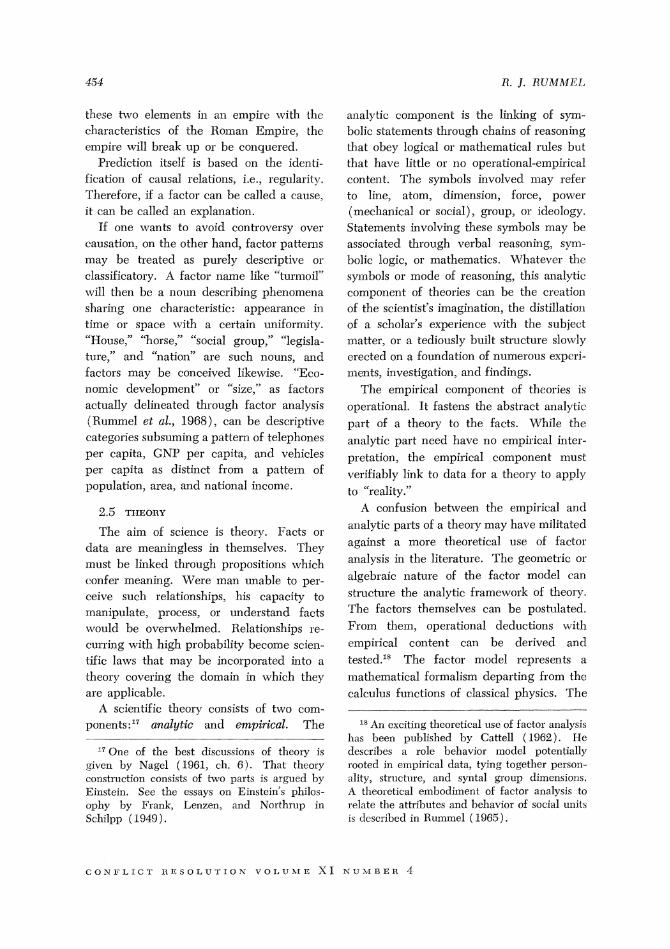
coordinate axis of a geometric space. For example, the US, the UK, and the USSR can define a three-dimensional space as given in Figure 3. Imagine that the axis for the UK is projecting a t right angles froin the paper. Although pictorially constrained to three dimensions, the space can be analytically extended to fourteen dimensions at right angles to each other and thus rep- resent the fourteen nations in Table 1.
Now, in this space each characteristic can be considered a point located according to its value for each nation. Such a plot is s h o ~ ~ n in Figure 3 for the GNP per capita and trade values of the US, UK, and USSR. To make the plot explicit, projections for
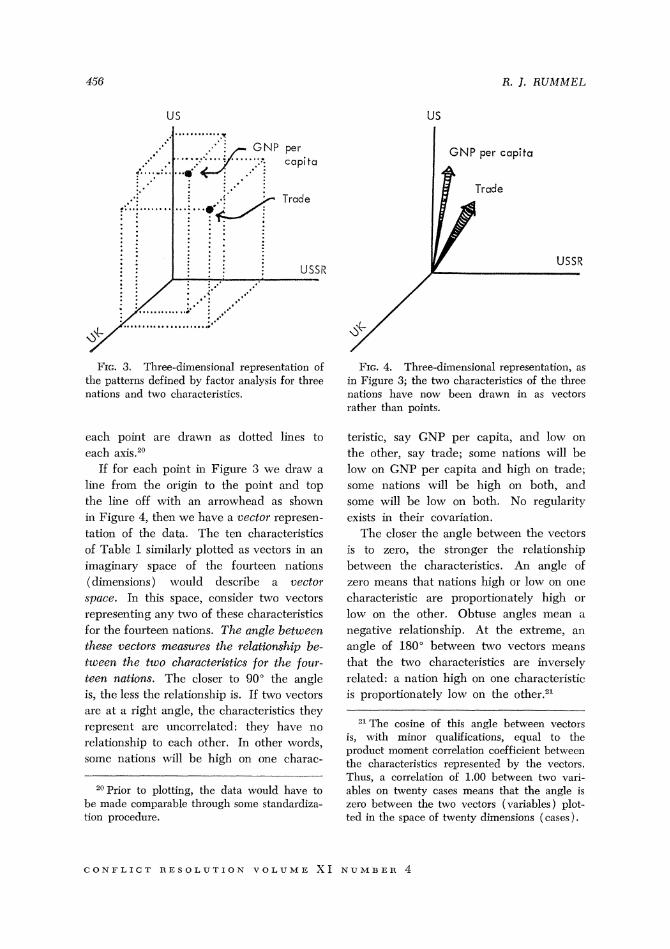
FIG. 3. Three-dimensional representation of the patterns defined by factor analysis for three nations and two characteristics.
each point are drawn as dotted lines to each axis.20
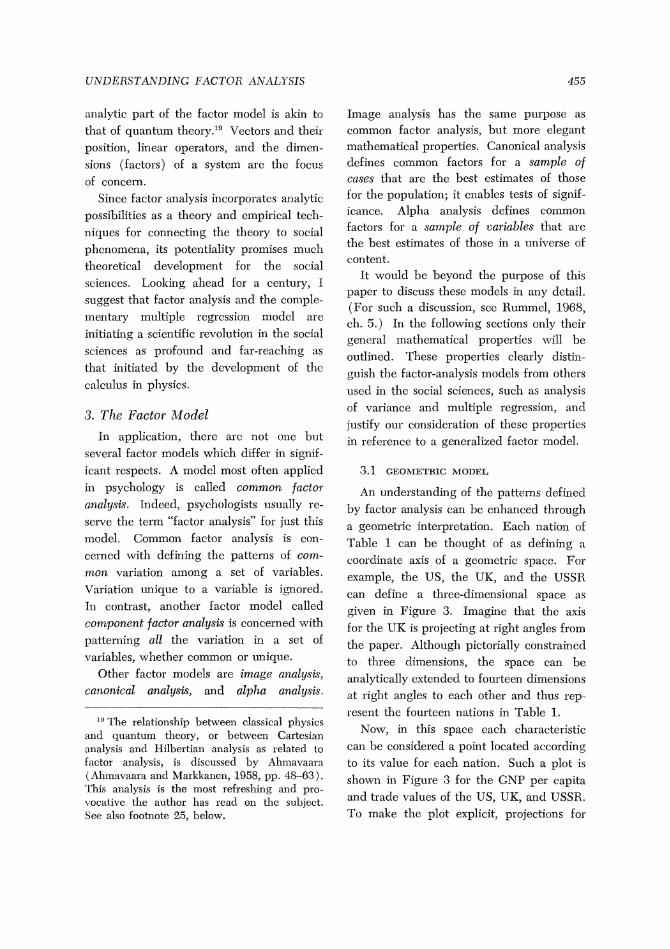
If for each point in Figure 3 we draw a line froin the origin to the point and top the line off \vith an arrowllead as shown
in Figure 4, then \i7e have a oector represen-
tation of the data. The ten characteristics of Table 1 similarly plotted as vectors in an
imaginary space of the fourteen i~ations (dimensions) would describe a vector space. In this space, consider hvo vectors representing any t\vo of these characteristics
for the fourteen nations. The angle betu;een these oectors measures the relationship be- tween the tuio characteristics for the four- teen nations. The closer to 90" the angle is, the less the relationship is. If t\vo vectors are at a right angle, the characteristics they
represent are uncorrelated: they have no relationship to each other. In other words, some nations will be high on one charac-
2nPrior to plotting, the data would have to be made comparable through some standardiza- tion procedure.
US
I GNP per capita
FIG. 4. Three-dimensional representation, as in Figure 3; the two characteristics of the three nations have now been drawn in as vectors rather than points.
teristic, say GNP per capita, and low on the other, sa>7 trade; some nations will be low on GNP per capita and high on trade;
some nations will be high on both, and some will be low on both. No regularity cxists in their covariation.
The closer the angle between the vectors
is to zero, the stronger the relationship
behveen the characteristics. An angle of zero means that nations high or low on one characteristic are proportionately high or
low on the other. Obtuse angles mean a
negative relationship. At the extreme, an angle of 180" between two vectors means
that the hvo characteristics are inversely related: a nation high on one characteristic is proportionately low on the otherb21
21 The cosine of this angle between vectors is, with minor qualifications, equal to the product nloment correlation coefficient between the characteristics represented by the vectors. Thus, a correlation of 1.00 between two vari- ables on twenty cases means that the angle is zero between the two vectors (variables) plot- ted in the space of twenty dimensions (cases).
C O S F L I C r H C S O L U T I O Y V O L U M E X I S U A I B C H 4

UNDERSTANDING FACTOR ANALYSIS
Fig. 5 (a)
Power Pattern
Foreign Con f l i c t -- Pattern
1 as in a fourteen-dimensional space clnster of vectors. ( c ) Actual factor
1 .oo- "
.50
-1 .OO -.50 - : : : : : ; : ........ . : .... i : "
5 *'.. - .50
Let the ten characteristics of Table 1 be ships. Characteristics that are highly inter- projected in the fourteen-dimensional space related will cluster together; characteristics defined by the fourteen nations as suggested that are unrelated will be at right angles i11 Figure 5 ( a ) . The configuration of vec- to each other. By inspecting the configura- tors will then reflcct the data interrelation- tion we can discern the distinct clusters of
9 " 0
.. i 6 ..........
. I . - . . . . 8 *:,:. .... 1, ................ O:
" i 1 4 ........ :..* : 1 ':. ;. .... .:. .. ;. ............. e: . . . . . . . .: ........... .:... ............. ::, 2 ... - . . :.: . . . " l : : .50 i i j . . . . . . . . . . .". . ;:,* ...a-............-.............. 4
7 5 .i
10
Fig. 5(c)
-1 .oo, FIG. 5 . ( a ) Projection of the ten characteristics in Table
(for the fourteen nations). ( b ) Axes projected through each axes identified and loadings of each characteristic indicated.

vectors (if such clusters exist), and these clrrsters index the patterns of velationship in t h e data: each clzlster is a pattern.
Were we dealing with characteristics of two or three nations, patteins could be found by simply plotting the characteristics as vectors. What factor analysis does geometrically is this: it eilables the clusters of vectors to be defined when the number of cases (dimensions) exceeds our graph- ical limit of three. Each factor delineated by factor analysis defines a distinct cluster of vector^.^"
Consider Figure 5 ( a ) again. Factor analysis would mathematically lay out such a plot and the11 project an axis through each cluster as shown in Figure 5 (b ) . This is analogous to giving each vector point in a cluster a mass of one and letting the factor axes fall through their center of g r a ~ i t y . ~ V h e projection of each \-ector point on the factor axes defines the clusters. These projections are called loodings and the factor axes arc often called factom or dimensions.
Figure 5 ( c ) pictures the power and foreign conflict patterns of Table 1. For simplicity, the configuration of points is
22 I am referring to the results of the factor- analysis research design, which include thc applicatioll of a factoring technique plus simple htructure rotation. (See section 3.2, be lo~v. ) For those familiar with linear algebra, it nlay be l~elpful to know that a factor analysis defines a set of bask dimensions for the colu~nil lrectors of a data matrix. Each basis dimension of a rotated set uniquely genemtes an independent subset of the original vectors. The basis dimen- sions of an unrotated set are ordered by their contributions to generating all the vectors.
2 V h e configuration of vectors in Figure 5 is four-dimensional. Therefore, although the
of the two independent axes is the best (orthogonal) definition of the two clusters in four-dimensional space, the two-dimensional fignrc can only display this fit imperfectly.
sho1~11, rather than xrectors, and the two factor axes are indicated (as actually de- rived from a factor analysis). The loadings of each characteristic (i.e., each point in space) on each axis are also displayecl. This figure may clarify how factor loadiilgs as a set of numbers can define (1) a pattern of relationships and ( 2 ) the association of each characteristic with each pattern. 117c will consider this geon~etrical perspectiye again when the factor matrices are dc- scribed.
For the more symbolically-oriented reader it may be helpful to present the algebraic model involved. (Others may wish to skip this section.)
A traditional approach to expressing relationships is to establish the mathemat- ical functioil f(X, W, Z) coililecting on? variable, Y, with the set of variables X, IV, and Z. Such a function might be Y = 2 5 + 32 - 2W, or Y = 4XW/Z. The variables on both the right and the left side of the equation are known, data are available, ant1 it is only a question of determining the best function for describing the relation~hips.~"
Let us say, however, that we have n
number of variables, Y,, Y,. Y,, and so on, but that we know neither the variables to enter in on the right side of the equation
nor the functions involved. This might be the situation with UN voting, for example. IVe may know the votes of nations on one roll-call (Y,), a second roll-call (Y,), etc., but not know what nation characteristics are related to what roll-calls in what way. Moreover, we may not be able to measure well the characteristics, lilce nationalism,
21 This is where curlre-fitting techniques like n x ~ l t i ~ l e linear and curvilinear regression anal.. ysis a r r helpful.

UNDERSTANDING FACTOR ANALYSIS
ideology, and democracy, that we feel might be most related to UN voting. In other words, we have clata that we wish to explain mathematically but the variables that \vould give us this explanation are unknown or unn~easurable. TVe are then in the same dilemma the nuclear physicist was in, decades ago, in describing quantum phe- nomena; and like him, we resort to an untraditional mathematical approach."
Let us assume that our Y variables are related to a number of functions operating linearly. That is,
where: Y = a variable wit11 known data a = a constant F = a function, f ( ), of some unki~o\vn
variables.
It is crucial in understanding factor analysis to remember that F stancl.~ for n fzinction of ~ariables and not n variable. For example, the functions might be I?, =
X\V + 22, and Fy = 3~22,1'~'% The un- known variables entering into each function, F, of equations (1) are related in unknown ways, although the equations relating the luilctions themselves are lineal . ' T o take our UN voting example again, two func- tions, F, related to voting behavior may be -- --
2 V h e factor analysis model has much in conlmon with quantum theory. This is one reason I have argued, as I do in section 2.5 above, that factor analysis is a theoretical structure as well as a data analysis technique. See SIargenau (1950, ch. 1 7 ) for a clear ancl simple description of quantum theory. Burt (1941) and ilhmavaara in Ahmavaara and blarkkanen (1958) have also drawn the com- parison of factor analysis with quantum theory. " Confusion on this score has caused much
unfounded criticism of factor analysis as deli11- eating only linear relationships.
ideology and nationalism. BLI~ each of these functions itself may be the result of a com- plex inte~actio~z between socioeconomic and political variables.
'I17ithin this algebraic perspective, what does factor analysis do? By application to the known clata on the Y variables, factor nnalysis defines the zinknown F functions. The loadings emerging from a factor anal- ysis are the a constants. The factors are the F functions. The size of each loading for each factor measures how much that specific function is related to Y. For any of tile Y variables of equations ( 1 ) we may write
Y=a~Fl+azFZ+asFs+ . . .+ amFm, ( 2 )
with the F's represeliting factors and the a's representing loadings. We may find that some of the F functions are common to several variables. These are called gro~ip factors and their delineation is often the goal of factor analysis. For UN voting with each Y variable being a UN roll-call, for example, Allter and Russett (1 965) found "supernationalism" and "cold war" as group factors, anlong others, related to voting.
Besides determining the loadings, fac- tor analysis will also generate data (scores) for each case (individual, group, or nation) on each of the F functions uncovered. These derived values for each case are called factor scores. They, along with the data on Y and the equations ( I ) , give a mathematical relationship among clata as useful and important as the classical equa- tions like Y = 2X + 32.
Let us look a t the data of Table 1 in the context of this section. The table lists data on ten variables representing charac- teristics of fourteen nations. A factor anal- ysis of these data brought out four functions, F, as linearly related to two or more vasi- ables. These results enable us to give con- tent to equations (1). Leaving out those
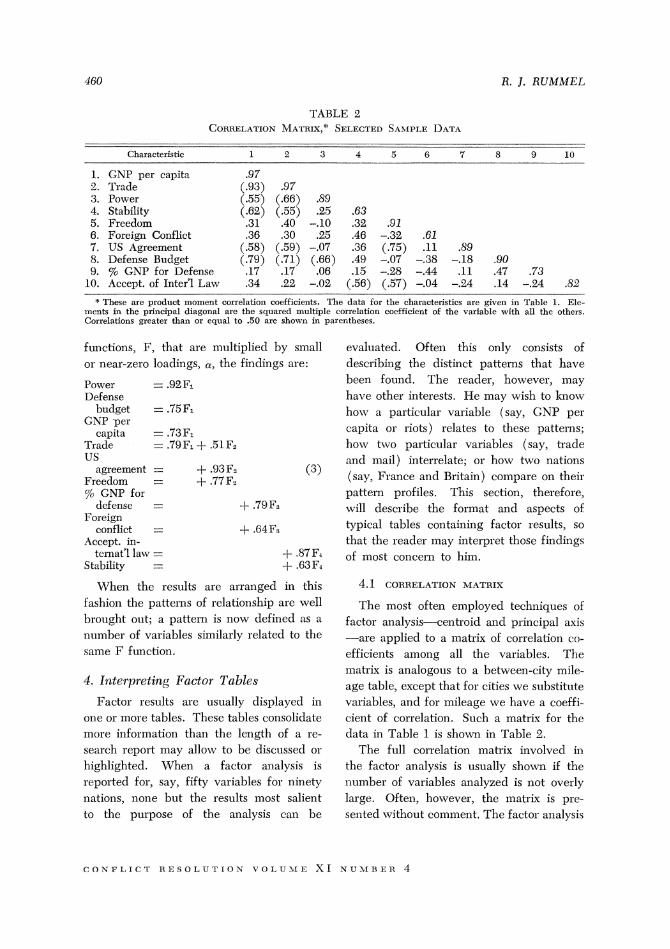
TABLE 2 CORREL.ATION MA~?IIX,* SELECTED SA>II"LE D.4T.4
-- -- Characteristic 1 2 3 4 5 6 7 8 9 10
1. GNP per capita 2. Trade 3. Power 4. Stability 5 . Freedom 6. Foreign Conflict 7. US Agreement 8. Defense Budget 9. % GNP for Defense
10. Accept. of Inter'l Law
" These are product moment correlation coefficients. The data for the characteristics are given in Table 1. Ele- ments in the principal diagonal are the squared multiple correlation coefficient of the variable with all the others. Correlations greater than or equal to .SO are shown in parentheses.
functions, F, that are nlultiplied by small or near-zero loaclings, a, the findings are:
Power = .92F1 Defense
budget = .75F1 GNP per
capita = .73F1 Trade = .79FI+ .51F, US
agreement = + .93F? Freedom = + .77F,
(3)
% GNP for defense = + .79F,
Foreign conflict = -1 .B4F,
Accept. in- tcmat'l law = + .87F,
Stability = + .63F,
When the results are arranged in this fashion the patteins of relationship are well brought out; a pattern is now defined as a number of variables sinlilarly related to the same F function.
4. Interpfvting Factor Tables
Factor results are usually displayed in one or more tables. These tables consoliclate more information than the length of a re- search report may allow to be discussed or highlighted. When a factor analysis is reported for, say, fifty variables for ninety nations, none but the results most salient to the purpose of the analysis can be
evaluated. Often this only consists of describing the distinct patterns that have been founcl. The reader, however, nlay have other interests. He may nzish to know how a particular variable (say, GNP per capita or riots) relates to these patterns; how two particular variables (say, trade and mail) interrelate; or how two nations (say, France and Britain) compare on their pattern profiles. This section, therefore, will describe the format and aspects of typical tables containing factor results, so that the reader may interpret those finclings of most concern to him.
4.1 CORREL.4TION MATRIX
The most often employed techniques of factor analysis-centroid and principal axis -are applied to a matrix of correlation co- efficients among all the variables. The matrix is analogous to a between-city mile- age table, except that for cities we substitute variables, and for mileage we have a coeffi- cient of correlation. Such a matrix for the data in Table 1 is shown in Table 2.
The full correlation matrix involvecl in the factor analysis is usually sho\vn if the number of variables analyzed is not overll- large. Often, ho\vever. the matrix is pre- sented ~vithout comment. The factor analysis
UNDERSTANDING FACTOR ANALYSIS
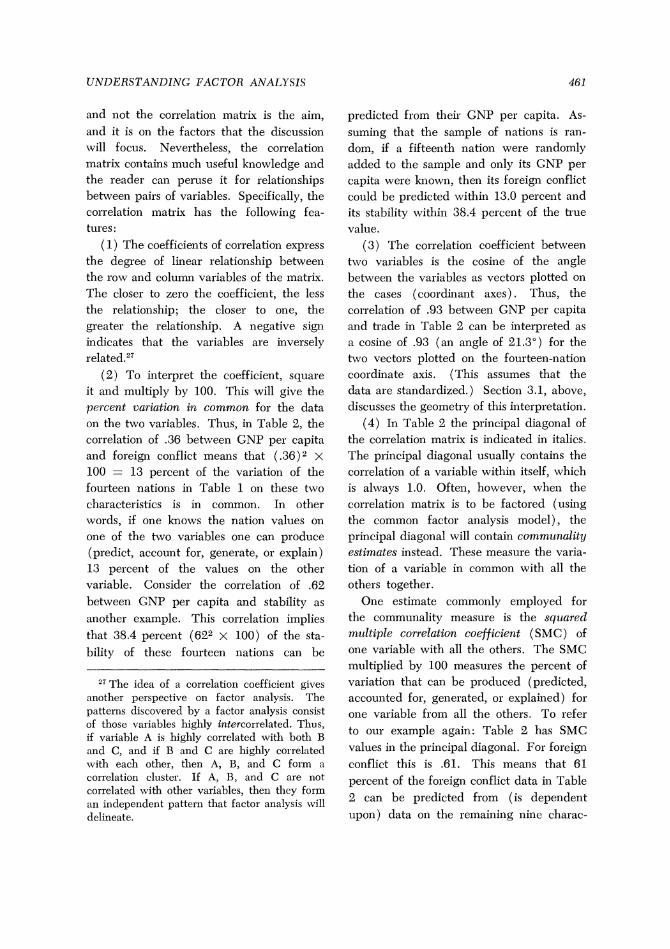
and not the correlation matrix is the aim, and it is on the factors that the discussion will focus. Nevertheless, the correlation matrix contains much useful knowledge and the reader call peruse it for relationships between pairs of variables. Specifically, the correlation matrix has the following fea- tures :
(1) The coefficients of correlation express the degree of linear relationship between the row and column variables of the matrix. The closer to zero the coefficient, the less the relationship; the closer to one, the greater the relationship. A negative sign indicates that the variables are inversely relatedS2'
( 2 ) To interpret the coefficient, square it and multiply by 100. This will give the percent variation in common for the data on the two variables. Thus, in Table 2, the correlation of .36 between GNP per capita and foreign conflict means that (.36)2 x 100 = 13 percent of the variation of the fourteen nations in Table 1 on these two characteristics is in common. In other words, if one knows the nation values on one of the two variables one can produce (predict, account for, generate, or explain) 13 percent of the values on the other variable. Consider the correlation of .62 between GNP per capita and stability as
another example. This correlation implies that 38.4 percent (622 x 100) of the sta- bility of these fourteen nations can be
" The idea of a correlation coefficient gives another perspective on factor analysis. The patterns discovered by a factor analysis consist of those variables highly intercorrelated. Thus, if variable A is highly correlated with both B and C, and if B and C are highly correlated with each other, then A, 3, and C form a correlation cluster. If A, B, and C are not correlated \vith other variables, then they form an independent pattern that factor analysis will delineate.
predicted from their GNP per capita. As- suming that the sample of nations is ran- dom, if a fifteenth nation were randomly added to the sample and only its GNP per capita were known, then its foreign conflict could be predicted within 13.0 percent and its stability within 38.4 percent of the true value.
( 3 ) The correlation coefficient between two variables is the cosine of the angle between the variables as vectors plotted on the cases (coordinant axes). Thus, the correlation of .93 between GNP per capita and trade in Table 2 can be interpreted as a cosine of .93 (an angle of 21.3") for the two vectors plotted on the fourteen-nation coordinate axis. (This assumes that the data are standardized.) Section 3.1, above, discusses the geometry of this interpretation.
(4 ) In Table 2 the principal diagonal of the correlation matrix is indicated in italics. The principal diagonal usually contains the correlation of a variable within itself, which is always 1.0. Often, however, when the correlation matrix is to be factored (using the common factor analysis model), the principal diagonal will contain commzinality estimates instead. These measure the varia- tion of a variable in common with all the others together.
One estimate commonly employed for the communality measure is the squared mzlltiple correlation coefficient (SMC) of one variable with all the others. The SMC multiplied by 100 measures the percent of variation that can be produced (predicted, accounted for, generated, or explained) for one variable from all the others. To refer to our example again: Table 2 has SMC values in the principal diagonal. For foreign conflict this is .61. This means that 61 percent of the foreign conflict data in Table 2 can be predicted from (is dependent
upon) data on the remaining nine charac-

I . GNP per cap
2. Trade
3. Power
4. Stabil i ty
5. Freedom
6. Foreign Conf l ic t
7 . U .S . Agreement
8 . Defense Budget
10. Accept. o f Inter ' l Law
Percent Total Variance 40.9 22.5 9.1 7.6
Percent Common Variance 50.9 28 . I 1 1 .4 9.6
25 .91 .76
FIG. 6. Unrotated factor inatris (diagrainnlecl) from data in Table 1. (Principal axes technique. Factoring stopped at eigenvalues less than .50.)
teristics. By knowing a nation's data on the nine characteristics we could determine the incidence of foreign conflict behavior for that nation within 61 percent of the true value, on the average.
With an understanding of the key inter- pretations just given, the reader should be able to consult a correlation matrix and test a number of hypotheses and theories. Many of our social hypotheses involve relations between two variables, and it is in the correlation matrix that such empirical relations are described.
4.2 UNROTATED FACTOR MATRIX
Two different factor matrices are often displayed in a report on a factor analysis. The first is the tinrotated factor matrix; it is usually given without comment. The second is the rotated factor matrix; it is generally the object of interpretation. The rotated matrix will be considered in the next section (4.3).
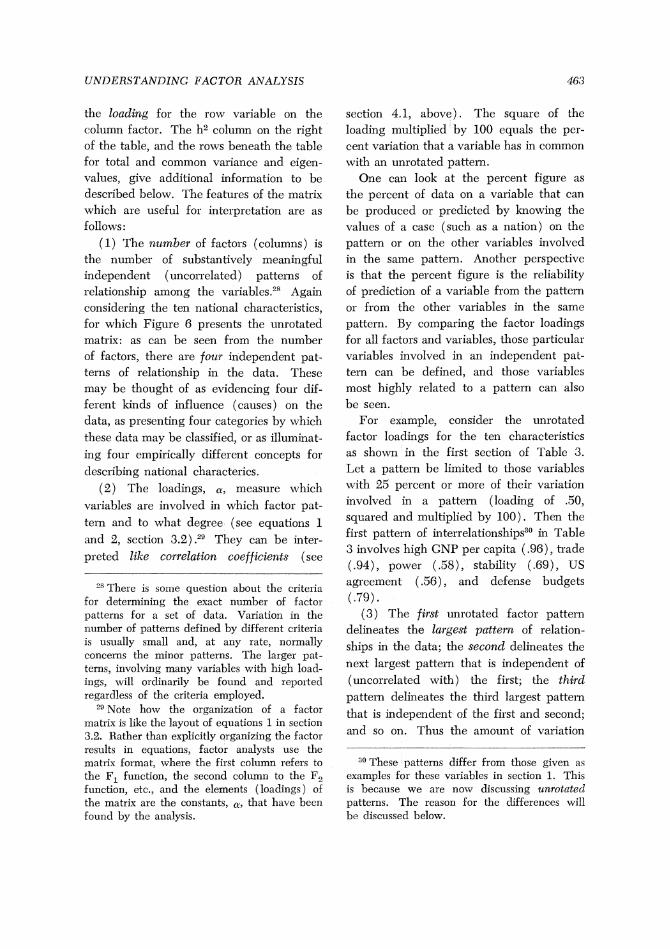
Figure 6 displays the format of an un- rotated factor matrix. The columns define the factors; the rows refer to variables. In the intersection of row and column is given
C O X F L I C T R E S O L U T I O N V O L U : \ I G X I X U h f B E R 4
UNDERSTANDING FACTOR ANALYSIS
the loadiizg for the row variable on the column factor. The hQolumn on the right of the table, and the rows beneath the table for total and common variance and eigen- values, give additional information to be described below. The features of the matrix which are useful for interpretation are as follows:
(1) The number of factors (columns) is the number of substantively meaningful independent (uncorrelated) patteins of relationship among the variables.28 Again considering the ten national characteristics, for which Figure 6 presents the unrotated matrix: as can be seen from the number of factors, there are four independent pat- terns of relationship in the data. These may be thought of as evidencing four dif- ferent kinds of influence (causes) on the data, as presenting four categories by which these data may be classified, or as illuminat- ing four empirically different concepts for describing national characterics.
(2 ) The loadings, a, measure which variables are involved in which factor pnt-
tern and to what degree (see equations 1 and 2, section 3 . 2 ) . 2 V h e y can be inter- preted like co~relation coefficients (see
'"here is 60111e question about the criteria for determining the esact number of factor patterns for a set of data. Variation in the number of vatterns defined bv different criteria is usually small and, at any rate, normally concerns the minor patterns. The larger pat- terns, involving many variables with high load- ings, will ordinarily be found and reported regardless of the criteria employed.
2Wote how the organization of a factor matrix is like the layout of equations 1 in section 3.2. Rather than explicitly organizing the factor results in equations, factor analysts use the matrix format, whele the first column refers to the F1 function, the second column to the F2 function, etc., and the elements (loadings) of the matrix are the constants, a, that have been founci by the analysis.
section 4.1, above). The square of the loading multiplied by 100 equals the per- cent variation that a variable has in common with an unrotated pattein.
One can look at the percent figure as the percent of data on a variable that can be produced or predicted by knowing the values of a case (such as a nation) on the pattern or on the other variables involved in the same pattern. Another perspective is that the peicent figure is the reliability of prediction of a variable from the pattern or from the other variables in the same pattern. By comparing the factor loadings for all factors and variables, those particular variables involved in an independent pat- tein can be defined, and those variables most highly related to a pattern can also be seen.
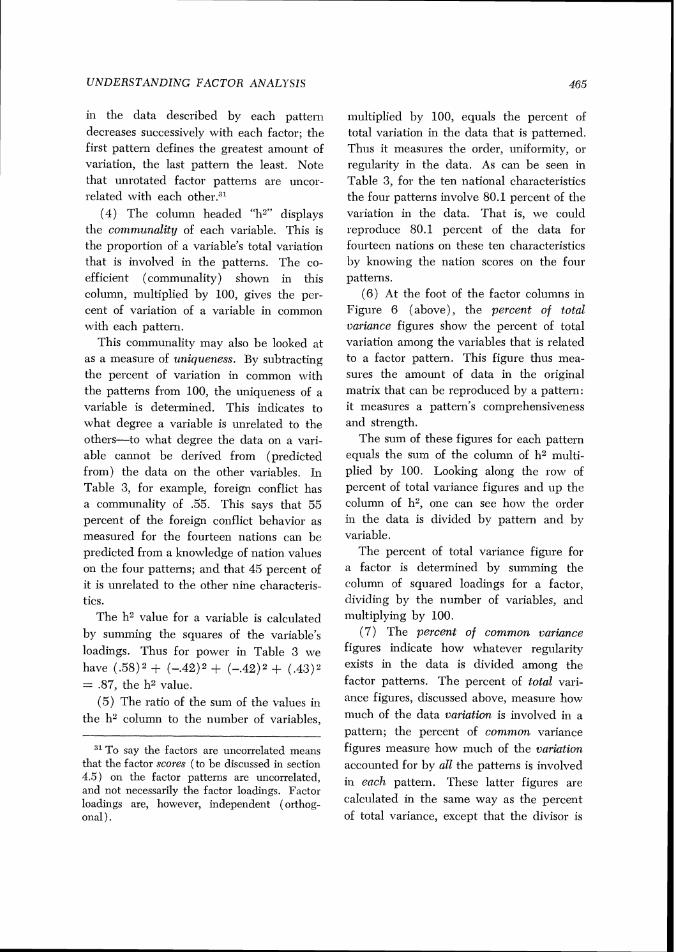
For example, consider the unrotated factor loadings for the ten characteristics as shown in the first section of Table 3. Let a pattern be limited to those variables n i th 25 percent or more of their variation involved in a pattern (loading of .50, squared and multiplied by 100). Then the first pattern of interrelationships30 in Table 3 involves high GNP per capita ( . 96 ) , tiade ( .94), power (.58), stability ( .69) , US agreement ( .56) , and defense budgets ( 79) .
(3 ) The first unrotated factor pattern delineates the largest pattern of relation- ships in the data; the second delineates the next largest pattern that is independent of (uncorrelated with) the first; the thhd pattern delineates the third largest pa t t e~n that is independent of the first and second; and so on. Thus the amount of variation
" These patterns differ from those given as examples for these valiables in section 1. Thls 1s because we ale now cliscussing unrotatetl pattelns. The reason for the diffelences will be discussed below.

TABLE 3
Primary oblique factors
Unrotated factors2
Variables
GNP per capita Trade Power Stability Freedom Foreign conflict US agreement Defense budget % GGP for defense Accept. IR law
Percent total variance 40.9 22.5 9.1 7.6 Percent common variance 50.9 28.1 11.4 9.6
Orthogonally rotated facto:sl) Pattern factorsC Structure factorsc
h" 1 2 3 4 1 2 3 4 1 2 3 4
(.73) .47 2.9 .30 (.64) .46 .21 .19 (.78) ( 57 ) .42 .46 (.79) ( 5 1 ) .19 .16 (.73) (.52) .07 .04 (31 ) (.GO) .33 .34 (.92)-.17 -.03 -.01 (.98)-.15 -.I7 -.07 (.go)-.08 .14 .08 .32 .25 .34 (.63) .17 .16 .31 (.60) .40 .35 .39 (.69)
-.02 (.77) -.34 .40 -.07 (.73) -.34 .32 -.04 (.81) -.34 .49 .25 -.19 (.64) .23 .12 -.23 (.62) .26 .35 -.I4 (.67) .25 .13 (.93) -.03 . l l .05 (.94) -.03 -.01 .12 (.94) -.01 .27
(.75) .10 .48 .12 (.67) .09 .39 .06 (.82) .17 (.61) .24 .07 -.03 (.77) -.I7 -.05 .OO (.82) -.I8 .17 -.05 (.79) -.15 .03 .18 -.I3 (.87) -.06 .OG -.I5 (.89) .08 .30 -.13 (.89)
27.6 21.0 16.2 15.3 34.7 26.5 20.4 19.4
Sum of squares 2.41 2.01 1.52 1.39
:* Loadings greater than an absolute value of .SO shown in parentheses. From Figure 6. Varimax rotation. Biquartimin rotation at 12 major cycles and 712 iterations.
U N D E R S T A N D I N G FACTOR A N A L Y S I S
in the data described bj7 each pattern decreases successively xvit11 each factor; the first pattern defines the greatest amount of variation, the last pattern the least, Note that unrotated factor patterns are uncor- related with each other."'
( 4 ) The colunln headed "h2" displays the cor,zmunality of each variable. This is the proportion of a variable's total variation that is involved in the patterns. The co- efficient (communality) shown in this column, multiplied by 100, gives the per- cent of variation of a variable in common with each pattern.
This communality may also be looked at as a measure of uniqueness. By subtracting the percent of variation in common with the patteins froin 100, the uniqueness of a variable is determined. This indicates to xvhat degree a variable is unrelated to the others-to what degree the data on a vari- able cannot be derived from (predicted from) the data on the other variables. In Table 3, for example, foreign conflict has a communality of .55. This says that 55 percent of the foreign coriflict behavior as measured for the fourteen nations can be predicted from a knowledge of nation values on the four patterns; and that 45 percent of it is unrelated to the other nine characteris- tics.
The h%alue for a variable is calculated by summing the squares of the variable's
loadings. Thus for power in Table 3 we have ( .58)2 + (-.42)2 + (-.42)2 + ( .43)2 = .87, the 112 value.
(5 ) The ratio of the sum of the values in the h2 column to the number of variables,
31 To say the factors are uncorrelated means that the factor scores (to be discussed in section 4.3) on the factor patterns are uncorrelated, and not necessarily the factor loadings. Factor loadings are, however, independent (orthog- onal ) .
multiplied by 100, equals the percent of total variation in the data that is patterned. Thus it measures the order, uniformity, or regularity in the data. As can be seen in Table 3, for the ten national characteristics the four patterns involve 80.1 percent of the variation in the data. That is, we could reproduce 80.1 percent of the data for fourteen nations on these ten characteristics by knowing the nation scores on the four pattenls.
(6 ) At tlle foot of the factor coluillns in Figure 6 (above), the percent of total variance figures show the percent of total variation among the variables that is related to a factor pattern. This figure thus mea- sures the amount of data in the original matrix that can be reproduced by a pattern: it measures a pattern's comprehensiveness and strength.
The suin of these figures for each pattern equals the sun1 of the column of 11"ulti- plied by 100. Looking along the row of percent of total valiance figures and up the column of h', one can see how the order in the data is divided bj7 pattern and by variable.
The percent of total variance figure for a factor is determined by summing the column of squared loadings for a factor, dividing b) the number of variables, ant1 illultiplying by 100.
(7 ) The percent of common variance figures indicate how whatever regularity exists in the data is divided among the
factor patterns. The percent of total vari- ance figures, discussed above, measure hoxv much of the data variation is involved in a pattern; the percent of common variance figures measure how much of the variatio~z accounted for by all the patterns is involved in each pattern. These latter figures are calculated in the same way as the percent of total variance, except that the divisor is
now the sum of the column of h%alues, which measures the common variation among the data.
(8) Thc eigenvalzles equal the sum of the columil of squared loadings for each factor. They measure the amount of varia- tion accounted for by a pattern. Dividing the eigenvalues either by the number of variables or by the sum of h2 values and ~nultiplying by 100 determines the percent of either total or common variance, respec- tively. Often only the eigenvalucs are dis- played at the foot of factor tables. ''
Not a11 factor studies present the h' values or the percent of commoil or total variance. From the points just made, how- ever, the reader should be able to calculate them himself. In conjunction, informatioil on the factor loadings and on commuilalities should enable the reader to relate the find- ings in an unrotated matrix to his particular concerns.
4.3 ROTATED FAC'I'OR hlATRIS
The rotated factor matrix should not dif- fer in format from the unrotated factor matrix, except that the h2 may not be given and eigeilvalues are inappr~priate.~"
"The eigenvalues are extracted only if the principal axes method of factor analysis is used. Ail eigenvalue is the root of the characteristic equation [R - XI] = 0, where R is the correla- tion matrix, h is an eigenvalue, I is an identity matrix, and the brackets mean that the deter- illillant is being computed. Let X be an or- thogonal matrix with columns determined such that XR = hX. Then the various roots. h. are the eigenvalue solutions to the equation and X is the matrix of eigenvectors. The factor matrix is equal to the eigenvectors times the reciprocal square root of their associated eigen- values.
33Although equal to the sum of squared factor loadings, the eigenvaiue is technically a solution of the characteristic equation (see footnote 32) for the unrotnted factors. The
The uilrotated factors successively define the most general patteins of relationship in the data. Not so with the rotated factors. They delineate the distinct cltlsters of rela- tionships, if such exist. This is meiltioned here to alert the reader to this difference. The distinction is clarified with illustrations in section 5 below.
The following features characterize the rotated matris:
(1 ) If the rotated matrix is orthogonal, that is mentioned in the title of the matris (e.g., "orthogonally rotated factors"), or else the word varimax or quartimax appears in the title (these are techniques for or- thogonal rotation). An ortl~ogonally rotated matrix appears in the second section of Table 3, for the ten national characteristics of Table 1. The unrotated factor matrix from Figure 6 is also given for comparisoil (first section of Table 3 ) . For an orthogo- nally rotated matrix the following aspects should be noted:
(1.1) Several features of the unrotated. nlatrix are preserved by the orthogoi~ally rotated matrix. These are the features described in section 4.2, above, under point (1 ) on the number of factors indicating thc number of patterns, point (2 ) on interpret- ing loadings, point ( 6 ) on the percent of total variance, and point (7) on the percent of common variance.
(1.2) The h2 values given for the un- rotated factors do not change with orthog- onal rotation. Hence they may be given with either the unrotated or the rotatecl factor matrix.
(1.3) In the unrotated matrix, factor patteills are ordered by the amount of data variation they accouilt for, with the first defining the greatest degree of relationship in the data. In the orthogonally rotated
rotated factors are derived from these by trans- formation ( rotation).
C O N F L I C T R E S O L U T I O N V O L U L I E ? j I N U h I B E R 4
C7KDERSTAA'DIA'G FACTOR ANALYSIS
matrix, no significance is attached to factor order.
( 1.4 j Factors are uncorrelated (refer back to footnote 31). For example, in Table 3, the first orthogonally rotated pat- tcrn-which might be labeled a power pattern-is uncorrelated with the second pattern, that of U N agreement with the US.
(2) If the rotated matrix is oblique rather than orthogonal, the title or description of the matrix will indicate this. The title may also contain strange terms like couarimin, quartimin, or biquartimin. These refer to various criteria for the rotation and need not trouble us here.
Oblique rotation means that the best definition of the uncorrelated and correlated cluster patterns of interrelated variables is sought. Orthogonal rotation defines only tinco~related patterns; oblique rotation has greater flexibility in searching out patte~ns regardless of their cor~elation. This differ- ence is elaborated with geometric illustra- tions in section 5 below.
Oblique rotation takes place in one of t\vo coordinant systems: either a system of p~imary axes or a system of reference axes. The reference axes give a slightly better definition of the clusters of interrelated variables than do the primary ones. For each set of axes there are two possible matrices: factor structure and factor pattern matrices. I t is irrelevant to the consumer of factor results whether oblique primary or reference factors are given. There is an important difference, however, behveen the pattern matrix and the structure matrix.
(2.1) The primary factor pattern matrix and the refer~nce factor s tn~cture matrix delineate the oblique patterns or clusters of interrelationship among the variables. Their loadings define the separate patterns and degree of involvement in the patterns
for each variable. Unlike the unrotated or the orthogonally rotated factors, however, their loadings cannot be strictly interpreted as the correlation of a variable with a pattern, and the squared loadings do not precisely give the percent of variation of a variable involved in a pattern. Neverthe. less, as in the orthogonal factor matrix, their loadings are zero when a variable is not involved in a pattern, and close to 1.0 when a variable is almost periectly related to a factor pattern.34 The less correlated the oblique patterns are with each other, the more their loadings are like correlations of variables with patterns. With this under- standing in mind, the reader might roughly interpret the primary pattern matrix or reference structure matrix loadings as cor- relations. By squaring them and multiply- ing by 100 to get an idea of the approximate percent of variation involved, the reader will have a conceptual anchor for under- standing the configuration of loadings.
The third section of Table 3 displays the (primary) oblique pattern factor matrix for the ten national characteristics. These may be compared with the orthogonally rotated factors sho\+n in the second section. Note how much more distinct the patterns are when defined by oblique rotation ( the pat- tern matrix) than by orthogonal rotation. There are fewer moderate loadings and more high and lo\v loadings, thus giving a better definition of the pattern of relation- ships.
(2.2) The primary factor structure matrix and the reference factor pattern matrix give the correlation of each variable with each pattern. The loadings are strictly interpret- able as correlations. They can be squared and multiplied by 100 to measure the per-
" The pattern matrix loadings are best under- stoocl as regression coefficients of the variables on the patterns.

TABLE 4 ~MPORTAST DIFFERENCES AMOXG ROTATED FACTOR ~ ~ A T R I C E S
Primaly axes -
Reference axes
Orthogonal Pattern Structure Pattern Structure
Characteristics of 2ording.s: Loadings distinguish clusters
of interrelated variables yes yes no no yes Loadings measure correlation
heheen cluster and variable yes 11 o yes yes no
cent of variation of a variable accounted for by a pattern. The last section of Table 3 shows the (primary) oblique structure factors matrix for the ten national charac- teristics. The basic difference between the primary structure and pattern matrices (or reference pattern and structure matrices) relevant for interpretation is that the pri- mary pattern loadings best sho\v \vl~at variables are highly involved in what clus- ters. The primary pattern loadings distinctly display the patterns. The primary structure loadings, howel er, do not display then1 well; instead, they measure the correlation of variables with the patterns. Note in Table 3 how much better the pattelms among the ten national characteristics are differentiated by the pattern matrix loadings than by the structure matrix.
By this time, the many distillctiolls men- tioned may have created more confusioll than understanding. Table 4 shows the important differences for the several ma- trices considered. The difference between primary and reference matrices is one of geometric perspective. Reference matrices give a slightly better definition of the oblique patterns and are preferred by psychologists. Because of a simpler geo- metrical representation, however, I often use the primary matrices.
(2.3) The oblique factors will have a correlatiol~ among them as sho\m in a
factor correlation matrix. This matrix is discussed in section 4.4, below.
(2.4) Figures for percent of comn~oll variance and percent of total variance are not given for the oblique factors. In order to get some measure of the strength of the separate oblique factor patterns, the sum of a column of squared factor loadings may be computed. This has beer1 done in 'Tal~le 3 for the oblique factors for the tell national characteristics.
4.4 FACTOR CORRELATIOX MATRIX
This is a correlation matrix betn~cen oblique factor patterns found through oblique rotation. Some studies may call this a matrix of factor cosines. The cosines, honever, can be read as correlations be- tureen pattenls, and vice versa. The charac- teristics of a correlation matrix describetl in section 4.1 apply equally well here.
What does a nonzero correlation between two factors mean? It means that the data patterns themselves have a relationship, to the degree measured by the factor correla- tions. The idea that pattelxs can be related is not strange, since we continually deal with such notions in social theorizing. Weather patterns are related to transporta- tion patterns, for example, and a moderniza- tion pattern is related to cultural patte~ns. Factor analysis makes these links explicit through oblique rotation and the factor correlatio~l matrix.
UNDERS TAXDING FACTOR ANALYSIS
TABLE 5 F LCrOR CO~IRELA~?OXS, SEI.ECTED S.LIXPLE
DATA -- Factors
-- Factors 1 2 3 4
1. Power 1.00 2. US Agreement .09 1.00 3. Foreign Conflict .31 .OO 1.00 1. Accept. of
Inter'l Law .20 2 8 .04 1.00
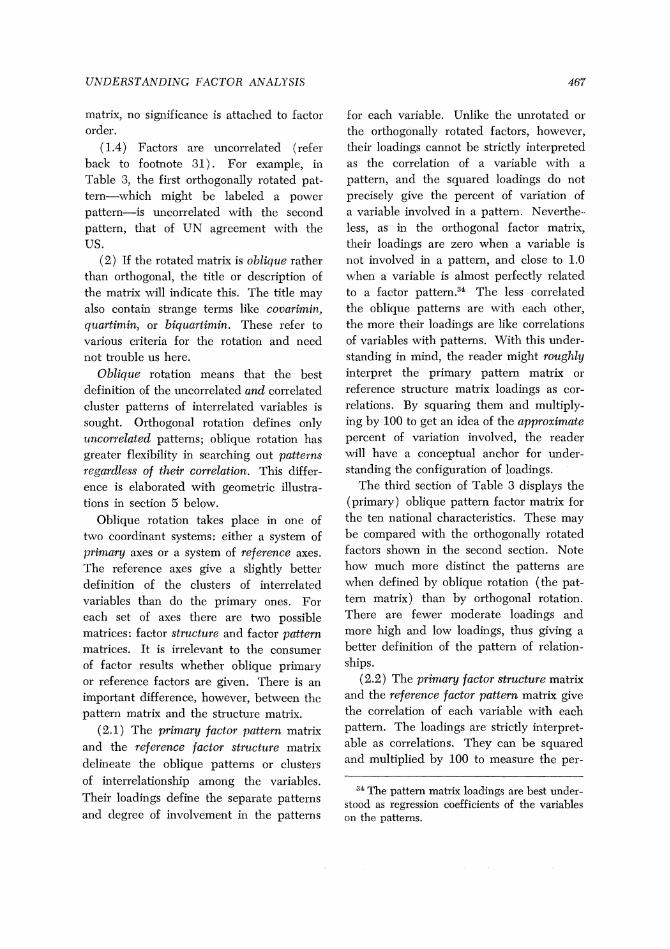
Table 5 presents the factor correlations for the oblique factors shown in Table 3. From Table 5 it can be seen that voting agreement with the US and foreign conflict patterns are in fact orthogonal (uncor- related) to each other. The foreign conflict pattern does have some positive relationship (.31) to the power pattern, however.
Sometimes the factor correlation matrix can itself be factor-analyzed, as was the variable correlation matrix. This will un- cover the pattern of relationships among the factors; the interpretation of these pat- terns docs not differ from those found for the variable correlations. The reduction of factor interrelationships to their patterns is called higher order factor analysis.
4.5 FACTOR SCORE MATRIX
The factor matrix presents the loadings, a, by which the existence of a pattern for the variables can be ascertained. The fnctor score mafrix gives a score for each case (such as a nation) 011 these patterns.
The factor scores are derived in the folloxving way: Each variable is weighted proportionally to its involvement in a pat- tern; the more involved a variable, the higher the weight. Variables not at all related to a given pattern-like the case of defense budget as percent of G N P , a vari- able unrelated to the orthogonally rotated first pattern in Table 3-would be weighted
TABLE 6 SELECTED SAVPLE FACTOR SCORES'~
O~thogonallp rotated factors
1 2 3 4 (Agree (For. (111ier'l
Sation.; (Powel) US) conflict) Inl?.)
Brazil - .389 1.053 -1.227 -1.070 Burma - .584 .010 - .097 - .955 China 325 -1.601 - .083 - .641 Cuba - ,662 ,859 - .325 -1.183 Egypt - .716 - .761 ,448 1.331 India .I82 - ,639 -1.807 .909 Indonesia ,027 -. .480 - ,712 - .757 Israel -1.275 .518 ,097 1.897 Jordan -1.577 .426 2.018 - .719 Netherlands -0.315 .570 - .638 1.292 Poland .410 -1.382 - ,296 - ,267 USSR 1.129 -1.336 1.726 - .304 UK 1.081 1.178 - .024 - ,404 US 2.365 1.586 ,919 .90G
* These are standardized regression estimates.
near zero. To determine the score for a case on a pattern, then, the case's data on each variable is multiplied by the pattern weight for that variable. The sum of these weight-times-data products for all the vari- ables yields the factor score. Cases will have high or low factor scores as their values are high or low on the variables entering a patter11.~' For an econon~ic development pattern involving G N P per capita, tele- phones per capita, and vehicles per capita, for example, the factor scores derived from the weighted summation of data of nations on these variables would place the United States as the highest, Japan as moderate, and Yemen near the bottom.
How are factor scores to be interpreted? Simply as data on any variable are inter- preted. G N P as a variable, for example, is a composite of such variables as hog
35 These factor scores then give vtilues for each case on t l~c functions, F, of equations 1 through 3 in section 3.2. V'ith the constant, ,?,
defined by the factor matrix and the factor scores clefining the value of the function, F, the factor equations are completely specifiecl.
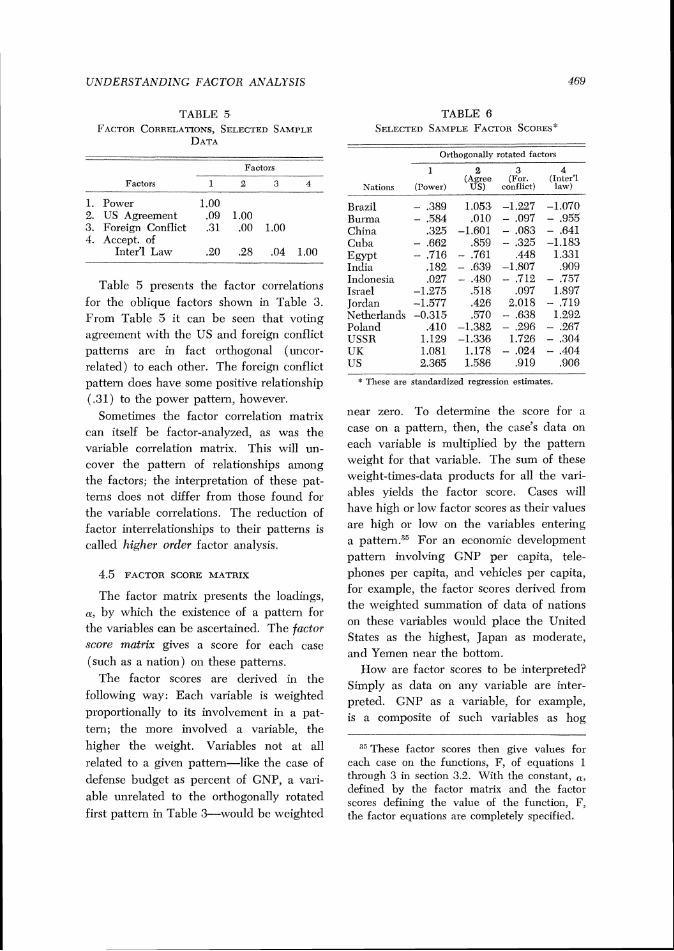
Foreign Conflict Pattern
@ USSR
-2.0 Is rae l - @ Power - __-
Pattern
Brazil - I o 0 @ t
FIG. 7 . Factor scores for the fourteen nations on two patterns, poziier and fo~eigtz co~zflict.
production, steel production, and lrehicle tated) four patterns of Table 3. These production. Similarly, population is a corn- scores are rtandardized, which means they posite of population subgroups. 111 the have been scaled so that they have a mean same fashion, factor scores on, say, an of zero and about two-thirds of the values econoi~lic developnient pattern are a com- lie between +1.00 and -1.00. Those scorcs posite. The composite variables represented greater than +1.00 or less than -1.00, by factor scores can be used in other anal- yses or as a means of comparing cases on the patterns. But the factor scores have one feature that may not be shared by inany other variables. They embody phe- llomena with a functional unity: the phe- nomena are highly interrelated in tiinc or space.
Table 6 displays the factor scores for the fourteen nations on the (orthogonally ro-
therefore, are unusually high or lour. Figure 2 (earlier) plots these factor scores for the four patterns separately, and Figure 7 plots scores on the po\iTer and foreign conflict patterns against each other.
4.6 ISTERPRETISG FhCTOlZS
The loadings and factor scores describing the patterning of the data are found by the analysis. Once the patterns are determined,
C O N F L I C T R E S O L U T I O N V O L U S I C X I P i U S I D E R 4
U N D E R S T r l N D I N G F A C T O R AATALl 'SIS
the scientist will study them and attach an appropriate label. These labels facilitate the communication and discussion of the results; they also serve as instrumental tags for further manipulation, mnemonic recall, and research. The scientist may label the patterns in any one of three ways: symbol- ically, d e s c ~ i p t i ~ e l y , or catlsally.
Symbolic labels are simply any symbols without substantive meaning of their own. Their purpose is merely to denote the patterns. Three factor patterns, for ex- ample, may be labeled Dl, D,, and DB, or '4, B, and C. A label such as Dl can be made equivalent to a given patteim without fear of adding surplus meaning. Alterna- tively, to name a pattern "economic develop- ment" or "totalitarianism" might have dif- ferent connotations for different people.
Although symbolic tags are precise and help avoid confusion, they also create prob- lems in communicating research findings and comparing studies. At the present stage of research in the social sciences, symbolic tags have yet to acquire agreed-on meanings reflecting a well-tested set of patterns, as has happened with vitamins.
By contrast, d e s c ~ i p t i ~ e labels like "agree- ment with the US," once defined, can be easily renlembered and referred to without redefinition. They are clues to factor con- tent perhaps similar to those found by other studies. A descriptive interpretation of a pattern comprises selecting a concept that will reflect the nature of the phe~~omena involved. If, for example, a factor analysis of nations uncovers a pattern of inter- correlated data on total area, total popula- tion, total GNP, and magnitude of resources, the pattern might be named "size." The descriptive label is meant to categorize the findings.
I11 cntlsal naming of patterns, the scientist reasons from the discovered pattenls to the
z~rzderlyitzg influences causing them. The causal tag is a capsule explanation of why a pattell1 involves particular variables. For example, a factor pattern comprising coups and purges may be symbolically labeled "C,," descriptively named "revolution," or causally termed "modernization." In the last case, the scientist may believe that thc occurrence and intercorrelation among these revolutionary actions results from the social disruption of a rapid shift from a traditional society to a modern industrial nation. As another example, a factor analysis of Con- gressional roll call votes may uncover a highly intercorrelated pattern of foreign policy issues. A descriptive label could be "foreign policy" pattern. Causally, however, it might be called an "isolationist" pattern by reasoning that a common isolationist attitude underlies the uniformity in foreign policy voting.
The approach to the interpretation of factor patterns is a matter of personal taste, communication, and long-run research strat- egy. The scientist may wish to use concepts that are congenial to the interests of the reader to facilitate communication, encour- age thought about the findings, and make their use easier. There is always the danger, however, of the fallacy of misplaced colr- creteness. The interpretations of the find- ings within the research and lay community may be as much a result of the tag itself as of what the tag denotes.
5 . Factor Rotation
Almost all published factor analyses employ rotation. A section on rotation, therefore, may aid in comprehending the nature of the results. The character of the unrotated solution will be discussed first, and after that the nature and rationale for rotation.
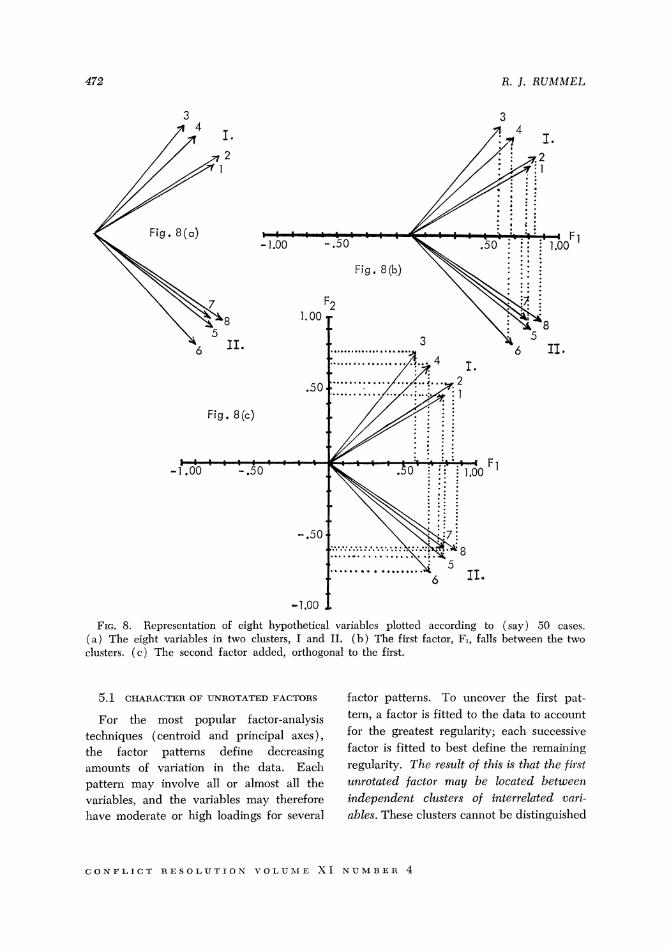
Fig.
+-t.
\\\\ . - . . Fig. 8 (b) . .
FIG. 8. Representation of eight hypothetical variables plotted according to (say) 50 cases. ( a ) The eight variables in two clusters, I and 11. ( b ) The first factor, F,, falls between tlle two clusters. ( c ) The second factor added, orthogonal to the first.
5.1 CHARACTER OF UXROTATED FACTORS
For the most popular factor-analysis techniques (centroid and principal axes), the factor patterns define decreasing amounts of variation in the data. Each pattern may involve all or almost all the variables, and the variables may therefore have moderate or high loadings for several
factor patterns. To uncover the first pat- tern, a factor is fitted to the data io account for the greatest regularity; each successive factor is fitted to best define the remaining regularity. T l ~ e reszllt of this is that the firsf unrotated factor may be located between independent clzlsters of interrelated vc~ri- ahles. These clusters cannot be distinguished
C O N F L I C T R E S O L U T I O S T - O L U h l C X I S U h l R E R 4
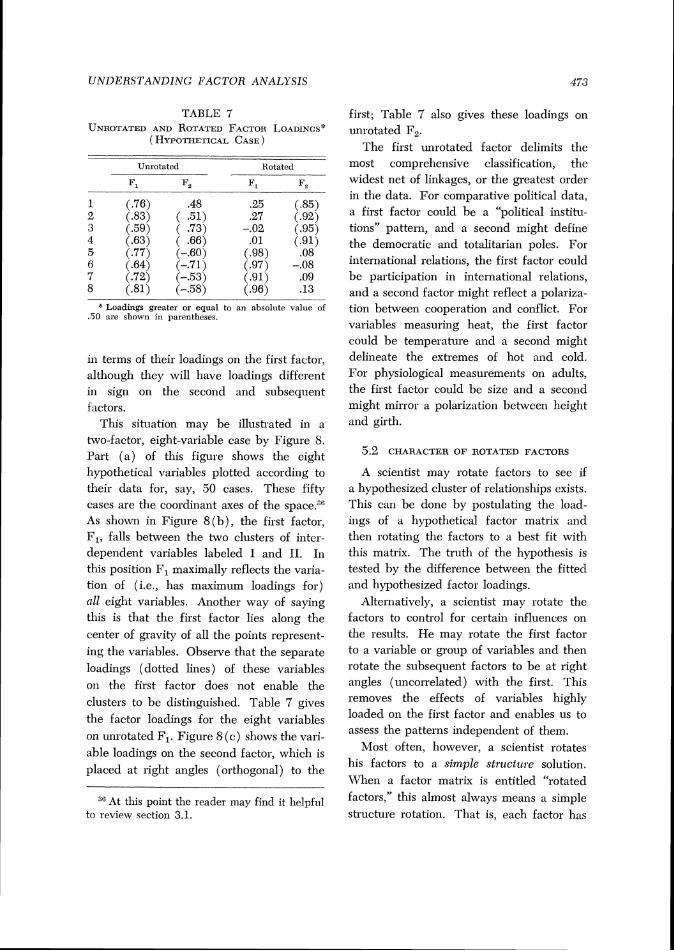
UNDERSTAA'DING FACTOR ANALYSIS
TABLE 7
- Unrotated Rotated
F1 F2 F1 F,
1 (.76) .48 .25 (.85) 2 (23) ( .51) .27 (.92) 3 (.59) ( .73) -.02 (.95) 4 (.63) ( .66) .0l (.91) 5 (.77) (-.60) (.98) .08 6 (.64) (7.71) (.97) -.08 7 (.72) (-.53) (.91) .09 8 (.81) (-.58) j.96) .13
* Loadings greater or equal to an absolute value of .50 are shown in parentheses.
in terms of their loadings on the first factor, although they will have loadings different in sign on the second and subsequent factors.
This situation may be illustrated in a two-factor, eight-variable case by Figure 8. Part ( a ) of this figure shows the eight hypothetical variables plotted according to their data for, say, 50 cases. These fifty cases are the coordinant axes of the space.'6 As shown in Figure 8 ( b ) , the first factor, F1, falls between the two clusters of inter- dependent variables labeled I and 11. In this position F1 maximally reflects the varia- tion of (i.e., has maximum loadings for) all eight variables. Another way of saying this is that the first factor lies along the center of gravity of all the points represent- ing the variables. Observe that the separate loadings (dotted lines) of these variables on the first factor does not enable the clusters to be distinguished. Table 7 gives the factor loadings for the eight variables on unrotated F1. Figure 8 ( c ) shows the vari- able loadings on the second factor, which is placed at right angles (orthogonal) to the
3F At this point the reader may find it helpful to ~evie\v section 3.1.
first; Table 7 also gives these loadings on unrotated F2.
The first unrotated factor delimits the most comprehensive classification, the widest net of linkages, or the greatest order in the data. For comparative political data, a first factor could be a "political institu- tions" pattern, and a second might define the democratic and totalitarian poles. For international relations, the first factor could be participation in international relations, and a second factor might reflect a polariza- tion between cooperation and conflict. For variables measuring heat, the first factor could be temperature and a second might delineate the extremes of hot and cold. For physiological measurements on adults, the first factor could be size and a second might mirror a polarization between height and girth.
5.2 CHARACTER OF ROTATED FACTORS
A scientist may rotate factors to see if a hypothesized cluster of relationships exists. This can be done by postulating the load- ings of a hypothetical factor matrix and then rotating the factors to a best fit with this matrix. The truth of the hypothesis is tested by the difference between the fitted ,~nd hypothesized factor loadings.
Alteimatively, a scientist may rotate the factors to control for certain influences on the results. He may rotate the first factor to a variable or group of variables and then rotate the subsequent factors to be at right angles (uncorrelated) with the first. This removes the effects of variables highly loaded on the first factor and enables us to assess the patterns independent of them.
Most often, however, a scientist rotates his factors to a simple structzl~e solution. When a factor matrix is entitled "rotated factors," this almost always means a simple structure rotation. That is, each factor has

6 FIG. 9. A sinlple structure rotation of the unrotated fact015 shown in Figure 8 (c ) . Arrows shox?
direction and degree of rotation; F\ and F"z are the new pocitions of the factors.
bee11 rotated until it defines a distinct Consider again the umotated factors cluster of interrelated variables, Through shown in Figure 8 (c) . A simple stn~cture this rotation the factor interpretation shifts rotation would be equivrile~~t to that show13 f rom unrotated factors delineating the most in Figure 9. The new factor positions F*l comprehensive data patterns to factors and FS2 now clearly distinguish the two
delineating the distinct groups of inter- clusters. This rotated factor matrix is shown
related data. in Table 7 alollgside the unrotated factors.
C O N F L I C T R E S O L U T I O S V O L V I P C X I N U h . f B E R 4

UNDERSTANDING FACTOR ANALYSIS
TABLE 8 S I ~ I F L C STRUCTURE TYPE OF ~ I A T R I X
- Unrotated factors Simple structure -
F, F, F, F * F" % .:: 1 3
Sote: The letter "x" indicates a moderate or large factor loading.
A simple structure rotation has several characteristics of interest here:
(1) Each variable is identified with one or a small proportion of the factors. If the factors are viewed as explanations, causes, or underlying influences, this is equivalent to minimizing the number of agents or conditions needed to account for the varia- tion of distinct groups of variables.
(2) The number of variables loading highly on a factor is minimized. This changes the unrotated factor patterns f~.om being general to the largest number of variables to patterns involving separate groups of variables. The rotation attempts to define a small number of distinct clusters of interrelated phenomena. The simple structure type of matrix is illustrated in Table 8. The moderate and large factor loadings are indicated by x and small load- ings are left blank.
( 3 ) A major ontological assumption underlying the use of simple structure is that, whenever possible, our model of reality should be simplified. If phenomena can be described equally well using simpler factors, then the principle of pa~simony is that we should do so. Simple structure maximizes parsimony by shifting from general factors involving all the variables to group factors involving different sets of variables.
(4 ) A goal of research is to generalize factor results. The unrotated factor solution, however, depends on all the variables. Add or subtract a variable from the study and the results are altered. The unrotated sol~l- tion should be adjusted, then, so that the factors will be inoariant of the variables selected. An invariate factor solution will delineate the same clusters of relationships regardless of the extraneous variables in- cluded in the analysis.
One of the chief justifications for simple structure rotation is that it determines invariant factors. This enables a comparison of the factor results of different studies. 1-ery seldom do different scientists study exactly the same variables. But when variables overlap between studies and each study employs simple structure rotation, tests can be made to see if the same patterils are consistently emerging.
5.3 ORTHOGONAL SIMPLE STPtUCTURE
ROTATION
One important type of simple structure rotation is orthogonal simple structure. A second type is oblique simple structure (discussed in section 5.4 below). Factors rotated to orthogonal simple structure are ~ ~ s u a l l y reported simply as "orthogonal factors." Occasionally, the oarimax or qzra~timax criteria for achieving the rot a t ' ion are used to designate the factors.
Orthogonality is a restriction placed on the simple-structure search for the clusters of interdependent variables. The total set of factors is rotated as a rigid frame, with each factor immovably fixed to the origin at a light angle (orthogonal) to every other factor. This system of factors is rotated around the origin until the system is maximally aligned with the separate clusters of variables. If all the clusters are u n ~ o r r e l ~ ~ t e d with each other, each orthog-

onal factor will be aligned with a distinct cluster. The more correlated the separate clusters are, however, the less clearly can orthogonal rotation discriminate them. Simple structure can the11 only be approxi- mated, not achieved.
Whether or not uncorrelated cluste~s of relationship exist in the data, orthogonal rotation will still define uncorrelated put- terns of relationships. These patterns may not completely overlap with the distinct clusters, but the delineation of these uncor- related factors is useful. Results involving r in correlated patterns are easier to com- municate, and the loadings can be inter- preted as correlations. hloreover, orthogonal factors are more amenable to subsequent mathematical manipulation and analysis.
5.4 OBLIQUE SIhXPLE STRUCTURE
ROTATIOX
Whereas in orthogonal simple structure rotation the final factors are necessarily uncorrelated, in oblique rotation the factors are allowed to become correlated. In orthogonal rotation the whole factor struc- ture is moved around the origin as a rigid frame (like the spokes of a wheel around the hub) to fit the configuration of clusters of interrelated variables. In oblique rotation to simple structure, however, the factors are rotated individually to fit each distinct cluster. The relationship between the result- ing factors then reflects the relationship between the clusters. Figure 10 ( a ) shows a two-factor orthogonal simple structure rotation; for comparison, Figure 10 ( b ) displays a simple structure oblique rotatioil to the same c l~s ters . '~
37 L7arious il~athematical criteria are employed to achieve oblique simple structure, and have such exotic names as quartinzin, covarimin, biqunrtimin, binormin, promax, and maxplane. These may sometimes appear in the title of an oblique factor matrix.
Fig. 10(a)
F i g . lob)
FIG. 10. ( a ) A two-factor orthogonal simple structure rotation. ( b ) A simple stn~cture oblique rotation to the same clusters.
Orthogonal rotation is a subset of oblique rotations. If the clusters of relationships are in fuct nncmelated, then oblique rotation will result in orthogonal factors. Therefore, the difference between orthogonal and oblique rotation is not in discriminating uncorrelated or correlated factors but in determining whether this distinction is empirical or imposed on the data by the model.
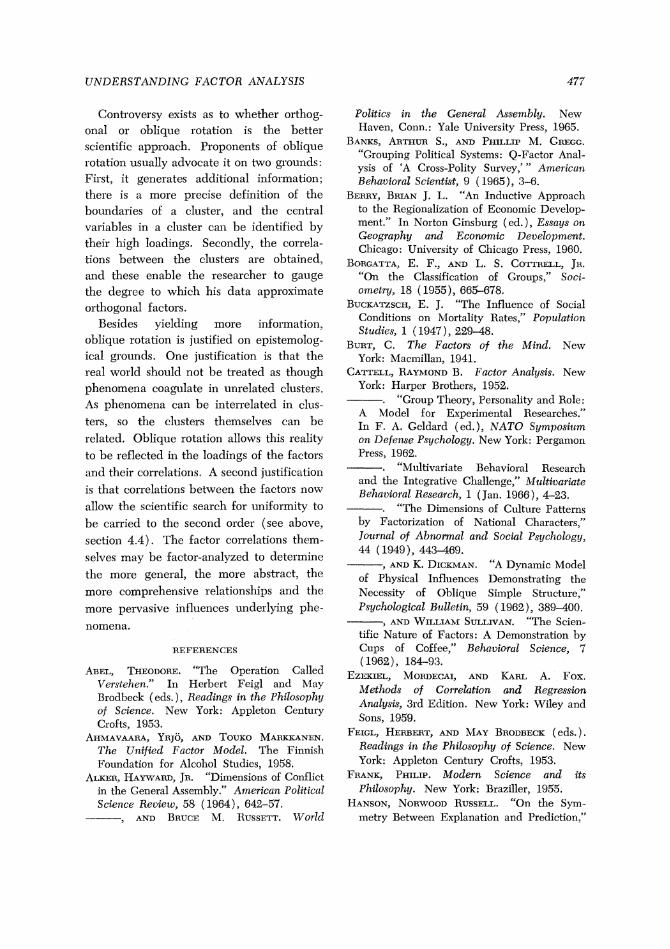
UhJDERSTANDIhTG FACTOR ANALYSIS
Controversy exists as to whether orthog- onal or oblique rotation is the better scientific approach. Proponents of oblique
rotation usually advocate it on two grounds: First, it generates additional information;
there is a more precise definition of the
boundaries of a cluster, and the central variables in a cluster can be identified by their high loadings. Secondly, the correla- tions between the clusters are obtained,
and these enable the researcher to gauge the degree to which his data approximate
orthogonal factors. Besides yielding more information,
oblique rotation is justified on epistemolog-
ical grounds. One justification is that the real world should not b e treated as though
phenomena coagulate in unrelated c l~~s te rs .
As phenomena can b e interrelated in clus-
ters, so the clusters themselves can be
related. Oblique rotation allows this reality
to b e reflected in the loadings of the factors
a 1011 and their correlations. A second justific t '
is that correlations between the factors now
allow the scientific search for uniformity to
b e carried to the second order (see above,
section 4.4). The factor col-relations them-
selves may b e factor-analyzed to determine
the more general, the more abstract, the
more comprehensive relationships and the
more pervasive influences underlying phe-
nomena.
REFERENCES
ABEL, THEODORE. "The Operation Called 17erstehen." In Herbert Feigl ancl hlay Brodbeck (eds. ), Readings in the Philosophy of Science. New York: Appleton Century Crofts, 1953.
AI~IAVAARA, YRJO, AND TOUKO MARKKANEN. The Unified Factor Model. The Finnish Foundation for Alcohol Studies, 1958.
ALKEIZ, I~AYWARD, JR. "Dimensions of Conflict in the General Assembly." American Political Science Review, 58 ( 19fM), 642-57.
-- , AND BRUCE M. RUSSETT. World
Politics in the General Assembly. New Haven, Conn.: Yale University Press, 1965.
B A ~ S , ARTHUR S., AND PHILLIP M. GREGC. "Grouping Political Systems: Q-Factor Anal- ysis of 'A Cross-Polity Survey,' '' Anleiican Behavioral Scientist, 9 (1965), 3-6.
BERRY, BRIAN J. L. "An Inductive Approach to the Regionalization of Econolnic Develop- ment." In Norton Ginsburg (ed.), Essays on Geography and Economic Deuelop~nmt. Chicago: University of Chicago Press, 1960.
BORG~TTA, E. F., AND L. S. COTTRFLL, JH. "On the Classification of Groups," Soci- ometmj, 18 (1955), 665-678.
BUCKATZSCH, E. J. "The Influence of Social Conditions on AIortality Rates," Population Studies, 1 (1947), 22948.
BURT, C. The Factors of the Mind. New York: Macmillan, 1941.
CATTFLL, RAYMOND B. Factor Analysis. New York: Harper Brothers, 1952.
. "Group Theory, Personality and Role: A Model for Experimental Researches." In F . A. Geldard (ed.), NATO Symposium on Defense Psychology. New York: Pergamon Press, 1962.
. "hlultivariate Behavioral Research and the Integrative Challenge," LMultivarmte Behavioral Research, 1 (Jan. 1966), 4-23.
. "The Dimensions of Culture Patterns by Factorization of National Characters," Journal of Abnomnal and Social Psychology, 44 ( 1949), 443469.
, AND K. DICKMAN. "A Dynamic Model of Physical Influences Demonstrating the Necessity of Oblique Silnple Structure," Psychological Bulletin, 59 ( 1962), 389400.
, AND WILLIAM SULLIVAN. "The Scien- tific Nature of Factors: A Demonstration by Cups of Coffee," Behavioral Science, 7 ( 1962), 184-93.
E z m ~ n , MORDECAI, AND KARL A. FOX. Alethods of Co~relation and Regression Analysis, 31d Eclition. New York: Wiley and Sons, 1959.
FEICL, HERBERT, AND MAY BRODBECK (eds.). Readings in the Philosophy of Science. New York: Appleton Centuiy Crofts, 1953.
FRANK, PHILIP. Modein Science and its Philosophy. New York: Braziller, 1955.
HANSON, NORWOOD RUSSELL. "On the Sym- metry Between Explanation and Prediction,"
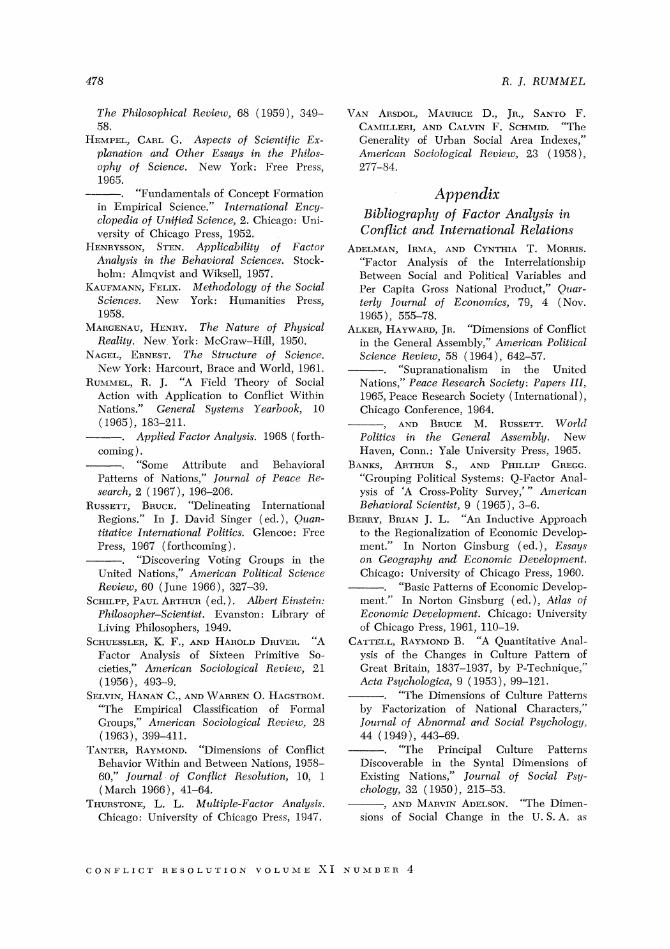
T h e Philosophical Revietc, 68 ( 1959), 349- 58.
HEMPEL, CARL G. Aspects of Scientific Ex- planation and Otlzer Essays i n the Philos- ophy of Science, New York: Free Press, 1965.
. "Fundamentals of Concept Formation in Enlpirical Science." Inte~national Ency.- clopedia of Unified Science, 2. Chicago: Uni- versity of Chicago Press, 1952.
HENRYSSOS, STEN. Applicability of Factor Analysis i n the Behavioral Sciences. Stock- holm: Almqvist and Wiksell, 1957.
KAUFMANTJ, FELIX. Methodology of the Social Sciences. New York: Humanities Press, 1958.
MARGEXAU, HENRY. T h e Nature of Physical Reality. New York: hlcGraw-Hill, 1950.
NAGEL, ERNEST. T h e St~zlctzlre of Science. New York: Harcourt, Brace ancl World, 1961.
RUMAIEL, R. J. "A Field Theory of Social Action with Application to Conflict Within Nations." General Systen~s Yearbook, 10 (1965), 183-211.
---. Applied F a c t o ~ iinalysis. 1968 (forth- coming).
. "Some Attribute and Behavioral Patterns of Nations," Jotlrnal of Peace Re- search, 2 ( 1967), 196-206.
HUSSETT, BRUCE. "Delineating International Regions." In J. David Singer ( ed . ) , Qzian- titative International Politics. Glencoe: Free Press, 1967 (forthcoming).
-- . "Discovering Voting Groups in the United Nations," American Political Science Review, 60 (June 1966), 327-39.
SCHILPP, PAUL ARTHUR ( ed. ) . Albert Einstein: Plzilosoplzer-Scientist. Evanston: Library of Living Philosophers, 1949.
SCHUKSSLER, K. F., AND HAROLD DRIVEH. "A Factor Analysis of Sixteen Primitive So- cieties," A n ~ e ~ i c a n Sociological Revieu, 21 (1956), 493-9.
SELVIX, HANAN C., AND WARREK 0. HAGSTKOII. "The Empirical Classification of Formal Groups," A~rierican Sociological Rccieto, 28 ( 1963), 399-411.
TANTER, RAY~IOKD. "Dimensions of Conflict Behavior Within ancl Betweerl Nations, 1958- 60," Jozlrnal of Conflict Resolution, 10, 1 (March 1966), 41-64.
TIIURSTONE, L. L. Multiple-Factor Anuly.cis. Chicago: University of Chicago Press, 1947.
!'LX XRSDOL, ~IAURICE D., JR., SANTO F. CAXIILLERI, AKD CALVIK F. SCHMID. "Thc Generality of Urban Social Area Indexes," Arrie~ican Sociological Reuiew, 23 ( 1958 ), 277-84.
Appendix Bibliography of Factor Analysis in Conflict and Znternatioru~l Relations
.ADELMAK, IFMA, AND CYNTHIA T. MORRIS. "Factor Analysis of the Interrelationship Between Social ancl Political Variables ancl Per Capita Gross National Product," Quar- t e ~ l y Journal of Economics, 79, 4 (Nov. 1965), 555-78.
XLKER, HAYWARD, JR. "Din~ensions of Conflict in the General Assembly," American Political Science Recieu?, 58 ( 1964), 642-57.
. "Supranationalistn in the United Nations," Peace Research Society: Papers 111, 1965, Peace Research Society (International), Chicago Conference, 1964.
, AXD BRUCE M. RUSSETT. TVorlcl Politics in the General Assembly. New Haven, Conn.: Yale University Press, 1965.
BANKS, ARTHUR S., AKD PHILLIP GREGG. "Grouping Political Systems: Q-Factor Anal- ysis of 'A Cross-Polity Survey,"' American Behavioral Scientist, 9 ( 1965), 3-6.
BERRY, BRIAN J. L. "An Inductive Approach to the Regionalization of Economic Develop- ment." In Norton Ginsburg ( ed. ), Essays on. Geog~aphy and Economic Decelopmcnt. Chicago: University of Chicago Press, 1960.
, "Basic Patterns of Economic Develop- ment." In Norton Ginsburg (ed . ) , Atlas of Economic Development. Chicago: University of Chicago Press, 1961, 110-19.
CATTELL, RAYMOND B. "A Quantitative Anal- ysis of the Changes in Culture Pattern of Great Britain, 1837-1937, by P-Technique," Acta Psychologica, 9 ( 1953), 99-121.
. "The Dimensions of Culture Patterns by Factorization of National Characters," Journal of Abnormal and Social Psychology, 44 ( 1949), 44349 . -- . "The Principal Culture Patterns
Discoverable in the Syntal Dimensions of Existing Nations," Jozl~nal of Social P.cy- chology, 32 ( 1950), 215-53.
, AND ~ I A R V I N ADELSON. "The Dimen- sions of Social Change in the U. S. A. as
UNDERSTANDING FACTOR ANALYSIS
Determined b y P-Technique," Social Forces, 30 ( 1 9 5 1 ) , 190-201.
, H. BREUL, AND H . P. HARTMAN. " A n Attempt at More Refined Definitions o f the Cultural Dimensions o f Syntality i n hlodern Nations," American Sociological Re~iecu, 17 ( 1 9 5 2 ) , 408-21.
, AND RICHARD L . GORSUCH. "The Definition and Measurenlent o f Xational Morale and Morality," Journcd of Social Psychology, 67 ( 1965) , 77-96.
CHADWICK, RICHARD W . Developiizents irz a Pa~tial T h e o ~ y of International Behavior: A Test and Ex t~ns ion of Inter-Nation Simula- tion Theory, Ph.D. dissertation, North\?-estern University, 1966.
DENTON, FRANK H. "Some Regularities in International Conflict, 1820-1949," Back- ground, 9 (Feb . 1966) , 283-96.
FEIERIREND, IVO K . AND ROSALIXD L. "Ag- gressive Behaviors Wi th in Polities, 1948- 1962: A Cross-National Study," Jou~na l of Conflict Resolution, 10, 3 (Sept . 1966 ) , 249-71.
GIBB, CECIL A. "Changes in the Culture Pattern o f Australia, 1906-1946, as Deter- nlined b y the &'-Technique," Journal of Social Psyclzology, 43 ( 1 9 5 6 ) , 225-38.
GREGG, PHILLIP M., AND ARTHUR S. BANKS. "Dimensions o f Political Systems: Factor Analysis o f A Cross-Polity Suroey," American Political Science Reoiew, 59 (Sep t . 1965 ) , 602-14.
HATT, PAUL K., NELLIE L. FARR, A X D EUGEXE WEINSTEIX. "Types o f Population Balance," American Sociological Review, 20, 1 ( F e b . 1955) , 14-21.
I,AULICHT, JEROME. " A n Analysis o f Canadian Foreign Policy Attitudes," Peace Research Society: Papers III, 1965, Peace Research Society (International) Chicago Conference, 1964.
MCCLELLAND, C., et al. The Communist Chinese Performance in Crisis and h70n-Crisis: Qzran- titatioe Studies of t he Taiwan S t~ai t s Con- frontation, 1950-84. Final Report o f Com- pleted Research under contract for Behavioral Sciences Group, Naval Ordnance Test Station, China Lake, Calif. ( N60530-11207), Dec. 14, 1965.
~ I E G E E , MARY. "Problcn~s in Regionalization and i\.Ieasureinent," Peace Research Society: Pape~s IV, 1966, Peace Research Society
(International), Cracow Conference ( 1965) , 7-35.
~ I O R R I S , CHARLES. Va~ ie t i e s of Human Value. Chicago: University o f Chicago Press, 1956.
R u x r a r ~ ~ , R . J . " A Field Theory o f Social Action M-ith Application to Conflict Wi th in Nations," General Systems Yearbook, 10 ( 1965) , 183-211.
. " A Social Field Theory o f Foreign Conflict," Peaco Research Society: Pape~s IV, 1966, Peace Research Society (International), Cracow Conference, 1965a.
. "Dimensions o f Conflict Behavior Wi th in and Between Nations," Genelnl Sys- tems Yaa~book , 8 ( 1963 ), 1-50.
. "Din~ensions o f Conflict Behavior within Nations, 1946-1959," Jou~na l of Conflict Resolution, 10, 1 ( hfarch 1966) , 65-73.
. "Dimensions o f Dyadic W a r , 1820- 1952," Journal of Conflict Resolution, 11, 2 ( J u n e 1967) , 176-83.
. "Dimensions o f Foreign and Domes- tic Conflict Behavior: Review o f Findings." In Dean Pruitt and Richard Snyder ( e d s . ) , Theories of International Cor~flict. Forthcom- ing ( 1968 ) .
, "Some Attribute and Behavioral Patterns o f Ntltions," Journal of Peace Re- search, 2 ( 1967 ), 196-206.
. "Some Dinlensions in the Foreign Behavior o f Nations," Journal of Peace Research, 3 ( 1966) , 201-24.
, J . SAWYER, H. GUETZKOW, AND K. TANTER. Dimensions of Nations. Forthc!om- ing ( 1 9 6 8 ) .
RUSSETT, BRUCE 11. "Delineating International Regions." In J . David Singer ( e d . ) , Quan- titatioe Inte~national Politics. Glencoe: Free Press, forthcoming ( 1967) .
. "Discovering Voting Groups i n the United Ilations," A m e ~ i c a n Political Science Reoierc, 60 ( June 1966) , 327-39.
. International Regions ancl Interna- tional Integration. Chicago: Rand McNally, forthconling ( 1967) .
SCHNORE, LEO F. "The Statistical Measure- ment o f Urbanization and Economic Develop- ment," Land Economics, 37, 3 ( A u g . 1961) , 229-45.
TAXTER, RAYAIOSD. "Dimensions o f Conflict Behavior ii'ithin Nations, 1955-1960: Tur-

moil and Internal War," Pence Research - . "Dimensions of Conflict Behavior Society: Papers III , 1965, Peace Research Within and Between Nations, 195M0," Society (International) Chicago Conference, Jour~lal of Confli~Y Resolution, 10, 1 (Rlarch 1964. 19G6), 41-64.
C O K F L I C T R E S O L U T I O i i V O L U h I E X I N T I % L D E R 4


![In - Chalmersgersch/report-UiO-333.pdf · tract-b a s e d In ternet Service Soft w are Dev elopm e n t: A Prop ... unicati o n b y means of message passing [14]. In [17], for](https://img.dokumen.tips/doc/110x75/5b8bef0b09d3f22c638c2375/in-gerschreport-uio-333pdf-tract-b-a-s-e-d-in-ternet-service-soft-w-are.jpg)


![[Dear Carnap, Dear Van] - Dougintersci.ss.uci.edu/wiki/eBooks/BOOKS/Carnap/[Dear... · [Dear Carnap, Dear Van] Are there letters between Carnap and Quine of which we have no copy?](https://img.dokumen.tips/doc/110x75/5b954c0909d3f2d7438c50fe/dear-carnap-dear-van-dear-dear-carnap-dear-van-are-there-letters.jpg)


