Embed Size (px)
Citation preview

Understanding exceptional performance in upstream oil and gas

Greg Bean is a director in Deloitte Consulting LLP.
Aditya Rajkumar is a manager in Deloitte Consulting LLP.
Sudamsh Bai Reddy is a senior consultant in Deloitte LLP.
About the authors
AcknowledgementsThe authors would like to thank Michael Raynor of Deloitte Services LLP and Rob Del Vicario of Deloitte Consulting LLP for their contributions to this article.
Greg BeanDirectorDeloitte Consulting LLP+1 713 982 [email protected]
Contacts
The Three Rules

Contents
Understanding exceptional performance in upstream oil and gas | 2
Conclusion | 9
Appendix A: Upstream sector analysis methodology | 10
Appendix B: Elements of ROA differential in pairs studied | 11
Endnotes | 13
Understanding exceptional performance in upstream oil and gas

ABOUT THE THREE RULES More than five years ago, Deloitte1 launched the Exceptional Company research project to determine what enabled companies to deliver exceptional performance over the long term. Adopting a uniquely rigorous combination of statistical and case-based research, this project has led to over a dozen publications in academic and management journals, including the Strategic Management Journal, Harvard Business Review, and Deloitte Review.2 The fullest expression of this work to date is in The Three Rules: How Exceptional Companies Think (www.thethreerules.com).3
The project studied the full population of all publicly traded companies based in the United States at any time between 1966 and 2010, encompassing more than 25,000 individual companies and more than 300,000 company-years of data. Performance was measured using return on assets (ROA) in order to isolate the impact of managerial choices: Measures such as shareholder returns often confound company-level behaviors with changes in investor expectations.
Using a simulation model, the researchers estimated how well each company “should” have done given its industry, size, life span, and a variety of other characteristics. They then compared this theoretical performance with how well each company actually did. A company qualified as “exceptional” if it surpassed its expected performance by more than population-level variability would predict.
Not all exceptional companies are equally exceptional, however. The researchers identified “Miracle Workers,” or the best of the best, and “Long Runners,” companies that did slightly less well but still better than anyone had a right to expect. In the entire database, there were 174 Miracle Workers and 170 Long Runners.
To uncover what enabled these companies to turn in this standout performance over their lifetimes, the researchers compared the behaviors of Miracle Workers and Long Runners with each other and with “Average Joes,” companies with average lifespan, performance level, and performance volatility.
First, to understand the financial structure of exceptional companies’ performance advantages, the researchers pulled apart their income statements and balance sheets. This provided invaluable clues: Miracle Workers systematically rely on gross margin advantages, and very often tolerate cost and asset turnover disadvantages. In contrast, Long Runners tended to rely on cost advantages and lean on gross margin to a far lesser extent.
Then, detailed case study comparisons of trios—a Miracle Worker, Long Runner, and Average Joe—in nine different sectors revealed the causal mechanisms behind these financial results. Specifically, exceptional performance hinged on superior non-price differentiation and higher revenue, typically driven by higher prices. Nothing else seemed to systematically matter; in fact, exceptional companies seemed willing to change anything, and sometimes just about everything, about their businesses in order to sustain their differentiation and revenue leads.
Hence, the three rules:
1) Better before cheaper: Don’t compete on price, compete on value.
2) Revenue before cost: Drive profitability with higher volume and price, not lower cost.
3) There are no other rules: Do whatever you have to in order to remain aligned with the first two rules.
The Three Rules
2

Understanding exceptional performance in upstream oil and gas
NEW technologies that make unconven-tional sources of oil and gas economical
to obtain and produce have created signifi-cant investment opportunities in the North American onshore oil and gas industry. Oil and gas companies also have many opportuni-ties to invest in global mega-resource projects in the ultra-deepwater, Arctic, remote gas (via liquefied natural gas), and other frontier areas. As a result, US upstream companies have a wide range of investment choices, each requiring different capabilities for success. Among these choices are whether to focus on unconventional vs. mega-resource plays, whether to target oil or natural gas, and how to balance exploration vs. exploitation.
The sector’s history can be a guide to aid companies navigating the current changes in the industry. Analyzing the sector to identify historical patterns of exceptional performance may offer clues about future performance.
Exceptional performers in upstream oil and gas
What guiding principles can inform the strategic decisions facing the oil and gas
industry? To explore this question, we turned to the methodology described by Michael Raynor and Mumtaz Ahmed in their 2013 book, The Three Rules. (For details, see the sidebar “About The Three Rules.”) Using return on assets (ROA) as the performance metric,4 Raynor and Ahmed identified three classes of companies:
• Miracle Workers, the “gold medal win-ners”: Companies that delivered sustained top 10 percent ROA performance for long enough to all but rule out chance as the primary source of their advantage
• Long Runners, the “silver medal winners”: Companies that deliv-ered top 20–40 percent ROA performance for long enough to all but rule out chance as the
primary source of their advantage
• Average Joes: Companies with average performance track records in both level and variability
Using a slight modification to Raynor and Ahmed’s original approach (see the sidebar “Adjusting The Three Rules for the upstream sector” and appendix A), we identified 64
Analyzing the sector to identify historical patterns of exceptional performance may offer clues about future performance.
Understanding exceptional performance in upstream oil and gas
3

Miracle Workers and 26 Long Runners in the upstream sector that varied in their scale, scope, and duration of operations during the analysis period (figure 1).
The group of upstream oil and gas Miracle Workers accounted for less than 8 percent of the total upstream population of 888 compa-nies, denoting truly exceptional performance among this 8 percent.
ADJUSTING THE THREE RULES FOR THE UPSTREAM SECTOR The original analysis in The Three Rules generated only four Long Runners and two Miracle Workers in the upstream sector. One of the upstream Miracle Workers is an investment company that does not operate oil and gas assets, while the other was a successful operating company that was acquired a number of years ago. The percentage of Miracle Workers among upstream companies (0.2 percent) was significantly lower than the overall percentage of Miracle Workers among all companies (0.7 percent).
To create a sufficient pool of high-performing upstream companies for our analysis, we adjusted the approach by lowering the significance level from the original study’s 99.8 percent to 90 percent.
We then sought to identify a limited set of relevant pairs of Miracle Workers and Average Joes for further analysis. We eliminated very small Miracle Workers (with less than $100 million in assets), “investment” companies (that own interests in, but do not operate, upstream assets), and the small number of Miracle Workers that had a major reversal following their exceptional performance and ultimately went bankrupt. This rationaliza-tion resulted in a list of 28 “relevant Miracle Workers,” which were evenly split across three size categories (figure 2). Interestingly, 17 of these companies (60 percent) were acquired at some point after reaching Miracle Worker sta-tus, but none of the acquiring companies made the Miracle Worker list.
Similarly, we rationalized the list of Long Runners, reducing the number of “relevant Long Runners” to nine (figure 3). Compared to the relevant Miracle Workers, a higher percentage of the relevant Long Runners were large in size (55 percent) and were acquired (75 percent) at some point after reaching Long Runner status.
Drivers of exceptional performance
Initially, we looked for sources of advantage among the Miracle Workers compared with the Long Runners and Average Joes in the entire set of 888 upstream companies. We examined each of the three components of ROA:
• Gross margin, or revenue minus direct costs
• Other costs, such as depreciation, depletion, and amortization (DD&A), exploration expenses, research and development, sell-ing, general and administrative expenses, and income taxes
• Asset turnover, or the amount of sales gen-erated for every dollar’s worth of assets
Figure 1. Number of upstream exceptional companies
64No. of miracle workers
No. of long runners
2
4 26
Graphic: Deloitte University Press | DUPress.com
Original approach
Modified approach
ROA = { Gross marginSales
–Other cost
Sales
{
XSalesAssets
The Three Rules
4

Asset size
Small ($100–$250 M) Medium ($250–$1,000 M) Large (>$1,000 M)
Stat
us
Active• Berry Petroleum
• Penn Virginia Corporation
Acquired
• Eason Oil Company • Arena Resources Inc.
• Candel Oil Ltd.
• Supron Energy Corporation
• Houston Oil & Minerals Corporation
• Pogo Producing Company
• CNX Gas Borporation
Asset size
Small ($100–$250 M) Medium ($250–$1,000 M) Large (>$1,000 M)
Stat
us
Active
• Gulfport Energy Corporation
• New Source Energy Corporation
• Mid-Con Energy Partners
• Callon Petroleum Company
• Contango Oil & Gas Company
• Harvest Natural Resources
• Miller Energy Resources Inc.
• Vaalco Energy Inc.
• Cimarex Energy Company
• EOG Resources Inc.
• Ultra Petroleum Corporation
Acquired
• Energy Minerals Corporation
• Castle Energy Corporation
• Matador Petroleum Corporation
• Southern Mineral Corporation
• Plains Petroleum Company
• Flying Diamond Oil Corporation
• UTE Energy Corporation
• Felmont Oil
• Prima Energy Corporation
• KCS Energy Inc.
• Remington Oil & Gas
• Venoco Acquisition Company
• Wiser Oil Company
• Newhall Resources
• Unocal Exploration Corporation
• Louisiana Land & Exploration
• Sabine Corporation
Figure 2. Size distribution of relevant upstream Miracle Workers
Figure 3. Size distribution of relevant upstream Long Runners
Understanding exceptional performance in upstream oil and gas
5

Miracle Worker Average Joe 1 Average Joe 2
EOG Resources Anadarko Petroleum Corporation Apache
Ultra Petroleum EXCO Resources Forest Oil Corporation
Contango Oil & Gas Carrizo Oil & Gas Goodrich Petroleum
Vaalco Energy Warren Resources Abraxes Petroleum
Gross margin Other costs Asset turnover
Average Joes 0.109 -0.090 0.014
Long Runners 0.094 -0.072 0.030
Miracle Workers 0.188 -0.130 0.039
To study how the changes in these three drivers translated into ROA advantage, we calculated the difference in each between the company and the industry median. We then regressed each of these differences against each company’s ROA difference from the industry median in that year.
Across the entire upstream sector database, we found that increasing gross margin gener-ated a greater ROA advantage than reducing other costs or increasing asset turnover (figure 4). For all three classes of companies—Miracle Workers, Long Runners, and Average Joes— gross margin had the highest influence on ROA. The implications of this analysis are that, first, oil and gas companies tend to have a profitability formula that is more efficient at
translating a relative gross margin improve-ment into ROA advantage than the other components of ROA, and, second, that Miracle Workers are more efficient at leveraging that formula.
We then conducted pair analyses to further decipher the elements of the Miracle Workers’ exceptional performance. We focused our analysis on the comparison of Miracle Workers to Average Joes. From the 11 Miracle Workers still active in 2011, we selected 4 across a range of sizes and conducted case studies of each to compare them to 2 randomly selected, simi-larly sized Average Joes (figure 5).
In the pair analyses, gross margin was the largest driver of ROA differential in seven of the eight pairs of Miracle Workers and
Figure 4. Incremental increase in ROA from unit increase in drivers
Figure 5. Miracle Workers and Average Joe pairings
The Three Rules
6

Average Joes (appendix B), confirming the regression analysis’s findings for the entire upstream population.
This primacy of gross margin advantage in our analysis is consistent with the first of the three rules, “better before cheaper.”
To investigate the gross margin advantage, we compiled year-by-year financial and operat-ing details of each of the companies in the pair analysis set. Upstream oil and gas industry products—oil, natural gas, and natural gas liq-uids—can be measured as barrels of oil equiva-lent (BOE), allowing for the comparison of unit prices and costs. Gross margin is defined as revenue minus cost of goods sold (COGS) divided by revenue, which can be translated into per-BOE values. Hence, gross margin can be expressed by the following equations:
We removed production taxes from COGS because they correlate directly with revenue and are beyond management’s direct con-trol. The remaining costs were deemed “unit production costs,” and include lease operating, gathering, processing, and transportation costs per barrel.
We analyzed gross margin using two methods:
1. Regression analysis. We conducted a regression analysis of the annual unit rev-enue and cost data for the 12 companies in the eight pairs above. Our analysis found that the correlation of unit cost with gross margin was higher than the unit revenue (price) correlation with gross margin, and that the relationship of unit cost with gross margin was statistically significant.
2. Pair revenue and cost comparison. In all eight pairs, the Miracle Workers had lower unit production costs than the Average Joes on average over the comparison period.
These analyses suggest that for Miracle Workers, gross margin had a stronger correla-tion with unit production cost than with price realized. This result seems reasonable, con-sidering the elements of gross margin for an upstream company. Price advantage (beyond the mix of oil vs. gas) would not be expected to be a major factor, given the industry’s commodity nature and the fact that price, unlike unit production costs, is not impacted by volume.
A separate analysis revealed no correlation between oil and gas mix and gross margin advantage. In other words, while the oil and gas mix drives unit revenue and unit cost individually, the mix itself did not drive gross margin advantage in our pair analyses.
Distinguishing characteristics of Miracle Workers vs. Average Joes
For a commodity business with no ability to differentiate products, “better” translates into a higher gross margin or netback margin (as a percentage of sales). When making a trade-off, upstream Miracle Workers appear more likely to pursue gross margin advantage at the expense of other costs or asset turnover. The question is, how is this performance advantage accomplished? Our Miracle Workers used different operating models in different geogra-phies at varying scales and different portfolio balances of gas and oil. To explore the ques-tion of “how,” we looked more closely at the portfolios and operating models of several of our Miracle Workers vs. their comparative Average Joes for clues.5 Our analysis suggests that Miracle Workers may have a greater consis-tency of effort and a higher degree of focus than Average Joes of similar size.
Following the price collapse of the late 1980s, lower 48 onshore and shallow-water GOM oil plays began a steady decline that lasted until the advent of shale oil 20 years later. Domestic oil and gas companies reacted differently to the changing circumstances. Some stayed focused on the lower 48 (and
Gross margin = (Revenue/BOE)*volume – (Cost/BOE)*volume(Revenue/BOE)*volume
Gross margin = (Cost/BOE)
(Revenue/BOE)1 –
Understanding exceptional performance in upstream oil and gas
7

onshore Canada), retaining a predominantly gas focus, while others expanded internation-ally and into the deepwater Gulf of Mexico while becoming more oil-focused.
For example, during the comparison period, Miracle Worker Ultra Petroleum focused exclusively on developing dry tight gas properties in Wyoming’s Green River Basin. The company’s strategy was to use its extensive basin subsurface data and modelling capabili-ties to invest only in high-margin, lower-risk exploration prospects and development wells. Ultra also used highly standard and repeat-able drilling and completion approaches. This allowed for exceptional performance despite the relatively low gas prices in the Rocky Mountains.
Ultra’s focus contrasts with two similarly sized Average Joes, Forest Oil and EXCO Resources. Forest, for a company of its size, was highly diversified, with operations in the GOM, four provinces in Canada, the Cook Inlet of Alaska, the Gulf Coast onshore, and western United States. Over time, it exited the GOM, Canada, and Alaska, shrinking produc-tion by about 30 percent. EXCO started the comparison period as a small company and grew quickly, buying positions in Canada, the Rockies, Midcontinent, the Permian Basin, and East Texas. In the middle of the period, it sold its properties in Canada and the Rockies and made significant corporate and property acquisitions in Appalachia and the Haynesville Shale.
Contango, a smaller Miracle Worker, concentrated almost exclusively on drill-ing and producing high-quality exploration prospects in the shallow waters of the GOM. The company made huge investments in 3D seismic relative to its size, covering a substan-tial portion of the shallow-water GOM, and drilled a limited number of exploration wells each year. The company also had a unique
operating model that relied on exploration alliances with several partners and outsourc-ing most G&A services. In contrast, Carrizo, a similarly sized Average Joe, started the period focused on onshore shallow-depth plays along the Texas and Louisiana Gulf Coast but quickly diversified, first into the Barnett Shale and Rocky Mountain coal bed methane, and then to the Eagle Ford, Niobrara, and Marcellus shales as well as the United Kingdom’s North Sea. Goodrich, another similarly sized Average Joe, initially operated in southern Louisiana, and then shifted completely to the Cotton Valley trend in East Texas and northwest-ern Louisiana before diversifying into the Haynesville, Eagle Ford, and Tuscaloosa shales
EOG and Vaalco took similar approaches. This analysis suggests that Miracle Workers may have a greater consistency of effort and a higher degree of focus than Average Joes of similar size. This focus and consistency may have allowed for the creation of specialized knowledge, which enabled Miracle Workers to identify and acquire better subsurface assets and implement better reservoir management. This, in turn, would allow them to maximize recovery and accelerate oil and gas production volumes from each asset. The benefit of greater incremental recovery is likely to have been significantly greater than the associated advantages in oper-ating costs from geographic concentration of surface assets.
The focus on driving incremental revenue through maximizing volume is consistent with an outcome of lower unit costs. This volume-maximizing ability is aligned with the second of the three rules, “revenue before cost.” Our colleagues’ analysis of Miracle Workers in sev-eral other resource-oriented industries (min-ing, pulp, and paper) points to a similar focus on high-margin resources and maximizing vol-ume for Miracle Workers in those industries.
The Three Rules
8

Conclusion
THROUGH our analysis, we gained a deeper understanding of the drivers that enabled
a small group of upstream companies to achieve consistent, exceptional performance. The analysis suggests that Miracle Workers create ROA advantage by having assets with higher gross margins (better before cheaper) and drive profitability through maximizing incremental volume (revenue before cost). The Miracle Workers appear to accomplish this through a greater degree of focus in their asset portfolios.
Understanding exceptional performance in upstream oil and gas
99

Appendix A: Upstream sector analysis methodology
WE started by identifying the companies in the Three Rules’s database categorized
in the Standard Industrial Classification (SIC) code for upstream oil and gas (1311—Crude Petroleum and Natural Gas Extraction). This excluded integrated oil and gas companies, which fall into another SIC code (2911—Petroleum Refining), as well as non-US E&P companies. Within this scope, we identified 888 US upstream companies that had oper-ated at some point during the 1966–2011 study period.
Applying the Three Rules’s methodology to the upstream sector required addressing two challenges and one unique opportunity. The first challenge was that the original analysis in The Three Rules generated only four Long Runners and two Miracle Workers in the upstream sector. One of the upstream Miracle Workers is an investment company that does not operate oil and gas assets, while the other was a successful operating company that was acquired a number of years ago. The percent-age of Miracle Workers among upstream companies (0.2 percent) was significantly lower than the overall percentage of Miracle Workers
among all companies (0.7 percent). To create a sufficient pool of high-performing upstream companies for our analysis, we adjusted the approach by lowering the significance level from the original study’s 99.8 percent to 90 percent.
The second challenge was to arrive at a reasonable interpretation of “better before cheaper” and “revenue before cost” for upstream companies. For resource extraction businesses that produce commodity products, the interpretation of these rules is not as intui-tive as for other industries such as consumer products. Additionally, an upstream company’s revenue can change substantially with fluctua-tions in crude oil and natural gas prices, which have traditionally been cyclical and volatile.
However, the nature of the industry cre-ated a unique opportunity. The commodities produced by upstream oil and gas companies (crude oil, natural gas, and natural gas liquids) can be aggregated using a single sales unit, the barrel of oil equivalent (BOE). This allowed us to determine unit sales realizations and pro-duction costs more reliably than would have been possible in many other industries.
The Three Rules
10

Appendix B: Elements of ROA differential in pairs studied
Figure 6. Elements of ROA differential for EOG
Elements of ROA
Contribution to ROA differential in percentage points per year (1989–2011)
EOG vs. Anadarko EOG vs. Apache
Gross margin 4.76 3.76
Other costs (2.20) (2.07)
Return on sales 2.56 1.69
Total asset turnover 1.77 0.73
ROA 4.33 2.42
Figure 7. Elements of ROA differential for Ultra Petroleum
Elements of ROA
Contribution to ROA differential in percentage points per year (1998–2011)
Ultra vs. EXCO Ultra vs. Forest Oil
Gross margin 11.18 6.79
Other costs (4.17) (0.60)
Return on sales 7.01 6.19
Total asset turnover 2.39 2.32
ROA 9.40 8.51
Understanding exceptional performance in upstream oil and gas
11
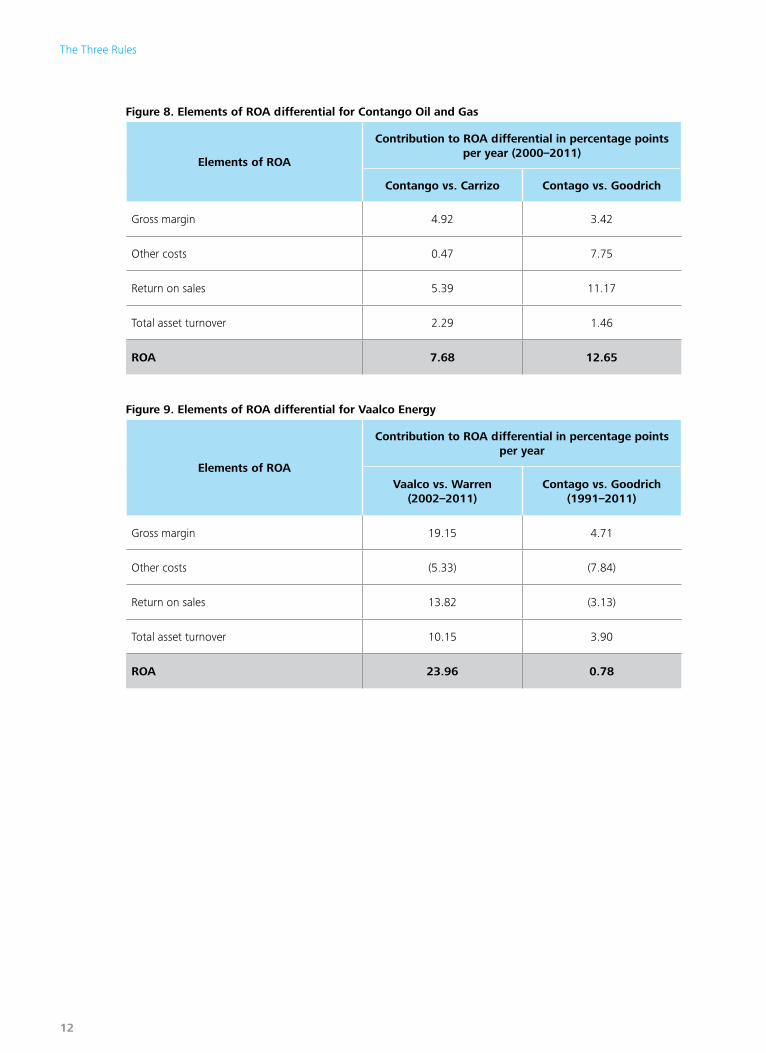
Figure 8. Elements of ROA differential for Contango Oil and Gas
Elements of ROA
Contribution to ROA differential in percentage points per year (2000–2011)
Contango vs. Carrizo Contago vs. Goodrich
Gross margin 4.92 3.42
Other costs 0.47 7.75
Return on sales 5.39 11.17
Total asset turnover 2.29 1.46
ROA 7.68 12.65
Figure 9. Elements of ROA differential for Vaalco Energy
Elements of ROA
Contribution to ROA differential in percentage points per year
Vaalco vs. Warren (2002–2011)
Contago vs. Goodrich (1991–2011)
Gross margin 19.15 4.71
Other costs (5.33) (7.84)
Return on sales 13.82 (3.13)
Total asset turnover 10.15 3.90
ROA 23.96 0.78
The Three Rules
12

Endnotes
1. As used in this document, “Deloitte” means Deloitte Consulting LLP, a subsidiary of Deloitte LLP. Please see www.deloitte.com/us/about for a detailed description of the legal structure of Deloitte LLP and its subsidiaries. Certain services may not be available to attest clients under the rules and regulations of public accounting.
2. See the Deloitte University Press collection, The Exceptional Company, http://dupress.com/collection/the-exceptional-company/ for more.
3. Michael E. Raynor and Mumtaz Ahmed, The Three Rules: How Exceptional Companies Think (New York: Penguin Books, 2013).
4. Total shareholder return (TSR) is a popular measure of performance in success studies. However, shareholder returns are more a function of changes in investor expectations than of consistently superior management. We wanted to understand what makes for a great company, not what makes a great investment. As a result, we focused on ROA as the best measure of performance.
5. Data from company 10-K submis-sions over the period.
6. Data from US Department of Energy/Energy Information Agency.
Understanding exceptional performance in upstream oil and gas
13

About Deloitte University Press Deloitte University Press publishes original articles, reports and periodicals that provide insights for businesses, the public sector and NGOs. Our goal is to draw upon research and experience from throughout our professional services organization, and that of coauthors in academia and business, to advance the conversation on a broad spectrum of topics of interest to executives and government leaders.
Deloitte University Press is an imprint of Deloitte Development LLC.
About this publication This publication contains general information only, and none of Deloitte Touche Tohmatsu Limited, its member firms, or their related entities (collectively the “Deloitte Network”) is, by means of this publication, rendering professional advice or services. Before making any decision or taking any action that may affect your finances or your business, you should consult a qualified professional adviser. No entity in the Deloitte Network shall be responsible for any loss whatsoever sustained by any person who relies on this publication.
About Deloitte Deloitte refers to one or more of Deloitte Touche Tohmatsu Limited, a UK private company limited by guarantee (“DTTL”), its network of member firms, and their related entities. DTTL and each of its member firms are legally separate and independent entities. DTTL (also referred to as “Deloitte Global”) does not provide services to clients. Please see www.deloitte.com/about for a more detailed description of DTTL and its member firms.
Deloitte provides audit, tax, consulting, and financial advisory services to public and private clients spanning multiple industries. With a globally connected network of member firms in more than 150 countries and territories, Deloitte brings world-class capabilities and high-quality service to clients, delivering the insights they need to address their most complex business challenges. Deloitte’s more than 200,000 professionals are committed to becoming the standard of excellence.
© 2014. For information, contact Deloitte Touche Tohmatsu Limited.
Follow @DU_Press
Sign up for Deloitte University Press updates at DUPress.com.