Embed Size (px)
Citation preview

© Keysight Technologies 2015
Understanding Available Measurement Techniques for Spurious or Unknown Signals
Richard Overdorf
Keysight Technologies

Page Agenda
– A quick look at the spectrum analyzer timeline
– Overview of spur and “unknown” signal requirements
– The block diagram and what’s changed?
– Understanding the available analysis tools and trade-offs
• Important architectures in an analyzers?
• How can we manipulate the test equipment for our measurement
– Types of signals and measurement concerns
– Mapping the tool to the application
© Keysight
Technologies 2015 2

Page
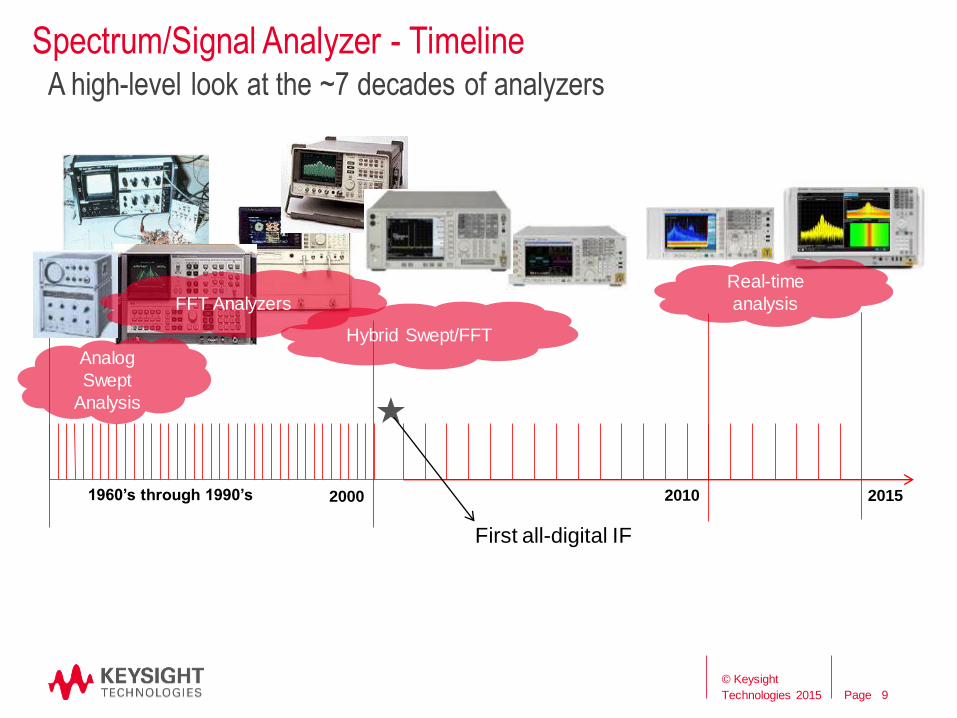
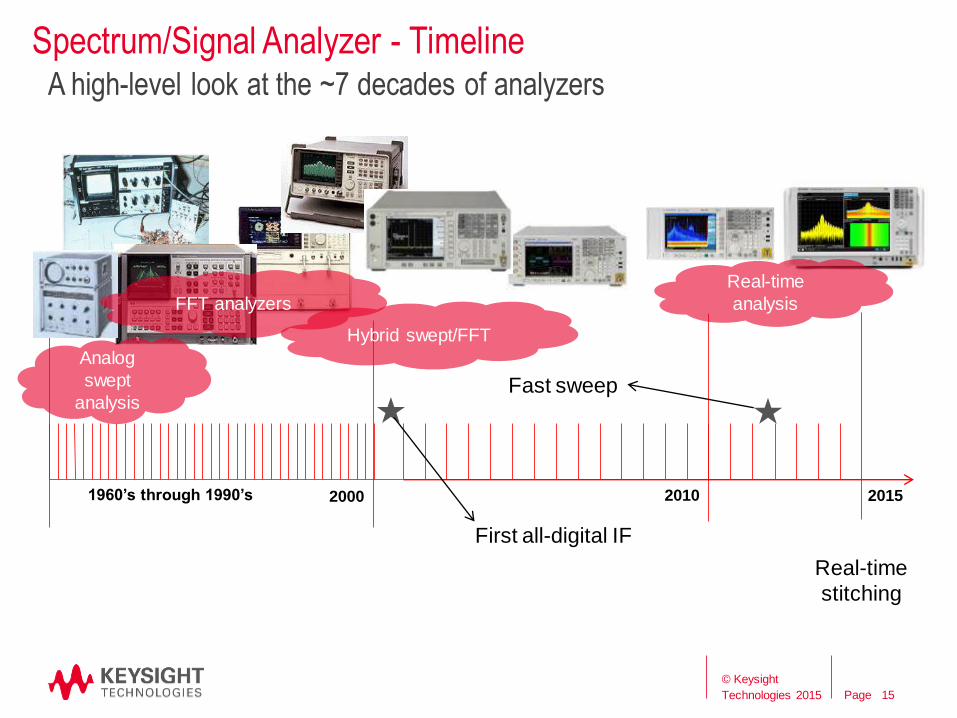
Spectrum/Signal Analyzer - Timeline A high-level look at the ~7 decades of analyzers
1960’s through 1990’s 2000 2015 2010
Analog
swept
analysis
FFT analyzers
Hybrid swept/FFT
Real-time
analysis
First all-digital IF
Fast sweep
Real-time in a
commercial
swept analyzer
Real-time
stitching
Time domain scan
© Keysight
Technologies 2015 3
Page
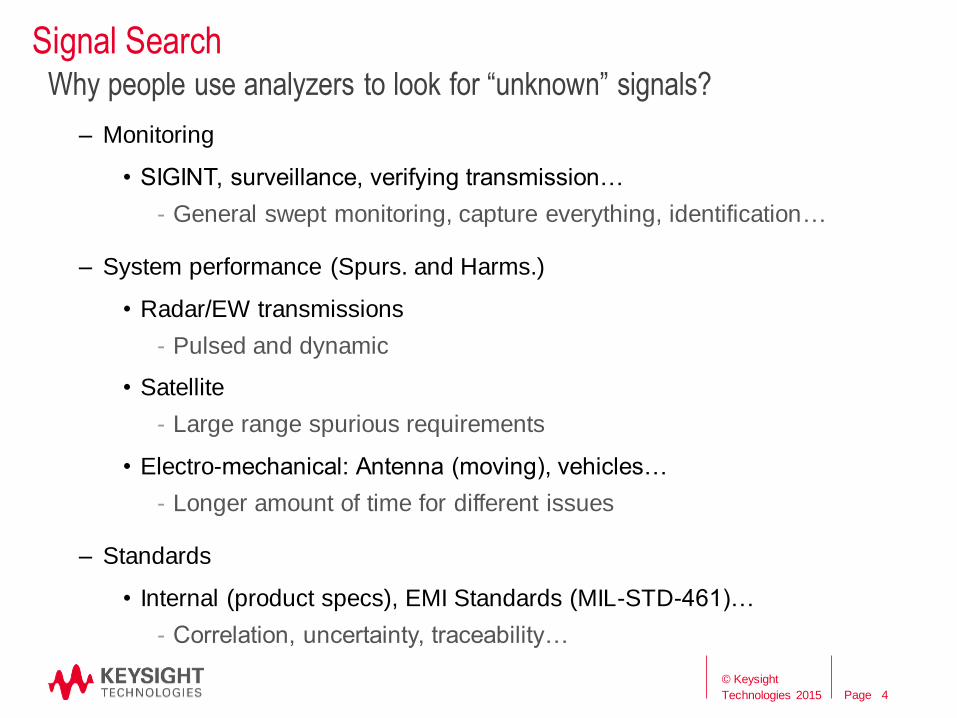
Signal Search
– Monitoring
• SIGINT, surveillance, verifying transmission…
- General swept monitoring, capture everything, identification…
– System performance (Spurs. and Harms.)
• Radar/EW transmissions
- Pulsed and dynamic
• Satellite
- Large range spurious requirements
• Electro-mechanical: Antenna (moving), vehicles…
- Longer amount of time for different issues
– Standards
• Internal (product specs), EMI Standards (MIL-STD-461)…
- Correlation, uncertainty, traceability…
Why people use analyzers to look for “unknown” signals?
© Keysight
Technologies 2015 4
Page
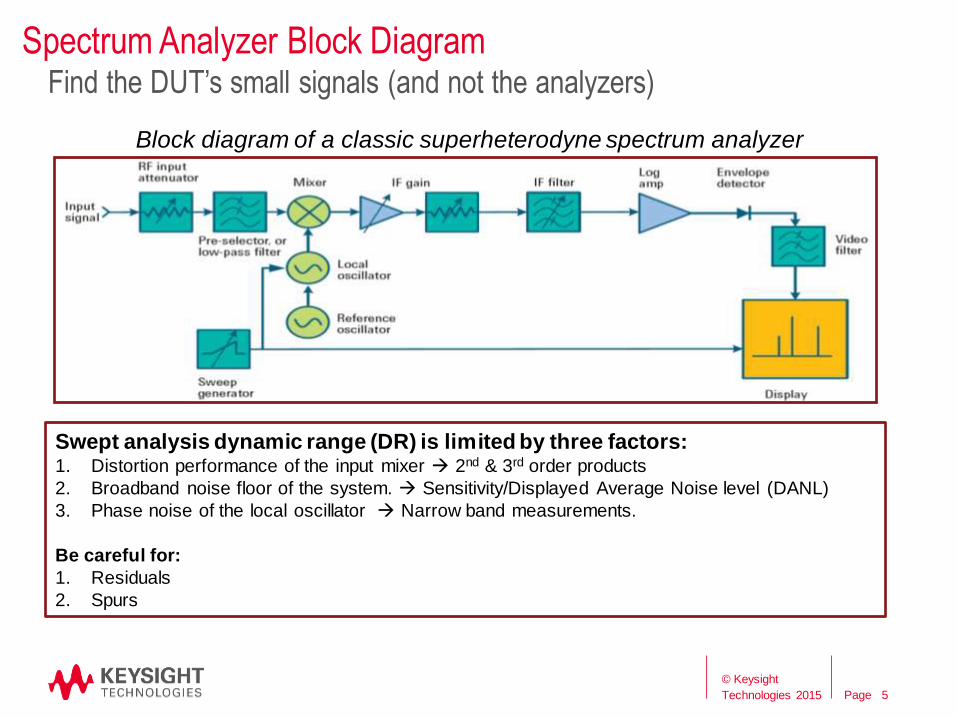
Spectrum Analyzer Block Diagram Find the DUT’s small signals (and not the analyzers)
Swept analysis dynamic range (DR) is limited by three factors: 1. Distortion performance of the input mixer 2nd & 3rd order products
2. Broadband noise floor of the system. Sensitivity/Displayed Average Noise level (DANL)
3. Phase noise of the local oscillator Narrow band measurements.
Be careful for:
1. Residuals
2. Spurs
5
Block diagram of a classic superheterodyne spectrum analyzer
© Keysight
Technologies 2015

Page
Spectrum Analyzer Dynamic Range Distortion and noise
• Increasing input attenuation reduces harmonic
distortion from spectrum analyzer. However this
also adds more IF gain which degrades noise
floor.
• To compensate for this you can reduce the RBW
and reduce the noise floor.
6
For more information on the Keysight Web site see:
App Note 150: Spectrum Analyzer Basics (pub no. 5952-0292.pdf) © Keysight
Technologies 2015

Page
The “Front-End” (Part 1) At the input
Level Control – attenuators
• Help maximize dynamic range at any
frequency
• Can help match (VSWR)
Low Noise Path (LNP)
• Not a default state but can be very
helpful at improving sensitivity
• Can improve dynamic range (2nd order)
Preamplifier
• Helps with sensitivity but not dynamic
range
7
0-3.6 GHz low band
3 Hz-26.5 GHz
Input
Cal input
2 dB-step mech atten
μW converters
RF converter
2nd converter
3.5-26.5 GHz high band
2 2 6 10 20 30
RF preamp
Linearity
Corrections
μW preamp
YIG filter
with bypass
relay
1 dB-step electronic atten
Low Noise Path
© Keysight
Technologies 2015

Page
The “Front-End” (Part 2) The Preselector, Friend or Foe?!?
• At low frequencies preselection is
done with a low pass filter
• At higher frequencies it is typically a
YIG tuned filter
The preselector is a FOE because:
1. Limits bandwidth (predominately for
WB FFTs)
2. Degrades amplitude accuracy
3. “Sweeps” slow
The preselector is a FRIEND because:
1. Image free spectrum
2. Helps block out of band power
8
0-3.6 GHz low band
3 Hz-26.5 GHz
Input
Cal input
2 dB-step mech atten
μW converters
RF converter
2nd converter
3.5-26.5 GHz high band
2 2 6 10 20 30
RF preamp
Linearity
Corrections
μW preamp
YIG filter
with bypass
relay
1 dB-step electronic atten
© Keysight
Technologies 2015
Page
Spectrum/Signal Analyzer - Timeline A high-level look at the ~7 decades of analyzers
1960’s through 1990’s 2000 2015 2010
Analog
Swept
Analysis
FFT Analyzers
Hybrid Swept/FFT
Real-time
analysis
First all-digital IF
9
© Keysight
Technologies 2015

Page
The IF (Analog and Digital) What to be concerned about
Pre-filters 1. Great at making sure there is minimal
impact when multiple signals are in the IF
2. Has to be bypassed in wideband cases
The ADC
1. Resolution counts
2. Determines FFT limits
The “all-digital” IF
1. The log amplifier
2. Selectivity of the RBW
3. Frequency counter
4. Allows for a very wide range of RBW’s
5. Data manipulation without resampling
6. FFT processing (we will cover later)
7. Detectors (and multiple detectors)
Step
Gain
ADC
ASIC &
FPGAs CPU
Anti-Alias
Filter
Selectable
Pre-Filters
10
© Keysight
Technologies 2015

Page
Display Detectors
– Input is the IF envelope detector output (log or linear scaled)
– Each output represents only one IF envelope value
– Peak and neg peak detectors bias the output value, perform
some data reduction
– Depending on choice the value can change >3 dB
Example: Peak, Negative Peak, and Sample
Time
Volts
Peak
Neg Peak
Sample
Display points or buckets
Peak, Avg,
Sample…
ASIC &
FPGAs
11
© Keysight
Technologies 2015
Page
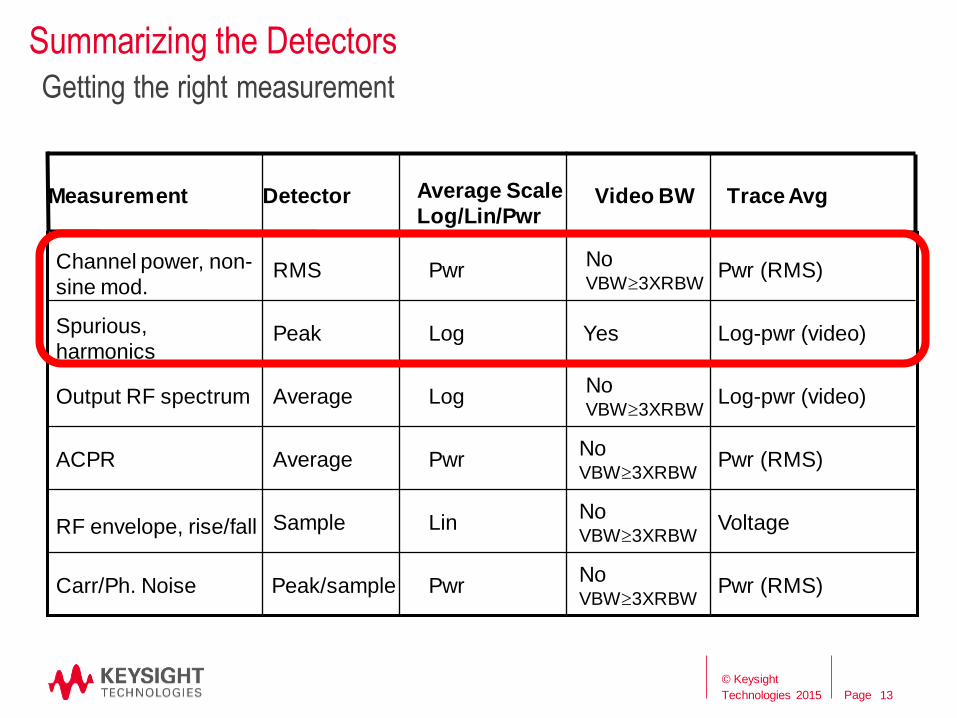
Log-pwr (video) No VBW3XRBW
Log Average Output RF spectrum
Log-pwr (video) Yes Log Peak Spurious,
harmonics
Pwr (RMS)
Voltage
Pwr (RMS)
Pwr (RMS)
Trace Avg
No VBW3XRBW
Pwr Peak/sample Carr/Ph. Noise
No VBW3XRBW
Lin Sample RF envelope, rise/fall
No VBW3XRBW
Pwr Average ACPR
No VBW3XRBW
Pwr RMS Channel power, non-
sine mod.
Video BW Average Scale
Log/Lin/Pwr Detector Measurement
Summarizing the Detectors
Getting the right measurement
13
© Keysight
Technologies 2015

Page
Understanding Uncertainty Uncertainties Budget for Noise + Distortion
Spectrum Analyzer Dynamic range must be optimized in combination with
your DUT requirements and measurement uncertainties you can tolerate.
Uncertainty versus difference in
amplitude between two sinusoids
at the same frequency Error in displayed signal
amplitude due to noise
Example of uncertainty budget: Distortion Error budget: +/- 1 dB error = -18 dBc margin relative to DUT input
Noise Error budget: +/- 0.3 dB error = 5 dB margin relative to noise floor
Maximum total error: (+/- 1 dB) + (+/- 0.3 dB) = +/- 1.3 dB (excludes instrument)
Distortion Error Noise Error
For more information on Keysight.com see: App Note 150: Spectrum
analyzer basics and http://mwrf.com/author/bob-nelson 14
© Keysight
Technologies 2015
Page
Spectrum/Signal Analyzer - Timeline A high-level look at the ~7 decades of analyzers
1960’s through 1990’s 2000 2015 2010
Analog
swept
analysis
FFT analyzers
Hybrid swept/FFT
Real-time
analysis
Fast sweep
Real-time
stitching
First all-digital IF
15
© Keysight
Technologies 2015

Page 16
Up to 50x Faster vs. Traditional Sweep
Fast Sweep Traditional Sweep
For more information on the Keysight .com see:
Using Fast-Sweep Techniques to Accelerate Spur Searches (pub no. 5991-3739EN)
Full 26.5 GHz span Full 26.5 GHz span
© Keysight
Technologies 2015 16
Page
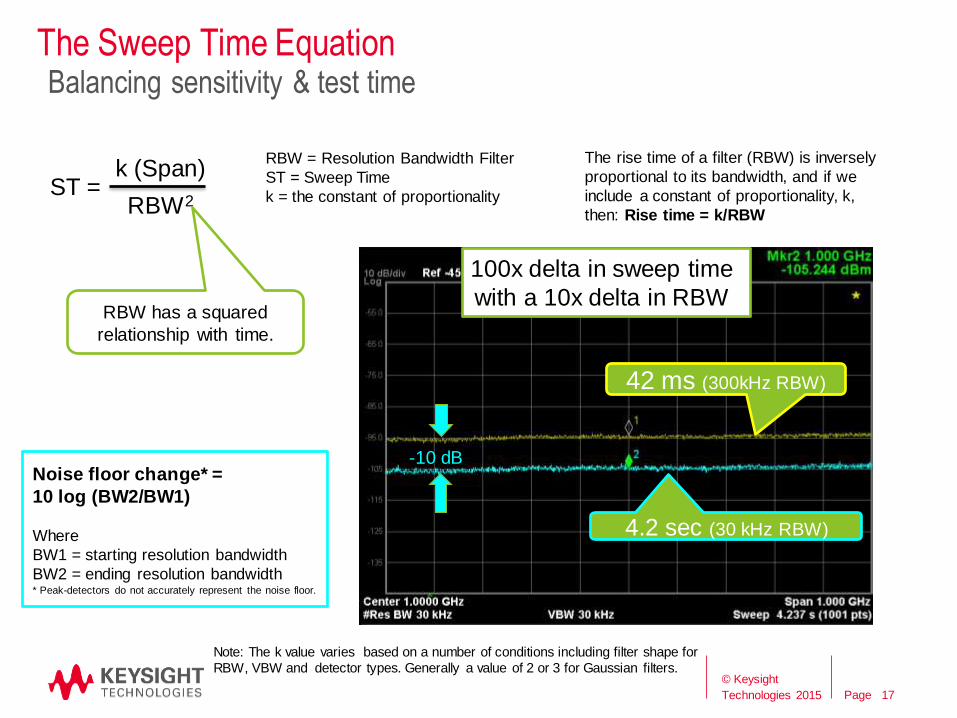
The Sweep Time Equation Balancing sensitivity & test time
RBW = Resolution Bandwidth Filter
ST = Sweep Time
k = the constant of proportionality ST = k (Span)
RBW2
The rise time of a filter (RBW) is inversely
proportional to its bandwidth, and if we
include a constant of proportionality, k,
then: Rise time = k/RBW
RBW has a squared
relationship with time.
Noise floor change* =
10 log (BW2/BW1)
Where
BW1 = starting resolution bandwidth
BW2 = ending resolution bandwidth * Peak-detectors do not accurately represent the noise floor.
17
42 ms (300kHz RBW)
4.2 sec (30 kHz RBW)
100x delta in sweep time
with a 10x delta in RBW
-10 dB
Note: The k value varies based on a number of conditions including filter shape for
RBW, VBW and detector types. Generally a value of 2 or 3 for Gaussian filters. © Keysight
Technologies 2015
Page
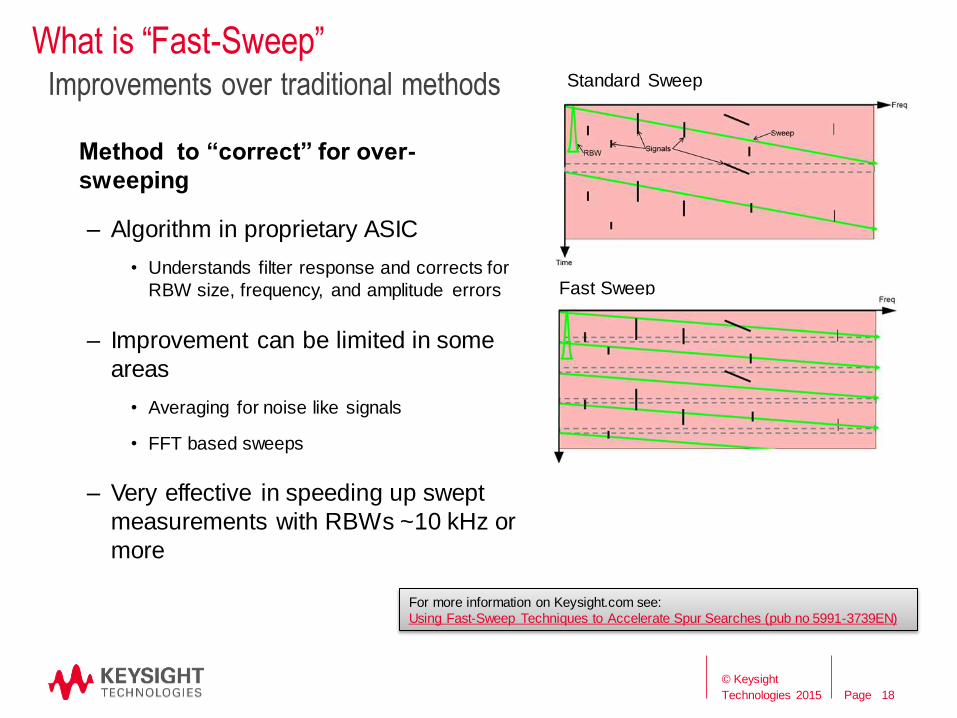
What is “Fast-Sweep”
Method to “correct” for over-
sweeping
– Algorithm in proprietary ASIC
• Understands filter response and corrects for
RBW size, frequency, and amplitude errors
– Improvement can be limited in some
areas
• Averaging for noise like signals
• FFT based sweeps
– Very effective in speeding up swept
measurements with RBWs ~10 kHz or
more
© Keysight
Technologies 2015 18
Improvements over traditional methods Standard Sweep
Fast Sweep
For more information on Keysight.com see:
Using Fast-Sweep Techniques to Accelerate Spur Searches (pub no 5991-3739EN)

Page 19
Compensated RBW rise time with improved accuracy
ST = k (Span)
RBW2
Modified
k value
The Sweep Time Equation - Fast Sweep
Resolution Bandwidth Accuracy
Red: FS1
Green: Accuracy (no FS1)
RBW size
RB
W r
atio
Time
© Keysight
Technologies 2015
Page
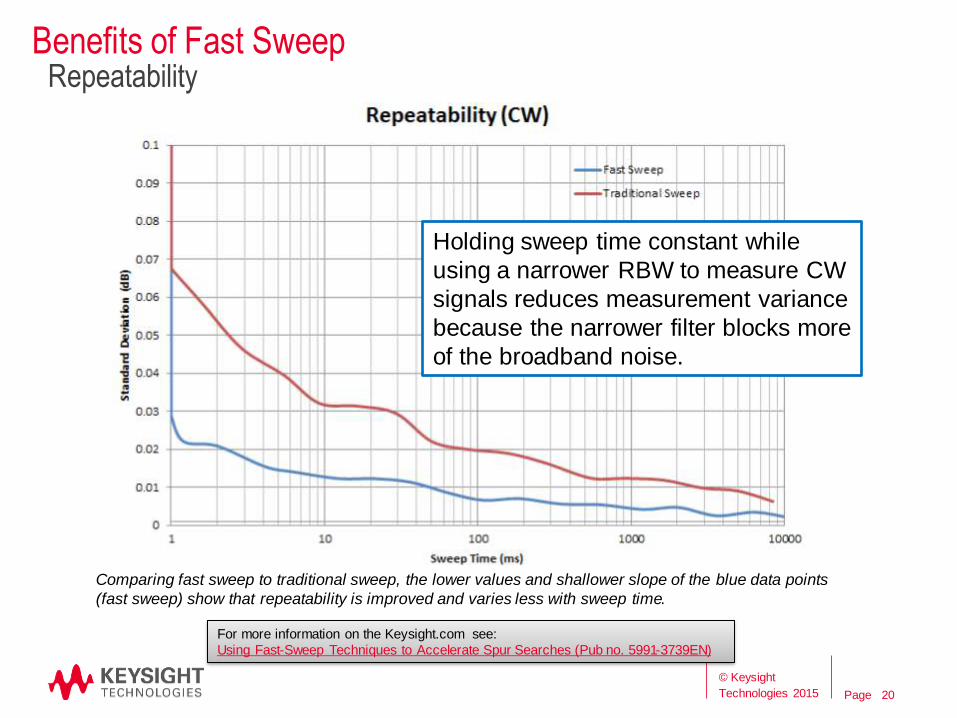
Benefits of Fast Sweep Repeatability
© Keysight
Technologies 2015 20
Comparing fast sweep to traditional sweep, the lower values and shallower slope of the blue data points
(fast sweep) show that repeatability is improved and varies less with sweep time.
Holding sweep time constant while
using a narrower RBW to measure CW
signals reduces measurement variance
because the narrower filter blocks more
of the broadband noise.
For more information on the Keysight.com see:
Using Fast-Sweep Techniques to Accelerate Spur Searches (Pub no. 5991-3739EN)

Page
Sweeping with FFTs
– FFT stitching is not new to signal
analyzers
• Analyzer swaps modes
automatically
• Dynamic range and speed choices
• Some analyzers give control of FFT
size
– What’s changing?
• FFT algorithms continue to improve
• Larger more capable ADCs
• Moore’s law presents opportunity for
speed upgrades
For smaller RBWs in wider spans
© Keysight
Technologies 2015 21

Page
“Sweeping” with FFTs For smaller RBWs in wider spans
© Keysight
Technologies 2015 22

Page
“Sweeping” with FFTs For smaller RBWs in wider spans
© Keysight
Technologies 2015 23

Page
Stepped Spectrum Analysis
– Modern signal analyzers
• Wide FFTs in excess of 200 MHz
with similar dynamic range
• Faster processors
• Better analog approaches
– Modular instruments
• Wide FFTs in excess of 100 MHz
• Improved digital rejection
algorithms
• Processing power improvements
• High speed LOs
• More analysis in similar footprint
Some new technologies and approaches
© Keysight
Technologies 2015 24
Single FFT up to max
analysis BW (160 MHz)
Span up to frequency range of analyzer (27 GHz)

Page
Real-time Analysis
– LO is stationary and the
instrument’s ASIC and
FPGAs are processing data
at a very rapid speed
– Some differences from
swept
• Banded, not analyzing
full frequency range
• Dynamic range
- Narrow-band filtering
- Preselection
• No time gaps in band
Significant digital signal processing
Freq
Time
© Keysight
Technologies 2015 25
Page 27
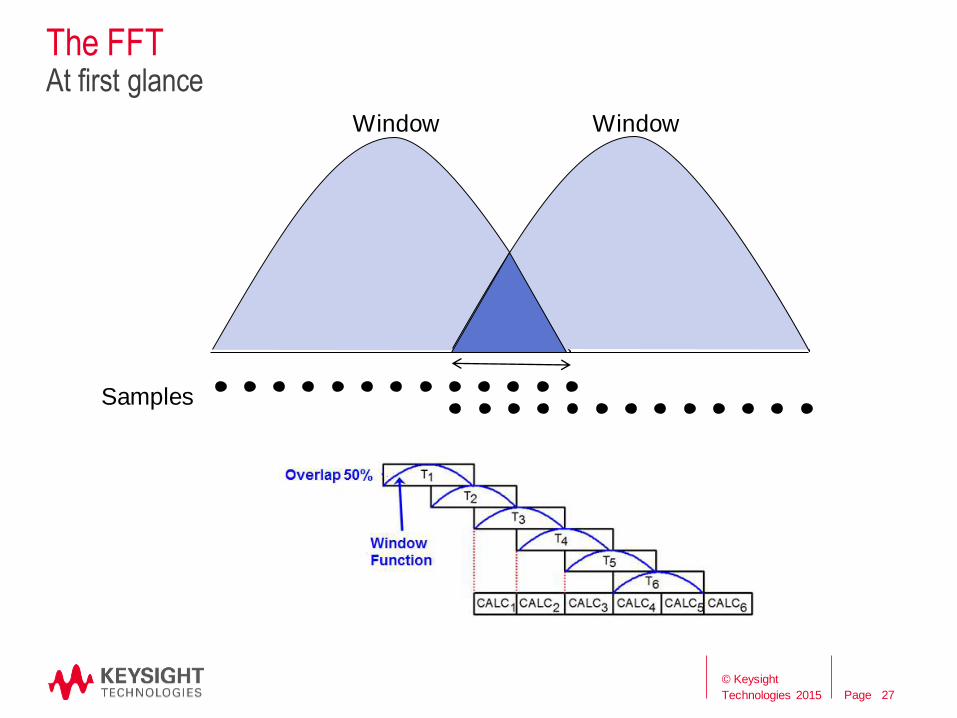
The FFT At first glance
Samples
Window Window
27
© Keysight
Technologies 2015
Page
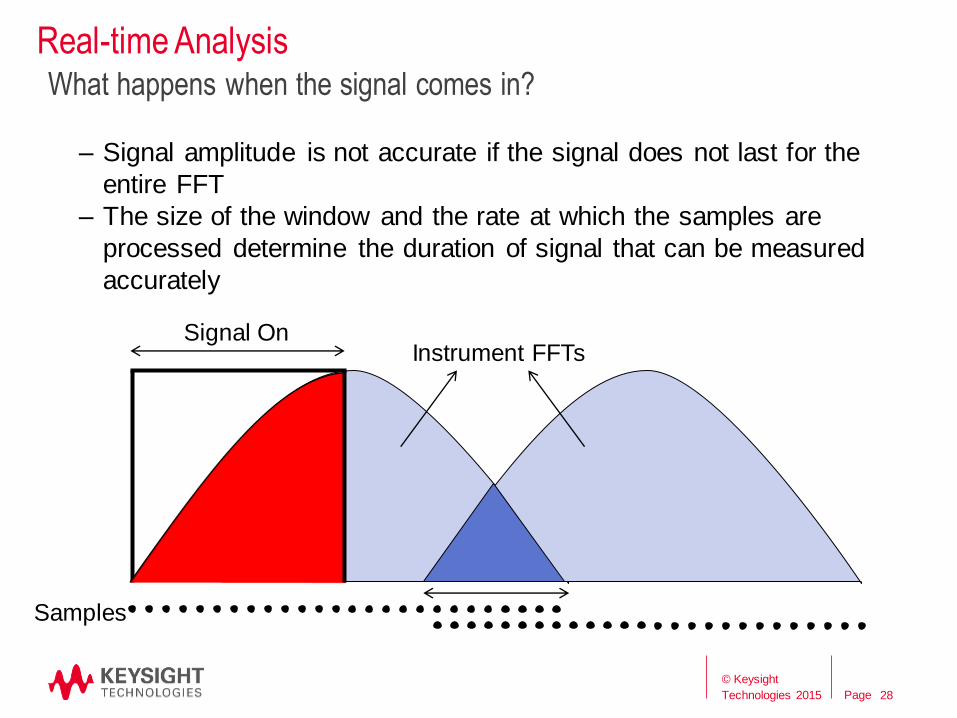
Real-time Analysis
– Signal amplitude is not accurate if the signal does not last for the
entire FFT
– The size of the window and the rate at which the samples are
processed determine the duration of signal that can be measured
accurately
What happens when the signal comes in?
Signal On Instrument FFTs
Samples
28
© Keysight
Technologies 2015

Page 29
The Probability of Intercept Specification • FFT clock running faster than the sample rate
• The larger the difference the more the overlap
• Overlap points; P = (1024*(Fclk – Fs)/Fclk)
• POI specification: Tmin = (Window + 1024 – P – 1)/Fs
Samp
Rate
(MHz)
Span
(MHz)
Overlap
(points)
Duration
for 1024
Window
(usec)
Duration
for 512
Window
(usec)
Duration
for 256
Window
(usec)
Duration
for 128
Window
(usec)
Duration
for 64
Window
(usec)
Duration
for 32
Window
(usec)
200 160 341 8.53 * 5.97 4.69 4.05 3.73 3.57
150 120 512 10.23 * 6.82 * 5.11 4.26 3.83 3.62
100 80 682 13.65 * 8.53 * 5.97 4.69 4.05 3.73
50 40 853 23.88 * 13.6 * 8.52 * 5.96 4.68 4.04
25 20 938 44.40 * 23.9 * 13.6 * 8.52 * 5.96 4.68
29
© Keysight
Technologies 2015

Page
Real-time Spectrum Analysis – POI Duration
30
© Keysight
Technologies 2015
Page
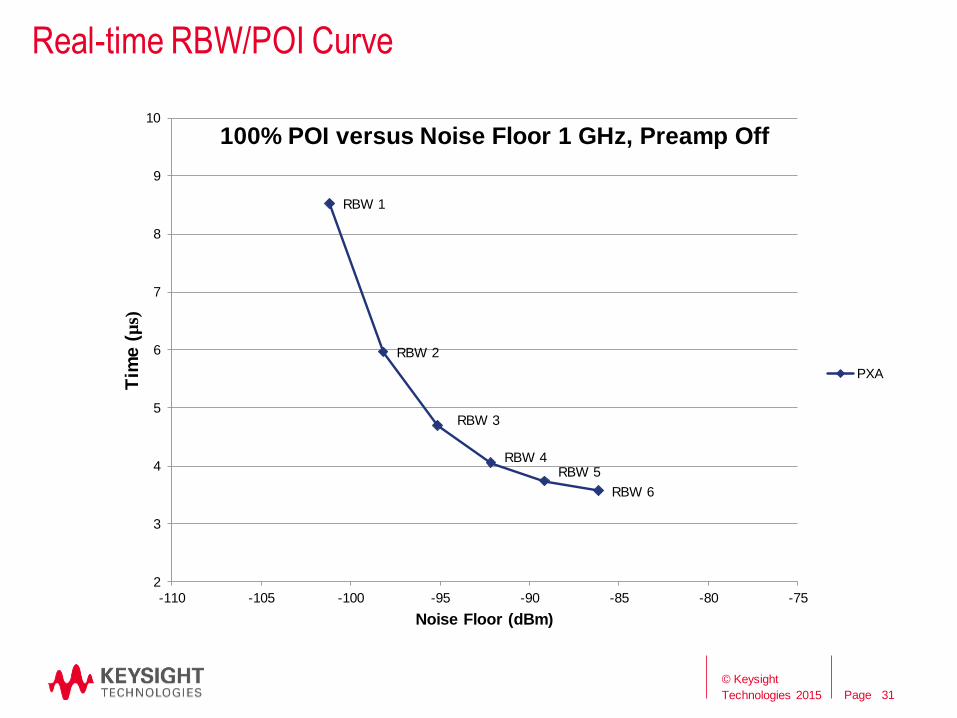
Real-time RBW/POI Curve
31
RBW 6
RBW 5 RBW 4
RBW 3
RBW 2
RBW 1
2
3
4
5
6
7
8
9
10
-110 -105 -100 -95 -90 -85 -80 -75
Tim
e (
µs)
Noise Floor (dBm)
100% POI versus Noise Floor 1 GHz, Preamp Off
PXA
© Keysight
Technologies 2015

Page
Spectrum/Signal Analyzer - Timeline A high-level look at the ~7 decades of analyzers
1960’s through 1990’s 2000 2015 2010
Analog
swept
analysis
FFT analyzers
Hybrid swept/FFT
Real-time
analysis
First all-digital IF
Fast sweep
Real-time in a
commercial
swept analyzer
Real-time
stitching
32
© Keysight
Technologies 2015

Page
Real-time Stitching
– Uses a combination of the
real-time engine and the
stepped FFT
– Not real-time across the
full frequency range of the
instrument
– Enables the full frequency
range of the instrument
– Helpful with low duty cycle
repetitive signals
What’s the difference?
Freq
Time
Period of interest
33
© Keysight
Technologies 2015

Page
Stitched Density
34
© Keysight
Technologies 2015

Page
Summarizing the Techniques We’ve Covered
Analog sweep
– Improved sweep speeds ideal for
measurements with wider RBWs
and large spans
– Great dynamic range
– Not so good at finding intermittent
signals
© Keysight
Technologies 2015 35
Analog Sweep, FFT Sweep, Real-time, Real-time Stitching
FFT “sweep”
– Significant improvements in DSP
have helped decrease sweep times
while holding dynamic range
– Very large FFTs have trade-offs
(preselection and spurs)
Real-time
– Unparalled capability at finding
small duration signals
– Trade-off of finding low level
signals is the signals have to last
longer
– Limited in DR, BW, flexibility
Real-time stitching
– Very useful in finding short duration
signals in a given period of time
– Limited in dynamic and
measurement range
– Sweep time

Page
Spectrum/Signal Analyzer - Timeline A high-level look at the ~7 decades of analyzers
1960’s through 1990’s 2000 2015 2010
Analog
swept
analysis
FFT analyzers
Hybrid swept/FFT
Real-time
analysis
First all-digital IF
Fast sweep
Real-time in a
commercial
swept analyzer
Real-time
stitching
Time domain scan
36
© Keysight
Technologies 2015
Page
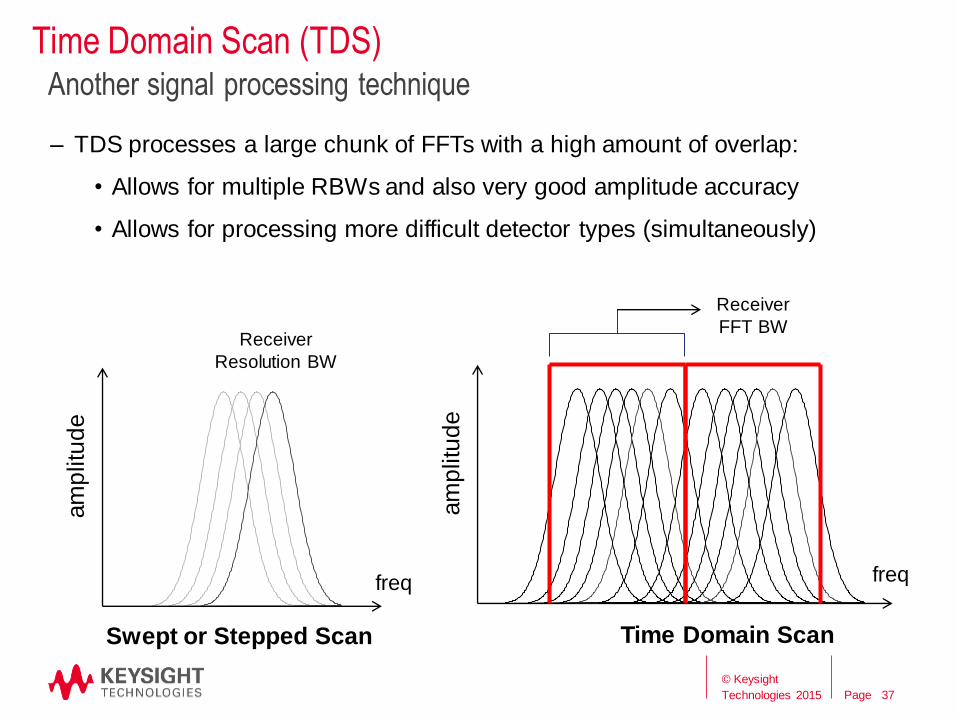
Time Domain Scan (TDS)
– TDS processes a large chunk of FFTs with a high amount of overlap:
• Allows for multiple RBWs and also very good amplitude accuracy
• Allows for processing more difficult detector types (simultaneously)
Another signal processing technique
freq
am
plit
ud
e
freq
am
plit
ud
e
Receiver
FFT BW Receiver
Resolution BW
Swept or Stepped Scan Time Domain Scan
37
© Keysight
Technologies 2015

Page
Understanding the End Requirements
– Monitoring
• Heavily concerned with catching everything and less concerned
with accuracy
– System performance (Spurs. and Harms.)
• Early stages: design and design integration
- Wants to know where the problem(s) are coming from
• Middle stages: design verification and pre-production
- Broad and “deep” characterization, wants to decrease test
times
- Measurement accuracy
• Final stages: production
- Traceability, repeatability, uncertainty and test time
– Standards testing
• Heavily concerned with traceability, accuracy, repeatability
Mapping a test goal to the instrument capabilities
© Keysight
Technologies 2015 38

Page
Where the Capabilities Match
– Monitoring
• Best: Streaming; Good: RTSA; OK: Swept (WB FFT, Fast)
– System performance (Spurs. and Harms.)
• Early stages - Best: RTSA, Swept (WB FFT, Fast); Good: RTSA
Stitching
• Middle stages - Best: Swept (Narrow FFT, Fast); Good: Swept
(WB FFT)
• Final stages - Best: Swept (Narrow, Fast); Good: TDS (EMI)
– Standards testing
• Pre-scan - Best: TDS, Swept (All); Good: RTSA Stitching
• Compliance - Best: Dictated; Good: Swept (Narrow),
My suggestions but certainly not the law…
© Keysight
Technologies 2015 39

Page
Summary
– Understanding the test goals can allow you to take advantage of “non-
standard” equipment settings which can be apart of your current test
equipment
– A general knowledge of the test equipment will help you map the trade-offs
and select the right method for the test goal
– Depending on the analyzer, there are multiple advancements that can be
valuable for significantly reducing test times, improve repeatability and make
a more efficient measurement
• Digital IF
• Fast Sweep
• FFT Sweep
• RTSA
• Stitched RTSA
• TDS
What have we learned?
© Keysight
Technologies 2015 40

Page
Spectrum/Signal Analyzer - Timeline A high-level look at the ~7 decades of analyzers
1960’s through 1990’s 2000 2015 2010
Analog
swept
analysis
FFT analyzers
Hybrid swept/FFT
Real-time
analysis
First all-digital IF
Fast sweep
Real-time in a
commercial
swept analyzer
Real-time
stitching
Time domain scan
© Keysight
Technologies 2015 41

Page
Questions?
© Keysight
Technologies 2015 42