Embed Size (px)
Citation preview

ISSN 2070-7010
FAOFISHERIES ANDAQUACULTURE
TECHNICALPAPER
606
Understanding and measuringthe contribution of aquaculture and fisheries to gross domestic product (GDP)

Cover graphic: Koen Ivens.

Understanding and measuringthe contribution of aquaculture and fisheries to gross domestic product (GDP)
by
Junning Cai Aquaculture Officer FAO Fisheries and Aquaculture Department Rome, Italy
Hui HuangLecturerSanta Clara UniversitySanta Clara, United States of America
PingSun Leung Professor EmeritusUniversity of Hawai’i at Manoa Honolulu, United States of America
FOOD AND AGRICULTURE ORGANIZATION OF THE UNITED NATIONSRome, 2019
FAOFISHERIES ANDAQUACULTURE
TECHNICALPAPER
606

The designations employed and the presentation of material in this information product do not imply the expression of any opinion whatsoever on the part of the Food and Agriculture Organization of the United Nations (FAO) concerning the legal or development status of any country, territory, city or area or of its authorities, or concerning the delimitation of its frontiers or boundaries. The mention of specific companies or products of manufacturers, whether or not these have been patented, does not imply that these have been endorsed or recommended by FAO in preference to others of a similar nature that are not mentioned.
The views expressed in this information product are those of the author(s) and do not necessarily reflect the views or policies of FAO.
ISBN 978-92-5-131280-3© FAO, 2019
Some rights reserved. This work is made available under the Creative Commons Attribution-NonCommercial-ShareAlike 3.0 IGO licence (CC BY-NC-SA 3.0 IGO; https://creativecommons.org/licenses/by-nc-sa/3.0/igo/legalcode/legalcode).
Under the terms of this licence, this work may be copied, redistributed and adapted for non-commercial purposes, provided that the work is appropriately cited. In any use of this work, there should be no suggestion that FAO endorses any specific organization, products or services. The use of the FAO logo is not permitted. If the work is adapted, then it must be licensed under the same or equivalent Creative Commons licence. If a translation of this work is created, it must include the following disclaimer along with the required citation: “This translation was not created by the Food and Agriculture Organization of the United Nations (FAO). FAO is not responsible for the content or accuracy of this translation. The original [Language] edition shall be the authoritative edition.”
Disputes arising under the licence that cannot be settled amicably will be resolved by mediation and arbitration as described in Article 8 of the licence except as otherwise provided herein. The applicable mediation rules will be the mediation rules of the World Intellectual Property Organization http://www.wipo.int/amc/en/mediation/rules and any arbitration will be conducted in accordance with the Arbitration Rules of the United Nations Commission on International Trade Law (UNCITRAL).
Third-party materials. Users wishing to reuse material from this work that is attributed to a third party, such as tables, figures or images, are responsible for determining whether permission is needed for that reuse and for obtaining permission from the copyright holder. The risk of claims resulting from infringement of any third-party-owned component in the work rests solely with the user.
Sales, rights and licensing. FAO information products are available on the FAO website (www.fao.org/publications) and can be purchased through [email protected]. Requests for commercial use should be submitted via: www.fao.org/contact-us/licence-request. Queries regarding rights and licensing should be submitted to: [email protected].
Cai, J.N., Huang, H. & Leung, P.S. 2019. Understanding and measuring the contribution of aquaculture and fisheries to gross domestic product (GDP). FAO Fisheries and Aquaculture Technical Paper No. 606. Rome, FAO. 80 pp. Licence: CC BY-NC-SA 3.0 IGO.

iii
Preparation of this document
This document is a technical paper under the FAO Fisheries and Aquaculture Department’s initiative on the World Aquaculture Performance Indicators (WAPI). The paper enhances the understanding and measurement of the contribution of aquaculture and fisheries to GDP and facilitates the utilization of GDP measures for policy and planning for sustainable aquaculture and fisheries development. Knut Heen, Chang Seung and Eugene Tian are acknowledged for their formal peer review of the final draft of the paper. Manuel Barange, Kim Friedman, Minmin Lei, Jianbo Luo, Felix Marttin, Rebecca Metzner, Bart van Ommen, Jianxi Wang, Weiwei Wang, Xue Yan and Xinhua Yuan are acknowledged for their valuable comments and suggestions provided in seminars or through their review of an early draft of the paper. Maria Giannini and Marianne Guyonnet are acknowledged for their assistance in editing and formatting, and Koen Ivens is acknowledged for layout and graphic design.

iv
Abstract
The contribution of aquaculture and fisheries to gross domestic product (GDP) is one of the most widely used indicators of its economic performance. Despite strong interest in and great efforts made towards assessing the contribution of aquaculture and fisheries to GDP, there is a general lack of understanding or consensus on how to properly measure the sector’s contribution to GDP and effectively use the measures for evidence-based policy and planning for sustainable aquaculture and fisheries development. While a fisheries GDP measure has been included in the Sustainable Development Goals (SDGs) of the 2030 Agenda for Sustainable Development (i.e. SDG Indicator 14.7.1: Sustainable fisheries as a percentage of GDP in small island developing states, least developed countries and all countries), it is nevertheless a Tier III indicator for which no internationally established methodology or standards are yet available. This paper contributes to improving the understanding and measurement of aquaculture and fisheries’ contribution to GDP by: (i) using input-output models (including mathematical formulas and numerical examples) to formulate and clarify a set of measures of aquaculture and fisheries’ contribution to GDP; (ii) discussing alternative methods to estimate the measures under data-poor environments; (iii) suggesting an empirical methodology and general guidelines on the estimation and reporting of the measures; and (iv) exploring how to utilize the measures for evidence-based policy and planning. The conceptual framework and empirical methodology suggested in the paper will help move towards internationally established methodology, standards and guidelines on measuring aquaculture and fisheries’ economic contribution.

v
Contents
Preparation of this document iiiAbstract ivAbbreviations and acronyms xi
1. Introduction 1
2. The input-output model 5 2.1 Sales of outputs 5 2.2 Procurement of inputs 5 2.3 Intermediate consumption or input 6 2.4 Final use 6 2.5 Gross value added 6 2.6 A condensed input-output table 8
3. Aquaculture and/or fisheries direct gross value added (GVA) as a basic yet inadequate measure of its contribution to gross domestic product (GDP) 9 3.1 GVA as a basic measure of an industry/sector’s contribution to GDP 9 3.2 GVA-FU matrix: understanding GVA from both supply and demand
perspectives 11 3.3 GVA as an inadequate measure of a industry/sector’s contribution to GDP 19
4. Understanding and measuring aquaculture and/or fisheries’ indirect contribution to gross domestic product (GDP) 21 4.1 Decomposition of an industry/sector’s output into four components 21 4.2 Aquaculture and/or fishing’s indirect contribution to GDP through backward linkage 25 4.3 Aquaculture and fishing’s indirect contribution to GDP through its forward linkage to fish processing 27 4.4 Aquaculture and fishing’s indirect contribution through fish marketing 28 4.5 Aquaculture and fishing’s indirect contribution through fishing boat building 30
5. A satellite account approach to measuring the contribution of aquaculture and fisheries to gross domestic product (GDP) 31 5.1 Comparison between the satellite account approach and the input-output approach 31 5.2 Determining the scope of an extended aquaculture and fisheries sector 33

vi
6. Empirical methodology and good practices in estimating and utilizing gross domestic product (GDP) measures 35 6.1 Empirical methodology and good practices in measuring aquaculture and fisheries’ contribution to GDP 37 6.2 Good practices in reporting and interpreting measures of aquaculture and fisheries’ contribution to GDP 44 6.3 Utilization of GDP measures for evidence-based policy and planning 46
7. Concluding remarks 53
References 55
AppendicesAppendix I: Estimation of the gross value added-final use (GVA-FU) matrix 59Appendix II: Measuring indirect impact through backward linkage 61Appendix III: Measuring indirect impact through fish processing 63Appendix IV: Measuring indirect impact through fish marketing 64Appendix V: Measuring indirect impact through fishing boat building 65Appendix VI: Estimations for the three-industry sector 66Appendix VII: Estimations for the four-industry sector 68
BOxES
Box 1: General guidelines for determining the scope of an aquaculture and fisheries sector 37Box 2: Implementation of the satellite account approach when suitable input-output tables are available 41Box 3: Notes on using GVA ratios to estimate GDP measures 43Box 4: Notes on using GVA multipliers to estimate indirect GVA 43Box 5: Notes on how to value subsistence aquaculture and fisheries 44Box 6: General guidelines on the proper use of terminology to report indirect contribution 45Box 7: General guidelines for interpreting indirect GVA from the impact perspective 46Box 8: Notes on comparing aquaculture and fisheries’ contribution to GDP over time 48

vii
FIGURES
Figure 1: Global overview of aquaculture and fisheries’ contribution to GDP 2Figure 2: Linking an industry/sector/economy’s GVA to the final uses of multiple industries 12Figure 3: Linking an industry/sector/economy’s final use to the GVA of domestic industries and the import contents 14Figure 4: Three donut charts for assessing the fish sector’s GVA from the demand-side perspective 16Figure 5: Decomposition of an industry/sector’s output 24Figure 6: Components of aquaculture and fisheries’ contribution to GDP: input-output approach versus satellite account approach 32Figure 7: Aquaculture and fisheries’ direct and indirect contribution to GDP (%) 35
TABLES
Table 1: Input-output table for a seven-sector economy (million USD measured at producers’ prices) 7Table 2: A condensed input-output table for the economy described in Table 1 (million USD) 8Table 3: GVA–FU matrix for the economy described in Table 1 and Table 2 10Table 4: Decomposition of an industry/sector’s output 23Table 5: Direct and indirect contribution of aquaculture and/or fishing to GDP (million USD) 26Table 6: Direct and indirect contribution of aquaculture and fishing to GDP (million USD) with missing linkages accounted for 28Table 7: Contribution of aquaculture and fisheries to GDP: the case of the two-industry sector 36Table 8: Aquaculture and fisheries’ contribution to GDP under different scopes 37Table A.1: Contribution of aquaculture and fisheries to GDP: the case of the three-industry sector 67Table A.2: Contribution of aquaculture and fisheries to GDP: the case of the four-industry sector 69


ix
Abbreviations and acronyms
FU final useGDP gross domestic productGVA gross value addedGVA-FU gross value added – final useLAC Latin America and the CaribbeanROE rest of the economySDG Sustainable Development GoalWAPI World Aquaculture Performance Indicators


1
1. Introduction
Gross domestic product (GDP) is the most quoted indicator in national accounts that is widely used to measure the performance of an economy (United Nations, 2010). An industry or sector’s contribution to GDP is one of the most widely used indicators of its economic performance. Information and knowledge about an industry/sector’s contribution to GDP is essential for evidence-based policy and planning that can affect the level of political and financial support of the industry/sector, hence its development pace.
Fish is an important food source, accounting for close to one-fifth of global animal protein intake. Besides directly providing high-quality food, aquaculture and fisheries also create economic value through the production and marketing of wild and farmed fish.
Figure 1 provides a historical, global overview of aquaculture and fisheries’ contribution to GDP. The overview indicates that the aquaculture and fisheries’ percentage of GDP varies mostly from 0.01 percent to 10 percent. There is no obvious correlation between aquaculture and fisheries production and the sector’s percentage of GDP, which means that the sector’s percentage of GDP may not increase with its production scale. Yet, given the same production scale, the percentage tends to be smaller in developed regions (represented by triangles) than developing regions (represented by circles).
Substantial efforts have been made to generate or compile data and information about the contribution of aquaculture and fisheries to GDP at the global level (e.g. World Bank, 2012; FAO, 2018a, for a large number of countries worldwide); the regional level (e.g. de Graaf and Garibaldi, 2014, for African countries; Hofherr, Natale and Fiore, 2012, for aquaculture in European countries; Gillett, 2009, for Pacific Islands); and the national level (e.g. China Fishery Statistical Yearbooks).
It is hardly an overstatement to observe that every government with a specialized fisheries (including aquaculture) agency would like to measure the sector’s contribution to GDP. This tendency is expected to be strengthened by the inclusion of the fisheries’ contribution to GDP in the Sustainable Development Goals (SDGs) of the 2030 Agenda for Sustainable Development, i.e. SDG Indicator 14.7.1: Sustainable fisheries as a percentage of GDP in small island developing states, least developed countries and all countries.
The SDG indicator 14.7.1 has been categorized as a Tier III indicator, which means that no internationally established methodology or standards are yet available for the indicator.1 While various standards or guidelines on national accounts (United Nations, 2010; Lequiller and Blade, 2014; BEA, 2015) provide detailed guidance on how to measure the GDP of an economy, there is a lack of consensus on how to measure an industry/sector’s contribution to GDP. Practitioners often have inadequate understanding or misunderstanding of fisheries’ GDP indicators or the methods used to estimate them, a situation that tends to be aggravated by inconsistent assessment methods or confusing terminologies in the literature (World Bank, 2012). This has led to the underutilization or misuse of fisheries GDP measures that are often costly to estimate.
As the GDP of an economy is the sum of the gross value added (GVA) of individual industries/sectors, an industry/sector’s GVA is deemed a basic, straightforward measure of its contribution to GDP. In order to account for input-output multipliers – e.g. an increase in the aquaculture production could cause an expansion of the aquafeed industry – many practitioners treat an industry/sector’s own GVA as its “direct” contribution to GDP, and use the GVA that it helps generate in other industries/sectors to measure its “indirect” contribution.
1 www.fao.org/sustainable-development-goals/indicators/1471/en

2 Understanding and measuring the contribution of aquaculture and fisheries to GDP
Aquaculture and fisheries’ percentage of GDP (%)
100 10 1
0.1
0.01
0.00
110
100
1 00
010
000
100
000
1 00
0 00
010
000
000
100
000
000
Aq
uac
ult
ure
an
d fi
sher
ies
pro
du
ctio
n (
ton
nes
)
Afr
ican
cou
ntr
ies
Asi
anco
un
trie
sLA
Cco
un
trie
sPa
cifi
cIs
lan
ds
Euro
pea
nco
un
trie
sC
anad
aU
nit
ed S
ates
of
Am
eric
aJa
pan
New
Zea
lan
d
FIG
UR
E 1
Glo
bal
ove
rvie
w o
f aq
uac
ult
ure
an
d f
ish
erie
s’ c
on
trib
uti
on
to
GD
P
Sou
rce:
Dat
a o
n a
qu
acu
ltu
re a
nd
fish
erie
s p
rod
uct
ion
are
fro
m t
he
FAO
Glo
bal
Fis
her
y an
d A
qu
acu
ltu
re P
rod
uct
ion
Sta
tist
ics.
GD
P d
ata
are
fro
m v
ario
us
sou
rces
, in
clu
din
g K
ébé
and
Tal
lec
(200
6),
Wes
tlu
nd
, H
olv
oet
an
d K
ébé
(200
8),
Gill
et (
2009
),
Wo
rld
Fish
Cen
ter
(201
1), W
orl
d B
ank
(201
2), d
e G
raaf
an
d G
arib
ald
i (20
14),
FA
O (
2012
), F
AO
(20
18a)
, var
iou
s o
nlin
e so
urc
es, a
nd
th
e au
tho
rs’ o
wn
est
imat
ion
s b
ased
on
inp
ut-
ou
tpu
t ta
ble
s o
r so
cial
acc
ou
nti
ng
mat
rice
s.
No
tes:
(i)
Th
e fi
gu
re in
clu
des
133
co
un
trie
s (o
r te
rrit
ori
es)
in m
ult
iple
yea
rs (
a to
tal o
f 23
2 o
bse
rvat
ion
s). U
nle
ss s
pec
ified
oth
erw
ise,
in t
his
do
cum
ent
the
term
co
un
try
incl
ud
es n
on
-so
vere
ign
ter
rito
ry; (
ii) L
AC
rep
rese
nts
Lat
in A
mer
ica
and
th
e C
arib
-b
ean
; (iii
) C
ou
ntr
ies
or
terr
ito
ries
in d
evel
op
ing
reg
ion
s ar
e re
pre
sen
ted
by
circ
les,
wh
erea
s th
ose
in d
evel
op
ed r
egio
ns
are
rep
rese
nte
d b
y tr
ian
gle
s. A
cco
rdin
g t
o t
he
Un
ited
Nat
ion
s d
esig
nat
ion
, dev
elo
ped
reg
ion
s in
clu
de
Euro
pe,
No
rth
ern
Am
eric
a,Ja
pan
, A
ust
ralia
an
d N
ew Z
eala
nd
, w
her
eas
oth
er c
ou
ntr
ies
are
con
sid
ered
dev
elo
pin
g r
egio
ns;
(iv
) A
qu
acu
ltu
re a
nd
fish
erie
s in
clu
de
the
aqu
acu
ltu
re a
nd
fish
ing
in
du
stri
es,
bu
t n
ot
fish
pro
cess
ing
or
oth
er a
uxi
liary
in
du
stri
es;
(v)
Aq
uac
ult
ure
an
d
fish
erie
s’ p
erce
nta
ge
of
GD
P is
eq
ual
to
aq
uac
ult
ure
an
d fi
sher
ies’
(d
irec
t) g
ross
val
ue
add
ed (
GV
A)
div
ided
by
GD
P.

3Introduction
Under this method, a sector’s GVA is often counted as its direct contribution to GDP while at the same time treated as other sectors’ indirect contribution. Because of such double counting, the summation of all sectors’ total direct and indirect contribution would usually be much greater than the GDP of the entire economy. Despite attempts to develop alternative GDP measures that avoid this potentially misleading feature (Leones and Conklin, 1993; Johnson and Wade, 1994; Tanjuakio, Hastings and Tytus, 1996), GVA is the only uncontroversial GDP measure that remains free from the double-counting problem.
Indeed, some experts suggest that a sector’s GVA should be the only legitimate measure of its contribution to GDP, whereas its economic multipliers should be treated as its economic impacts but not called its “indirect contribution” to GDP because such “indirect contribution” measures are often subject to misuse or misunderstanding (Taylor and Smith, 1996; Watson et al., 2007). However, despite such reservations, direct and indirect contribution has remained a popular methodology adopted by many experts and practitioners (e.g. Westlund, Holvoet and Kébé, 2008; Cai, Leung and Hishamunda, 2009; World Bank, 2012; Tian, Mak and Leung, 2013; Sigfusson, Arnason and Morrissey, 2013).
This technical paper contributes to improving the understanding and measurement of aquaculture and fisheries’ contribution to GDP. In section 2, a numerical input-output model is developed to provide a conceptual framework for understanding GDP at the industrial/sectoral level and also serves as an empirical tool for measuring aquaculture and/or fisheries’ contribution to GDP. The model is a seven-sector model that is calibrated from a real world economy and captures key features of the fish value chain. Numerical examples based on the model would be used in ensuing sections to facilitate intuitive understanding of GDP indicators. Mathematical details of the model are presented in appendices in order to maintain a smooth flow in the main text; formulas therein can be applied to more general input-output models that include any number of sectors.
Section 3 examines GVA as a measure of aquaculture and/or fisheries’ contribution to GDP. A gross value added-final use (GVA-FU) matrix is constructed to link GVA to final use (FU) at the industrial/sectoral level. The matrix facilitates the understanding of an industry/sector’s contribution to GDP from both the demand and the supply sides. The comprehensive perspective can provide important information for policy and planning. Examples are used to show that, despite being a basic measure of its direct contribution to GDP, an industry/sector’s (direct) GVA is an inadequate measure of its economic contribution and needs to be supplemented with measures of its indirect contribution to GDP.
In section 4, a set of indicators are estimated in the input-output model to measure aquaculture and/or fisheries’ indirect contribution to GDP at different levels. Aquaculture and fisheries’ indirect GVA through backward linkage is estimated as a basic measure of its indirect contribution to GDP. The basic measure is then extended step by step to account for other linkages, including aquaculture and fisheries’ forward linkage to fish processing, its linkage to fish marketing, and its linkage to the fishing boat-building industry.
While these indicators are quantified by impact measures estimated from a dynamic, what-if perspective, they can be interpreted from a static, accounting perspective as measures of an industry/sector’s indirect contribution to GDP. For example, it can be shown that an industry/sector’s indirect contribution to GDP through backward linkage is similar to its direct GVA, a component of its output.
Section 5 examines a satellite account approach to measuring the GDP contribution of an extended aquaculture and fisheries sector that includes aquaculture, fishing and other key industries on the fish value chain. The satellite account approach can be used as a substitute when input-output tables are unavailable or not detailed enough to include aquaculture and fisheries as a distinct sector or two subsectors.

4 Understanding and measuring the contribution of aquaculture and fisheries to GDP
Section 6 summarizes the indicators examined in the paper and discusses how they could be and should be properly utilized to assess and monitor the contribution of aquaculture and fisheries to GDP for evidence-based policy and planning.
The last section – section 7 – concludes the paper with remarks on a way forward towards an internationally established methodology and standards for measuring the contribution of aquaculture and fisheries to GDP.

5
2. The input-output model
As an integral tool in national accounts for policy analysis and advice, input-output tables (including supply tables and use tables) provide systematic information on the cost structure and value added of industries and the flow of goods and services in the economy (Leontief, 1986; Kurz, Dietzenbacher and Lager, 1998; EUROSTAT, 2008; BEA, 2009; Miller and Blair, 2009; United Nations, 2010; United Nations, 2018).
Table 1 presents an input-output table calibrated from the input-output tables of China’s economy in 2007 (NBS, 2009), complemented with the fisheries GDP data in the China Fishery Statistical Yearbook (CFSY, 2008).2 The table specification follows terminologies used in the United Nations System of National Accounts 2008 (United Nations, 2010).
The input-output table includes six key industries on the fish value chain:(i) aquaculture; (ii) fishing; (iii) manufacture of aquafeed (aquafeed in short);(iv) building of fishing boats (fishing boat building or fishing boat in short);(v) fish processing; and (vi) fish marketing (transporters, storage services, wholesalers, retailers, etc.). For simplicity, other industries in the economy, including some important ones on the fish value chain such as the restaurant and food catering industry, for example, are aggregated into the “rest of the economy” (ROE), i.e. the ROE sector.
2.1 Sales of outputsIn Table 1, rows 1 to 8 describe the sales of products (including goods and services) provided by domestic and foreign producers for intermediate consumption and final use. For example, row 1 indicates that, in total, the economy spends USD 513 million on aquaculture products, including USD 500 million (column 14) for domestic aquaculture products and USD 13 million (column 13) for imported aquaculture products. Part of the USD 513 million on aquaculture products goes to the intermediate consumption of aquaculture (USD 15 million), fishing (USD 2 million), aquafeed (USD 6 million), fish processing (USD 100 million) and ROE (USD 150 million). The rest goes to final use, including USD 200 million of final consumption, USD 10 million of capital formation and USD 30 million of export.
2.2 Procurement of inputsColumns 1 to 8 describe intermediate and primary inputs used by domestic industries. For example, as indicated in column 2, the domestic fishing industry purchasesUSD 100 million (row 8) of intermediate products, both domestic and imported products, including USD 2 million from aquaculture, USD 8 million from fishing, USD 2 million from fish marketing and USD 88 million from ROE. The fishing industry also consumes USD 40 million on fixed capital (through depreciation), pays USD 200 million for labour, contributes USD 10 million to tax revenue, and gainsUSD 50 million of net operating surplus. The sum of these primary incomes is equal to the industry’s USD 300 million of GVA (row 14).
2 The calibration has scaled down China’s economy in 2007 for narrative convenience and slightly modified its structure to facilitate the design of examples for illustration.

6 Understanding and measuring the contribution of aquaculture and fisheries to GDP
2.3 Intermediate consumption or inputThe sub-matrix comprising rows 1–8 and columns 1–8 describes the flow of intermediate products in the economy. The numbers in the sub-matrix represent the sales of row industries to column industries (for intermediate consumption) and, equivalently, the purchases of column industries from row industries (as intermediate inputs).
It should be noted that the intermediate consumption (or inputs) in Table 1 include both domestic and imported products. For example, the USD 150 million in the cell(row 3, column 1) includes both domestically produced and imported aquafeed purchased by the domestic aquaculture industry.
2.4 Final useFinal use is often called final demand in the input-output literature. The sub-matrix comprising rows 1–8 and columns 9–12 shows the components in final use, including final consumption, capital formation and export. Final consumption (column 9) measures the value of goods and services consumed by households and the government. Capital formation (column 10) includes building up fixed capital or inventories – note that a change in inventories could be negative (row 3, column 10), which represents depletion of inventories. Export (column 11) represents products sold to non-residents, such as foreign households, governments and producers, which may be used for intermediate consumption, final consumption and/or capital formation.
2.5 Gross value added The sub-matrix comprising rows 9–14 and columns 1–8 shows GVA and its composition. GVA (row 14) is equal to total input (row 15) minus total intermediate input (row 8), whereas the total input of each industry is equal to its total output (column 14).
Conceptually, an industry’s GVA is a residual value equal to the difference between its output and intermediate input. For example, fish processing’s USD 700 million output (row 5, column 14) is the value of products that it supplies to domestic and foreign markets, and its USD 530 million intermediate input (row 8, column 5) is the value of intermediate products that it purchases from domestic and foreign markets. The USD 170 million (row 14, column 5) difference between the two measures is the economic value that the industry adds to the economy. The USD 170 million value added includes USD 100 million “compensation to employees” (i.e. labour income); USD 20 million “net tax on production” (i.e. government tax revenue); USD 20 million “consumption of fixed capital” (i.e. depreciation); and USD 30 million “net operating surplus” (i.e. business profit) – the last two combined makes up the USD 50 million “gross operating surplus” (i.e. gross business profit).
GVA is often deemed the value of primary inputs (mostly labour and capital); hence, the sum of intermediate input and GVA is equal to total input. Yet, it is important to note that the value of total input is determined by total output (they are two sides of the same coin), and GVA is determined by total input minus intermediate input.

7The input-output model
TAB
LE 1
In
pu
t-o
utp
ut
tab
le f
or
a se
ven
-sec
tor
eco
no
my
(mill
ion
USD
mea
sure
d a
t p
rod
uce
rs’ p
rice
s)In
term
edia
te c
on
sum
pti
on
(s
ales
fro
m r
ow
ind
ust
ries
to
co
lum
n in
du
stri
es)
Fin
al u
seTo
tal s
up
ply
of
go
od
s an
d s
ervi
ces
Ro
w
no
.C
olu
mn
no
.1
23
45
67
89
1011
1213
14
Ind
ust
ry
Aquaculture
Fishing
Aquafeed
Fishing boat
Fish processing
Fish marketing
ROE
Total intermediate consumption, GVA or input (sum of columns 1 to 7)
Final consumption
Capital formation
Export
Total final use (sum of columns 9 to 11)
Import
Total output (column 8 plus column 12 minus column 13)
Intermediate inputs (purchases of column industries from row industries)
1A
qu
acu
ltu
re
152
6-
100
-15
027
320
010
3024
013
500
2Fi
shin
g5
830
-20
0-
2026
310
010
100
210
7340
0
3M
anu
fact
ure
of
aqu
afee
d15
0-
12-
--
-16
2-
-30
200
170
9224
0
4B
uild
ing
of
fish
ing
bo
ats
--
-20
--
-20
-11
040
150
2015
0
5Fi
sh p
roce
ssin
g-
-60
-80
-15
029
030
020
200
520
110
700
6Fi
sh m
arke
tin
g3
25
-30
3030
100
400
-10
050
0-
600
7R
est
of
the
eco
no
my
(RO
E)77
8867
8012
021
098
250
98 8
9225
304
19 5
0018
455
63 2
5914
741
147
410
8To
tal i
nte
rmed
iate
co
nsu
mp
tio
n,
fin
al u
se, i
mp
ort
or
ou
tpu
t (s
um
of
row
s 1
to 7
)25
010
018
010
053
024
098
600
100
000
26 3
0419
620
19 1
2565
049
15 0
4915
0 00
0
Gross value added (primary inputs)
9C
om
pen
sati
on
to
em
plo
yees
200
200
3030
100
9019
350
20 0
00
10N
et t
ax o
n p
rod
uct
ion
1010
66
2090
7 35
87
500
11G
ross
op
erat
ing
su
rplu
s
(ro
w 1
4 m
inu
s ro
w 9
an
d m
inu
s ro
w 1
0)40
9024
1450
180
22 1
0222
500
12C
on
sum
pti
on
of
fixe
d c
apit
al
(i.e
. dep
reci
atio
n)
1040
94
2030
7 38
77
500
13N
et o
per
atin
g s
urp
lus
(ro
w 1
1 m
inu
s ro
w 1
2)30
5015
1030
150
14 7
1515
000
14G
ross
val
ue
add
ed –
GV
A
(ro
w 1
5 m
inu
s ro
w 8
)25
030
060
5017
036
048
810
50 0
00
15To
tal i
np
ut
(eq
ual
to
to
tal o
utp
ut)
500
400
240
150
700
600
147
410
150
000
No
te: “
-” r
epre
sen
ts z
ero
.

8 Understanding and measuring the contribution of aquaculture and fisheries to GDP
2.6 A condensed input-output tableIn order to facilitate the estimation of aquaculture and/or fisheries’ contribution to GDP, the input-output table in Table 1 is condensed into Table 2. Besides condensation of the final use and GVA sections for simplicity, the main difference between the two tables is how import is accounted for.
While the intermediate inputs and final uses in Table 1 include both domestically produced and imported products, those in Table 2 include only domestic products. Thus, the intermediate inputs and final uses in Table 2 are smaller than their counterparts in Table 1 (the differences may not be apparent due to rounding).
Accordingly, the value of imported products is consolidated in the import sector (Table 2: row 8) – such consolidation is commonly used in input-output tables (e.g. DBEDT, 2013). For example, the total value of imported intermediate inputs used directly by aquaculture is USD 94 million (Table 2: row 8, column 1); and the total value of imported products for final use is USD 4 698 million (Table 2: row 8, column 9).
Correspondingly, a column is added in Table 2 (column 8) to represent the import sector in order to facilitate input-output modelling based on the table; see an example in Appendix I. The import sector purchases no intermediate inputs. Hence, its “GVA” is equal to the total import of the entire economy (row 8, column 10;USD 15 409 million). Unlike the GVA of other industries which represents the value of primary inputs, the GVA of the import sector is essentially value added by foreign enterprises to the domestic economy through import.
TABLE 2 A condensed input-output table for the economy described in Table 1 (million USD)
Row no.
Column no. 1 2 3 4 5 6 7 8 9 10
Industry
Aq
uac
ult
ure
Fish
ing
Aq
uaf
eed
Fish
ing
bo
at
Fish
pro
cess
ing
Fish
mar
keti
ng
RO
E
Imp
ort
Fin
al u
se
Tota
l ou
tpu
t
(su
m o
f co
lum
n 1
to
9)
1 Aquaculture 15 2 6 - 97 - 146 - 234 500
2 Fishing 4 6 24 - 161 - 16 - 188 400
3 Manufacture of aquafeed 65 - 5 - - - - - 170 240
4 Building of fishing boats - - - 17 - - - - 133 150
5 Fish processing - - 49 - 66 - 123 - 462 700
6 Fish marketing 3 2 5 - 30 30 30 - 500 600
7 Rest of the economy (ROE) 69 79 60 72 108 188 88 171 - 58 663 147 410
8 Import 94 11 31 11 69 22 10 114 - 4 698 15 049
9 Gross value added 250 300 60 50 170 360 48 810 15 049 65 049
10 Total input (sum of rows 1 to 9) 500 400 240 150 700 600 147 410 15 049 165 049
Notes: “-” represents zero. The intermediate input matrix (rows 1–7 and columns 1–7) represents the domestic content (i.e. excluding imported intermediate inputs) of the same matrix in Table 1; the final use matrix (rows 1–7 and column 9) represents the domestic content of the total final use matrix (rows 1–7 and column 12) in Table 1.

9
3. Aquaculture and/or fisheries direct gross value added (GVA) as a basic yet inadequate measure of its contribution to gross domestic product (GDP)
3.1 GVA as a basic measure of an industry/sector’s contribution to GDPConceptually, GDP, as the name suggests, measures a country’s domestic contribution to its final goods and services in a given time period. As the domestic content is equal to the total GVA of all industries, an industry/sector’s GVA naturally becomes the basic measure of its contribution to GDP.
In Table 1, GDP can be estimated by subtracting the total value of import(row 8, column 13; USD 15 049 million) from the total final use (row 8, column 12; USD 65 049 million). The resulting USD 50 000 million is exactly equal to the total GVA of all industries (row 14, column 8). Hence, each industry/sector’s GVA (row 14) is a straightforward measure of its contribution to GDP. Specifically, one can say that the aquaculture GDP is USD 250 million, the fishing GDP is USD 300 million, and so on.
An economy’s total final use and its total GVA are two sides of the same GDP. This accounting identity is nevertheless not applicable at the industrial/sectoral level. As indicated in Table 2, fishing’s GVA (USD 300 million) is nearly twice as much as its sales to final use (USD 188 million), whereas the GVA of fish processing (USD 170 million) is less than half of its sales to final use (USD 462 million).
As the fishing industry sells USD 161 million (i.e. 40 percent of its USD 400 million output) to fish processing, its GVA embedded in the intermediate sales would end up mostly in the final use of fish processing as well as in the final use of downstream industries that use fish processing products as intermediate inputs.
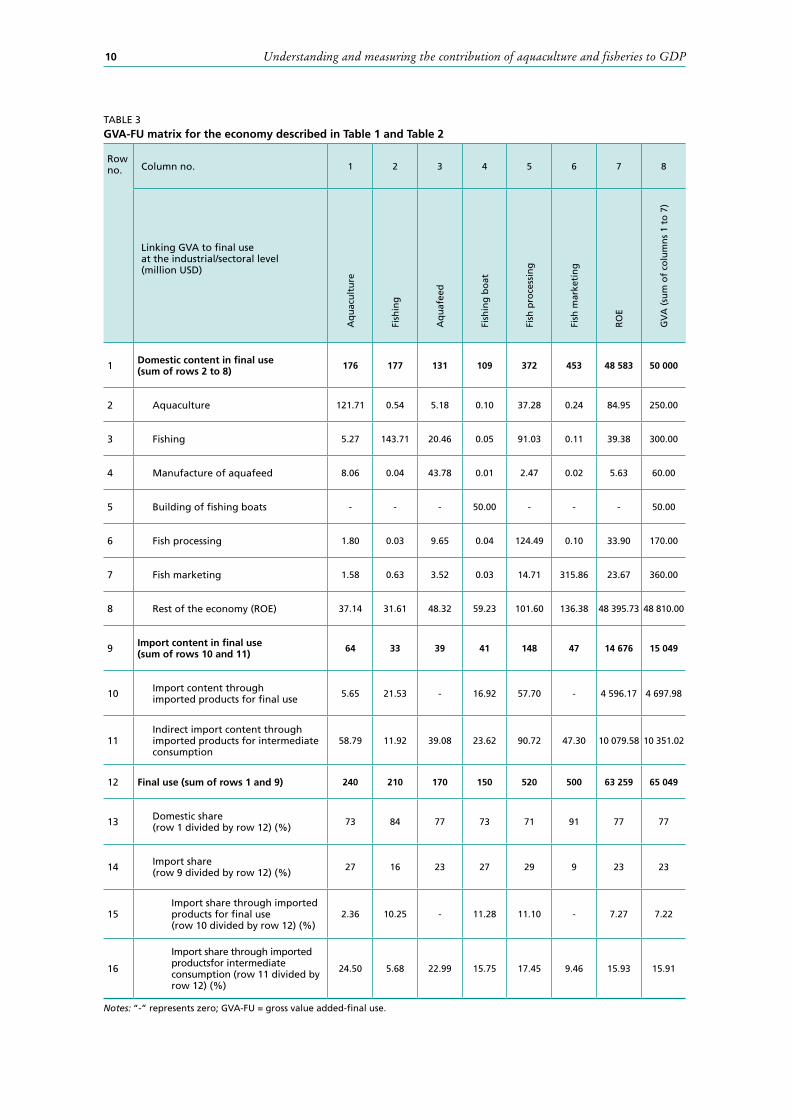
Generally speaking, an industry’s GVA would relate not only to its own final use but also to the final uses of other industries along the value chain. In Appendix I, a mathematical input-output model is used to track the destination of individual industries’ GVA to final use. The resulting equation (A8) links an industry’s GVA to the final uses of multiple industries (itself included). The equation is applied to the economy described in Table 1 and Table 2; the results are presented in a GVA-FU matrix (Table 3).
10 Understanding and measuring the contribution of aquaculture and fisheries to GDP
TABLE 3 GVA-FU matrix for the economy described in Table 1 and Table 2
Row no. Column no. 1 2 3 4 5 6 7 8
Linking GVA to final use at the industrial/sectoral level (million USD)
Aq
uac
ult
ure
Fish
ing
Aq
uaf
eed
Fish
ing
bo
at
Fish
pro
cess
ing
Fish
mar
keti
ng
RO
E
GV
A (
sum
of
colu
mn
s 1
to 7
)
1 Domestic content in final use (sum of rows 2 to 8) 176 177 131 109 372 453 48 583 50 000
2 Aquaculture 121.71 0.54 5.18 0.10 37.28 0.24 84.95 250.00
3 Fishing 5.27 143.71 20.46 0.05 91.03 0.11 39.38 300.00
4 Manufacture of aquafeed 8.06 0.04 43.78 0.01 2.47 0.02 5.63 60.00
5 Building of fishing boats - - - 50.00 - - - 50.00
6 Fish processing 1.80 0.03 9.65 0.04 124.49 0.10 33.90 170.00
7 Fish marketing 1.58 0.63 3.52 0.03 14.71 315.86 23.67 360.00
8 Rest of the economy (ROE) 37.14 31.61 48.32 59.23 101.60 136.38 48 395.73 48 810.00
9 Import content in final use (sum of rows 10 and 11) 64 33 39 41 148 47 14 676 15 049
10 Import content through imported products for final use 5.65 21.53 - 16.92 57.70 - 4 596.17 4 697.98
11Indirect import content through imported products for intermediate consumption
58.79 11.92 39.08 23.62 90.72 47.30 10 079.58 10 351.02
12 Final use (sum of rows 1 and 9) 240 210 170 150 520 500 63 259 65 049
13 Domestic share (row 1 divided by row 12) (%) 73 84 77 73 71 91 77 77
14 Import share (row 9 divided by row 12) (%) 27 16 23 27 29 9 23 23
15Import share through imported products for final use (row 10 divided by row 12) (%)
2.36 10.25 - 11.28 11.10 - 7.27 7.22
16
Import share through imported productsfor intermediate consumption (row 11 divided by row 12) (%)
24.50 5.68 22.99 15.75 17.45 9.46 15.93 15.91
Notes: “-” represents zero; GVA-FU = gross value added-final use.

11Aquaculture and/or fisheries direct GVA as a basic yet inadequate measure of its contribution to GDP
3.2 GVA-FU matrix: understanding GVA from both supply and demand perspectivesLinking an industry/sector/economy’s GVA to the final uses of multiple industriesThe GVA-FU matrix in Table 3 shows how much a row industry/sector’s GVA can be attributed to the final use of a column industry/sector. For example, row 2 indicates that nearly half of aquaculture’s USD 250 million GVA (USD 121.71 million to be exact) is attributed to its own final use, and the rest primarily to the final use of fish processing (USD 37.28 million) and ROE (USD 84.95 million). Such attribution for all the seven industries as well as the entire economy is illustrated in Figure 2. Some notable findings are highlighted in the following:• Anindustry’sGVAisusuallyattributedprimarilytoitsownfinaluse.Thisistruefor
all the six industries on the fish value chain as well as ROE. • Theaquaculture industryhasarelatively lowpercentageof itsGVAattributedto
its own final use, as does the fishing industry. Constituting upstream industries in the primary sector, these two industries have a relatively large portion of their production sold to downstream industries (e.g. fish processing) as intermediate inputs; hence, a relatively large portion of their GVA would end up in the final uses of other industries.
• Aquafeed is also an upstream industry whose output is mostly used as anintermediate input of aquaculture. However, Figure 2 shows that 72.97 percent of aquafeed’s GVA is attributed to its own final use. This is because, as indicated in Table 1 (row 3), a large portion of aquafeed’s output goes to export. Even though exported aquafeed production would be used as an intermediate input by fish farmers in foreign countries, it is deemed a final product for the domestic economy. In contrast, aquafeed production sold to domestic aquaculture would be consumed in fish farming activities and hence does not belong to final use.
• TheentireGVAoffishingboatbuildingisattributedtoitsownfinaluse.Thereasonis that the purchase of fishing vessels (as capital goods) are not treated as intermediate consumption. The value of a fishing vessel used by the fishing industry would enter fishing’s output through the “consumption of fixed capital” (Table 1, row 12); and the value would not be accounted for as an intermediate input supplied by fishing boat, but as the GVA of the fishing industry.
• Asadownstreamindustryofaquacultureandfishing,fishprocessinghasarelativelyhigh percentage of GVA attributed to its own final use (73.23 percent).
• FishmarketingalsohasarelativelyhighpercentageofGVAattributedtoitsownfinal use (87.74 percent). This is mainly due to the large portion (USD 500 million) of its USD 600 million output being sold to final use. The USD 500 million represents transport and trade margins for marketing fish products for final use. The way fish marketing businesses are accounted for in the input-output table will be discussed in section 4.4.
• Over99percentofROE’sGVAisattributedtoitsownfinaluse.Thisreflectsthatthe six industries on the fish value chain are only a small portion of the economy. Indeed, less than 3 percent of the GDP of the entire economy is attributed to the final uses of the six industries; the rest of the 97 percent is attributed to that of ROE.
Linking an industry/sector/economy’s final use to the GVA of multiple industriesViewed from another angle, the columns of the GVA-FU matrix in Table 3 show the domestic and import contents of each column industry/sectors’ final use in terms of the GVA of multiple row industries/sector as well as the direct and indirect import contents. For example, column 2 indicates that fishing’s USD 210 million final use (row 12) is composed of USD 177 million “domestic content” (row 1) and USD 33 million “import content” (row 9). The domestic content comes primarily from its own GVA(USD 143.71 million) and the GVA of ROE (USD 31.61 million). It should be noted

12 Understanding and measuring the contribution of aquaculture and fisheries to GDP
FIGURE 2Linking an industry/sector/economy’s GVA to the final uses of the seven industries
Note: ROE = rest of the economy.

13Aquaculture and/or fisheries direct GVA as a basic yet inadequate measure of its contribution to GDP
that the USD 177 million domestic content is less than the USD 188 million domestic fishing products sold to final use (Table 2: row 2, column 9) because the latter contains the value (USD 11.92 million) of imported intermediate inputs used by the fishing industry directly through its own import and indirectly through the imports of upstream industries.3
The USD 11.92 million represents the “indirect import content” (Table 3: row 11) in the USD 210 million fishing products for final use, as opposed to the USD 21.53 million “direct import content” (row 10), which represents the value of imported fishing products for final use. The USD 21.53 million is part of the USD 73 million imported fishing products for intermediate consumption and final use (Table 1: row 2, column 13).
Figure 3 illustrates the domestic and import contents of the final use of each of the six industries on the fish value chain, ROE and the entire economy. Some notable findings are highlighted in the following: • Thefinaluseof aquaculture,fishingorfishmarketinghas ahigherpercentageof
domestic content from its own GVA (50.71 percent, 68.43 percent, 63.17 percent, respectively) than aquafeed, fishing boat or fish processing (25.75 percent,
33.33 percent and 23.94 percent, respectively). This reflects the first three industries’ higher GVA ratios (50 percent, 75 percent and 60 percent, respectively) than the latter three (25 percent, 33 percent and 23 percent, respectively).4
• Although aquafeed represents 30 percent of aquaculture’s total input (Table 1),aquafeed’s GVA accounts for only a small percentage (3.36 percent) of aquaculture’s final use (Figure 3). Part of the discrepancy arises because the domestic aquafeed industry supplies only USD 65 million of the USD 150 million aquafeed used by aquaculture (Table 1 and Table 2), and the rest is from imports.
• AsindicatedinTable2,aquaculture’spurchasefromaquafeed(USD65million)issimilar to its purchase from ROE (USD 69 million). Yet, while aquaculture’s final use has only 3.36 percent domestic content from aquafeed’s GVA, it has 15.47 percent domestic content from ROE’s GVA (Figure 3). This is because ROE’s GVA goes to aquaculture’s final use not only through its direct sales to aquaculture but also through its sales to other industries, some of which would eventually end up in the final use of aquaculture. Indeed, all the six industries on the fish value chain have relatively large domestic content from ROE’s GVA (15.47 percent for aquaculture, 15.05 percent for fishing, 28.43 percent for aquafeed, 39.49 percent for fishing boat, 19.54 percent for fish processing and 27.28 for fish marketing).
•AcomparisonofTable1(row1,column12)andTable2(row1,column9)indicatesthat the USD 240 million aquaculture products used by the economy for final use includes only USD 6 million (USD 5.65 million to be exact) imported aquaculture products, which accounts for 2.36 percent of aquaculture’s final use. However, Figure 3 indicates that aquaculture’s USD 240 million final use contains 26.85 percent import content. This is mainly because aquaculture uses a large amount of imported aquafeed (USD 85 million).5 The 26.85 percent import content of aquaculture’ final use is composed of 24.5 percent imported intermediate products directly or indirectly used by the aquaculture industry (imported aquafeed, imported seed, etc.) and
2.36 percent imported final products (imported tilapia fillets, imported lobsters, etc.).• Theentireeconomy’sUSD 65 049millionfinalusecontains23.13percentimport
content, including 7.22 percent from final products and 15.91 percent from intermediate products. Among the seven industries, only fishing has a larger import content from final products than that from intermediate products (Figure 3).
3 Numbers may not add up because of rounding. 4 The GVA ratio of an industry is equal to its GVA divided by its output.5 The USD 85 million is equal to aquaculture’s USD 150 million total aquafeed input (Table 1: row 3, column 1) minus its USD 65 million domestic aquafeed input (Table 2: row 3, column 1).

14 Understanding and measuring the contribution of aquaculture and fisheries to GDP
FIGURE 3Linking an industry/sector/economy’s final use to the GVA of domestic industries and the import contents
Note: ROE = rest of the economy.

15Aquaculture and/or fisheries direct GVA as a basic yet inadequate measure of its contribution to GDP
Spurious linkagesAlthough the fishing boat-building industry purchases no intermediate inputs from aquaculture, fishing, aquafeed, fish processing or fish marketing (Table 2), some portions of its final use are attributed to these industries (Figure 3) because fishing boat purchases from ROE and ROE purchases from these industries (Table 2). However, this could reflect the fishing boat’s spurious backward linkages to these industries through ROE as an aggregate sector that includes multiple industries. For example, ROE can be backward linked to aquaculture through the restaurant and food catering industry’s purchase of farmed fish from aquaculture, and fishing boat can be backward linked to ROE through its purchase of steel from the metal industry. While these two links are disconnected at the industrial level because the metal industry does not buy from the restaurant and food catering industry, they would be seemingly connected through ROE as an aggregate sector.
Using the GVA-FU matrix for policy and planning: an exampleBy establishing links between GVA and final use at the industrial level, a GVA-FU matrix, such as Table 3, facilitates a deeper understanding of individual industries’ contribution to GDP from both the supply side (i.e. GVA) and the demand side (i.e. final use). The comprehensive perspective is important to the proper use of GDP indicators for policy and planning. The following example is provided.
When examining Table 1 or Table 2, it is not difficult to verify that the GVA of the four-industry fish sector (comprising aquaculture, fishing, fish processing and fish marketing) is USD 1 080 million, which is 2.16 percent of the USD 50 000 million GDP of the entire economy. Suppose that the economy has a large amount of underutilized resources and capacity that allows the four-industry fish sector to double its scale; hence, the government intends to set targets to double the sector’s GVA toUSD 2 160 million and its percentage of GDP to 4.32 percent. Are these targets feasible, and what should the government do to achieve them?
Doubling the fish sector’s production would not automatically double its GVA – it is likely that an increase in the sector’s production does not raise its economic contribution because the increased production may be associated with a decline in the price. Doubling the fish sector’s GVA would not automatically double its percentage of GDP because the increased GVA may be associated with an increase in the GDP of the entire economy. Therefore, evaluating the policy targets on the fish sector’s GVA entails an assessment of its GVA from the demand-side perspective.
Three donut charts for assessing GVA from the demand-side perspectiveFigure 4 includes three donut charts for assessing the fish sector’s GVA from the demand-side perspective (see the figure notes for details). The first donut chart, Figure 4(a), shows that 80 percent (USD 859 million) of the fish sector’sUSD 1 080 million GVA is attributable to its own final use. This indicates that the fish sector’s GVA is mostly linked to its own final use. Therefore, when assessing the policy targets on doubling the fish sector’s economic contribution, the first thing to consider should be whether and how an increase in the fish sector’s GVA can be accommodated by an increase in its own final use.
An increase in the fish sector’s final use would certainly help increase the fish sector’s GVA, yet the magnitude would not be one to one; this is due to the fact that the fish sector’s final use contains not only its own GVA, but also the GVA of the non-fish sector in addition to the import content.
As indicated in Figure 4(b), the fish sector’s USD 1 470 million final use contains USD 1 385 million (94 percent) domestic fish products and USD 85 million (6 percent) imported fish products.6 The USD 1 385 million domestic fish products are composed
6 The fish sector’s USD 1 470 million final use represents the value of various fish products (whole fish, fish fillet, dried fish, canned fish, etc.) supplied by the domestic fish sector or imported from foreign countries.

16 Understanding and measuring the contribution of aquaculture and fisheries to GDP
FIGURE 4Three donut charts for assessing the fish sector’s GVA from the demand-side perspective
Notes: The fish sector includes aquaculture, fishing, fish processing and fish marketing, whereas the non-fish sector includes aquafeed, fishing boat and rest of the economy. Figure 4(a) is based on the aggregate result of rows 2, 3, 6 and 7 in Table 3 for the fish sector (including columns 1, 2, 5 and 6) and the non-fish sector (including columns 3, 4 and 7). Figure 4(b) is based on the aggregate result of the matrix comprising rows 1, 2, 5 and 6 and columns 9 to 11 in Table 1. Figure 4(c) shows the aggregate result of columns 1, 2, 5 and 6 in Table 3 for the fish sector (including rows 2, 3, 6 and 7) and the non-fish sector (including rows 4, 5 and 8).

17Aquaculture and/or fisheries direct GVA as a basic yet inadequate measure of its contribution to GDP
of USD 1 176 million domestic content and USD 209 million indirect import content. The USD 1 176 million domestic content is composed of USD 859 million fish sector’s GVA and USD 317 million non-fish sector’s GVA. The USD 209 million indirect import content represents the imported intermediate inputs used in the domestic fish production and marketing, as opposed to the USD 85 million direct import content representing imported fish products for final use.
The USD 209 million imported intermediate inputs include both fish products (e.g. imported raw fish materials for processing) and non-fish products (e.g. imported aquafeed ingredients); it can be verified from Table 1 and Table 2 that the amount of the imported intermediate fish products is USD 59 million.7
Finally, Figure 4(c) indicates that 71 percent (USD 1 040 million) of the fish sector’s USD 1 470 million final use is for domestic final use (including USD 1 000 million domestic final consumption and USD 40 million capital formation, or more specifically, inventory accumulation); the remaining 29 percent (USD 430 million) is for export.
With the three donut charts explained, they can enable an examination of how the final use could be changed to facilitate an increase in the fish sector’s GVA.
Own GVA-FU ratioAs shown in Figure 4(b), the fish sector’s USD 1 470 million final use comprises primarily USD 1 385 million final use of domestic products; and the USD 1 385 million domestic final use contains USD 859 million GVA generated in the fish sector. Thus, the fish sector’s own GVA-FU ratio would be 0.62 (equal to the USD 859 million divided by the USD 1 385 million), which implies that a USD 1 increase in the fish sector’s domestic final use would tend to result in USD 0.62 increase in its GVA.
Increasing the fish sector’s GVA through import substitutionWith its USD 1 470 million total final use remaining the same, the fish sector’s GVA could be increased through import substitution. The economy imports USD 85 million of fish products for final use (i.e. the direct import in Figure 4(b) and USD 59 million of fish products for intermediate consumption; see footnote 7). If both imports are completely substituted by the domestic production, the fish sector’s domestic final use can be increased by USD 144 million (equal to USD 85 million plus USD 59 million), which, given the fish sector’s 0.62 own GVA-FU ratio, would result in a USD 89 million (equal to USD 144 million multiplied by 0.62) increase in the fish sector’s GVA.
The potential USD 89 million increase in the fish sector’s GVA through the import substitution would be able to increase the fish sector’s USD 1 080 million GVA by8 percent and increase its percentage of GDP slightly from 2.16 percent to2.34 percent. Therefore, import substitution could only offer slight assistance towards the government’s goal to double the fish sector’s economic contribution.
Increasing the fish sector’s GVA through higher domestic fish consumptionGiven the fish sector’s 0.62 own GVA-FU ratio, the fish sector’s domestic final use would need to increase by USD 1 741 million in order to increase the sector’s GVA by USD 1 080 million (i.e. doubling the current level).8 This means that the domestic fish consumption would need to increase by 174 percent from its USD 1 000 million current level in order to increase the fish sector’s GVA by 100 percent.
An increase in fish consumption by this magnitude tends to take time. For example, it took two decades for China’s total fish consumption to increase from 17 million tonnes (live weight equivalent) in 1993 to 52 million tonnes in 2013. Mostly, the
7 The USD 59 million is equal to the sum of the numbers in: (i) the matrix composed of rows 1–2 and columns 1–2; (ii) the matrix composed of rows 5–6 and columns 1–2; (iii) the matrix composed of rows 1–2 and columns 5–6; and (iv) the matrix composed of rows 5–6 and columns 5–6 in Table 1 minus the sum of the same set of numbers in Table 2. The result may be slightly different from USD 59 million because of rounding.8 The USD 1 714 million is equal to the USD 1 080 million divided by 0.62; the result may not be exact because of rounding.

18 Understanding and measuring the contribution of aquaculture and fisheries to GDP
200 percent increase was a result of the 165 percent increase in the country’s per capita fish consumption from 14 kg (live weight equivalent) in 1993 to 38 kg in 2013, and the rest from its 14 percent population growth during the period (FAO, 2018b).
Yet, the required time for achieving this increase could be shorter for a country with a relatively low per capita fish consumption. For example, since aquaculture production in Armenia started taking off in 2006 (FAO, 2018c), it took the country only eight years to triple its total fish consumption by increasing its per capita fish consumption from 1.5 kg (live weight equivalent) in 2006 to 4.5 kg in 2013 (FAO, 2018b).
While an increase in domestic fish consumption raises the fish sector’s GVA, the sector’s percentage of GDP may nevertheless not increase accordingly. For example, a fish consumption hike driven by population or income growth may have little impact on the fish sector’s percentage of GDP because the growing or wealthier population would tend to increase not only fish consumption but also the consumption of other goods and services. From another angle, population or income growth would tend to drive up the fish sector’s GVA and the entire economy’s GDP at the same time; hence the fish sector’s percentage of GDP may not rise (and could actually decline) with its increased GVA.
In contrast, a fish consumption hike driven by an increase in the consumer’s preference over fish consumption is more likely to increase the fish sector’s percentage of GDP. However, food composition in a country could be quite stable. For example, despite the 165 percent increase in China’s per capita fish consumption between 1993 and 2013, its fish share in animal protein intake increased slightly from 19.6 percent to 21.4 percent (FAO, 2018b). Yet, a country with a relatively low fish share in animal protein may be able to double the share. For instance, as Armenia tripled its per capita fish consumption between 2006 and 2013, its fish share in animal protein intake increased more than double, from 1.3 percent to 3.0 percent (FAO, 2018b).
Increasing the fish sector’s GVA through export expansionAs indicated in Figure 4(c), if the USD 1 741 million increase in the fish sector’s domestic final use (needed to double its USD 1 080 million GVA) needs to be completely absorbed by export expansion, then the sector’s export would need to increase by four times from its current level (USD 430 million). The feasibility of the export expansion depends on the export market potential of the country’s fish production. Generally speaking, a country with a small share in the export market may be more likely to increase its export in a large magnitude.
Compared to the case of expansion in domestic fish consumption, an increase in the fish sector’s GVA through export expansion would be more likely to result in an increase in the sector’s percentage of GDP because the increase is not bounded by the country’s fish share in food consumption or total expenditure. For example, as the GVA of the export-oriented fisheries sector in Iceland increased from around ISK 80 billion (Icelandic króna) to over ISK 120 billion between 2007 and 2010, the sector’s percentage of GDP increased from around 6 percent to above 10 percent (Sigfusson, Arnason and Morrissey, 2013).
Increasing the fish sector’s GVA through expansion in non-fish sector’s final useAs indicated in Figure 4(a), 20 percent of the fish sector’s USD 1 080 million GVA is attributable to the non-fish sector’s final use. This 20 percent represents theUSD 221 million of the fish sector’s GVA that primarily goes to the products of industries that utilize fish products as intermediate inputs (seafood restaurants and catering, aquariums, ecotourism, feed manufacturing, jewelry, pharmaceuticals, etc.).
As the input-output tables here (Table 1 and Table 2) provide little information about such fish-related industries in ROE, it is not possible to evaluate the potential of raising the fish sector’s GVA through an increase in the non-fish sector’s final use. However,

19Aquaculture and/or fisheries direct GVA as a basic yet inadequate measure of its contribution to GDP
the potential could be substantial. For example, because of a strong global demand for gelling agents, the farmgate value of red seaweed aquaculture in Indonesia has increased over five times during the period 2006–2016 (FAO, 2018c).
3.3 GVA as an inadequate measure of a industry/sector’s contribution to GDPIn the economy described in Table 1 and Table 2, the aquaculture industry produces USD 500 million of goods and services. Yet its GVA is only USD 250 million because half of the USD 500 million output reflects the value of intermediate inputs.
Suppose that as commercial feeds become better and cheaper whereas labour becomes more expensive, the aquaculture industry substitutes farm-made feed with commercial feed. Accordingly, it increases its purchase from the aquafeed industry by USD 20 million, reduces its purchase of feed ingredients from ROE by USD 10 million, and cuts its labour cost by USD 10 million. After the change, aquaculture’s output would remain unchanged at USD 500 million, yet its GVA would decline byUSD 10 million to USD 240 million because of the USD 10 million reduction in aquaculture’s “compensation to employees”, and its intermediate input would increase by the USD 10 million because of the combined effect of the USD 20 million increase in the purchase of commercial feed and the USD 10 million decline in the purchase of feed ingredients.
In this situation, the aquaculture GDP is decreased by USD 10 million because some aquafeed production is shifted from the aquaculture industry to the aquafeed industry. Should the decline be interpreted as evidence that shifting from farm-made to commercial feed would tend to reduce the economic performance of aquaculture? The answer tends to be negative because the shift, while causing a decline in the aquaculture GDP, would tend to increase GVA in the commercial feed and other industries.
Suppose that after consolidating numerous small processing plants into a few large plants, the fish processing industry gains enough market power to reduce the prices of raw materials purchased from aquaculture and fishing by 20 percent (i.e. paying only USD 80 million to the original USD 100 million purchase from aquaculture andUSD 160 million for the original USD 200 million purchase from fishing). Assuming other things remain unchanged, fish processing’s GVA would be increased by USD 60 million; aquaculture and fishing’s GVA would be reduced by, respectively, USD 20 million and USD 40 million; and the entire economy’s GDP would remain unchanged. In this situation, should the increase in fish processing’s GVA be interpreted as evidence that the fish processing industry has increased its economic performance because of its increased market power? The answer tends to be negative because the increase in the fish processing GDP is at the cost of declined GDP in other industries, and the overall GDP of the entire economy has remained unchanged.
These two examples indicate that an industry/sector’s GVA, when used alone, could be a misleading indicator for evaluating its economic performance over time. Therefore, while an industry/sector’s GVA is a basic measure of its direct contribution to GDP, it may not adequately capture its overall economic contribution and hence may need to be supplemented with measures of its indirect contribution to GDP.


21
4. Understanding and measuring aquaculture and/or fisheries’ indirect contribution to gross domestic product (GDP)
In a nutshell, an industry/sector’s indirect contribution to GDP is measured by the GVA that it helps generate in other industries. Such indirect contribution is often estimated by an industry/sector’s economic impact on other industries under certain assumptions. Yet it is important to understand it from both the “impact” and “contribution” perspectives. This can be facilitated by decomposing an industry or sector’s output into different components.
4.1 Decomposition of an industry/sector’s output into four componentsAs indicated in Table 2 (column 1), aquaculture’s USD 500 million output is equal to the sum of USD 156 million domestic intermediate input (the sum from row 1 to row 7);USD 94 million imported input (row 8); and USD 250 million GVA (row 9). Similarly, the USD 65 million aquafeed (row 3) used by aquaculture can be decomposed into domestic intermediate input, imported intermediate input and GVA generated in the production of the USD 65 million aquafeed. Going one step further, the value of each of aquafeed’s domestic intermediate inputs (e.g. soybean meal supplied by ROE) can be decomposed into three similar components and so on.
Applying the decomposition method to upstream industries step by step along the aquaculture value chain and consolidating the components, aquaculture’s output can eventually be decomposed into four components:
Output = direct GVA + indirect GVA (through backward linkage) + import content + double counting (1)
The first three are core components, including: (i) USD 250 million direct GVA generated in aquaculture; (ii) USD 111 million indirect GVA generated in aquaculture’s upstream industries and channeled into the aquaculture output through intermediate consumption; and (iii) USD 121 million import content that includes imported inputs that the aquaculture industry uses directly (totalled USD 94 million) and indirectly through intermediate consumption (totalled USD 26 million). The last component is a USD 19 million double-counting element that needs clarification.
Suppose that the aquaculture industry includes a hatchery sub-industry that produces USD 10 million fingerlings sold entirely to domestic fish farmers, and theUSD 10 million fingerling output corresponds to the sub-industry’s USD 3 million domestic input, USD 2 million imported input and USD 5 million GVA.9
In this situation, the USD 10 million fingerling output would be counted twice into the USD 500 million aquaculture output, directly as the hatchery output and, at the same time, indirectly through the output of fish farming that uses the USD 10 million fingerlings as an input. Such a double-counted value is captured in the last component in equation (1).
9 For the purpose of illustration, the example assumes that hatcheries are a sub-industry of aquaculture, whereas in the China Input-Output Table 2007 (NBS, 2009), fish seed production (i.e. hatcheries) is actually included not in the aquaculture industry but in the agricultural services industry.

22 Understanding and measuring the contribution of aquaculture and fisheries to GDP
Generally speaking, the more the intra-industry transactions an industry has, the greater the double-counting component in its output would be. For example, when viewed as a single, aggregate sector where transactions among all industries are intra-sector trade, the entire economy has USD 150 000 million total output (Table 1), which is three times as large as its USD 50 000 million GVA.
Filtering out the double-counted value is necessary to avoid double counting in the first three core components in equation (1). Otherwise, the USD 5 million fingerling GVA would be double counted as aquaculture’s direct GVA and, at the same time, as its indirect GVA through its linkage to itself (or more specifically, its linkages to the hatchery sub-industry), and the USD 2 million imported input would be counted twice in the import content.
Though the decomposition method discussed above is conceptually appealing, it remains difficult to apply empirically. In equation (1), the second component(USD 111 million indirect GVA) and the third component (USD 121 million import content) are actually estimated by a hypothetical extraction model that will be discussed in section 4.2. The first component (USD 250 million direct GVA) is given in Table 2; the last component (USD 19 million double counting) is calculated by subtracting the first three components from the USD 500 million aquaculture output.10
In addition to aquaculture, the decomposition method can be applied to the other six industries in Table 2. The results (Table 4 and Figure 5) indicate that:• The shareof total direct and indirectGVA inoutput varies from33percent (for
ROE) to 92 percent (for fishing). The low share for ROE (33 percent) is primarily attributable to the output of the aggregate sector having a large double-counting component.
• Anindustry/sector’sindirectGVAcanbegreaterthanitsdirectGVA.Thisisthecasefor aquafeed, fishing boat and fish processing, which use relatively more intermediate inputs.
• Theshareofimportcontentinoutputvariesfrom6percent(forfishing)to24percent(for aquaculture). The high import content of the aquaculture output is primarily because of its use of a large amount of imported aquafeed.
• The double-counting component in an industry/sector’s output reflects mostlyits intermediate input from itself. Indeed, the USD 17 million double-counting component in fishing boat’s output is exactly equal to its intermediate input from itself (Table 2: row 4, column 4) because of its lack of inter-industrial linkages.
• The share of double counting in output varies from 2 percent (for fishing) to 60 percent (for ROE). ROE has a large double-counting component in its output
because it is a sector that includes a large number of industries, and transactions among these industries are ROE’s intermediate input from itself.
10 The numbers may not add up exactly because of rounding.

23Understanding and measuring aquaculture and/or fisheries’ indirect contribution to GDP
TAB
LE 4
D
eco
mp
osi
tio
n o
f an
ind
ust
ry/s
ecto
r’s
ou
tpu
t
Co
mp
on
ents
Aq
uac
ult
ure
Fish
ing
Aq
uaf
eed
Fish
ing
bo
atFi
sh p
roce
ssin
gFi
sh m
arke
tin
gR
est
of
the
eco
no
my
Mill
ion
U
SDSh
are
in
ou
tpu
t
(%)
Mill
ion
U
SDSh
are
in
ou
tpu
t
(%)
Mill
ion
U
SDSh
are
in
ou
tpu
t
(%)
Mill
ion
U
SDSh
are
in
ou
tpu
t
(%)
Mill
ion
U
SDSh
are
in
ou
tpu
t
(%)
Mill
ion
U
SDSh
are
in
ou
tpu
t
(%)
Mill
ion
U
SDSh
are
in
ou
tpu
t
(%)
Ou
tpu
t50
010
040
0 1
0024
010
015
010
070
010
060
010
014
7 41
010
0
Tota
l dir
ect
and
in
dir
ect
gro
ss v
alu
e ad
ded
(G
VA
)36
172
369
92
179
7510
973
507
7251
686
48 9
9933
Dir
ect
GV
A25
050
300
75
6025
50
3317
024
360
6048
810
33
Ind
irec
t G
VA
11
122
6917
119
5059
4033
748
156
2618
90.
1
Imp
ort
co
nte
nt
121
2425
654
2224
1612
418
549
10 1
667
Dir
ect
imp
ort
9419
113
3113
118
6910
224
10 1
147
Ind
irec
t im
po
rt
265
144
2310
128
558
325
520.
04
Do
ub
le c
ou
nti
ng
19
47
27
317
1169
1030
588
245
60

24 Understanding and measuring the contribution of aquaculture and fisheries to GDP
FIGURE 5Decomposition of an industry/sector’s output

25Understanding and measuring aquaculture and/or fisheries’ indirect contribution to GDP
4.2 Aquaculture and/or fishing’s indirect contribution to GDP through backward linkageAn industry/sector’s indirect GVA in Table 4 is GVA generated in upstream industries and channelled into the industry/sector’s output through direct or indirect intermediate inputs. Such indirect GVA can be used to measure an industry/sector’s indirect contribution to GDP through backward linkage.11
An industry/sector’s indirect contribution to GDP through backward linkage can be estimated by a hypothetical extraction model based on the Leontief input-output framework (Miller and Blair, 2009). The model estimates how the removal of an industry/sector would, under certain assumptions, affect the entire economy through backward linkage.
For example, under the assumptions in the model, the removal of aquaculture would cause a decline in the aquafeed production because of the loss of aquaculture’s purchase of aquafeed; the decline in the aquafeed production would in turn reduce soymeal production; the reduction in the soymeal production would further reduce the soybean production; and so on and so forth. The hypothetical extraction model can estimate the total impact of the removal of aquaculture on the output of the economy; then the economy-wide impact on GVA can be estimated accordingly.
The mathematical details of the model set-up (including the underlying assumptions) and the estimation method are discussed in Appendix II. More examples of hypothetical extraction models or similar models (e.g. mixed exogenous/endogenous models or output-driven models) can be found in Leung and Pooley (2002), Cai and Leung (2004), Cai et al. (2005), Fernandez-Macho, Gallastegui and Gonzalez (2008), Seung and Waters (2009), and Morrissey and O’Donoghue (2013).
Aquaculture’s indirect contribution to GDPGiven the three underlying assumptions specified in Appendix II, the removal of the aquaculture industry (i.e. ∆xaq = -500) would result in the loss of its ownUSD 250 million GVA as well as USD 111 million GVA in other industries through its backward linkage to upstream industries. The USD 111 million indirect backward-linkage impact includes primarily the USD 76.29 million in ROE, USD 16.56 million in aquafeed, and USD 10.82 million in fishing (Table 5).
From the accounting perspective (Table 4), aquaculture’s USD 250 million direct GVA and its USD 111 million indirect GVA are two core components of aquaculture’s USD 500 million output. The former represents GVA generated in aquaculture, whereas the latter is GVA generated in aquaculture’s upstream industries and channeled into aquaculture output. The two components account for 72 percent of its USD 500 million output – the remaining 28 percent is accounted for primarily by the import content together with a small amount of double counting through aquaculture’s intra-industry transactions (Table 4).
From the impact perspective (Table 5), aquaculture directly contributesUSD 250 million to GDP through its direct GVA, and it indirectly contributesUSD 111 million to GDP through its potential backward-linkage impact on the other six industries, i.e. the removal of aquaculture could cause a USD 111 million loss in the GVA of the other six industries.
In a slightly different, ex ante version, one may say that aquaculture indirectly contributes USD 111 million to GDP in the sense that without aquaculture’s USD 500 million output, the USD 111 million GVA in the six other industries may not have been generated.
11 An industry/sector’s backward linkage represents its relationship with upstream industries along the value chain, whereas its forward linkage represents its relationship with downstream industries. The indirect GVA in Table 4 is indirect contribution through backward linkage because it represents GVA generated in an industry/sector’s upstream industries that sell intermediate products to the industry/sector directly or indirectly along the value chain (see Cai and Leung, 2004, for more discussion on measures of inter-industry linkage).

26 Understanding and measuring the contribution of aquaculture and fisheries to GDP
It is important to note that the USD 111 million impact (whether interpreted as an ex post or ex ante impact) is a potential impact based on the three underlying assumptions specified in Appendix II; thus, the impact may not come true when the assumptions are unrealistic.
For example, in Table 5 the removal of aquaculture (i.e. ∆xaq = -500) would potentially cause a USD 16.56 million loss of GVA in the aquafeed industry because it is assumed that the aquafeed output sold to aquaculture would be lost after the disappearance of the aquaculture industry (assumption ii in Appendix II). However, as the aquafeed industry may be able to divert the aquafeed unwanted by domestic aquaculture to foreign markets, the GVA loss in aquafeed could be less than USD 16.56 million.
TABLE 5 Direct and indirect contribution of aquaculture and/or fishing to GDP (million USD)
Row no. Impacts on GVA in:
Removal of aquaculture, fishing or both
Aquaculture ∆xaq = -500
Fishing ∆xfi = -400
Aquaculture and fishing (∆xaq = -500 and ∆xfi = -400)
1 Aquaculture -250.00 -1.13 -250.00
2 Fishing -10.82 -300.00 -300.00
3 Manufacture of aquafeed -16.56 -0.07 -16.56
4 Building of fishing boats - - -
5 Fish processing -3.69 -0.06 -3.73
6 Fish marketing -3.25 -1.31 -4.50
7 Rest of the economy (ROE) -76.29 -65.98 -139.57
8 Total direct and indirect contribution (equal to the absolute value of the sum of rows 1–7)
361 369 714
9 Direct contribution 250 300 550
10 Indirect contribution 111 69 164
Note: “-” represents zero.
Fishing’s indirect contribution to GDPSimilarly, under the assumptions specified in Appendix II, the removal of the fishing industry (i.e. ∆xfi = -400) would result in the loss of its own USD 300 million GVA as well as USD 69 million GVA in other industries through its backward linkage to upstream industries. The indirect backward-linkage impact includes mostly theUSD 65.98 million in ROE (Table 5: the penultimate column).
Therefore, the total direct and indirect contribution of fishing to GDP isUSD 369 million, including USD 300 million direct GVA generated in the fishing industry and USD 69 million indirect GVA generated in fishing’s upstream industries and channelled to the fishing industry through direct and indirect intermediate inputs.
Fishing’s total contribution to GDP is nearly the same as that of aquaculture. Yet its direct contribution to GDP (USD 300 million) is much greater than aquaculture, whereas its indirect contribution (USD 69 million) is much smaller. This reflects that fishing uses considerably less intermediate inputs than aquaculture (Table 2).

27Understanding and measuring aquaculture and/or fisheries’ indirect contribution to GDP
Aquaculture and fishing’s indirect contribution to GDPThe total direct and indirect contribution of aquaculture and fishing as a whole can be measured by the linkage impact of the removal of aquaculture and fishing altogether (i.e. ∆xaq = -500 and ∆xfi = -400). The results (Table 5: the last column) indicate that under the assumptions specified in Appendix II, the removal of aquaculture and fishing altogether would result in the loss of USD 550 million direct GVA in the sector(USD 250 million and USD 300 million for aquaculture and fishing, respectively) and the loss of USD 164 million indirect GVA in the other four industries on the fish value chain and ROE.
Therefore, aquaculture and fishing’s total contribution to GDP is USD 714 million, including USD 550 million direct GVA generated in aquaculture and fishing and USD 164 million indirect GVA generated in aquaculture and fishing’s upstream industries and channelled to the sector through direct and indirect intermediate inputs.
The USD 714 million aquaculture and fishing’s total contribution to GDP is slightly less than the sum of the two industries’ individual direct and indirect contribution(USD 730 million) – the difference is due to the indirect contribution (Table 5: row 10). This example indicates that it is inappropriate to use the sum of individual industries’ indirect contributions as a measure of their overall indirect contribution because of double counting; instead, the proper way is to estimate the indirect impact of the removal of these industries altogether (see the estimation details at the beginning of Appendix III).
4.3 Aquaculture and fishing’s indirect contribution to GDP through its forward linkage to fish processingIn Table 5, the removal of aquaculture and fishing altogether would result in aUSD 3.73 million (or 2.2 percent) loss of fish processing’s USD 170 million GVA(Table 2: row 9, column 5). This is a small backward-linkage impact caused primarily by the loss of fish processing’s sales to the shrinking aquafeed industry after the removal of aquaculture. It indicates that aquaculture and fishing’s USD 500 million output contains USD 3.73 million GVA generated in fish processing and channeled to aquaculture and fishing primarily through aquaculture’s purchase from aquafeed, which uses fish processing’s products (e.g. processing wastes) as a feed ingredient.
Aquaculture and fishing products are a major input to fish processing; as indicated in Table 1 (column 5), the USD 300 million aquaculture and fishing products account for more than half of fish processing’s USD 530 million total intermediate input. Therefore, the removal of the aquaculture and fishing industry would tend to significantly affect the business of fish processing through forward linkage. This tends to be the case for most countries, except for those few with substantial, established businesses for processing imported fish (e.g. Thailand).
However, the model in Appendix II is unable to capture the potential forward linkage impact of aquaculture and fishing on fish processing, because assumption iii of the model stipulates that, after the removal of aquaculture and fishing, their sales to other industries can be completely replaced by import.
As indicated in Table 2 (column 5), fish processing purchases USD 258 million from domestic aquaculture and fishing, which is 86 percent of its USD 300 million purchase of domestic and imported aquaculture and fishing products. In order to capture aquaculture and fishing’s potential forward-linkage impact processing, we can assume that the removal of the two industries would lead to an 86 percent decline in the fish processing business.
In this situation, the indirect contribution of aquaculture and fishing to GDP can be measured by the backward linkage impact of:

28 Understanding and measuring the contribution of aquaculture and fisheries to GDP
(i) complete disappearance of the USD 500 million aquaculture output (∆xaq = -500);
(ii) complete disappearance of the USD 400 million fishing output (∆xfi = -400); (iii) USD 602 million (86 percent) decline in the USD 700 million fish processing
output (∆xprocessing = -602).
The estimation details are discussed in Appendix III. The results indicate that when their potential forward linkage impact on fish processing is accounted for, the indirect contribution of aquaculture and fishing to GDP becomes USD 404 million (Table 6: column 2). This is USD 240 million higher than the USD 164 million indirect contribution to GDP when only aquaculture and fishing’s backward linkage impact is accounted for (Table 6: column 1). Fish processing’s GVA accounts for most of the USD 240 million difference, and the rest mostly reflects GVA generated in ROE and channelled into the output of fish processing through fish processing’s USD 108 million purchase from ROE (Table 2).
TABLE 6Direct and indirect contribution of aquaculture and fishing to GDP (million USD) with missing linkages accounted for
Row no.
Column no. 1 2 3 4
Impacts on GVA in:
∆xaq = -500∆xfi = -400
∆xaq = -500∆xfi = -400
∆xprocessing = -602
∆xaq = -500∆xfi = -400
∆xprocessing = -602∆fmarketing = -423
∆xaq = -500∆xfi = -400
∆xprocessing = -602∆fmarketing = -423
∆fboat = -93
1 Aquaculture -250 -250 -250 -250
2 Fishing -300 -300 -300 -300
3 Manufacture of aquafeed -17 -17 -17 -17
4 Building of fishing boats - - - -35
5 Fish processing -4 -146 -146 -146
6 Fish marketing -4 -20 -288 -288
7 Rest of the economy -140 -221 -336 -377
8Direct contribution (absolute value of the sum of rows 1 and 2)
550 550 550 550
9Indirect contribution (absolute value of the sum of rows 3 to 7)
164 404 787 863
10Total direct and indirect contributions (sum of row 8 and row 9)
714 954 1 337 1 413
4.4 Aquaculture and fishing’s indirect contribution through fish marketing Under the three assumptions specified in Appendix II, the removal of aquaculture and fishing (together with the resulting 86 percent decline in fish processing) would cause a USD 20 million decline in fish marketing’s GVA (Table 6: column 2).
This backward linkage impact, which is only 6.4 percent of fish marketing’s USD 360 million GVA (Table 2: row 9, column 6), reflects GVA generated in fish marketing activities that supply fish products as intermediate inputs (e.g. transporting farmed fish

29Understanding and measuring aquaculture and/or fisheries’ indirect contribution to GDP
harvest to processing plants or transporting fish processing waste to fishmeal producers). However, GVA generated in fish-marketing activities that supply fish products to
final use is not captured by the estimation results in the first two columns in Table 6 because of the way transport and trade margins are accounted for in the input-output table (Table 1 and Table 2).
Table 2 (column 9) indicates that the three domestic fish-producing industries sell 885 million to final use (USD 234 million from aquaculture, USD 188 million from fishing, and USD 462 from fish processing). These are farmgate or plant-gate values that do not include transport and trade margins charged by transporters, wholesalers or retailers for delivering the products to final use. Such margins are accounted for in the USD 500 million final use of fish marketing (Table 1: row 6, column 12).
The USD 500 million includes transport and trade margins for marketing both domestic and imported fish products. After the removal of aquaculture and fishing and the consequent 86 percent decline in fish processing’s output, aquaculture’s USD 234 million sales to final use would disappear, as would fishing’s USD 188 million. Fish processing’s USD 462 million sales to final use would decline 86 percent (i.e. USD 398 million). Thus, the sum of these three numbers (USD 821 million) represents the decline in the domestic fish products sold to final use because of the removal of aquaculture and fishing.
The underlying assumption in ii, specified in Appendix II (also applicable to the estimations in Appendix III), stipulates that fish marketing’s final use would not be affected by the removal of aquaculture and fishing. This essentially assumes that after the removal of aquaculture and fishing, imported fish products would cover the loss of domestic fish products in the final consumption market; hence, the business of fish marketing servicing the consumer market would not be affected; as mentioned above, fish marketing would lose a little business in distributing intermediate fish products.
Now let us relax assumption ii by assuming that after the removal of aquaculture and fishing, none of the USD 821 million decline in domestic fish products sold to final use would be replaced by import. Since the USD 821 million decline is 85 percent of the USD 970 million fish products for final use,12 it can be assumed that the decline would cause an 85 percent (i.e. USD 423 million) drop in fish marketing’s USD 500 million sales to final use (which represents the transport and trade margins it earns from marketing fish products for final use).
In this situation, the indirect contribution of aquaculture and fishing to GDP can be measured by the backward-linkage impact of:
(i) complete disappearance of the USD 500 million aquaculture output (∆xaq = -500);
(ii) complete disappearance of the USD 400 million fishing output (∆xfi = -400);
(iii) USD 602 million (86 percent) decline in the USD 700 million fish processing output (∆xprocessing = -602);
(iv) USD 423 million decline in fish marketing’s final use (∆fmarketing = -423).
The estimation details are discussed in Appendix IV. The results indicate that when the GVA generated in the distribution of domestic fish products to final use is accounted for, the indirect contribution of aquaculture and fishing to GDP becomes USD 787 million (Table 6: column 3). The amount is USD 382 million more than the USD 404 million indirect contribution in the case where the fish marketing GVA is not accounted for (Table 6: column 2). Most of the USD 382 million difference reflects the GVA directly generated in fish marketing, and the rest is due to the GVA generated in ROE for providing goods and services to fish marketing.
12 According to Table 1 (column 12), aquaculture, fishing and fish processing sell, respectively,USD 240 million, USD 210 million and USD 520 million to final use. The sum of the three is USD 970 million.

30 Understanding and measuring the contribution of aquaculture and fisheries to GDP
4.5 Aquaculture and fishing’s indirect contribution through fishing boat buildingIn each of the first three columns in Table 6, the removal of aquaculture and fishing would have no impact on the GVA of the fishing boat-building industry. This reflects that the fishing boat-building industry has no sales to intermediate consumption(Table 2), which seems puzzling because aquaculture and fishing should be the main users of the fishing vessels built by the fishing boat-building industry.
They are indeed; yet fishing vessels purchased by aquaculture and fishing are not intermediate consumption but investments accounted for in the USD 110 million capital formation in the final use of the fishing boat-building industry (Table 1).
The USD 110 million includes both domestically produced and imported fishing vessels. The domestic fishing boat-building industry sells USD 133 million to final use (Table 2: row 4, column 9), which includes USD 40 million export (Table 1: row 4, column 11). The difference between the two numbers (i.e. USD 93 million) measures the value of fish vessels manufactured by the fishing boat-building industry for domestic use.
As aquaculture and fishing are the main users of fishing vessels, GVA generated in the manufacturing of the USD 93 million fish vessels could be counted as their indirect contribution to GDP. In this situation, the indirect contribution of aquaculture and fishing to GDP can be measured by the backward-linkage impact of:
(i) complete disappearance of the USD 500 million aquaculture output (∆xaq = -500);
(ii) complete disappearance of the USD 400 million fishing output (∆xfi = -400);
(iii) USD 602 million (86 percent) decline in the USD 700 million fish processing output (∆xprocessing = -602);
(iv) USD 423 million decline in fish marketing’s final use (∆fmarketing = -423);
(v) USD 93 million decline in fishing boat’s final use (∆ffishing boat = -93).
The estimation details are briefly discussed in Appendix V. The results indicate that when their linkage to the fishing boat-building industry is accounted for, aquaculture and fishing’s indirect contribution to GDP increases slightly from USD 787 million (Table 6: column 3) to USD 863 million (Table 6: column 4).
The USD 76 million difference reflects GVA generated in activities for building the USD 93 million fishing vessels, which primarily include USD 35 million GVA in the fishing boat-building industry and USD 41 million GVA in ROE; the 41 million is equal to USD 377 million (Table 6: row 7, column 4) minus USD 336 million(Table 6: row 7, column 3).

31
5. A satellite account approach to measuring the contribution of aquaculture and fisheries to gross domestic product (GDP)
Input-output models are a highly useful tool for evaluating GDP contribution at the industrial or sectoral level and should become an essential component of the apparatus for sector assessment and monitoring in the long run. However, input-output tables are not readily available for many countries. When available, a country’s input-output tables may nevertheless not include a distinct aquaculture and fisheries sector – oftentimes aquaculture and fisheries are implicitly included under the “agriculture, forestry, hunting and fishing” sector.
In this situation, the contribution of aquaculture and fisheries to GDP can be measured by the GVA of an “extended aquaculture and fisheries sector” that is composed of key industries on the fish value chain. Such a satellite account approach has been used to measure the value of African fisheries (de Graaf and Garibaldi, 2014), where the extended aquaculture and fisheries sector includes aquaculture, fishing and fish processing. The approach has also been used in the China Fishery Statistics Yearbooks (e.g. CFSY, 2008) to measure the value of the “fish economy” that includes key industries on the fish value chain, such as fishing, hatchery, fish farming, fish processing, aquafeed, fish medicine, machinery (including fishing vessels), construction, fish marketing, and recreational fisheries.
In Table 1, the six industries on the fish value chain (aquaculture, fishing, aquafeed, fishing boat, fish processing and fish marketing) can be deemed an extended aquaculture and fisheries sector, and their total GVA (USD 1 190 million) can be used to measure the contribution of aquaculture and fisheries to GDP.
The USD 1 190 million “satellite account” measure of aquaculture and fisheries’ contribution to GDP is smaller than the USD1 413 million “input-output” measure (Table 6: column 4). A detailed comparison is shown in Figure 6.
5.1 Comparison between the satellite account approach and the input-output approachFigure 6 shows that both the input-output approach and the satellite account approach include GVA generated in industries other than aquaculture and fishing. However, the interpretation of such GVA is different.
Under the input-output approach, the aquaculture and fisheries sector is narrowly defined as composed of only the aquaculture industry and the fishing industry. Thus, GVA generated in the two industries is treated as the sector’s direct contribution to GDP, while GVA generated in other industries and linked to the two industries through various inter-industry linkages (discussed in section 4) is its indirect contribution.
Under the satellite account approach, the extended aquaculture and fisheries sector is broadly defined as composed of the six key industries on the fish value chain. In this situation, the concept of “indirect” contribution” is irrelevant; GVA generated in each of the six industries belongs to the GVA of the extended aquaculture and fisheries sector and hence is part of the sector’s “direct” contribution.
This is not merely a semantic discrepancy. As indicated in Figure 6, under the satellite account approach, the entire aquafeed’s USD 60 million GVA is part of the extended

32 Understanding and measuring the contribution of aquaculture and fisheries to GDP
aquaculture and fisheries sector’s USD 1 190 million contribution to GDP because aquafeed is part of the extended sector. Under the input-output approach, aquaculture and fisheries’ USD 1 413 million total direct and indirect contribution includes only USD 17 million aquafeed’s GVA (as part of its indirect contribution) because most of the aquafeed output is exported and hence does not contribute to the domestic aquaculture and fisheries production.
Similarly, under the input-output approach, aquaculture and fisheries’ indirect contribution to GDP includes: (i) only USD 35 million of fishing boat’s USD 50 million GVA because part of the fishing boat-building industry’s output is exported; (ii) only USD 146 million of fish processing’s USD 170 million GVA because a small portion of fish processing’s output derives from the processing of imported fish materials; and (iii) only USD 288 million of fish marketing’s USD 360 million GVA because some fishing marketing activities are intended for distribution of imported fish products. Building fishing vessels for export, processing imported fish, or marketing imported fish products are not linked to the aquaculture and fisheries sector composed of the aquaculture industry and the fishing industry; hence, GVA generated in these activities is not counted as the sector’s indirect contribution to GDP.
The greatest difference between the two approaches is due to ROE. Under the input-output approach, USD 377 million ROE’s GVA is counted in aquaculture and fisheries’ indirect contribution to GDP because the amount represents GVA generated in ROE activities that are linked to domestic aquaculture and fishing. Under the satellite account approach, ROE is not included in the extended aquaculture and fisheries sector; hence, GVA generated in ROE is not counted in the extended sector’s contribution to GDP.
In this document, industries other than the six industries on the fish value chain are aggregated into ROE for simplicity. The aggregate ROE certainly cannot be included in the extended aquaculture and fisheries sector, yet some industries or sub-industries (aquaculture services, seafood restaurants and catering, aquariums, etc.) in ROE could
FIGURE 6Components of aquaculture and fisheries’ contribution to GDP:
input-output approach versus satellite account approach

33A satellite account approach to measuring the contribution of aquaculture and fisheries to GDP
be included in the extended aquaculture and fisheries sector. The question is how to determine the scope of the extended aquaculture and fisheries sector.
5.2 Determining the scope of an extended aquaculture and fisheries sectorUnder the satellite account approach, the magnitude of aquaculture and fisheries’ contribution to GDP depends on the scope of the extended aquaculture and fisheries sector. The more industries are included, the greater is the contribution. But the problem is how to determine which industries should be included in the extended aquaculture and fisheries sector. A general principle is to include industries that are closely linked to the aquaculture and fishing industries. Some general guidelines are discussed in the following.
Upstream industries to be included in the extended aquaculture and fisheries sectorChecking upstream along the fish value chain, an industry with a large portion of its revenue earned from aquaculture and fisheries could be included in the extended aquaculture and fisheries sector; Sigfusson, Arnason and Morrissey (2013) use this rule to determine the scope of a fisheries cluster in the Icelandic economy.
As indicated in Table 2, aquafeed sells USD 65 million of its USD 240 million output to aquaculture, which means that aquafeed earns 27 percent of its revenue from the domestic aquaculture industry. If the USD 170 million aquafeed export (which are used by fish farmers in foreign countries) is taken into account, almost all of the entire revenue of aquafeed derives from (domestic and foreign) aquaculture.13 Therefore, aquafeed should be included in the extended aquaculture and fisheries sector.
Similarly, the fishing boat-building industry should be included in the extended aquaculture and fisheries sector, even though aquaculture and fishing’s purchases from fishing boat are not accounted for explicitly in Table 1 or Table 2 (see the discussion in section 4.5).
Some further upstream industries that do not sell directly to aquaculture or fishing may deserve to be included in the extended aquaculture and fisheries sector when a large portion of their revenues depends on industries that have strong links to aquaculture and/or fishing (fishmeal manufacturing, fishing gear manufacturing, etc.).
Downstream industries to be included in the extended aquaculture and fisheries sectorChecking downstream along the fish value chain, an industry with a large portion of its intermediate input coming from aquaculture and fishing could be included in the extended aquaculture and fisheries sector. As indicated in Table 2, fish processing’s total USD 258 million purchase from domestic aquaculture and fishing accounts for 37 percent of its total input. Considering that raw fish materials from aquaculture and fishing are essential inputs for fish processing, and the domestic supply of these materials cannot be sufficiently substituted for by import (at least not in the short term), the fish processing industry should be included in the extended aquaculture and fisheries sector.
For the same rationale, fish marketing should also be included in the extended aquaculture and fisheries sector. Conceptually, fish marketing can be considered a downstream industry that purchases fish produce from aquaculture, fishing and fish processing and distributes them to final users, even though this is usually not how the fish marketing business is accounted for in an input-output table (see section 4.4for more discussion on how the output of fish marketing is defined in Table 1 and Table 2).
In principle, further downstream industries that do not buy directly from aquaculture or fishing may deserve to be included in the extended aquaculture and fisheries sector
13 In Table 1, the USD 200 million aquafeed export (row 3, column 11) is composed of USD 170 million aquafeed production in the current period and USD 30 million aquafeed inventory (row 3, column 10).

34 Understanding and measuring the contribution of aquaculture and fisheries to GDP
when the supply of a crucial input to their businesses depends on industries that have strong links to aquaculture and/or fishing.
Identifying industries to be included in the extended aquaculture and fisheries sectorThe hypothetical exaction model and the estimation methods based on it (which are presented in Appendix II to V) can help discern complex inter-industry linkages in order to identify industries for inclusion in the extended aquaculture and fisheries.
Following the step-by-step estimations discussed in section 4, the hypothetical extraction model can capture the impacts of aquaculture and fishing on other industries through: (i) their backward linkages to upstream industries (section 4.2); (ii) their forward linkages to fish processing (section 4.3); (iii) their linkage to fish marketing (section 4.4); and (iv) their linkage to fishing boat (section 4.5). The final, total impacts (Table 6: column 4) can be used to determine which industries to be included in the extended aquaculture and fisheries sector based on a selected threshold.
As indicated in Table 6 (column 4), aquaculture and fishing has impacts on:(i) 28 percent of aquafeed manufacturing business;14 (ii) 70 percent of fishingboat-building business;15 (iii) 86 percent of fish-processing business;16 (iv) 80 percent of fish-marketing business;17 and (v) 0.8 percent of the ROE business.18
Under the criterion that an industry with over two-thirds of its business affected by aquaculture and fishing should be included in the extended aquaculture and fisheries sector, three industries (fishing boat, fish processing and fish marketing) would be included, whereas aquafeed and ROE would not. However, as nearly all of aquafeed’s output is sold to fish-farming business (domestic or foreign), the industry should be included in the extended aquaculture and fisheries sector even though the majority of its business is for foreign markets and less than 30 percent for the domestic market. When ROE is disaggregated, the estimation process discussed above may be able to identify more industries to be included in the extended aquaculture and fisheries sector under the “two-thirds” threshold.
14 The 28 percent is equal to the USD 17 million impact on aquafeed’s GVA divided by its total USD 60 million GVA.15 The 70 percent is equal to the USD 35 million impact on fishing boat’s GVA divided by its total USD 50 million GVA.16 The 86 percent is equal to the USD 146 million impact on fish processing’s GVA divided by its total USD 170 million GVA. 17 The 80 percent is equal to the USD 288 million impact on fish marketing’s GVA divided by its total USD 360 million GVA.18 The 0.8 percent is equal to the USD 377 million impact on ROE’s GVA divided by its USD 48 810 million GVA.

35
6. Empirical methodology and good practices in estimating and utilizing gross domestic product (GDP) measures
The previous sections discuss conceptual issues and estimation methods related to the measurement of the contribution of aquaculture and fisheries to GDP under the input-output framework and the satellite account approach. A set of indicators of aquaculture and/or fisheries’ contribution to GDP at different levels have been estimated based on the numerical input-output model (Table 1 and Table 2); the results are summarized in Table 7 and illustrated in Figure 7.
This section first discusses the empirical methodology of using input-output models to measure aquaculture and fisheries’ contribution to GDP as well as alternative, practical methods in data-poor environments where suitable input-output models are not available. Next, good practices in reporting the measures of aquaculture and fisheries’ contribution to GDP are discussed. Finally, the section explores how the measures could be and should be properly used for evidence-based policy and planning.
FIGURE 7Aquaculture and fisheries’ direct and indirect contribution to GDP (%)
Note: Based on the results in Table 7 (column 6, rows 13–24).

36 Understanding and measuring the contribution of aquaculture and fisheries to GDP
TABLE 7 Contribution of aquaculture and fisheries to GDP: the case of the two-industry sector
Row No.
Column No. 1 2 3 4 5 6 7
Industry
Aq
uac
ult
ure
+
bac
kwar
d li
nka
ge
Fish
ing
+
bac
kwar
d li
nka
ge
Two-industry sector: “aquaculture + fishing”
Exte
nd
ed a
qu
acu
ltu
re
and
fish
erie
s se
cto
r
Bas
ic (a
quac
ultu
re
+ fi
shin
g +
bac
kwar
d
linka
ge)
Bas
ic +
lin
kag
e
to fi
sh p
roce
ssin
g
Bas
ic +
lin
kag
e to
fish
p
roce
ssin
g +
lin
kag
e to
fish
mar
keti
ng
Bas
ic +
lin
kag
e to
fish
p
roce
ssin
g +
lin
kag
e
to fi
sh m
arke
tin
g +
lin
kag
e to
fish
ing
bo
at
Value (million USD)
1 Direct GVA 250 300 550 550 550 550
2 Aquaculture 250.00 250.00 250.00 250.00 250.00
3 Fishing 300.00 300.00 300.00 300.00 300.00
4 Indirect GVA 111 69 164 404 787 863
5 Aquaculture 1.13 250
6 Fishing 10.82 300
7 Aquafeed 16.56 0.07 16.56 16.56 16.56 16.56 60
8 Fishing boat - - - - - 34.97 50
9 Fish processing 3.69 0.06 3.73 146.29 146.29 146.29 170
10 Fish marketing 3.25 1.31 4.50 20.42 287.63 287.65 360
11 Rest of the economy 76.29 65.98 139.57 220.85 336.10 377.48
12 Total (direct and indirect) GVA 361 369 714 954 1 337 1 413 1 190
Percentage of GDP (%)
13 Direct contribution 0.50 0.60 1.10 1.10 1.10 1.10
14 Aquaculture 0.50 0.50 0.50 0.50 0.50
15 Fishing 0.60 0.60 0.60 0.60 0.60
16 Indirect contribution 0.22 0.14 0.33 0.81 1.57 1.73
17 Aquaculture 0.00 0.50
18 Fishing 0.02 0.60
19 Aquafeed 0.03 0.00 0.03 0.03 0.03 0.03 0.12
20 Fishing boat - - - - - 0.07 0.10
21 Fish processing 0.01 0.00 0.01 0.29 0.29 0.29 0.34
22 Fish marketing 0.01 0.00 0.01 0.04 0.58 0.58 0.72
23 Rest of the economy 0.15 0.13 0.28 0.44 0.67 0.75
24 Total (direct and indirect) contribution 0.72 0.74 1.43 1.91 2.67 2.83 2.38
GVA ratio (equal to GVA divided by output)
25 Output (million USD) 500 400 900
26 Total direct and indirect GVA ratio 0.72 0.92 0.79
27 Direct GVA ratio 0.50 0.75 0.61
28 Indirect GVA ratio 0.22 0.17 0.18
GVA multiplier (equal to indirect GVA divided by direct GVA)
29 GVA multiplier 0.44 0.23 0.30 0.73 1.43 1.57
Notes: “-” represents zero. From rows 1 to 12, the results in columns 1, 2 and 3 from Table 5; the results in columns 4, 5 and 6 from Table 6; and the results in column 7 corresponding to Figure 6. The results from rows 13 to 28 are calculated based on those from rows 1 to 12. Row 29 is calculated from row 4 divided by row 1.

37Empirical methodology and good practices in estimating and utilizing GDP measures
6.1 Empirical methodology and good practices in measuring aquaculture and fisheries’ contribution to GDP
Define the scope of the aquaculture and fisheries sectorWhen measuring aquaculture and fisheries’ contribution to GDP, the very first task is to clearly define the scope of the sector. In the previous sections, aquaculture and fisheries is a two-industry sector (“aquaculture + fishing”). Alternative scopes include a three-industry sector “aquaculture + fishing + fish processing” (e.g. used in de Graaf and Garibaldi, 2014) or a four-industry sector “aquaculture + fishing + fish processing + fish marketing” (e.g. used in Sigfusson, Arnason and Morrissey, 2013).
There are no a priori standards for deciding the most appropriate scope. Not only does the selection of a proper scope tend to be case specific, but it is also dependent upon the economic context and the purpose of the measurement and affected by practical issues such as data availability. Some general guidelines for selecting an appropriate scope are suggested in Box 1.
Discussion in the remainder of this section will be based on the results for the two-industry aquaculture and fisheries sector (Table 7). Yet, GDP indicators for the three-industry sector and the four-industry sector are also estimated; the results are presented in, respectively, Appendix VI (Table A.1) and Appendix VII (Table A.2).
A comparison of the results in Table 7, Table A.1 and Table A.2 reveals that expanding the scope from the two-industry sector to the three-industry sector would slightly increase the measure of aquaculture and fisheries’ total direct and indirect contribution to GDP from 2.83 percent to 2.97 percent (Table 8). Further expanding the scope to the four-industry sector would result in another small increase from the 2.97 percent to 3.11 percent (Table 8). The lack of significant differences in the results based on the different scopes is not surprising because GVA generated in fish processing or fish marketing has been mostly accounted for in the indirect contribution of the two-industry sector that includes only aquaculture and fishing. However, the composition of direct versus indirect contribution significantly differs for the three different scopes (Table 8).
TABLE 8 Aquaculture and fisheries’ contribution to GDP under different scopes
ScopeContribution to GDP (%)
Direct Indirect Total direct and indirect
Two-industry sector(aquaculture + fishing) 1.10 1.73 2.83
Three-industry sector (aquaculture + fishing + fish processing) 1.44 1.53 2.97
Four-industry sector (aquaculture + fishing + fish processing + fish marketing) 2.16 0.95 3.11
Note: The results from direct, indirect, and total direct and indirect contribution are from Table 7 (column 6), Table A.1 (column 6) and Table A.2 (column 6), respectively.
BOX 1 General guidelines for determining the scope of an aquaculture and fisheries sector
For measuring the contribution of domestic primary fish production to GDP, the scope should be the two-industry sector “aquaculture + fishing”. This is the scope adopted in this document.
For measuring the contribution of domestic fish production (including primary production and value addition) to GDP, the scope should be the three-industry sector “aquaculture + fishing + fish processing”.
For measuring the contribution of domestic fish production and marketing, the scope should be the four-industry sector “aquaculture + fishing + fish processing + fish marketing”.

38 Understanding and measuring the contribution of aquaculture and fisheries to GDP
Input-output approachWhen input-output tables are available and suitable (i.e. aquaculture and fisheries presented as a distinct sector or, better yet, two distinct subsectors), the measurement of aquaculture and fisheries’ contribution to GDP could be conducted in the following steps.
GVA-FU matrixThe first step is to construct a GVA-FU matrix to facilitate an in-depth understanding of GDP contribution at the industrial level from both the demand and the supply perspectives; see section 3.2 for more discussion.
The GVA-FU matrix in Table 3 is based on the seven-industry input-output table (Table 1 and Table 2), where most industries (other than the six industries on the fish value chain) are aggregated into the ROE sector. In practice, the construction of a GVA-FU matrix should be based on the most detailed input-output tables available so that the issue of spurious linkages mentioned in section 3.2 can be mitigated.
The results in the detailed GVA-FU matrix can be aggregated for analytic or narrative convenience. For example, when the scope of aquaculture and fisheries includes aquaculture, fishing, fish processing and fish marketing, the results for the four industries in the GVA-FU matrix can be aggregated into that for the four-industry aquaculture and fisheries sector (Figure 4).
Output decomposition tableThe second step is to decompose the output of each industry/sector in the input-output table into the four components in equation (1) and compile an output decomposition table similar to Table 4; see section 4.1 for more discussion.
The output decomposition table not only provides information on each industry/sector’s direct GVA and its indirect GVA through backward linkage, but it also reveals the import content and double counting in the industry/sector’s output.
The estimation method for the output decomposition is discussed in Appendix II. Contrary to the GVA-FU matrix, it is not appropriate to sum up the output decomposition of individual industries into the decomposition of an aggregate sector. As discussed in section 4.2, the sum of the indirect GVA of individual industries in a sector would tend to overestimate the sector’s indirect GVA because of double counting.
When decomposing the output of a sector that contains multiple industries, the proper practice is to treat the industries in the sector as a whole and apply the estimation method in Appendix II accordingly; see Table 5 for an example.
Estimation of a set of GDP measures at different levelsThe third step is to use the methods discussed in Appendix II–V to estimate a set of indicators for measuring the contribution of aquaculture and fisheries to GDP at different levels. The results can be summarized in a table similar to Table 7.
Table 7 includes the following GDP indicators:(i) direct GVA;
(ii) indirect GVA through backward linkage;
(iii) indirect GVA through backward linkage + forward linkage to fish processing;
(iv) indirect GVA through backward linkage + forward linkage to fish processing + linkage to fish marketing;
(v) indirect GVA through backward linkage + forward linkage to fish processing + linkage to fish marketing + linkage to fishing boat building;
(vi) total direct and indirect GVA at different levels.

39
The first two indicators (i.e. direct GVA and indirect GVA through backward linkage) are two basic measures that belong to the four components of an industry/sector’s output (the other two being the import content and double counting); see section 4.1 for more discussion.
The two basic measures should be quantified for the aquaculture and fisheries sector as a whole (e.g. column 3 in Table 7) and for individual industries or subsectors within the sector (e.g. columns 1 and 2 in Table 7).
An industry/sector’s direct GVA can be found in an input-output table or national accounts, whereas its indirect GVA through backward linkage can be estimated by the method discussed in Appendix II. Notably, the estimation method can be applied to input-output models with any number of industries, and it is a standard method that entails no additional assumptions except for the three basic assumptions specified in Appendix II.
Indicator iii expands indicator ii (i.e. indirect GVA through backward linkage) to account for aquaculture and fishing’s forward linkage to fish processing; see section 4.3 for more discussion. The expansion increases the measure of aquaculture and fishing’s indirect contribution to GDP significantly (more than double), from 0.33 percent to 0.81 percent of GDP (Table 7: row 16, column 3 versus column 4).
The estimation method for indicator iii is presented in Appendix III. Besides the three basic assumptions in Appendix II, the method entails an additional assumption regarding how aquaculture and fishing would affect fish processing. With a more detailed input-output model, the method may be applied to aquaculture and fishing’s other forward linkages to industries or sub-industries in ROE (e.g. seafood restaurants and catering).
It is important to note that the estimation method in Appendix III should only be applied to aquaculture and fisheries’ significant forward linkages to downstream industries. The aquaculture and fisheries sector is deemed to have a significant forward linkage to an industry when the product it sells to the industry is a substantial input for the industry that is difficult to substitute.
Indicator iv expands indicator iii to account for aquaculture and fishing’s linkage to fish marketing. The expansion nearly doubles the measure of aquaculture and fishing’s indirect contribution to GDP, from 0.81 percent to 1.57 percent (Table 7: row 16, column 4 versus column 5).
The estimation method for indicator iv is discussed in Appendix IV. The method entails an additional assumption about how aquaculture and fishing would affect fish marketing. Although fish processing and fish marketing are both downstream industries for aquaculture and fishing, the estimation methods for indicator iii and indicator iv are slightly different. For indicator iii, aquaculture and fishing’s forward linkage to fish processing is captured by the sector’s potential impact on fish processing’s output (Appendix III), whereas the forward linkage to fish marketing is captured by the sector’s potential impact on the final use of fish marketing (Appendix IV). The difference is due to the way transport and trade margins are accounted for in input-output tables; see section 4.4 for more discussion.
Indicator v expands indicator iv to account for aquaculture and fishing’s linkage to the fishing boat-building industry. The expansion slightly increases the measure of aquaculture and fishing’s indirect contribution to GDP from 1.57 percent to 1.73 percent(Table 7: row 16, column 5 versus column 6).
The estimation method for indicator v is discussed in Appendix V. The method entails an additional assumption about how aquaculture and fishing would affect the fishing boat-building industry. The method can be applied to other industries or sub-industries that produce capital goods and sell most of their products to the aquaculture and fishing sector.
Empirical methodology and good practices in estimating and utilizing GDP measures

40 Understanding and measuring the contribution of aquaculture and fisheries to GDP
Percentage of GDPRows 13 to 24 in Table 7 report measures of aquaculture and fisheries’ contribution to GDP in terms of percentage. These measures are calculated by the measures in rows 1 to 12 divided by the economy’s GDP.
An industry/sector’s GVA and its percentage of GDP are two related yet different measures of its contribution to GDP. The former measures the industry/sector’s absolute contribution to GDP in terms of monetary value, whereas the latter measures its relative contribution in terms of percentage. An industry/sector may have an increased GVA yet declined percentage of GDP or vice versa. More discussion in this regard can be found in the last subsection under section 6.2.
GVA ratioRows 25 to 28 in Table 7 report GVA ratios that measure the share of direct and/or indirect GVA in output. As opposed to an industry/sector’s direct and/or indirect GVA measuring the potential impacts of the removal of the industry/sector, its direct and/or indirect GVA ratio represents the potential impacts of a unit change in the industry/sector’s output. GVA ratios are often used to estimate GVA based on output – caveats on such practices will be provided in the subsection below on “Caution against using GVA ratios to estimate GDP measures”.
GVA multiplierRow 29 in Table 7 reports GVA multipliers that measure the ratio between indirect GVA and direct GVA (i.e. how much indirect GVA would be generated when one unit of direct GVA is generated). The GVA multipliers in Table 7 are Type I multipliers due to inter-industry linkages, and there could be other GVA multipliers (such as Type II multipliers that capture induced impacts through household income and business profit) (Miller and Blair, 2009). GVA multipliers are often used to estimate indirect GVA – caveats on such practices will be provided in the subsection below on “Caution against using multipliers to estimate indirect GVA”.
Value chain approachMost countries do not have input-output tables that include aquaculture and fisheries as a distinct sector or two distinct subsectors; hence, the input-output approach discussed in the previous subsection cannot be applied. In this situation, a value chain approach (essentially a simplified input-output approach) can be used to trace aquaculture and fishing’s linkages to other industries one by one and measure its indirect GVA accordingly. Though the value chain approach does not require input-output tables, it may entail national account data (or other official data) complemented with survey data; see Sigfusson, Arnason and Morrissey (2013) for an effort along this line.
Unlike the standard input-output approach, the value chain approach would not be able to comprehensively capture all the potential ripple effects of aquaculture and fishing upon other industries on a complex “value web” comprising multiple value chains. However, as the ripple effects tend to diminish rapidly, the value chain approach may be able to capture a majority of indirect GVA when aquaculture and fishing’s linkages to the closest industries on the “value web” are accounted for.
Satellite account approachWhen available, suitable input-output tables are usually not updated frequently enough to allow for annual measurement of aquaculture and fishing’s contribution to GDP. Even tracing only aquaculture and fishing’s linkages to the closest industries under the value chain approach could entail a large amount of survey data that may be difficult to collect annually.

41
The satellite account approach is a simpler, less data demanding method that can generate GDP measures for annual assessment and monitoring; see section 5 for more discussion and the example of China mentioned in the section.
When suitable input-output tables are available yet not updated frequently enough, the satellite account approach can be implemented step by step as described in Box 2; see section 5.2 for more discussion.
Without input-output tables, the value chain approach (discussed in the previous subsection) can be used to identify industries/sectors that are most closely linked to aquaculture and fishing, and the scope of the extended aquaculture and fisheries sector can be determined accordingly.
Another method is to use the scope of the extended aquaculture and fisheries sector in other similar economies as references and make adjustments according to the special characteristics of the own economy.
Caution against accounting for the induced impactIn the input-output literature, an impact through inter-industry linkages is often called a Type I multiplier, whereas an induced impact through final use is called a Type II multiplier (Miller and Blair, 2009). Under the hypothetical extraction model, the rationale behind the induced impact proceeds as follows: the removal of aquaculture and fishing would lead to the loss of direct and indirect GVA that contains wages and business profits. The loss of the wages and business profits would tend to affect the final use through reduced consumer demand and declined business investments. The reduced final use would “induce” further decline in economic activities; GVA loss due to the decline is deemed the induced impact.
The rationale behind the induced impact does lend some legitimacy of counting it in the contribution to GDP; additionally, some efforts in the literature have attempted to account for the induced impact as part of aquaculture and fisheries’ total contribution to GDP (e.g. Sigfusson, Arnason and Morrissey, 2013). Yet, the estimations in this document do not venture in this direction.
Empirical methodology and good practices in estimating and utilizing GDP measures
BOX 2Implementation of the satellite account approach when suitable input-output tables are available
The first step is to use the most recent input-output tables to measure the linkages of aquaculture and fishing to other industries/sectors.
Based on a threshold magnitude of the linkage measures, the industries most closely linked to aquaculture and fishing can be identified to comprise an extended aquaculture and fisheries sector.
The selection of the threshold is case specific, dependent upon the economic context and structure. As a general guideline, the threshold should usually be no less than 50 percent, i.e. aquaculture and fishing should potentially affect at least half of the industry/sector’s business.
Some industries (e.g. aquafeed), while not meeting the threshold, may also need to be included in the extended aquaculture and fisheries sector; see section 5.2 for more discussion.
After the scope of the extended aquaculture and fisheries sector is determined, GVA data from national accounts can be used to calculate the extended sector’s GVA by aggregating the GVA of individual industries included in the extended sector. Then the GVA of the extended sector can be used to measure aquaculture and fisheries’ contribution to GDP annually or in the time frame allowed by the updating frequency of the national accounts.
When the input-output tables are updated, the new tables can be used to check the scope of the extended aquaculture and fisheries sector and make modifications if necessary.

42 Understanding and measuring the contribution of aquaculture and fisheries to GDP
The primary reason for this restraint is that it is not easy to model or estimate the induced impact. Input-output tables (e.g. Table 1 and Table 2) do not provide information about the overall impacts of wages (i.e. compensation to employees) and profits (i.e. net operating surplus) on final consumption and capital formation. After the removal of aquaculture and fishing, workers can sustain their expenditures through savings or borrowings, and companies can sustain their investments via various financing mechanisms. In addition, it is unclear how the overall impact of an industry’s wage and profit spreads across the final consumption of multiple industries. While there have been systematic efforts to model how changes in fisheries production would affect the final demand (e.g. Seung and Waters, 2006), it should be cautioned that simplifying assumptions adopted to estimate the induced impact would tend to take a toll on the accuracy of the measure.
Avoid double countingOutput NOT an appropriate measure of an industry/sector’s contribution to GDPDespite the issue of double counting (Groenewold, Hagger and Madden, 1987; Leung, Sharma and Nakamoto, 1997), practitioners sometimes use aquaculture and/or fisheries’ output to measure its contribution to GDP when information on GVA (especially indirect GVA) is not readily available (e.g. Lymer et al., 2008; WorldFish Center, 2011). It is important to note that output is usually not an appropriate measure of an industry/sector’s economic contribution because output contains import content and double counting; see section 4.1 for more details.
As indicated in the output decomposition in equation (1), only when the import content and double counting are believed to be small, output could be used to approximate an industry’s total direct and indirect contribution to GDP. Even so, the proxy tends to be more reliable in providing a snapshot measure than monitoring the contribution over time because the composition of an industry/sector’s output is subject to change.
Proper way to estimate a sector’s total direct and indirect GVAAs shown at the end of section 4.2, adding the direct and indirect GVA of individual industries together would lead to double counting and hence should be avoided. The proper way to estimate the direct and indirect contribution of a sector composed of multiple industries is to treat the sector as a whole and apply the estimation methods discussed in Appendices II–V.
Extra caution about double counting when ad hoc estimation methods are being usedWhile double counting is relatively easy to avoid or detect under the input-output approach, it tends to be less obvious when ad hoc methods are used. For example, the GVA of the hatchery sub-industry could be double counted in aquaculture’s direct GVA and in its indirect GVA; see section 4.1 for detailed discussion. Such double counting can be avoided by a formal estimation under the input-output approach. Yet extra caution is needed to avoid it when the less formal value chain approach is used.
Caution against using GVA ratios to estimate GDP measuresWhen input-output tables or national accounts are unavailable or do not provide enough data, aquaculture and fisheries’ GVA is often estimated by multiplying its output by a selected GVA ratio (Gillett, 2009; World Bank, 2012; de Graaf and Garibaldi, 2014). Some general guidelines for this practice are noted in Box 3.
Caution against using GVA multipliers to estimate indirect GVAWhen the formal input-output approach or the informal value chain approach cannot be applied because of the lack of data, GVA multipliers (Table 7: row 29) are sometimes used to estimate indirect GVA based on direct GVA. Some general guidelines for this practice are noted in Box 4.

43Empirical methodology and good practices in estimating and utilizing GDP measures
BOX 3Notes on using GVA ratios to estimate GDP measures
An industry/sector’s current output and its GVA ratio in the near past could be used to estimate its current GVA when it is believed that there are no significant changes in the economic structure of the industry/sector.
Aquaculture and fisheries’ GVA ratios could vary significantly across different economies. Therefore, the practice of estimating aquaculture and fisheries’ GVA in one economy based on GVA ratios borrowed from other economies should be avoided or proceeded with extreme caution. The method may be justified when it is used to fill data gaps for some countries in a region in order to estimate aquaculture and fisheries’ contribution to GDP for the region as a whole (World Bank, 2012). In this situation, the estimated results for the individual countries are “intermediate products” that should be reported with caution or not reported explicitly. The method may be used to estimate the aquaculture and fisheries GVA for an individual country only when it is confident that the GVA ratio borrowed from elsewhere is a good proxy of that in the country.
The total direct and indirect GVA ratio (e.g. Table 7: row 26) tends to be more stable than the direct GVA ratio (e.g. Table 7: row 27) or indirect GVA ratio (e.g. Table 7: row 28). For example, the two hypothetical changes on the aquaculture and fisheries value chain discussed in section 3.3 would not affect the sector’s total direct and indirect GVA, but would alter its direct and indirect composition. Therefore, “borrowing” total direct and indirect GVA ratios (Table 7: row 26) tends to be more reliable than borrowing direct GVA ratios (Table 7: row 27) or indirect GVA ratios (Table 7: row 28).
BOX 4 Notes on using GVA multipliers to estimate indirect GVA
An industry/sector’s current direct GVA and its GVA multiplier in the near past could be used to estimate its current indirect GVA when it is believed that there are no significant changes in the economic structure of the industry/sector.
Aquaculture and fisheries’ GVA multiplier could vary significantly across different economies. Therefore, the practice of estimating aquaculture and fisheries’ indirect GVA in one economy based on GVA multipliers borrowed from other economies should be avoided or proceeded with extreme caution. GVA multipliers could be borrowed from one economy to another economy for estimating the aquaculture and fisheries’ indirect GVA only when the two economies have similar fish value chains and economic structure.
When borrowing GVA multipliers to estimate indirect GVA, it is important to ensure that the direct GVA and the borrowed GVA multiplier corresponds to a consistent scope of aquaculture and fisheries. For example, the GVA multipliers in Table 7 (row 29) correspond to the USD 550 million direct GVA of the two-industry sector (aquaculture + fishing). If they are borrowed to estimate the indirect GVA of the three-industry sector (aquaculture + fishing + fish processing), the results would tend to be overestimated. As indicated in Table A.1, the most comprehensive GVA multiplier for the three-industry sector is only 1.06 (row 31, column 6), much smaller than the 1.57 GVA multiplier for the two-industry sector (Table 7: row 29, column 6).
Aquaculture and fisheries can have several GVA multipliers at different levels (Table 7: row 29). It is possible that one multiplier is fit for being borrowed whereas another is not. For example, an economy that has aquaculture and fishing industries similar to the economy described in Table 1 and Table 2 yet has no fish processing may borrow the 0.30 multiplier in Table 7 (row 29, column 3), but not the 0.73 multiplier (row 29, column 4). Therefore, when borrowing a multiplier for estimating indirect GVA, it is crucial to understand the scope of indirect GVA represented by the multiplier and check whether the multiplier is applicable.

44 Understanding and measuring the contribution of aquaculture and fisheries to GDP
Caution against imputing GVA generated in non-market activitiesSubsistence aquaculture and fisheries production is normally not recorded in national accounts because subsistence production is primarily for non-commercial purposes (e.g. own consumption or gifts), and hence lacks market value.
A general concern is that missing subsistence production would tend to substantially underestimate the economic contribution of aquaculture and fisheries in countries where a large portion of aquaculture and fisheries (particularly capture fisheries) are subsistence operations (World Bank, 2012). There have been efforts to account for the contribution of subsistence aquaculture and fisheries’ contribution to GDP (Gillet, 2009).
Accounting for the economic contribution of subsistence aquaculture and fisheries entails estimation of the value of subsistence production. A common practice is to use the market prices of similar products to assign a monetary value to subsistence aquaculture and fisheries production. Yet, the practice may not be valid. For example, suppose that one day a small-scale fisher caught two pieces of coilia (Coilia macrognathos) in the Yangtze River, China, and sold them to a nearby restaurant for CNY 1 000.19 The fish is a rare delicacy that has become increasingly expensive because of scarcity. One week later the fisher caught another two coilia, yet this time he could not sell the fish because no customer had preordered the delicacy. Eventually, the fish ended up in the stomachs of the fisher and his friends. Does this mean that the fisher has treated his friends to a CNY 1 000 feast? The answer tends to be negative.
This example illustrates that it may not be proper to use market prices to impute the value of non-market goods and services. Some notes on how to value subsistence aquaculture and fisheries are suggested in Box 5.
6.2 Good practices in reporting and interpreting measures of aquaculture and fisheries’ contribution to GDP Use clear terminology to report an industry/sector’s indirect contribution to GDPMeasuring an industry/sector’s indirect contribution to GDP effectively involves counting GVA generated in other industries as part of the industry/sector’s total economic contribution. When improperly used or understood, the measurement could be deemed a disingenuous effort to inflate the industry/sector’s economic contribution for advocacy purposes.
19 Chinese yuan; 1 CNY = 0.15 USD.
BOX 5 Notes on how to value subsistence aquaculture and fisheries
If fishers and fish farmers can sell their products at market prices yet decide to use them as own consumption or gifts, then the subsistence production can be valued at the market prices, and the GVA generated in the subsistence production is estimated accordingly.
When valuing non-market fish products (including subsistence fish production), special attention should be paid to the fact that adding a large amount of fish products to the market would tend to depress fish prices (World Bank, 2009, 2017).
If subsistence fish production has no market outlets, then it is usually improper to esti-mate its imputed value based on market prices. Instead, GVA generated in the subsistence production can better be estimated by the value of labour and capital used in the produc-tion (i.e. the income approach to the measurement of GDP).
Indeed, the income approach tends to be a better way to measure GVA generated in sub-sistence fish production than the production approach (i.e. estimating the GVA by the imputed value of subsistence fish production and a GVA ratio) because the former can avoid the pitfalls in the estimation of the imputed value of subsistence fish production.

45
Indeed, widespread misunderstanding or misuse of measures of indirect contribution has led to suggestions or practices of treating an industry/sector’s direct GVA as the only legitimate measure of its contribution to GDP, or at least avoid the term “indirect contribution” but use “indirect impact” or “indirect effect” instead to denote indirect GVA (e.g. Taylor and Smith, 1996; Watson et al., 2007; Hanson, Dean and Spurlock, 2004; Deisenroth, Bond and Loomis, 2012; Hutt et al., 2013; Morrissey and O’Donoghue, 2013).
However, despite such reservations, the concept and terminology of direct and indirect contribution to GDP has continued to be widely used (e.g. Westlund, Holvoet and Kébé, 2008; Cai, Leung and Hishamunda, 2009; World Bank, 2012; Tian, Mak and Leung, 2013; Sigfusson, Arnason and Morrissey, 2013). Even when denoted as “indirect impact” or “indirect effect”, an industry/sector’s indirect GVA is often added to its direct GVA to calculate its total contribution to GDP.
Measuring an industry/sector’s indirect contribution to GDP is important because direct GVA is a basic yet inadequate measure of an industry/sector’s economic contribution; see more discussion in section 3.3. Therefore, when reporting measures related to an industry/sector’s indirect contribution to GDP, it is crucial to use clear, well-defined terminology to avoid misunderstanding or misuse. Some general guidelines are suggested in Box 6.
Empirical methodology and good practices in estimating and utilizing GDP measures
BOX 6 General guidelines for the proper use of terminology to report indirect contribution
When the value of a GVA measure is reported, unless specified otherwise, an industry/sector’s GVA means its direct GVA, and its contribution to GDP means its direct contribution to GDP.
Terms such as “aquaculture GDP”, “fishing GDP”, “fisheries GDP” or “aquaculture and fisheries GDP” should only be used to denote an industry/sector’s direct GVA. • One may say that “the aquaculture GDP is USD 250 million” (Table 7: row 1, column 1);
“the fishing GDP is USD 300 million” (Table 7: row 1, column 2); or “the aquaculture and fisheries GDP is USD 550 million” (Table 7: row 1, column 3).
• It should be avoided to say that “the aquaculture and fisheries GDP is USD 714 million” (Table 7: row 12, column 3). Even the statement that “the aquaculture and fisheries’ total GDP is USD 714 million” could be misleading.
Let us call a spade a spade. That is, when reporting measures that involve indirect GVA, the term “indirect” should always be present. • One may say that: (i) “aquaculture directly and indirectly contributes 0.72 percent of
GDP through its USD 361 million total direct and indirect GVA” (Table 7: column 1); or (ii) “fishing’s total direct and indirect contribution to GDP is USD 369 million, which is 0.92 percent of the GDP” (Table 7: column 2).
• It may be insufficient to denote “total (direct and indirect) contribution” at first and then shorten it to “total contribution” because the shortened term could be misunderstood when quoted out of the context.
When “total direct and indirect contribution” is reported, it is essential to clarify the direct and indirect components. For example, when reporting the results in Table 7, one may state the following:• Aquaculture and fishing’s total direct and indirect contribution to GDP is USD 714
million, including USD 550 million direct GVA generated in aquaculture and fishing and USD 164 million indirect GVA that the sector helps generate in other industries through its backward linkage to upstream direct or indirect input suppliers (Table 7: column 3).
• Aquaculture and fishing directly contributes USD 550 million to the GDP through GVA generated in the sector, and it indirectly contributes to the generation of USD 863 million GVA in other industries through its backward linkage to upstream industries, its forward linkage to fish processing, as well as its linkages to fish marketing and fishing boat building. Therefore, the sector’s total direct and indirect contribution to GDP is USD 1 413 million (Table 7: column 6).

46 Understanding and measuring the contribution of aquaculture and fisheries to GDP
Interpreting indirect contribution to GDP: accounting versus impact perspective As discussed in section 4.2, an industry/sector’s indirect contribution to GDP is usually estimated by impact measures and can be interpreted from the (ex post or ex ante) impact perspective. It is important to note that the estimations are based on certain assumptions specified not to simulate the reality but to reveal the amount of indirect GVA that the industry/sector helps generate in other industries through various linkages. Therefore, interpreting indirect GVA from the impact perspective should be proceeded with caution. Some general guidelines are suggested in Box 7.
6.3 Utilization of GDP measures for evidence-based policy and planning Despite substantial efforts in measuring the contribution of aquaculture and fisheries to GDP (see section 1 for citations), the issue of how to use the GDP measures for policy-making and planning has not been addressed adequately.
Most work on measuring aquaculture and fisheries’ contribution to GDP has been conducted or sponsored by national fisheries agencies, regional/international organizations or other champions of the sector with concerns over the value of aquaculture and fisheries being underappreciated (e.g. World Bank, 2012; Gillet, 2009). Accordingly, the efforts have been primarily focused on accounting for the sector’s economic contribution as comprehensively as possible.
Likewise, other sectors would also like to see the measure of their contributions to GDP as large as possible. The end result would then appear to be each and every industry/sector trying to inflate its economic contribution by counting GVA generated in other industries into its own contribution to GDP. Such “double-counting” practices would seem particularly dubious when practitioners do not distinguish between direct and indirect GVA. This has led to reservations against indirect GVA as a measure of an industry/sector’s contribution to GDP (see discussion in section 6.2) and futile attempts to develop alternative GDP measures free from the double-counting feature (Leones and Conklin, 1993; Johnson and Wade, 1994; Tanjuakio, Hastings and Tytus, 1996).
BOX 7General guidelines for interpreting indirect GVA from the impact perspective
Indirect GVA should primarily be interpreted from the accounting perspective discussed in the previous subsection, whereas interpretations from the impact perspective are useful supplements that enhance the understanding of the indicator.
When interpreting indirect GVA from the impact perspective, it should be made clear that the impacts are potential effects dependent upon certain underlying assumptions.
It would be useful to explain under what situations the potential impacts would tend to be more significant and under what situations they tend to be less so.
For example, the USD 164 million indirect GVA (Table 7: row 4, column 3) can be interpreted as follows. • Aquaculture and fishing indirectly contributed USD 164 million to the GDP through
its backward linkage. This means that aquaculture and fishing has helped generate USD 164 million GVA in upstream industries that directly or indirectly supply inputs to the sector. While USD 164 million GVA was generated in other industries, it is deemed aquaculture and fishing’s indirect GVA, because without the sector the GVA may not have been generated. In other words, the removal of aquaculture and fishing from the economy could potentially affect USD 164 million GVA in other industries. The actual impact would nevertheless depend upon the ability of the upstream industries in finding new markets to cover the loss of demand for their products due to the removal of aquaculture and fishing.

47Empirical methodology and good practices in estimating and utilizing GDP measures
As discussed in section 3.3, indirect GVA is an important GDP measure that supplements the inadequacy of direct GVA in measuring an industry/sector’s economic contribution. The solution to concerns over misuse or misunderstanding of indirect GVA is not to abandon the measure but to use it properly.
Indeed, when developing or using a GDP measure, the first and foremost issue to clarify is how the measure can and should be properly used to facilitate evidence-based decision-making. This should become a guiding question without which the development of GDP measures would be merely an academic exercise and prone to controversy. In the following sections, we discuss how GDP measures could be, or should be, used in the assessment of aquaculture and fisheries’ economic performance for evidence-based policy-making and sector planning.
Comparing economic contribution over timeTotal direct and indirect GVA should be used to measure the change of an industry/sector’s economic contribution over time, whereas direct GVA tends to be an inadequate measure in this respect; see section 3.3 for more discussion. An increase (or decrease) in aquaculture and fishing’s total direct and indirect GVA indicates an increase (or decrease) in the sector’s economic contribution. The change can be measured in terms of amount or percentage. For example, an increase of aquaculture and fishing’s total direct and indirect GVA from USD 1 413 million to USD 1 696 million represents a USD 283 million or 20 percent increase in its economic contribution.
Some notes are provided in Box 8 regarding the use of total direct and indirect GVA to measure the change of aquaculture and fisheries’ contribution to GDP.
Setting a policy target on GVAProduction quantity is a common policy target in aquaculture and/or fisheries sector development plans. Like a business plan that tries to maximize production not necessarily optimal for profitability, policy measures designed to increase production quantity may not lead to an increase in the sector’s economic contribution. Therefore, a policy target on GVA may be established to supplement the production target. For example, an aquaculture and fisheries sector development plan can set a production target (e.g.3 percent annual growth in the sector’s production during the planning period) together with a GVA target (e.g. 3 percent annual growth in the sector’s economic contribution).
Setting a policy target on GVA can help avoid or mitigate boom-bust cycles that have been common for aquaculture development in many places. As major technical breakthroughs (e.g. artificial breeding) allow aquaculture production to increase rapidly in a short period of time, a boom-bust cycle is prone to occur because fish farmers usually do not take into consideration the aggregate impact of their individual profit-seeking behaviours on the market conditions (e.g. price collapse caused by a market glut). Public planning that focuses only on improving production capacity (e.g. faster growing strain, higher stocking density) could aggravate the situation, whereas a policy target on the economic contribution of aquaculture could help mitigate such boom-bust cycles by compelling the planners to pay attention to the economic value created by aquaculture.
Setting a policy target on GVA may also help mitigate overfishing. When fishers exploit open-access fisheries resources to maximize their individual catches, overfishing could happen without benefiting the fishers because of price collapse caused by a market glut. Therefore, a policy target on GVA may lend support to policy measures for controlling fishing capacity from an economic perspective.
Similar to the case in the previous subsection, a policy target on aquaculture and fisheries’ GVA should be set according to the sector’s most comprehensive total direct and indirect GVA or the satellite account measure when the input-output measures are not available.

48 Understanding and measuring the contribution of aquaculture and fisheries to GDP
Comparing economic contribution across industries/sectorsDirect GVA as a cross-industry/sector comparable measure with unclear policy implicationsAs mentioned above in section 6.2 and section 6.3, direct GVA is the only valid GVA measure that sums up to the GDP of the entire economy. Thus, it is often deemed the only legitimate measure for cross-industry/sector comparison. However, the policy implications of comparing direct GVA across industries/sectors are not always clear. It may be nice to know that an industry has higher direct GVA than another industry, yet is it acceptable to say that the former has a greater economic contribution than the latter? The examples in section 3.3 beg a negative answer to the question.
Most comprehensive total direct and indirect GVA as a suitable measure for cross-indus-try/sector comparison in principle yet with technical difficulties in practiceOn the other hand, is it acceptable to say that an industry with higher total direct and indirect GVA has a greater economic contribution? One may argue that comparison of total direct and indirect GVA across industries/sectors would be subject to double counting because an industry/sector’s indirect GVA is direct GVA generated in other industries/sectors, and the sum of all industries/sectors’ total direct and indirect GVA tends to exceed the GDP of the entire economy; see more discussion on double count-ing in section 6.1.
BOX 8 Notes on comparing aquaculture and fisheries’ contribution to GDP over time
When available, the most comprehensive measure of total direct and indirect GVA should be used to measure the change of aquaculture and fisheries’ contribution to GDP. For example, the total direct and indirect GVA measure in column 6 of Table 7 should be the first option; the measure in column 5 should be the second option when the measure in column 6 cannot be quantified because of a lack of data; then the measure in column 4; and the measure in column 3 is the last option.
When input-output measures are not available, the satellite account measure (column 7 in Table 7) can be used to measure the change of aquaculture and fisheries’ contribution to GDP over time.
When comparing the contribution over time, the measures of total direct and indirect GVA should be consistent in different time periods. For example, suppose that the measure in column 3 of Table 7 is used to measure aquaculture and fisheries’ total direct and indirect GVA in t0 because more comprehensive measures cannot be quantified, then the same measure should be used in t1 even if a more comprehensive measure becomes available so that the change of the contribution over time can be measured properly. Yet, the more comprehensive measure can be used to measure the change between t1 and t2.
When new input-output tables are available, the GVA-FU table (Table 3), the output decomposition table (Table 4) and the summary table for GVA measures (Table 7) can be updated to provide a comprehensive view of changes in aquaculture and fishing’s direct and indirect GVA. The comprehensive view can help reveal various driving forces behind the changes and hence facilitate understanding of the nature of the changes. It can also help assess whether changes in aquaculture and fishing’s economic contribution are caused by transitory shocks or reflect long-term, structural changes.
A change in aquaculture and fisheries’ total direct and indirect GVA could, to some extent, reflect a change in the general price level of the economy. Thus, the inflation or deflation factor could be filtered out of a change in the nominal GVA to measure the real GVA growth. For example, given a 10 percent inflation rate, the 20 percent nominal growth in the GVA in the above example would correspond to a 10 percent real GVA growth.

49
This concern is nevertheless unnecessary because comparing total direct and indirect GVA across industries/sectors is to evaluate their potential impacts on GVA under different scenarios, and the impacts are not supposed to be added up. For example, aquaculture’s total direct and indirect GVA measures the potential impact of the removal of the aquaculture industry, whereas fishing’s total direct and indirect GVA measures the potential impact of the removal of the fishing industry. The two removals are in an “either/or” relationship; hence, comparing their total direct and indirect GVA has no double counting because the two impacts are not supposed to be added together; see Appendix II for discussion on how to estimate the impact of a simultaneous removal of aquaculture and fishing.
Therefore, total direct and indirect GVA can, in principle, be used to compare economic contribution across industries/sectors – an industry/sector with larger total direct and indirect GVA has a higher economic contribution in the sense that its removal could result in a greater loss in the economy’s GDP.
However, a technical issue regards which measures of total direct and indirect GVA should be used for cross-industry/sector comparison. In Table 7, the total direct and indirect GVA measure in column 3 is estimated from a standard methodology (Appendix II) and hence may be the most comparable across industries/sectors, whereas the measures in columns 4 to 7 are based on ad hoc assumptions that may differ across industries/sectors.
When the total direct and indirect GVA measure in column 3 (direct GVA plus indirect GVA through backward linkage) is used, downstream industries (e.g. fish processing) would tend to have a higher total direct and indirect GVA. For example, the direct GVA of aquaculture, fishing and fish processing is, respectively, USD 250 million, USD 300 million and USD 170 million, whereas their total direct and indirect GVA is USD 361 million, USD 369 million, USD 507 million, respectively (Table A.1). Thus, is it acceptable to say that downstream industry/sectors tend to have a higher economic contribution? The answer tends to be negative. Therefore, despite its better comparability in practice, total direct and indirect GVA through backward linkage may not be an appropriate indicator for comparing economic contribution across industries/sectors.
In principle, when comparing economic contribution across industries/sectors, the most comprehensive total direct and indirect GVA measure of each industry/sector should be used. However, in practice, the comparability of different industries/sectors’ most comprehensive total direct and indirect GVA could be compromised by inconsistent assumptions used to define them and/or the uneven quality of data used to estimate them. The inconsistency or incompatibility tends to be aggravated by the fact that GVA measures for different industries/sectors are usually estimated by different authorities.
Before venturing into a complicated yet likely futile attempt to address such practical constraints, let us first ask a fundamental question: What is the purpose of comparing industries/sectors’ economic contribution? One may say that the comparison is to determine which industries/sectors are more important. Such vague, essentially tautological answers do not address the core issue: how can the measurement provide guidance to decision-making?
Government or donors may want to take into consideration of the industries/sectors’ economic contribution for decision-making in resource allocation. Judging from the strong preference of the champions of an industry/sector over the greatest possible GVA measure for the industry/sector, a general belief seems to be that an industry/sector with greater economic contribution deserves more budgetary or other supports. Nevertheless, it is worth pointing out that when setting priorities for budgetary support, what government should take into account may not be the industries/sectors’ current economic contribution but their potential future contribution. For example, an infant industry/sector with a small economic contribution yet great untapped potential may deserve more budgetary support than a mature industry/sector with a large economic contribution yet little growth potential.
Empirical methodology and good practices in estimating and utilizing GDP measures

50 Understanding and measuring the contribution of aquaculture and fisheries to GDP
When evaluating different policy measures (e.g. whether to support capture fisheries or aquaculture for increasing fish production), instead of relying on general GVA measures, governments should make decisions based on the results of specific impact analyses.
In summary, comparing GVA across industries/sectors tends to be conceptually bewildering, technically difficult, yet practically unnecessary. However, in case the government or other stakeholders insist on using GVA measures to compare economic contribution across industries/sectors, the most comprehensive total direct and indirect GVA (e.g. column 6 in Table 7) of each sector should be used for the comparison with a caveat that the comprehensiveness of the measure may differ across industries/sectors because of various constraints (e.g. the lack of data).
Aquaculture and fisheries as a percentage of GDPThe SDG Indicator 14.7.1 is intended to measure “Sustainable fisheries as a percentage of GDP in small island developing states, least developed countries and all countries”. As opposed to an industry/sector’s GVA measuring its absolute economic contribution, its percentage of GDP (i.e. the ratio between its GVA and the entire economy’s GDP) measures its relative economic contribution.
Comparing percentage of GDP across industries/sectorsComparing industries/sectors’ percentage of GDP is essentially equivalent to comparison of their GVA, which has been discussed in the previous subsection and requires no repetition here. Yet, it is worth further disabusing the preference over a large percentage of GDP which is widely shared by many stakeholders or champions of aquaculture and fisheries. A small share of aquaculture and/or fisheries’ percentage of GDP should not always be deemed a disadvantage of the industry/sector but could be used to justify more support to the industry/sector. We will return to this point at the end of this subsection.
Comparing percentage of GDP over timeAs a measure of industries/sectors’ absolute and relative economic contribution, respectively, GVA and percentage of GDP tend to move in the same direction for an export-oriented aquaculture and fisheries sector (e.g. the case of Iceland described in Sigfusson, Arnason and Morrissey, 2013). For an aquaculture and fisheries sector that serves primarily the domestic market, the two measures may move in the opposite direction over time.
For example, China’s extended aquaculture and fisheries sector has doubled its GVA from 2003 to 2009, whereas its percentage of GDP declined from 1.86 percent to 1.49 percent (FAO, 2012). The increased GVA reflects expanding aquaculture and fisheries production in China, whereas the decreased percentage of GDP reflects a faster expansion in the rest of the economy than aquaculture and fisheries (or from the demand-side perspective, a general decline of the share of seafood consumption, or food consumption in general, in the Chinese households’ total expenditure); see more discussion on the links between GVA and final use in section 3.2.
As indicated in Figure 1, given the same level of aquaculture and fisheries production, developed countries tend to have a smaller aquaculture and fisheries’ percentage in GDP. This stylized fact indicates that, as an economy reaches a certain development stage, its aquaculture and fisheries sector’s percentage of GDP may start declining.

51
Percentage of GDP as a policy targetThe SDG 14.7.1 “Sustainable fisheries as a percentage of GDP in small island developing states, least developed countries and all countries” essentially sets percentage of GDP as a policy target. As discussed above, a policy target on aquaculture and fisheries’ GVA (a measure of absolute economic contribution) can supplement the corresponding production target. Yet, setting a policy target on aquaculture and fisheries’ percentage of GDP (a measure of its relative economic contribution) is less straightforward because the measure (equal to the sector’s GVA divided by the GDP of the entire economy) is subject to the influence of both demand- and supply-side factors; see section 3.2 for more discussion.
A policy target on aquaculture and fisheries’ percentage of GDP may be set by its GVA target divided by a corresponding GDP projection (e.g. provided by the International Monetary Fund’s World Economic Outlook Database).20 In this situation, the percentage of GDP would be a derivative target of the GVA target, i.e. the target percentage of GDP would be determined according to the target GVA.
A policy target on aquaculture and fisheries’ percentage of GDP can also be set according to reference benchmarks based on experiences in other countries. For example, a country with a small aquaculture and fisheries’ percentage of GDP yet a large untapped potential in the sector may use the experiences of similar countries (in terms of resource endowment, development stage, food consumption pattern, etc.) to set a target on aquaculture and fisheries’ percentage of its GDP. This may not be a hard target that must be achieved; rather, it can serve as a benchmark to guide the country’s policy and planning. For example, champions of aquaculture and fisheries do not need to be disappointed with a small percentage of GDP for aquaculture and fisheries, but instead can use the gap between the current and the benchmark percentage to justify or seek more support to the sector.
20 https://www.imf.org/external/pubs/ft/weo/2017/01/weodata/index.aspx
Empirical methodology and good practices in estimating and utilizing GDP measures


53
7. Concluding remarks
The lack of proper understanding and measurement of the contribution of aquaculture and fisheries to GDP has been in great contrast with the attention and importance attached to the subject. This paper contributes to narrowing the gap by developing the conceptual framework for understanding the contribution of aquaculture and fisheries to GDP and proposing the empirical methodology for measuring the contribution.
While the paper focuses on GVA as a whole, the various GVA measures and their estimation methods can be applied to the components of GVA or related indicators (labour income, business profit, employment, among others). Despite the good practices and general guidelines suggested in the paper, there are still many practical issues to be resolved for GDP measures to be properly and effectively used for evidence-based policy and planning for sustainable aquaculture and fisheries development at the national, regional and global levels.
Measuring the contribution of aquaculture and fisheries to GDP is not merely an attempt to know the sector’s GVA or its percentage of GDP. It is more important to understand the supply and demand-side factors that affect the contribution and to know how to use the measures for evidence-based policy and planning. When experts and practitioners pay sincere, adequate attention to the policy implications and practical utilization of aquaculture and fisheries GDP measures, controversies surrounding the measures would be easier to resolve, and the measurement enterprise can become more effective and fruitful.
The inclusion of a fisheries GDP measure in the SDGs provides a timely opportunity to move this enterprise forward. While SDG 14.7.1 explicitly mentions only “percentage of GDP” as a measure of aquaculture and fisheries’ contribution to GDP, it should be clear from the discussion in the paper that multiple GDP measures are needed to comprehensively assess the sector’s economic contribution. The paper has developed a set of GDP measures and suggested general guidelines on how the measures could be and should be used under different situations. Further studies are needed to adapt the measures to different data environments (e.g. alternative input-output modelling set-ups) and expand them to address various policy and planning issues. More case studies and expert consultations are needed to adapt the general guidelines to policy and planning environments in different economies and refine and synthesize them into internationally established methodology and standards (including terminology) for measuring the contribution of aquaculture and fisheries to GDP.


55
References
BEA (Bureau of Economic Analysis). 2009. Concepts and methods of the U.S. input-output accounts. Prepared by K.J. Horowitz & M.A. Planting. Bureau of Economic Analysis, U.S. Department of Commerce. April 2009.
BEA (Bureau of Economic Analysis). 2015. Measuring the economy: a primer on GDP and the national income and product accounts. Bureau of Economic Analysis, U.S. Department of Commerce. December 2015.
(also available at https://www.bea.gov/national/pdf/nipa_primer.pdf).Cai, J. & Leung, P. 2004. Linkage measures: a revisit and a suggested alternative.
Economic Systems Research 16, 65–85.Cai, J., Leung, P. & Hishamunda, N. 2009. Commercial aquaculture and economic
growth, poverty alleviation and food security: assessment framework. FAO Fisheries and Aquaculture Technical Paper No. 512. Rome, FAO. 58 pp.
(also available at www.fao.org/docrep/012/i0974e/i0974e.pdf).Cai, J., Leung, P., Pan, M. & Pooley, S. 2005. Economic linkage impacts of Hawaii’s
longline fishing regulations. Fisheries Research, 74: 232–242.CFSY. 2008. China Fishery Statistical Yearbook 2008. China Agriculture Press. DBEDT (Department of Business, Economic Development and Tourism). 2013. The
Hawaii State input-output study: 2007 benchmark report. Research and Economic Analysis Division, State of Hawaii, United States of America. (also available at
files.hawaii.gov/dbedt/economic/reports/IO/2007_state_io_study.pdf). de Graaf, G. & Garibaldi, L. 2014. The value of African fisheries. FAO Fisheries and
Aquaculture Circular No. 1093. Rome, FAO. 76 pp. (also available at www.fao.org/3/a-i3917e.pdf).Deisenroth, D.B., Bond, C.A. & Loomis, J.B. 2012. The economic contribution of
the private, recreation-based aquaculture industry in the western United States. Aquaculture Economics & Management, 16(1): 1–21.
EUROSTAT. 2008. Eurostat manual of supply, use and input-output tables (2008 edition). Eurostat Methodologies and Working Papers. Statistical Office, European Communities.
FAO. 2012. World Aquaculture Performance Indicators (WAPI) – the Prototype. In: FAO Fisheries and Aquaculture Department [online]. Rome. Updated 2018.
www.fao.org/fishery/statistics/software/wapi/en FAO. 2018a. FAO Fishery and Aquaculture Country Profiles. In: FAO Aquaculture
and Fisheries Department [online]. Rome. www.fao.org/fishery/countryprofiles/search/en FAO. 2018b. World Aquaculture Performance Indicators (WAPI) – Fish Consumption
Module (WAPI-FISHCSP v.2018.1). In: FAO Fisheries and Aquaculture Department [online]. Rome. Updated 2018. www.fao.org/fishery/statistics/software/wapi/en
FAO. 2018c. World Aquaculture Performance Indicators (WAPI) – Aquaculture Production Module (WAPI-AQPRN v.2018.1). In: FAO Fisheries and Aquaculture Department [online]. Rome. Updated 2018.
www.fao.org/fishery/statistics/software/wapi/en Fernandez-Macho, J., Gallastegui, C. & Gonzalez, P. 2008. Economic impacts of
TAC regulation: a supply-driven SAM approach. Fisheries Research, 90: 225–234.Gillett, R. 2009. Fisheries in the economies of Pacific island countries and territories.
Mandaluyong City, Philippines: Asian Development Bank. 484 pp. Groenewold, N., Hagger, A.J. & Madden, J.R. 1987. The measurement of industry
employment contribution in an input-output model. Regional Studies, 21: 255–63.

56 Understanding and measuring the contribution of aquaculture and fisheries to GDP
Hanson, T.R., Dean, S. & Spurlock, S.R. 2004. Economic impact of the farm-raised catfish industry on the Mississippi State economy. Journal of Applied Aquaculture, 15: 1–2, 11–28.
Hofherr, J., Natale, F. & Fiore, G. 2012. An approach towards European aquaculture performance indicators: indicators for sustainable aquaculture in the European Union. Joint Research Centre Technical Reports (EUR 25557 EN). European Commission. Luxembourg.
Hutt, C.P., Hunt, K.M., Steffen, S.F., Grado, S.C. & Miranda, L.E. 2013. Economic values and regional economic impacts of recreational fisheries in Mississippi reservoirs. North American Journal of Fisheries Management, 33(1): 44–55.
Johnson, T.G. & Wade, E.W. 1994. The economic impact of the agriculture sector in Virginia. Department of Agricultural and Applied Economics. Virginia Polytechnic Institute and State University.
Kébé, M. & Tallec, F. 2006. Contribution of fisheries sector to national economies (West and Central Africa). Sustainable Fisheries Livelihoods Programme (SFLP) in West Africa. Cotonou, Benin. Impression AGCom.
Kurz, H.D., Dietzenbacher, E. & Lager, C., eds. 1998. Input-output analysis. Three volumes. International Library of Critical Writings in Economics, Vol. 92. Cheltenham, UK, Edward Elgar.
Leones, J. & Conklin, N.C. 1993. Agriculture in the Arizona economy. Arizona Department of Agriculture. Arizona State University and the University of Arizona.
Leontief, W. 1986. Input-output economics. Second edition. New York, Oxford University Press.
Lequiller, F. & Blade, D. 2014. Understanding national accounts. Second edition. OECD Publishing.
Leung, P. & Pooley, S. 2002. Regional economic impacts of reductions in fisheries production: a supply-driven approach. Marine Resource Economics, 16: 251–262.
Leung, P.S., Sharma, K.R. & Nakamoto, S.T. 1997. Economic contributions of agriculture in Delaware: a comment. Agricultural and Resource Economics Review, 26: 155.
Lymer, D., Funge-Smith, S., Clausen, J. & Miao, W. 2008. Status and potential of fisheries and aquaculture in Asia and the Pacific 2008. RAP Publication 2008/15. Regional Office for Asia and the Pacific (RAP). Bangkok, FAO.
Miller, R.E. & Blair, P.D. 2009. Input-output analysis: foundations and extensions. Second edition. New York, Cambridge University Press.
Morrissey, K. & O’Donoghue, K. 2013. The role of the marine sector in the Irish national economy: an input-output analysis. Marine Policy, 37: 230–238.
NBS (National Bureau of Statistics). 2009. Input-output tables of China 2007. National Bureau of Statistics, Department of National Accounts, China. China, China Statistics Press. (in Chinese)
Seung, C. & Waters, E. 2006. A review of regional economic models for fisheries management in the U.S. Marine Resource Economics, 21(1): 101–124.
Seung, C. & Waters, E. 2009. Measuring the economic linkage of Alaska fisheries: a supply-driven social accounting matrix (SDSAM) approach. Fisheries Research, 97: 17–23.
Sigfusson, T., Arnason, R. & Morrissey, K. 2013. The economic importance of the Icelandic fisheries cluster – understanding the role of fisheries in a small economy. Marine Policy, 39: 154–161.
Tanjuakio, R.V., Hastings, S.E. & Tytus, P.J. 1996. The economic contribution of agriculture in Delaware. Agricultural and Resource Economics Review, 25: 46–53.
Taylor, C.R. & Smith, A. 1996. The impact of agribusiness in Alabama. Agricultural and Resource Policy Forum, 6(3): 2.
Tian, E., Mak, J. & Leung, P.S. 2013. The direct and indirect contributions of tourism to regional GDP: Hawaii. In Clem Tisdell, ed. Handbook of tourism economics, pp. 523–541. Singapore, World Scientific Publishing.

57References
United Nations. 2010. System of National Accounts 2008. New York, United Nations. (also available at https://doi.org/10.18356/4fa11624-en).
United Nations. 2018. Handbook on supply, use and input-output tables with extensions and applications. Studies in methods – handbook of national accounting. Series F No. 74, Rev.1 (ST/ESA/STAT/SER.F/74/Rev.1). Statistics Division, United Nations.
Watson, P., Wilson, J., Thilmany, D. & Winter, S. 2007. Determining economic contributions and impacts: what is the difference and why do we care? The Journal of Regional Analysis & Policy, 37(2): 140–146.
Westlund, L., Holvoet, K. & Kébé, M., eds. 2008. Achieving poverty reduction through responsible fisheries: lessons from West and Central Africa. FAO Fisheries and Aquaculture Technical Paper No. 513. Rome, FAO. 168 pp. (also available at
www.fao.org/3/a-i0448e.pdf).World Bank & FAO. 2009. The sunken billions: the economic justification for fisheries
reform. Washington, D.C., World Bank.World Bank. 2012. Hidden harvest: the global contribution of capture fisheries.
Washington, D.C., World Bank. World Bank. 2017. The sunken billions revisited: progress and challenges in global
marine fisheries. Washington, D.C., World Bank.WorldFish Center. 2011. Aquaculture, fisheries, poverty and food security. Working
Paper 2011-65. Penang, WorldFish Center. pp. 62.


59
Appendix IEstimation of the gross value added-final use (GVA-FU) matrix
An economy similar to the one in Table 1, yet generalized to n sectors can be described by
AX+F=M+X (A1)
where
is the domestic output matrix (column 14 in Table 1).
is the import matrix (column 13 in Table 1).
is the final use matrix (column 12 in Table 1).
is the direct requirement matrix where
aij = xij/xj (A2)
xij represents industry i’s sales to industry j, or equivalently, industry j’s purchase from industry i, whereas xj represents the output of industry j (i.e. an element in the matrix X defined above).
Thus, AX, the first element in equation (A1), represents the intermediate input/consumption matrix (rows 1–7 and columns 1–7 in Table 1).
Let denote the share of imported goods and services in the intermediate input xij and denote the share of imported goods and services in the final use; then the import content in xij would be
(A3)
and the import content in would be
(A4)
Then equation (A1) can be transformed into
X = AdX + Fd (A5.1)
or
X = (I - Ad)-1Fd (A5.2)
where I is the identity matrix with diagonal elements being 1 and other elements being zero;

60 Understanding and measuring the contribution of aquaculture and fisheries to GDP
is the direct requirement matrix for intermediate inputs supplied by domestic producers (corresponding to the matrix comprising rows 1–7 and columns 1–7 in Table 2).
represents the n industries’ final use provided by domestic producers (column 9 in Table 2).
(I - Ad)-1, which is often called Leontief inverse (matrix), links the production of each industry to final use. Denote
Then according to equation (A5.2)
(A6)
where and are elements of matrix (I - Ad)-1 and matrix Fd, respectively.
Denote industry i’s gross value added as vi; then its GVA ratio (denoted as can be defined as
(A7)
Combining equation (A6) and (A7) together, we can derive
(A8)
Equation (A8) links the gross value added of an individual industry to the final uses of multiple industries. Specifically, the amount of industry i’s gross value added of industry i(i.e. v1) attributable to the final use of industry 1 is ; that attributable to the final use in industry 2 is ; and so on so forth. The contents in rows 2 to 7 inTable 3 are calculated by equation (A8).
From equations (A2), (A3) and (A6), it is not difficult to derive
, (A9)
which link the import content of an intermediate input to the final use of domestically produced goods and services. Equation (A9) can be used to calculate the indirect import contents (Table 3: row 11), whereas the (direct) import content (Table 3: row 10) can be calculated by equation (A4).
Another way to calculate the indirect import contents (Table 3: row 11) is to apply equations (A1) to (A8) to the eight-sector economy in Table 2 (including the seven actual industries and the import sector); then the indirect import contents would be equal to the GVA of the import sector, which can be calculated by equation (A8).

61
Appendix IIMeasuring indirect impact through backward linkage
In order to estimate the impact of the disappearance of sector I (which could include multiple industries) on industries in sector J, we use the “import-free” modeling (equation A5.1) to describe sector J as
(A10)
where:
and
are kx1 and (n-k)x1 matrices representing the output of sector I (including the firstk industries) and section J (including the rest n-k industries), respectively.
is a (n-k)×k matrix representing the intermediate purchases the first k industries from the rest n-k industries.
is a (n-k) × (n-k) matrix representing the intermediate purchases and sales amongthe n-k industries.
is a (n-k) ×1 matrix representing the domestic final uses of the n-k industries.
Equation (A10) can be transformed into
(A11)

62 Understanding and measuring the contribution of aquaculture and fisheries to GDP
Assume that: (i) Sector I is removed from the economy.(ii) Sector J’s final use ( ) remains unchanged, which implies that after the removal
of sector I, industries in sector J cannot divert the goods and services they used to sell to sector I to final use (i.e. final consumption, capital formation or export).
(iii) The input coefficients ( and ) remain stable, which implies that after the removal of sector I, industries in sector J would use imports to replace the intermediate goods and services they used to purchase from sector I.
Under these assumptions, the impact of the disappearance of sector I on the output of sector J can be estimated by
(A12)
where .
Based on equation (A7) and (A12), the impact of the removal of sector I on the gross value added of each industry in sector J can be measured by
(A13)
where represents the gross value added of industries in sector J and is a (n-k) × (n-k) matrix with the diagonal elements being the corresponding industry’s GVA ratio (i.e. ) and other elements being zero.
The sum of the impacts of the removal of sector I on the gross value added of industries in sector J is the indirect impact of the output change on GDP, which, according to equation (A13), can be measured by
Indirect impact on GDP = (A14)
where is the 1× (n-k) summation matrix with all elements in it being 1. Accordingly, the overall direct and indirect impact on GDP is measured by
Overall impact on GDP = (A15)
where ; hence, the first term in equation (A15) measures the GVA loss in the industries in sector I; and the second term is the total GVA loss in sector J measured in equation (A14).
Equation (A15) is applied to the economy described in Table 2 for three scenarios (i.e. the disappearance of aquaculture, fishing or both); the resulting impacts are used to measure the sectors’ direct and indirect contribution to GDP (Table 5).
With and determined in A(12), the impact on each imported intermediateinput can be estimated by equations (A2) and (A3); thus, the impact on industry j’s imported intermediate input can be measured by:
for j=1, 2, …, n (A16)

63
Appendix III Measuring indirect impact through fish processing
The results in column 1 of Table 6 (also in the last column of Table 5) are estimated based on equation (A13), where the sector I includes aquaculture and fishing, and includes (the removal of aquaculture) and (the removal of fishing).
As the domestic aquaculture and fishing industry supplies 86 percent of fish processing’s USD 300 million purchase of (domestic and imported) aquaculture and fishing products, we assume that the removal of aquaculture and fishing would lead to an 86 percent decline in fish processing’s USD 700 million output, i.e.
In this situation, would include ∆xaq = -500 (the removal of aquaculture), ∆xfi = -400 (the removal of fishing) and ∆xprocessing = - 602 (the resulting 86 percent decline in fish processing). The impact of this can be estimated by equation (A13); the results are presented in column 2 of Table 6.

64 Understanding and measuring the contribution of aquaculture and fisheries to GDP
Appendix IV Measuring indirect impact through fish marketing
Assume that includes ∆xaq = -500 (the removal of aquaculture), ∆xfi = -400 (the removal of fishing), ∆xprocessing = -602 (the resulting 86 percent decline in fish processing), and ∆fd
marketing = -423 (the resulting 85 percent decline in the transport and trade margin for marketing fish products for final use); the impacts of these simultaneous changes on the output of aquafeed, fishing boat, fish processing, fish marketing and ROE can be estimated by equation (A11) in Appendix II, and the consequent impacts on their GVA can be then be estimated by equation (A13) in Appendix II.

65
Appendix VMeasuring indirect impact through fishing boat building
Assume that includes ∆xaq = -500 (the removal of aquaculture), ∆xfi = -400 (the removal of fishing), ∆xprocessing = -602 (the resulting decline in fish processing), ∆fd
marketing = -423 (the resulting decline in the transport and trade margin for marketing fish products for final use), and ∆fd
boat = -93 (the resulting disappearance of domestic demand for fishing vessel); the impacts of these simultaneous changes on the output of aquafeed, fishing boat, fish processing, fish marketing and ROE can be estimated by equation (A11) in Appendix II, and the consequent impacts on their GVA can be then be estimated by equation (A13) in Appendix II.

66 Understanding and measuring the contribution of aquaculture and fisheries to GDP
Appendix VIEstimations for the three-industry sector
The estimation methods for the results in Table A.1 (for the three-industry aquaculture and fisheries sector) are as follows:
• Column 1: estimated from equation (A13); includes ∆xaq = -500 (the removal of aquaculture).
• Column 2: estimated from equation (A13); includes ∆xfi = -400 (the removal of fishing).
• Column 3 estimated from equation (A13); includes ∆xprocessing = -700 includes (the removal of fish processing).
• Column 4 estimated from equation (A13); includes ∆xaq = -500, ∆xfi= -400 and ∆xprocessing =-700 (i.e. the removal of aquaculture, fishing and fish processing altogether).
• Column 5 estimated from equation (A11); includes ∆xaq = -500, ∆xfi = -400, and ∆xprocessing = -700 (i.e. the removal of aquaculture, fishing and fish processing altogether); and ∆Fj
d includes ∆fdmarketing
= -456 (the resulting decline in the transport and trade margin for marketing fish products for final use).
• Column 6 estimated from equation (A11); includes ∆xaq = -500, ∆xfi = -400, and ∆xprocessing = -700 (i.e. the removal of aquaculture, fishing and fish processing altogether); and ∆Fj
d includes ∆fdmarketing
= -456 (the resulting decline in the transport and trade margin for marketing fish products for final use) and ∆fd
boat = -93 (the
resulting disappearance of domestic demand for fishing vessel).

67Appendix VI
TABLE A.1 Contribution of aquaculture and fisheries to GDP: the case of the three-industry sector
Row no.
Column no. 1 2 3 4 5 6 7
Industry
Aq
uac
ult
ure
+
bac
kwar
d li
nka
ge
Fish
ing
+
bac
kwar
d li
nka
ge
Fish
pro
cess
ing
+
bac
kwar
d li
nka
ge
Three-industry sector: “aquaculture + fishing + fish processing”
Exte
nd
ed a
qu
acu
ltu
re
and
fish
erie
s se
cto
r
Bas
ic (
aqu
acu
ltu
re
+ fi
shin
g +
fish
p
roce
ssin
g +
b
ackw
ard
lin
kag
e)
Bas
ic +
lin
kag
e
to fi
sh m
arke
tin
g
Bas
ic +
lin
kag
e
to fi
sh m
arke
tin
g
+ li
nka
ge
to
fish
ing
bo
at
Value (million USD)
1 Direct GVA 250 300 170 720 720 720
2 Aquaculture 250.00 250.00 250.00 250.00
3 Fishing 300.00 300.00 300.00 300.00
4 Fish processing 170.00 170.00 170.00 170.00
5 Indirect GVA 111 69 337 274 687 763
6 Aquaculture 1.13 50.92 250
7 Fishing 10.82 124.31 300
8 Aquafeed 16.56 0.07 3.37 16.56 16.56 16.56 60
9 Fishing boat - - - - - 34.97 50
10 Fish processing 3.69 0.06 170
11 Fish marketing 3.25 1.31 20.09 23.07 311.27 311.29 360
12 Rest of the economy 76.29 65.98 138.74 234.36 358.67 400.05
13 Total (direct and indirect) GVA 361 369 507 994 1 407 1 483 1 190
Percentage of GDP (%)
14 Direct contribution 0.50 0.60 0.34 1.44 1.44 1.44
15 Aquaculture 0.50 0.50 0.50 0.50
16 Fishing 0.60 0.60 0.60 0.60
17 Fish processing 0.34 0.34 0.34 0.34
18 Indirect contribution 0.22 0.14 0.67 0.55 1.37 1.53
19 Aquaculture 0.00 0.10 0.50
20 Fishing 0.02 0.25 0.60
21 Aquafeed 0.03 0.00 0.01 0.03 0.03 0.03 0.12
22 Fishing boat - - - - - 0.07 0.10
23 Fish processing 0.01 0.00 0.34
24 Fish marketing 0.01 0.00 0.04 0.05 0.62 0.62 0.72
25 Rest of the economy 0.15 0.13 0.28 0.47 0.72 0.80
26 Total (direct and indirect) contribution 0.72 0.74 1.01 1.99 2.81 2.97 2.38
GVA ratio (equal to GVA divided by output)
27 Output 500 400 700 1 600
28 Total direct and indirect GVA ratio 0.72 0.92 0.72 0.62
29 Direct GVA ratio 0.50 0.75 0.24 0.45
30 Indirect GVA ratio 0.22 0.17 0.48 0.17
GVA multiplier (equal to indirect GVA divided by direct GVA)
31 GVA multiplier 0.44 0.23 1.98 0.38 0.95 1.06
Notes: “-“denotes zero. See Appendix VI for estimation details.

68 Understanding and measuring the contribution of aquaculture and fisheries to GDP
Appendix VIIEstimations for the four-industry sector
The estimation methods for the results in Table A.2 (for the four-industry aquaculture and fisheries sector) are as follows:
• Column 1: estimated from equation (A13); includes ∆xaq=-500 (the removal of aquaculture).• Column2:estimatedfromequation(A13);includesΔxfi=-400 (the removal of fishing).• Column3:estimatedfromequation(A13); includesΔxprocessing=-700 (the removal of fish processing).• Column4:estimatedfromequation(A13);includesΔxmarketing=-600 (the removal of fish marketing).• Column5:estimatedfromequation(A13);includesΔxaq=-500 , ∆xfi=-400,
∆xprocessing=-700, and ∆xmarketing=-600 (i.e. the removal of aquaculture, fishing, fish processing and fish marketing altogether).
• Column6:estimatedfromequation(A11);includesΔxaq=-500 , ∆xfi=-400, ∆xprocessing=-700, and ∆xmarketing=-600 (i.e. the removal of aquaculture, fishing, fish processing and fish marketing altogether); and ∆FJ
d includes =-93 (the resulting disappearance of domestic demand for fishing vessel).

69Appendix VII
TABLE A.2 Contribution of aquaculture and fisheries to GDP: the case of the four-industry sector
Row no.
Column no. 1 2 3 4 5 6 7
Industry
Aq
uac
ult
ure
+
bac
kwar
d li
nka
ge
Fish
ing
+
bac
kwar
d li
nka
ge
Fish
pro
cess
ing
+
bac
kwar
d li
nka
ge
Fish
mar
keti
ng
+
bac
kwar
d li
nka
ge
Four-industry sector: “aquaculture + fishing
+ fish processing + fish marketing”
Exte
nd
ed a
qu
acu
ltu
re
and
fish
erie
s se
cto
r
Bas
ic (a
qu
acu
ltu
re
+ fi
shin
g +
fish
pro
cess
ing
+
fish
mar
keti
ng
+ b
ackw
ard
lin
kag
e)
Bas
ic +
lin
kag
e
to fi
shin
g b
oat
Value (million USD)
1 Direct GVA 250 300 170 360 1 080 1 080
2 Aquaculture 250.00 250.00 250.00
3 Fishing 300.00 300.00 300.00
4 Fish processing 170.00 170.00 170.00
5 Fish marketing 360.00 360.00 360.00
6 Indirect GVA 111 69 337 156 396 473
7 Aquaculture 1.13 50.92 0.27 250
8 Fishing 10.82 124.31 0.13 300
9 Manufacture of aquafeed 16.56 0.07 3.37 0.02 16.56 16.56 60
10 Building of fishing boats - - - - - 34.97 50
11 Fish processing 3.69 0.06 0.11 170
12 Fish marketing 3.25 1.31 20.09 360
13 Rest of the economy 76.29 65.98 138.74 155.44 379.69 421.06
14 Total (direct and indirect) GVA 361 369 507 516 1 476 1 553 1 190
Percentage of GDP (%)
15 Direct contribution 0.50 0.60 0.34 0.72 2.16 2.16
16 Aquaculture 0.50 0.50 0.50
17 Fishing 0.60 0.60 0.60
18 Fish processing 0.34 0.34 0.34
19 Fish marketing 0.72 0.72 0.72
20 Indirect contribution 0.22 0.14 0.67 0.31 0.79 0.95
21 Aquaculture 0.00 0.10 0.00 0.50
22 Fishing 0.02 0.25 0.00 0.60
23 Manufacture of aquafeed 0.03 0.00 0.01 0.00 0.03 0.03 0.12
24 Building of fishing boats - - - - - 0.07 0.10
25 Fish processing 0.01 0.00 0.00 0.34
26 Fish marketing 0.01 0.00 0.04 0.72
27 Rest of the economy 0.15 0.13 0.28 0.31 0.76 0.84
28 Total (direct and indirect) contribution 0.72 0.74 1.01 1.03 2.95 3.11 2.38
GVA ratio (equal to GVA divided by output)
29 Output 500 400 700 600 2 200
30 Total direct and indirect GVA ratio 0.72 0.92 0.72 0.86 0.67
31 Direct GVA ratio 0.50 0.75 0.24 0.60 0.49
32 Indirect GVA ratio 0.22 0.17 0.48 0.26 0.18
GVA multiplier (equal to indirect GVA divided by direct GVA)
33 GVA multiplier 0.44 0.23 1.98 0.43 0.37 0.44
Notes: “-“denotes zero. See Appendix VII for estimation details.


This paper uses input-output analyses (including mathematical formulas and numerical examples) to clarify conceptual issues and establish an empirical
methodology concerning the measurement of the contribution of aquaculture and fisheries to gross domestic product (GDP). Furthermore, it reveals how to use GDP measures to facilitate evidence-based policy and planning for sustainable
aquaculture and fisheries development. Also, this paper standardizes the procedures for measuring the economic contribution of seafood industries and facilitates the establishment of internationally established and accepted measures of the
contribution. The measures suggested here can be used to compare the economic status of the aquaculture and fisheries sector in different countries and to monitor
the status of a country’s aquaculture and fisheries development over time. Additionally, its conclusions will have value for practitioners in aquaculture and
fisheries, the academic community interested in national and regional economics, and students in input-output analysis. While the paper is focused on aquaculture and fisheries, the conceptual framework and empirical methodology it establishes
are generally applicable to other industries or sectors.
CA3200EN/1/02.19
ISBN 978-92-5-131280-3
9 7 8 9 2 5 1 3 1 2 8 0 3
ISSN 2070-7010