Embed Size (px)
Citation preview

University of Pennsylvania University of Pennsylvania
ScholarlyCommons ScholarlyCommons
Wharton Pension Research Council Working Papers Wharton Pension Research Council
5-1-2016
Understanding and Combating Investment Fraud Understanding and Combating Investment Fraud
Christine N. Kieffer
Gary R. Mottola
Follow this and additional works at: https://repository.upenn.edu/prc_papers
Part of the Economics Commons
Kieffer, Christine N. and Mottola, Gary R., "Understanding and Combating Investment Fraud" (2016). Wharton Pension Research Council Working Papers. 59. https://repository.upenn.edu/prc_papers/59
The published version of this Working Paper may be found in the 2017 publication: Financial Decision Making and Retirement Security in an Aging World.
This paper is posted at ScholarlyCommons. https://repository.upenn.edu/prc_papers/59 For more information, please contact [email protected].
Understanding and Combating Investment Fraud Understanding and Combating Investment Fraud
Abstract Abstract Investment fraud is a significant problem in America. Estimates vary, but a conservative one is that about 10 percent of the investors will be victimized by investment fraud at some point in their lives. Further, many baby boomers are entering retirement with significant assets, and enforcement actions by financial regulators indicate that investors can be vulnerable to fraud at key ‘wealth events’ in their lives, such as when they face a decision about what to do with money arising from the sale of a house, an inheritance, or an IRA rollover. Protecting these assets—for baby boomers and younger generations who face key wealth events—will be important to ensure the financial well-being and retirement security of millions of Americans. This chapter reviews the dynamics of investment fraud victimization, explains how fraudsters use social influence tactics to defraud their victims, and describes current investor protection efforts.
Keywords Keywords Investment fraud, financial fraud, social influence, demographics and fraud, psychographics and fraud, investment fraud solicitations, fraud victimization rates, investor protection
Disciplines Disciplines Economics
Comments Comments The published version of this Working Paper may be found in the 2017 publication: Financial Decision Making and Retirement Security in an Aging World.
This working paper is available at ScholarlyCommons: https://repository.upenn.edu/prc_papers/59

Financial DecisionMaking andRetirement Securityin an Aging World
EDITED BY
Olivia S. Mitchell,P. Brett Hammond, andStephen P. Utkus
1

3Great Clarendon Street, Oxford, OX2 6DP,United Kingdom
Oxford University Press is a department of the University of Oxford.It furthers the University’s objective of excellence in research, scholarship,and education by publishing worldwide. Oxford is a registered trade mark ofOxford University Press in the UK and in certain other countries
© Pension Research Council, The Wharton School, University of Pennsylvania 2017
The moral rights of the authors have been asserted
First Edition published in 2017Impression: 1
All rights reserved. No part of this publication may be reproduced, stored ina retrieval system, or transmitted, in any form or by any means, without theprior permission in writing of Oxford University Press, or as expressly permittedby law, by licence, or under terms agreed with the appropriate reprographicsrights organization. Enquiries concerning reproduction outside the scope of theabove should be sent to the Rights Department, Oxford University Press, at theaddress above
You must not circulate this work in any other formand you must impose this same condition on any acquirer
Published in the United States of America by Oxford University Press198 Madison Avenue, New York, NY 10016, United States of America
British Library Cataloguing in Publication DataData available
Library of Congress Control Number: 2017935043
ISBN 978–0–19–880803–9
Printed and bound byCPI Group (UK) Ltd, Croydon, CR0 4YY
Links to third party websites are provided by Oxford in good faith andfor information only. Oxford disclaims any responsibility for the materialscontained in any third party website referenced in this work.

Contents
List of Figures ixList of Tables xiNotes on Contributors xiii
1. Introduction: Financial Decision Making and RetirementSecurity in an Aging World 1Brett Hammond, Olivia S. Mitchell, and Stephen P. Utkus
Part I. The Aging Brain and FinancialDecision Making
2. Aging and Competence in Decision Making 15Wändi Bruine de Bruin
3. Challenges for Financial Decision Making at Older Ages 33Keith Jacks Gamble
4. Retirement and Cognitive Functioning: International Evidence 46Raquel Fonseca, Arie Kapteyn, and Gema Zamarro
Part II. Tools for Retirement Planningand Decision Making
5. Choosing a Financial Advisor: When and How to Delegate? 85Hugh Hoikwang Kim, Raimond Maurer, and Olivia S. Mitchell
6. Advice in Defined Contribution Plans 96Gordon L. Clark, Maurizio Fiaschetti, and Peter Tufano
7. Seven Life Priorities in Retirement 115Surya Kolluri and Cynthia Hutchins
8. Worker Choices About Payouts in Public Pensions 130Robert L. Clark and Janet Raye Cowell

Part III. Solutions and Opportunities
9. Aging and Exploitation: How Should the Financial ServiceIndustry Respond? 153Marguerite DeLiema and Martha Deevy
10. Understanding and Combating Investment Fraud 185Christine N. Kieffer and Gary R. Mottola
The Pension Research Council 213Index 217
viii Contents

Chapter 10
Understanding and CombatingInvestment Fraud
Christine N. Kieffer and Gary R. Mottola
Despite the destructive toll that investment fraud can have on its victims,researchers have only recently begun to understand the mechanics of fraudand the characteristics of investment fraud victims. This chapter reviewsinvestment and financial fraud victimization rates, examines the demo-graphic and psychographic patterns associated with investment fraud vic-timization, explores the role of targeting in victimization, and explains howfraudsters rely on social influence tactics to defraud their victims. We findthat about one in ten investors will be victimized by investment fraud overthe course of their lives. Moreover, older people are targeted for investmentfraud more frequently than younger people, but after controlling for theeffects of targeting, older people are not more likely than younger people tobe victimized by investment fraud. We conclude with a discussion of what isbeing done by consumer protection organizations and policymakers toprotect investors from investment fraud.1
The Prevalence and Impact of Fraud VictimizationInvestment fraud is a subset of financial fraud, and it occurs when someone‘knowingly misleads an investor using false information for the purpose ofmonetary gain’ (Beals et al. 2015). Investment fraud includes scams likepenny stock fraud, pre-IPO scams, oil and gas scams, Ponzi schemes, andhigh-yield investment program fraud, to name a few. More generally, finan-cial fraud also includes other types of economic frauds, like lottery andsweepstake scams, as well as scams involving worthless or non-existent prod-ucts, and services such as bogus weight loss products or fake memorabilia.
Obtaining an accurate estimate of fraud prevalence—whether investmentfraud or financial fraud—has been hindered by a number of factors. Esti-mates vary, sometimes widely, due to inconsistent definitions of fraud,differences in the types of fraud examined, populations studied, under-reporting of fraud, and the method used to measure fraud, such as law

enforcement records or surveys (Deevy and Beals 2013). As such, fraudprevalence estimates need to be considered in this context.Although there are few estimates of investment fraud prevalence rates,
one is that about 7 percent of older investors will be victimized by investmentfraud at some point in their lives (Shadel et al. 2007). A calculation by theauthors based on data from a 2012 survey puts the estimate at 10 percent ofAmericans age 40+ (FINRA Investor Education Foundation 2013a). Morecommon are prevalence estimates of financial fraud. Financial fraud preva-lence rates as low as 4 percent and as high as 14 percent have been reported(AARP 2003; Anderson 2007), and recent work by the Federal Trade Com-mission (FTC) puts the estimated prevalence rate at 11 percent (Anderson2013). These estimates are likely on the low side because fraud tends to beunderreported. Victims are often reluctant to report fraud because theybelieve that reporting will make no difference, they are not sure where toreport the crime, or they are too embarrassed to do so (FINRA InvestorEducation Foundation 2013a). From an international perspective, a studyby the United Nations Interregional Crime and Justice Research Institutefound that consumer fraud rates averaged 11 percent across twenty-ninecountries (Van Dijk et al. 2007).Regardless of the varying prevalence rates, these and other studies
conclude that financial fraud is a significant and costly problem for Ameri-cans. For example, the Stanford Center on Longevity’s Financial FraudResearch Center (FFRC) estimated that approximately $50 billion is lostannually to consumer financial fraud in the US (Deevy et al. 2012). Andthe UK’s Financial Conduct Authority estimates that £1.2 billion is lostannually to investment fraud, with an average loss of £20,000 per investor(Graham 2014).The full cost of financial fraud can also extend far beyond the amount of
money lost. The $50 billion dollar figure noted above does not take intoaccount indirect costs like legal fees, late fees, and lost wages—and import-antly, it does not consider the non-financial costs of fraud, including stress,anxiety, and depression. One study that examined the broader impact offinancial fraud among Americans age 25+ found that nearly two-thirds ofself-reported financial fraud victims experienced at least one non-financialcost of fraud to a serious degree, including anger, stress, and psychologicaland emotional issues (FINRA Investor Education Foundation 2015).Beyond psychological and emotional costs, nearly half of fraud victims inthat study reported incurring indirect costs associated with the fraud such aslate fees, legal fees, and bounced checks. For example, 29 percent ofrespondents reported more than $1,000 in indirect costs, and 9 percentdeclared bankruptcy as a result of the fraud. A sobering insight from thatstudy is that nearly half of victims blamed themselves for the incident, anindication of the far-reaching effects of financial fraud on the lives of its
186 Financial Decision Making and Retirement Security

victims. These non-traditional costs of fraud are not unique to the Americancontext: a study in the UK also found high levels of anger, stress, andemotional issues among fraud victims (Button et al. 2014).
Beyond prevalence rates, another way to think about financial victimiza-tion is to consider how many investors have assets at risk. Nearly seven in tenhouseholds in America own investments either through taxable accounts orretirement accounts like 401(k)s and various types of IRAs (Mottola 2015).Accordingly, a broad swathe of the population has assets that are potentiallyvulnerable to investment fraud. Moreover, even people without investmentaccounts could fall prey to investment fraud if, for example, a fraudsterconvinces them to pull equity out of their homes to use in a fraudulentscheme. Further, many Baby Boomers are entering retirement with signifi-cant assets (Lusardi and Mitchell 2006). Enforcement actions by financialregulators indicate that investors can be vulnerable to fraud at key ‘wealthevents’ in their lives, such as when they face a decision about what to do withmoney arising from the sale of a house, an inheritance, or an IRA rollover(FINRA 2015). Protecting these assets—for Boomers and younger gener-ations who face key wealth events—will be important to ensuring the financialwell-being and retirement security of millions of Americans.
The Demographics and Psychographicsof VictimizationAs noted earlier, our understanding of fraud victimization prevalence ratesis hampered by a number of methodological and practical issues, and theselimitations apply to our understanding of how demographic and psycho-graphic variables are related to fraud victimization. Yet a growing body ofresearch has provided important insights, including the notion that nosingle stereotypical fraud victim profile exists: that is, targets and victims offinancial fraud vary by scam type. Early research has found that investmentfraud victims tend to be college-educated, financially literate men who areoptimistic (Consumer Fraud Research Group 2006). Subsequent researchsupports this profile (AARP 2011; Graham 2014). This profile may becontrasted to that of lottery fraud victims, who are more typically singleolder female consumers and those with lower levels of education andincome (Consumer Fraud Research Group 2006; AARP 2011).
Age and FraudAge is probably the most frequently researched demographic variable asso-ciated with fraud. There is a common belief that older people are more
Understanding and Combating Investment Fraud 187

likely to be victims of financial fraud, but stereotypes about victims are notentirely supported by research.2 Certainly, some studies report that age andfraud victimization are positively related. For example, one study found thatpeople age 50+ make up 35 percent of the population but 57 percent oftelemarketing fraud victims (AARP 1996). Another study found that Ameri-cans age 65+ were more likely to lose money to financial fraud than those intheir 40s (FINRA Investor Education Foundation 2013a). Also, someresearchers found that decreasing cognition associated with aging is pre-dictive of future financial fraud incidence (Gamble et al. 2014).Nevertheless, other authors have reported the opposite: that is, as age
increases, fraud victimization decreases. The first widely cited study on fraudfound that older consumers were three times less likely to be victims ofpersonal fraud than younger consumers (Titus et al. 1995). Two FederalTrade Commission studies also showed that younger adults are more likelyto be victims of fraud (Anderson 2004, 2007). Another recent study reportedthat the risk of fraud victimization decreased after age 50 (DeLiema 2015).In addition, researchers surveyed findings from fourteen different studies,and they concluded that there was no compelling evidence of a relationshipbetween age and consumer fraud victimization (Ross et al. 2014).The confusion arises for several reasons. Perhaps most important, as
noted earlier, fraud profiles vary with the type of fraud, so research thatlooks at the profiles of victims by grouping all fraud types together mayattenuate the relationship between age and fraud. Also, different conclu-sions may be reached depending upon the type of fraud examined. More-over, some research suggests that older people are less likely to acknowledgefraud (AARP 2011), which would obviously impact associations betweenage and fraud. Results can also vary based on differences in the populationsstudied.Despite the empirical uncertainty about the relationship between age and
fraud, there is widespread belief that older people are more likely to bevictims of consumer fraud (Ross et al. 2014). Anecdotally, researchers havepointed to the likelihood of seniors having more assets than younger adults,consequently making them better fraud targets. In addition, researchershave started to establish a link between cognitive changes associated withaging and susceptibility to at least some forms of fraud. For example, severalresearchers found that older people were more trusting of strangers’ faces,and neurological evidence supports this association (Castle et al. 2012). Thishigher level of trust could reduce the ability to recognize red flags and leadto greater engagement with fraudsters. Social isolation can play a role aswell. Increased isolation among the elderly may result in an older adultbeing more open to engaging with strangers to fulfill unmet social needs(Ganzini et al. 1990; Lee and Soberon-Ferrer 1997; Federal Bureau ofInvestigation 2014).
188 Financial Decision Making and Retirement Security

Other Demographic and Psychographic VariablesBeyond age, research also suggests that a number of demographic variablesare related to fraud victimization, although these findings are also mixed.Sex, income, education, and marital status have all been associated withfraud to varying degrees. Victims of investment fraud have higher incomesand educational levels relative to victims of other financial fraud crimes(AARP 2011). They are also more likely to be married (Consumer FraudResearch Group 2006; AARP 2011).
A number of psychographic variables have also been associated with fraudvictimization, among them, risk tolerance, perceptions of debt, impulsive-ness, and financial literacy. Specifically, higher levels of risk tolerance andengagement in risky behaviors are associated with a higher probability offraud victimization (Van Wyk and Benson 1997; Schoepfer and Piquero2009), as are higher levels of debt (Anderson 2004; Kerley and Copes2002). Using multilevel data (i.e., fMRI, survey, and demographic), analystshave compared investment fraud victims and non-victims, and they foundthat victims reported higher impulsiveness and demonstrated less cognitiveflexibility. They also showed less ventrolateral prefrontal cortical activity,which is consistent with reduced impulse control (Knutson and Samanez-Larkin 2014). Somewhat counter-intuitively, higher levels of financial liter-acy have been associated with an increased probability of investment fraudvictimization (Consumer Fraud Research Group 2006; AARP 2007) andconsumer fraud victimization (AARP 2008).
What could account for this counter-intuitive relationship between finan-cial literacy and fraud? One explanation might be over-confidence, a well-established bias in which a person tends to be more confident than correct;in other words, over-confident individuals overestimate the accuracy of theirbeliefs (Myers 1993). The idea that over-confidence can affect financialdecisions is not new. In an important study of stock trading behavior,researchers found that over-confidence was associated with higher levels oftrading and lower portfolio returns for online traders (Barber and Odean2001). Other researchers also found that over-confidence was a significantdeterminant of risky financial behavior: over-confident individuals madelarger contributions in an investment game and were willing to take greaterinvestment risk (McCannon et al. 2015).
In some interesting analyses on whether over-confidence was related tofraud susceptibility, researchers found that over-confidence was a risk factorfor financial fraud victimization (Gamble et al. 2014). Yet the researchersdid not establish whether over-confidence mediated the relationshipbetween financial literacy and financial fraud. That is, it is possible that asfinancial literacy increases, feelings of over-confidence rise as well. Thisover-confidence could yield feelings of invulnerability that, paradoxically,
Understanding and Combating Investment Fraud 189

make respondents with high levels of financial literacy more susceptible tofraud. From this perspective, there is not a direct link between financialliteracy and fraud susceptibility. Rather, over-confidence may mediate therelationship.An inability to identify the ‘red flags of fraud’ (i.e., responding positively
when presented with persuasion statements) provides another psycho-graphic factor thought to be related to investment fraud victimization(AARP 2011). People’s inability to identify the red flags of fraud is usuallymeasured by showing marketing statements typically used by fraudsterswhich are inconsistent with ethical investment advertisements. For example,‘The lowest return you could possibly get on this investment is 50 percentannually, but most investors are making upward of 110 percent per year’ is ared flag statement, as is ‘There is no way to lose money on this investment.’ Ifthe survey respondent rates these statements and others like them as‘appealing’, they are considered less able to identify the red flags of fraud.The lack of understanding of reasonable investment returns (FINRAInvestor Education Foundation 2013a), and the desire for higher-than-average investment yields, leaves many Americans vulnerable to fraudulentinvestment pitches.
The Role of Targeting in InvestmentFraud VictimizationWhile there is ample evidence that both demographic and psychographicvariables are related to financial fraud victimization, another factor may alsohelp explain the likelihood of being victimized by fraud: the number oftimes someone is targeted for fraud. For example, one demographic groupmay have low levels of fraud victimization because it is not frequentlytargeted; conversely, a group may have high levels of fraud victimizationbecause it is frequently targeted. In other words, examining the relationshipbetween age (or any demographic variable) and fraud victimization, withoutcontrolling for how often a person is solicited for fraud, could result inbiased estimates of the relationship between key demographic variables andfraud victimization.To better understand investment fraud victimization, we use a regression
framework to examine, in particular, the relationship between age andinvestment fraud victimization after controlling for a host of demographicand psychographic variables and the likelihood of being targeted for invest-ment fraud. We are able to conduct this analysis by combining two differentdatasets. In 2012, the FINRA Investor Education Foundation commissioneda study that examined the susceptibility of Americans to financial fraud(FINRA Investor Education Foundation 2013a). As part of this research,
190 Financial Decision Making and Retirement Security

2,364 adults age 40+ completed an online survey via a non-probability basedInternet panel. The survey covered a wide range of measures of fraudsusceptibility and exposure to fraud. More than three-quarters of theserespondents were recruited from the panel that had completed the 2012National Financial Capability Study earlier that year (FINRA InvestorEducation Foundation 2013b). The two survey databases were combinedand the resulting dataset of 1,721 respondents aged 40 to 94 was weighted tomatch the US Census distributions for both age (40 and over) and ethnicity.Table 10.1 contains sample characteristics and the Appendix contains adescription of all the variables used in the regressions. As shown inTable 10.1, the overall investment fraud victimization rate was 10 percent,the average age was 57, 73 percent of the sample was targeted for at least onetype of investment fraud, and, on average, respondents received 1.8 solici-tations (i.e., were targeted) for likely fraudulent investments.
Table 10.2 presents the results of a series of logistic regression modelspredicting investment fraud. After controlling for demographic and psycho-graphic variables, these results provide some insight into the role thattargeting plays in investment fraud victimization. The first regression (col-umn 1) contains only demographic variables, where age is strongly associ-ated with investment fraud victimization. As indicated by the odds ratio(OR), for every ten-year increase in age, the predicted odds of being aninvestment fraud victim is 1.31 times higher. This statistically significanteffect is equivalent to a 31 percent increase in the odds of being a victimof investment fraud.3 Household income is also strongly and positively
TABLE . Sample characteristics for data analysis
Variable Statistic
Investment fraud victimization (dependent variable) 10%Targeted for at least one type of investment fraud 73%Household income > = $50,000 46%Male 47%College degree 31%White 73%Dependants 29%Widow/widower 7%Mean age 57Mean financial literacy questions answered correctly 3.1Mean risk tolerance 4.3Mean perceptions of debt 3.8Mean inability to identify the red flags of fraud 5.9Mean number of targeted investment frauds 1.8
Source: Authors’ calculations based on data from the FINRA Investor Education Foundation’sFraud Susceptibility Study (2013) and the 2012 National Financial Capability Study.
Understanding and Combating Investment Fraud 191
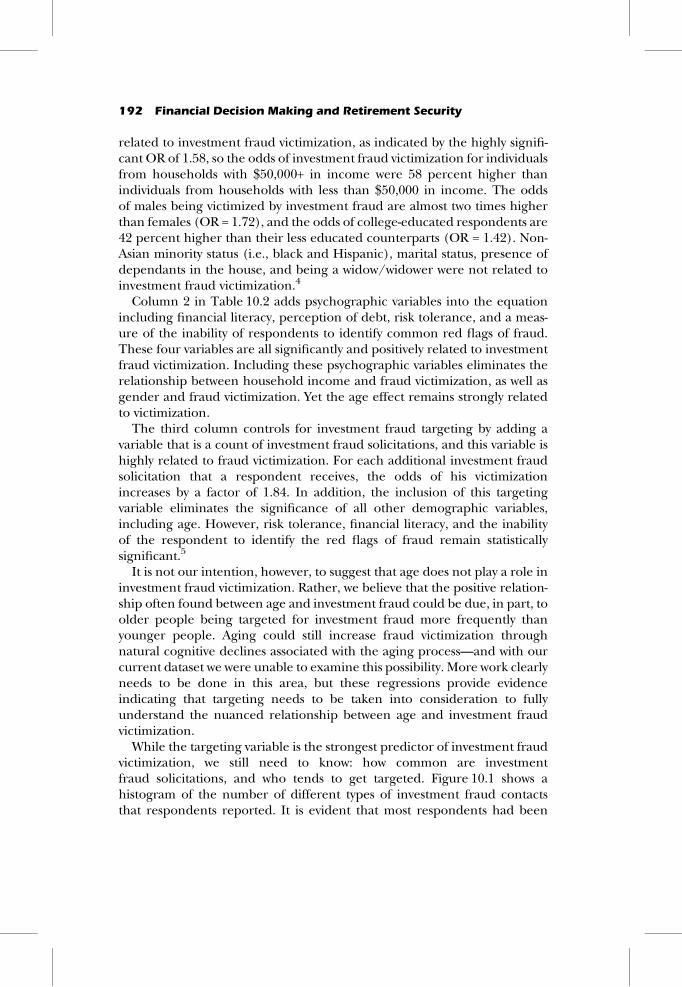
related to investment fraud victimization, as indicated by the highly signifi-cant OR of 1.58, so the odds of investment fraud victimization for individualsfrom households with $50,000+ in income were 58 percent higher thanindividuals from households with less than $50,000 in income. The oddsof males being victimized by investment fraud are almost two times higherthan females (OR = 1.72), and the odds of college-educated respondents are42 percent higher than their less educated counterparts (OR = 1.42). Non-Asian minority status (i.e., black and Hispanic), marital status, presence ofdependants in the house, and being a widow/widower were not related toinvestment fraud victimization.4
Column 2 in Table 10.2 adds psychographic variables into the equationincluding financial literacy, perception of debt, risk tolerance, and a meas-ure of the inability of respondents to identify common red flags of fraud.These four variables are all significantly and positively related to investmentfraud victimization. Including these psychographic variables eliminates therelationship between household income and fraud victimization, as well asgender and fraud victimization. Yet the age effect remains strongly relatedto victimization.The third column controls for investment fraud targeting by adding a
variable that is a count of investment fraud solicitations, and this variable ishighly related to fraud victimization. For each additional investment fraudsolicitation that a respondent receives, the odds of his victimizationincreases by a factor of 1.84. In addition, the inclusion of this targetingvariable eliminates the significance of all other demographic variables,including age. However, risk tolerance, financial literacy, and the inabilityof the respondent to identify the red flags of fraud remain statisticallysignificant.5
It is not our intention, however, to suggest that age does not play a role ininvestment fraud victimization. Rather, we believe that the positive relation-ship often found between age and investment fraud could be due, in part, toolder people being targeted for investment fraud more frequently thanyounger people. Aging could still increase fraud victimization throughnatural cognitive declines associated with the aging process—and with ourcurrent dataset we were unable to examine this possibility. More work clearlyneeds to be done in this area, but these regressions provide evidenceindicating that targeting needs to be taken into consideration to fullyunderstand the nuanced relationship between age and investment fraudvictimization.While the targeting variable is the strongest predictor of investment fraud
victimization, we still need to know: how common are investmentfraud solicitations, and who tends to get targeted. Figure 10.1 shows ahistogram of the number of different types of investment fraud contactsthat respondents reported. It is evident that most respondents had been
192 Financial Decision Making and Retirement Security

TABLE.
Factorsassociated
with
investmen
tfrau
dvictim
ization
1Dem
ograph
icvariab
leson
ly2Dem
ograph
icsan
dpsychog
raph
ics
3Dem
ograph
ics,
psychog
raph
ics,an
dsolicita
tions
Variable
Coe
fficien
tOdd
sratio
Coe
fficien
tOdd
sratio
Coe
fficien
tOdd
sratio
Age
(10-yr)
0.27
**1.31
0.36
**1.4
0.15
1.16
(0.09)
(0.10)
(0.11)
Inco
me>=$5
0,00
00.46
*1.58
0.17
1.2
0.05
1.05
(0.19)
(0.20)
(0.21)
Male
0.54
**1.72
0.24
1.3
0.02
1.02
(0.17)
(0.18)
(0.20)
Non
-Asian
minority
�0.11
0.89
�0.04
1�0
.23
0.8
(0.22)
(0.22)
(0.24)
Married
�0.05
0.95
0.02
10.19
1.21
(0.20)
(0.21)
(0.23)
Presen
ceof
depe
nda
ntsin
hou
sehold
0.29
1.34
0.23
1.3
0.17
1.18
(0.20)
(0.21)
(0.22)
College
educ
ated
0.35
*1.42
0.21
1.2
0.00
1(0.18)
(0.18)
(0.20)
Widow
/widow
er0.35
1.42
0.57
1.8
0.57
1.77
(0.34)
(0.35)
(0.38)
Measuredfinan
cial
literacy
0.34
**1.4
0.17
*1.19
(0.08)
(0.09)
Inab
ility
toiden
tifyredflagsof
frau
d0.08
*1.1
0.07
*1.08
(0.04)
(0.04)
Too
muc
hde
bt0.08
*1.1
0.06
1.06
(0.04)
(0.04)
Risktolerance
0.18
**1.2
0.14
**1.15
(0.04)
(0.04)
(contin
ued)

TABLE.
Con
tinue
d
1Dem
ograph
icvariab
leson
ly2Dem
ograph
icsan
dpsychog
raph
ics
3Dem
ograph
ics,
psychog
raph
ics,an
dsolicita
tions
Variable
Coe
fficien
tOdd
sratio
Coe
fficien
tOdd
sratio
Coe
fficien
tOdd
sratio
Investmen
tscam
contacts
0.62
**1.85
(0.06)
Intercep
t�4
.36
�7.42
�6.58
(0.56)
(0.78)
(0.83)
Observatio
ns
1,57
31,57
31,57
3R-squ
are
0.03
0.07
0.14
Max-rescaledR-squ
are
0.06
0.13
0.28
Likelihoo
dratio
44.411
p<0.00
0110
6.24
3p<0.00
0123
6.94
1p<0.00
01
Notes:A
logistic
regression
was
condu
cted
;standa
rderrors
arein
parentheses.*
*p<0.01
,*p<0.05
.Thelik
elihoo
dratio
isthedifferen
cebe
twee
nthelog-lik
elihoo
dfortheco
nstan
t-onlyan
dfullmod
el.D
ueto
missingda
ta,1
48ob
servationsweredrop
pedfrom
thean
alysis.F
orreference,1
0pe
rcen
tof
survey
respon
dentsin
thisan
alysiswereclassified
asinvestmen
tfrau
dvictim
s.
Source:A
uthors’calculationsba
sedon
data
from
theFINRAInvestor
Edu
catio
nFo
unda
tion’sFrau
dSu
scep
tibility
Stud
y(201
3)an
dthe20
12National
Finan
cial
Cap
ability
Stud
y.Boththeregression
output
andda
tasetareavailableup
onrequ
est.
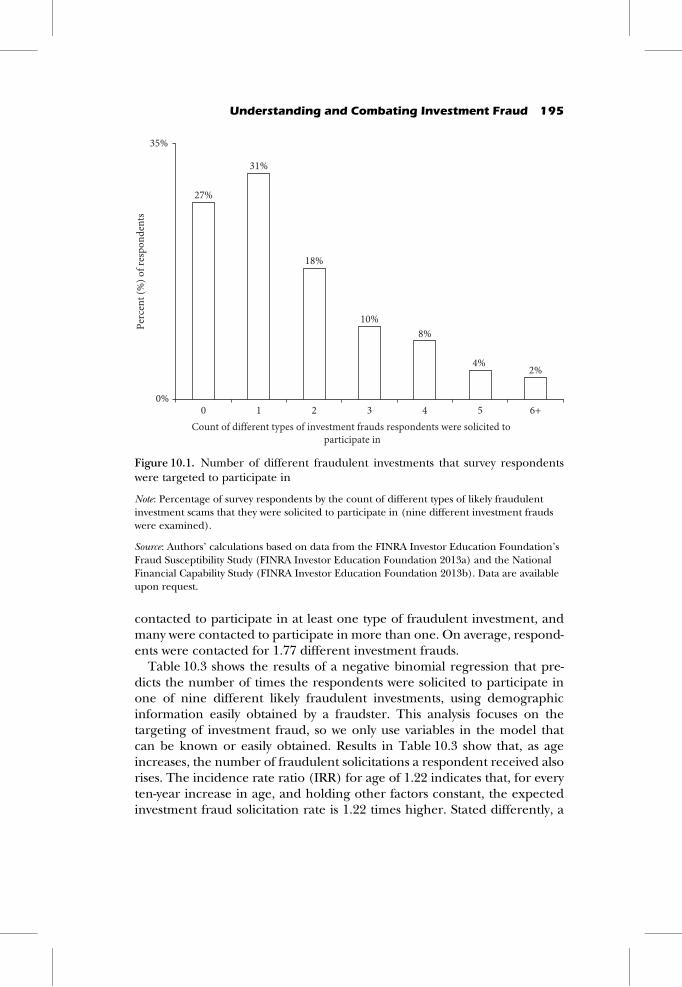
contacted to participate in at least one type of fraudulent investment, andmany were contacted to participate in more than one. On average, respond-ents were contacted for 1.77 different investment frauds.
Table 10.3 shows the results of a negative binomial regression that pre-dicts the number of times the respondents were solicited to participate inone of nine different likely fraudulent investments, using demographicinformation easily obtained by a fraudster. This analysis focuses on thetargeting of investment fraud, so we only use variables in the model thatcan be known or easily obtained. Results in Table 10.3 show that, as ageincreases, the number of fraudulent solicitations a respondent received alsorises. The incidence rate ratio (IRR) for age of 1.22 indicates that, for everyten-year increase in age, and holding other factors constant, the expectedinvestment fraud solicitation rate is 1.22 times higher. Stated differently, a
27%
31%
18%
10%8%
4%2%
0%
35%
0 1 2 3 4 5 6+
Perc
ent (
%) o
f res
pond
ents
Count of different types of investment frauds respondents were solicited to participate in
Figure 10.1. Number of different fraudulent investments that survey respondentswere targeted to participate in
Note: Percentage of survey respondents by the count of different types of likely fraudulentinvestment scams that they were solicited to participate in (nine different investment fraudswere examined).
Source: Authors’ calculations based on data from the FINRA Investor Education Foundation’sFraud Susceptibility Study (FINRA Investor Education Foundation 2013a) and the NationalFinancial Capability Study (FINRA Investor Education Foundation 2013b). Data are availableupon request.
Understanding and Combating Investment Fraud 195

ten-year increase in age is associated with a 22 percent increase in thenumber of investment fraud solicitations. Men are predicted to get 36percent more investment fraud solicitations than women. Householdincome is also strongly and positively related to investment fraud solicita-tions, as is being college-educated. We conclude that older, affluent, college-educatedmales aremost likely to be targeted for investment fraud, consistentwith the AARP (2011) results.
Social Influence and Investment FraudWhile some demographic groups are clearly more likely to be targeted andbecome victims of investment fraud than others, anyone with access tocapital could potentially be at risk. The ubiquity of fraud solicitations,coupled with the inability of many people to recognize the red flags offraud, place a large number of Americans at risk of losing money to scams(FINRA Investor Education Foundation 2013a). Given that financial literacy
TABLE . Factors associated with investment fraud targeting
Variable Incidence rate ratio Statistical significance
Age (10-yr) 1.22 **(0.03)
Income > = $50,000 1.26 **(0.07)
Male 1.36 **(0.07)
Non-Asian minority 1.07(0.07)
Married 0.92(0.06)
Presence of dependants in household 1.03(0.63)
College educated 1.33 **(0.07)
Widow/widower 1.080.10
Observations 1,721Wald chi-square 230.77 **Pseudo R-square 0.04
Notes: A negative binomial regression model was used to model the count data; robust standarderrors are in parentheses. (Poisson regression was not used due to overdispersion of thedependent variable, but both models yielded similar results.) ** p < 0.01, * p < 0.05.
Source: Authors’ calculations based on data from the FINRA Investor Education Foundation’sFraud Susceptibility Study (2013) and the 2012 National Financial Capability Study. Theregression output and dataset are available upon request.
196 Financial Decision Making and Retirement Security

appears to be positively correlated with fraud victimization, it is important tothink beyond traditional financial education to address investment fraudvictimization. Financial decisions have also been linked to emotions (Lerneret al. 2004); therefore, persuasion techniques that influence emotions canalso impact decision making (Kircanski et al. 2016). Combating investmentfraud thus requires an understanding of how fraudsters operate, as well asthe techniques they use to separate victims from their money.
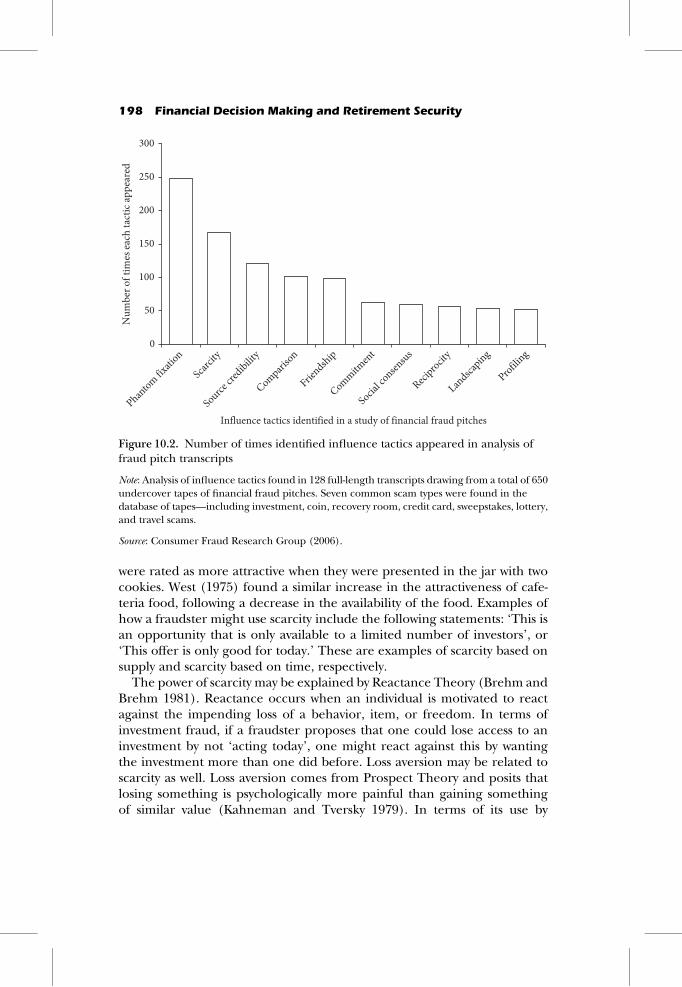
Social influence refers to the study of how people change the thoughts,feelings, and behavior of other people (Pratkanis 2007). The science ofsocial influence offers insights into better understanding and preventinginvestment fraud. The Consumer Fraud Research Group analyzed 128 full-length transcripts drawn from undercover tapes of financial fraud pitches toidentify the influence tactics used to perpetrate economic fraud crimes andto rank these tactics by frequency of use (see Figure 10.2). Their analysisincluded the seven most common scam types found in the database oftapes—including investment, coin, recovery room, credit card, sweepstakes,lottery, and travel scams (Consumer Fraud Research Group 2006).
Here we focus on five of the influence tactics identified in this research ascommonly used in investment fraud. These include phantom riches (alsocalled phantom fixation), scarcity, source credibility, social consensus, andreciprocity. Of course, influence techniques are not only used to defraudpeople: indeed, they are used in the marketing of a range of products andservices every day. When fraudsters use these tactics for ill-intent, however,they cross an ethical line that can lead to long-lasting and potentiallydevastating consequences for their victims.
Planting the seed of ‘phantom riches’ is a common technique used byfraudsters and involves dangling the prospect of wealth by enticing a poten-tial victim with something he wants but cannot have (Pratkanis andFarquhar 1992). An example of phantom riches used by fraudsters is astatement like ‘The lowest return you could possibly get on this investmentis 50 percent annually, but most investors are making upwards of 110percent a year.’ Survey research suggests that people are attracted to thistype of statement (FINRA Investor Education Foundation 2013a), though itis not a responsible form of investment advertising, and returns of 50 to 100percent per year are highly improbable.
The tactic of scarcity is applied when a salesperson creates a false sense ofurgency by claiming there is a limited supply or limited time to act, or byclaiming the opportunity is exclusive. This results in the product or servicebeing perceived as more valuable. Worchel et al. (1975) demonstrated theinfluence of scarcity on perceived value in a simple experiment in whichthey asked subjects to rate the attractiveness of cookies. The experimentersmanipulated the supply of the cookies by showing some subjects a jar withten cookies in it, and other subjects a jar with two cookies in it. The cookies
Understanding and Combating Investment Fraud 197
were rated as more attractive when they were presented in the jar with twocookies. West (1975) found a similar increase in the attractiveness of cafe-teria food, following a decrease in the availability of the food. Examples ofhow a fraudster might use scarcity include the following statements: ‘This isan opportunity that is only available to a limited number of investors’, or‘This offer is only good for today.’ These are examples of scarcity based onsupply and scarcity based on time, respectively.The power of scarcity may be explained by Reactance Theory (Brehm and
Brehm 1981). Reactance occurs when an individual is motivated to reactagainst the impending loss of a behavior, item, or freedom. In terms ofinvestment fraud, if a fraudster proposes that one could lose access to aninvestment by not ‘acting today’, one might react against this by wantingthe investment more than one did before. Loss aversion may be related toscarcity as well. Loss aversion comes from Prospect Theory and posits thatlosing something is psychologically more painful than gaining somethingof similar value (Kahneman and Tversky 1979). In terms of its use by
0
50
100
150
200
250
300
Influence tactics identified in a study of financial fraud pitches
Num
ber o
f tim
es ea
ch ta
ctic
appe
ared
Phantom fix
ation
Scarcit
y
Source cr
edibility
Comparison
Friendship
Commitment
Social co
nsensus
Reciprocit
y
Landsca
ping
Profiling
Figure 10.2. Number of times identified influence tactics appeared in analysis offraud pitch transcripts
Note: Analysis of influence tactics found in 128 full-length transcripts drawing from a total of 650undercover tapes of financial fraud pitches. Seven common scam types were found in thedatabase of tapes—including investment, coin, recovery room, credit card, sweepstakes, lottery,and travel scams.
Source: Consumer Fraud Research Group (2006).
198 Financial Decision Making and Retirement Security

fraudsters, losing the opportunity to earn a big return on an investment maybe painful enough to motivate a fraud target to go ahead with the invest-ment, despite reservations.
Source credibility is a technique used by fraudsters that capitalizes on thefinding that people are more likely to believe others in positions of author-ity, and to trust organizations that they perceive as legitimate. A classicexample of the power of source credibility, although not an example offraud, is Stanley Milgram’s (1965, 1974) work on obedience. As is commonlyknown, that study showed the ease with which a researcher donning a labcoat and clipboard (to help establish credibility and authority) could com-pel study subjects to ostensibly shock confederates in another room, despiteconfederates pleading for the subject to stop the shocks (of course, noshocks were actually being administered). In fact, many subjects ‘adminis-tered’ shocks to a confederate even when they believed the confederate wasunconscious. While Milgram noted that several factors contributed to thesubjects’ willingness to shock the confederates, he argues that authoritymust be established and perceived as legitimate.
Source credibility is used to build trust, and once trust is establishedbetween the fraudster and the potential victim, it becomes easier for thefraudster to perpetrate the fraud. Source credibility is also established byusing professional credentials, whether real or artificial. An example ofsource credibility that an investment fraudster might use is a statement likethe following: ‘We are a highly regarded and profitable investment manage-ment company specializing in the foreign exchange markets, futures,options, commodities, stocks, bonds, real estate, business startup, and manyother investments.’ The appeal of this statement was tested among US adultsage 40+, and 29 percent of the respondents found the statement appealing(FINRA Investor Education Foundation 2013a).
Fraudsters also use the tactic of social consensus (sometimes referred to associal proof) whereby the more it appears that everyone else is engaging in aparticular behavior or holds a particular belief, the more likely it is that anindividual will join and agree with the group (Pratkanis 2007). Social con-sensus is tied to social pressure and conformity. If everyone does something,not only must it be a good idea, but it can be difficult to go against groupconsensus. Solomon Asch (1956) famously demonstrated the power of thegroup to engender conformity in his classic line experiment. In this experi-ment, he used several confederates to provide obviously wrong answers aboutthe length of a line on a card. The subject of the experiment, who answeredthe question about the length of the line last or second-to-last, often providedan obviously wrong answer as well, just to conform to the group.
Social consensus is often exploited by fraudsters to commit affinity fraud.This happens when a fraudster takes advantage of the trust inherent ingroups of like-minded individuals, such as those who attend the same
Understanding and Combating Investment Fraud 199

place of worship or social club. The fraudster, who is or pretends to be amember of the group, points out to potential victims that other members oftheir group have already purchased a particular investment. This impliesthat, if their friends and colleagues are involved, it must be a good invest-ment. Further, among respondents to a study of investment fraud whoindicated that they had participated in a fraudulent investment, 34 percentwere introduced to the seller through a friend (FINRA Investor EducationFoundation 2013a). Social consensus can even be effective with strangers.For example, a typical pitch from a fraudster is something like ‘This invest-ment made hundreds of people extremely wealthy.’With this statement, thefraudster is relying on the potential victim thinking that hundreds of peoplecan’t be wrong. In fact, research has found that such a statement is appeal-ing to 30 percent of the respondents who rated it (FINRA InvestorEducation Foundation 2013a).The norm of reciprocity is another technique that fraudsters rely on to
convince potential victims to part with their money (Gouldner 1960). Thenorm is based on the notion that people should return help to those whohelp them, and the norm is found to be powerful and universal. The powerof reciprocity has been demonstrated in a number of different settings,including charities (Cialdini 2001) and organizational/industrial settings(Rhoades and Eisenberger 2002). Given the effectiveness of reciprocity, it isnot surprising that fraudsters use the technique. An example would be afraudster giving you a ‘break on his commission’. Similarly, free mealseminars are another common tactic that relies on the norm of reciprocity.A meal is provided, after which the fraudster expects that attendees willinvest in his scheme in return for the meal. Not all free meal seminars arefrauds, but a report by the Securities Exchange Commission, the NorthAmerican Securities Administrators Association, and the Financial IndustryRegulatory Authority found that, in half the cases they examined, the salesmaterials contained claims that were exaggerated, misleading, or otherwiseunwarranted (Securities and Exchange Commission et al. 2007). Moreover,13 percent of the seminars appeared to involve fraud, ranging fromunfounded projections of returns to sales of fictitious products. While littleempirical work has been done on the efficacy of free meal seminars, theirubiquity lends credence to their effectiveness: 64 percent of adults indicatedthat they were contacted to attend a free lunch sales pitch (FINRA InvestorEducation Foundation 2013a).By its very nature, investing typically involves taking on some degree of
risk, ranging from the risk of returns failing to keep pace with inflation, tothe risk of incurring losses on investments, or even losing one’s entireinvestment. Whether applied individually or collectively, these and similartactics can greatly, and often subconsciously, impact the psychological andemotional state of the intended fraud target, which can affect perceptions of
200 Financial Decision Making and Retirement Security
risk and lead to compromised decision making. For example, according tothe risk-as-feelings hypothesis, emotional reactions to risky situations oftendrive behavior (Loewenstein et al. 2001). Newly emerging research has alsofound that inducing either a positive or a negative emotional state in olderadults increased their intention to purchase items marketed with misleadingadvertisements (Kircanski et al. 2016). In short, social influence tactics maybe effective because they can change a person’s emotional state and, con-sequently, affect their willingness to take on risk and their ability to makesound decisions.
Combating Investment FraudEarly campaigns to prevent investment fraud focused on warning investorsabout some perils associated with investing. One unintended consequenceof warning campaigns, however, is that they may inspire fear in the targetaudience. And while fear has been identified as a powerful motivator—asexplained in the examples of the scarcity tactic—it is thought to be largelyineffective in behavior change campaigns (Job 1988).
In recent years, investment fraud prevention campaigns have becomemore sophisticated and incorporate the knowledge and understanding ofsocial influence tactics in an effort to empower consumers to spot and avoidfraud. As discussed earlier in this chapter, emerging research on socialinfluence techniques employed by con criminals has revealed specific tacticsthat are used to harness emotion and ultimately influence their targets’financial decisions. Given this, some campaigns have shifted from warninginvestors about specific scams to educating investors about their vulnerabil-ity, the various social influence tactics that fraudsters use, and the typesof resources they may use for vetting both sellers and products prior toinvesting.
This shift aligns with recommendations outlined in an Organisation forEconomic Co-operation and Development review of anti-scam consumerbehavior change campaigns (OECD 2005). The study concluded that a ‘lackof data about the impact of anti-scam campaigns makes it difficult to beconclusive about the value of the campaigns that have been run to date’.6
For this reason, the OECD examined a series of social marketing campaignsthat did provide evidence of effectiveness. Through this analysis, the OECDconcluded that successful campaigns must identify a clear target market; tryto change behavior by specifying specific strategies and steps; use an authori-tative tone; identify and communicate consumer benefits; tell stories; andengage partners. While information campaigns and targeted warnings havesome utility, the OECD hypothesized that their value was limited by thereactive, specific, short-term nature of the prevention approach. They
Understanding and Combating Investment Fraud 201

suggested that a more strategic, long-term, skills-based approach to tacklingscams was required.To combat investment fraud, organizations such as AARP, the US Secur-
ities Exchange Commission (SEC), the US Commodity Futures TradingCommission (CFTC), and the FINRA Investor Education Foundation haveengaged in efforts that not only increase investor awareness of possiblyfraudulent activities but also look to the science of social influence andthe promise of social marketing to empower investors to resist fraud. Theinvestor protection strategy of the FINRA Investor Education Foundation,for example, is built upon three key pillars: investors need to know that theyare vulnerable; investors need to learn to recognize the red flags of fraud;and investors need to take simple protective steps, including asking ques-tions and independently verifying answers.Fraud prevention campaigns, like many other consumer protection cam-
paigns, ultimately seek to change the behavior of consumers such that theymay identify a scam prior to falling victim. Behavior change is rarely adiscrete, single event (Zimmerman et al. 2000). An individual usuallymoves from being uninterested or ambivalent (the pre-contemplationstage), to considering a change (contemplation stage), to deciding andpreparing to make a change. This can lead to the desired action stage, butoften some type of maintenance and relapse prevention program is requiredto sustain the impetus to change (Zimmerman et al. 2000). Most individualsfind themselves cycling through the various stages before the behaviorchange is ingrained.During the pre-contemplation stage, in particular, many people may not
see that advice on how to avoid investment fraud applies to them: that is,they have the illusion of invulnerability. This illusion poses a hurdle forinvestor protection efforts; consumers who do not believe the informationapplies to them are less likely to advance to the next stage, contemplation.Though some demographic groups are more likely to be victims of invest-ment fraud, nearly everyone is at risk. If a person has money, he or she willlikely come across someone who will try to coax him or her to ‘get in on theground floor of a great investment’ or ‘strike while the iron is hot’. In fact,one study found that over eight out of ten US adults age 40+ had beencontacted in some fashion to participate in a likely fraudulent activity(FINRA Investor Education Foundation 2013a). Thus, campaigns thataddress the illusion of invulnerability and help investors recognize thatthey—like others—are at risk of falling victim to a scam may be more likelyto succeed in moving investors to take action to prevent it.Identifying the red flags of fraud is, not surprisingly, tightly linked with
understanding the social influence tactics used by fraudsters. Accordingly,efforts to build the investors’ skills to identify the questionable use ofpersuasion and influence have been undertaken. Influence techniques
202 Financial Decision Making and Retirement Security

identified through social influence research in the context of financialfraud—including phantom riches, scarcity, source credibility, social consen-sus, and reciprocity (Consumer Fraud Research Group 2006)—are powerfulin building emotion and convincing people to act without evaluating therisks of these actions. Teaching an investor to recognize these tactics isintended to heighten awareness of the emotional impact of the techniques,and consequently, to limit the impact of the techniques on financial deci-sion making. In other words, by learning to recognize when decision makingis clouded by emotion, investors may be better equipped to make lessemotional, more cognitive decisions.
Beyond recognizing vulnerability and learning to spot persuasion, invest-ors are encouraged to take specific proactive steps to protect themselves.One suggested step involves encouraging people to reduce their exposureto pitches. Some behaviors associated with fraud risk include openness toinformation and buying investments recommended by a friend, relative, co-worker, or neighbor (FINRA Investor Education Foundation 2007). Asnoted earlier in this chapter, targeting is highly predictive of investmentfraud victimization. In reducing their exposure to pitches, investors maylimit the number of fraud attempts to which they are exposed. Fraudprevention efforts also encourage investors to closely examine the back-ground of those trying to sell them investments, and the legitimacy of theinvestments themselves. This step can assist investors in verifying whetherthe tactic of source credibility is being used in a deceptive manner.A legitimate securities salesperson must be properly licensed, and his orher firm must be registered with FINRA, the SEC, or a state securitiesregulator (depending on the type of business the firm conducts). FINRA’sBrokerCheck provides information for investors checking the backgroundof broker-dealers, and the SEC’s Investment Advisor Public Disclosure(IAPD) database provides information on the background of investmentadvisors. The CFTC offers SmartCheck to help investors check backgrounds,as well. And each state has resources for helping investors research thebackground of investment professionals. The North American SecuritiesAdministrators Association (NASAA) is a one place to start to learn aboutstate-level investment fraud prevention efforts.
Regulators also recommend that investors check to be sure the invest-ment that he or she is being sold is properly registered with theSEC. Although not all investments are required to be registered, mostinvestments are—and if they are registered they can be found in the SEC’sEDGAR Database. Investors should be cautioned that there is an additionallevel of risk to investing in investments that are not registered with the SEC.
Evidence on the effectiveness of the fraud prevention education initiativesdescribed above is limited and is difficult to obtain. The FINRA InvestorEducation Foundation and AARP conducted two rounds of field tests in an
Understanding and Combating Investment Fraud 203

attempt to examine the effectiveness of a ninety-minute investor protectionprogram. Outsmarting Investment Fraud (OIF), a program developed by theFINRA Investor Education Foundation and AARP to help investors resistfraud, was tested in a quasi-experimental fashion. The OIF program empha-sizes the skills-building, investor protection strategy noted earlier in thischapter—accepting vulnerability, recognizing red flags, and taking simplesteps prior to investing. Individuals who attended the OIF workshop werecontacted three days later by a telemarketer who had experience with high-pressure sales, and the telemarketer asked if he could send the individualinformation about an oil and gas investment (oil and gas investments areoften rife with fraud). To serve as a control group, the telemarketer alsorandomly contacted individuals who were registered to attend the OIFprogram the following week but had not yet been exposed to the program.The results showed that individuals who received the OIF training weresignificantly less likely to respond to a fraud appeal than individuals whohad not received the training. Thirty-six percent of the control group agreedto send the telemarketer their contact information compared to 18 percentof the group that took the training—a significant improvement in resistanceto high-pressure investment sales (Shadel et al. 2010). In short, the field testdemonstrated that the OIF program—and the investor protection strategyon which it is developed—may change behavior and help protect investorsfrom fraud.Outbound call centers have also been used to proactively contact people
who might be at risk of lottery fraud and offer counseling to help thepotential victim avoid victimization. A study conducted by AARP and theUS Department of Justice (AARP 2003) found that the call centers wereeffective at reducing responsiveness to fraudulent pitches, and a follow-upfield study conducted by Stanford University found similar results (Scheibeet al. 2014). Yet, neither of these studies focused specifically on investmentfraud, so it is unclear if this approach would generalize to helping protectinvestors from investment fraud.
ConclusionsOur review of the literature suggests that investment fraud is a significantproblem in America. It is also a problem that may become worse as the BabyBoomers retire and significant assets move out of their employer-providedretirement plans. While several demographic characteristics are associatedwith fraud victims (e.g., age, sex, and income), it is unclear whether certaindemographic groups are more susceptible to investment fraud, more tar-geted by fraudsters, or both. Further, psychographic variables like risk
204 Financial Decision Making and Retirement Security

tolerance, financial literacy, and the inability to identify the red flags offraud are also associated with investment fraud victimization.
The science of social influence, which refers to how people change thethoughts, feelings, and behaviors of others through a variety of methods, hasbeen used to help explain how fraudsters con their victims. Phantom riches,source credibility, social consensus, reciprocity, and scarcity are all amongthe social influence tactics commonly used by fraudsters, and their effect-iveness at influencing behavior is supported by survey-based financial fraudresearch and experimental social psychological research. Educational ini-tiatives aimed at getting people to understand the social influence tacticsfraudsters use have been effective in increasing the ability of individuals toresist fraud pitches.
Given that the goal of many of the social influence tactics is to makepotential fraud victims emotional, and that emotions have been tied tocompromised financial decision making, one way to reduce the likelihoodof falling victim to investment fraud is to wait a period, such as 24 hours, afterbeing approached with an investment before making any investment deci-sions. This will enable potential victims’ emotions to subside and give themthe opportunity to discuss the possible investment with friends and family.Additional recommendations include checking the background of the per-son trying to sell you the investment and checking to see if the investment is aregistered investment. Nevertheless, more work needs to be done to under-stand if these educational initiatives and fraud prevention strategies arerobust across fraud types. In addition, policymakers and stakeholders mayneed to build a broader network of organizations to assist fraud victims—inpart due to the high level of re-victimization (Hume and Canan 2016). Forexample, organizations such as the National Center for Victims of Crime arebeginning to offer training to staff of adult protective services agencies,senior support groups, and other community-based consumer protectionorganizations, to build their capacity to assist fraud victims.
Research aimed at understanding the causes and consequences of fraud isin its early stages, so gaps in our knowledge exist. For instance, Deevy et al.(2012) posit a number of questions on a variety of topics that need to beaddressed, including more accurately measuring the prevalence and costs offinancial fraud, improving the reporting of financial fraud, assessing suscep-tibility to fraud, and identifying the motivations of fraudsters, to name a few.Since this list of research questions has been published, progress has alreadybeen made onmore accurately measuring the prevalence and costs of fraud.
A collaborative effort of the US Department of Justice’s Bureau of JusticeStatistics, the Stanford Center on Longevity, and the FINRA Investor Edu-cation Foundation is trying to more accurately categorize and measurefinancial fraud. Working in coordination with other organizations andresearchers, they have created a taxonomy of fraud that can be used to
Understanding and Combating Investment Fraud 205
categorize the many different types of financial frauds including investmentfraud (Beals et al. 2015). The goal of the project is to include a survey as asupplement to the Department of Justice’s National Crime VictimizationSurvey, which would provide researchers, policymakers, and stakeholderswith accurate baseline prevalence estimates of the various types of financialfraud and, potentially, an improved understanding of financial fraud. Inaddition, inclusion of fraud victimization questions in an upcoming wave ofthe Health and Retirement Study will provide researchers with a rich longi-tudinal data source to better understand the prevalence and predictors offinancial fraud. The increased attention that these projects and others likethem bring to the problem of investment fraud—and to financial fraud,more generally—offers promise that in the coming years researchers andpolicymakers will have a better understanding of investment fraud andeffective interventions for protecting investors.
Appendix
This Appendix contains information on the variables included in the regres-sion analyses that are reported in Table 10.2 and Table 10.3.
Dependent VariableRespondents were shown nine descriptions of financial offers, all of whichare known to be rife with fraud, but which were not identified as fraudulentin the descriptions—for example, lottery scams, oil and gas scams, and free-meal financial seminars. For each of these potentially fraudulent offers,respondents were asked whether they had ever been solicited with such anoffer, whether they had engaged with the offer (e.g., made an investment orresponded to the solicitor), and whether they had lost a significant amountof money after investing in the offer. Respondents who said they lost asignificant amount of money investing in at least one of the nine offerswere coded with a 1 to indicate they lost money in a potentially fraudulentactivity; all other respondents were coded with a 0.
Demographic Independent VariablesThe regressions included the following demographic variables.
(1) Age—measured continuously(2) Household income—greater than or equal to $50,000 = 1 otherwise 0
206 Financial Decision Making and Retirement Security

(3) Sex—male = 1 and female = 0(4) Education—college degree or higher = 1 otherwise 0(5) Marital status—married = 1 otherwise 0(6) Non-Asian minority—white and Asian = 0 otherwise 1(7) Presence of dependants in the household—dependants present = 1
otherwise 0(8) College educated—college degree or higher = 1 otherwise 0(9) Widow—widow = 1 otherwise 0
Psychographic Independent VariablesThe regressions included the following psychographic variables.
(1) Financial literacy—measured using a five-question financial literacyquiz of questions covering fundamental concepts of economics andfinance that may be encountered in everyday life, such as calculationsinvolving interest rates and inflation, principles relating to risk anddiversification, the relationship between bond prices and interestrates, and the impact that a shorter term can have on total interestrate payments over the life of the loan.
(2) Risk tolerance—measured by asking respondents how willing theyare to take investment risk (1 equals not at all willing and 10 equalsvery willing).
(3) Inability to identify common red flags of investment fraud—measured using a ten-point scale where 1 indicated that the respond-ent had no interest in a typically fraudulent advertising statement and10 indicated extreme interest (the mean of six ‘red flag’ advertisingstatements was used in the regression).
(4) Perception of debt—measured using a seven-point scale where 1indicated that they strongly disagreed with the statement ‘I havetoo much debt right now’ and 7 indicated that they strongly agreedwith this statement.
Targeting VariableThe regression included a variable that quantified the number of differentinvestment frauds that the respondent was targeted for. Targeting wasmeasured in the same manner that victimization was measured—that is, byshowing respondents nine descriptions of financial offers which are knownto be rife with fraud. For each of these potentially fraudulent offers,respondents were asked whether they had ever received such an offer.
Understanding and Combating Investment Fraud 207

Respondents who said they did—regardless of whether or not theyresponded to the offer or participated in the solicited investment—werecoded with a 1 to indicate they were solicited for the particular type of fraudbeing assessed, and 0 otherwise. The nine variables, one for each type offraud, were then summed and the measure of fraud solicitation could rangefrom 0 (never being solicited) to 9 (being solicited for all nine forms ofinvestment fraud examined).
Notes1. This chapter focuses on investment fraud, though much of the extant research
examines more general financial fraud. Complicating the issue further, someresearchers conflate the terms consumer fraud, personal fraud, telemarketingfraud, or fraud—often without providing explicit definitions. Research studiescited in this chapter cover all areas of fraud, but an attempt is made to focus oninvestment fraud. Further, when describing the results of a study, we typically usedthe same terminology that the authors use.
2. Financial elder abuse and elder financial exploitation are general terms thatinclude the financial targeting of older people, often by someone in a positionof trust. This chapter focuses on financial scams targeting all Americans, includ-ing the elderly, but does not focus specifically on older people or on differenttypes of abuse by someone in a position of trust. See DeLiema and Deevy(Chapter 9, this volume) for more information on financial elder abuse.
3. Unlike marginal probabilities, odds ratios are invariant to the values of theindependent variables (Liao 1994).
4. Survey respondents were asked if they were contacted to participate in or lostmoney in the following types of investment frauds: Cold Call Scam, Free LunchSeminar, Oil & Gas Scam, Promissory Note Scam, Pump & Dump, Pre-IPO Scam,High-Yield Investment Program Scam, Multi-Level Marketing, and Digital Cur-rency Purchase. For more information on the methodology used to collect thesedata, see FINRA Investor Education Foundation (2013a).
5. The results of these analyses are promising, but they suffer from two limitations.First, the survey methodology assumes that, in order to be victimized by invest-ment fraud, the respondent had to be targeted or solicited to participate in apotentially fraudulent investment. As a result, respondents who said they were notcontacted for fraud were not asked if they were ever victimized by fraud. Yet, it ispossible that victims actually sought out interaction with the person who ultim-ately defrauded them. Second, the survey questions asked if respondents had everbeen victimized by different types of investment fraud, so older respondentscould have been targeted and victimized by investment fraud more often thanyounger respondents, simply because they had more time to be targeted andvictimized. Nevertheless, research on memory decay suggests that respondents
208 Financial Decision Making and Retirement Security

cannot think back too far when recalling events, which may lessen the impact ofthis limitation (Jenkins et al. 2002).
6. The lack of evaluative reports might be attributed to the scarcity of time andresources for many of the campaigners, who likely have to focus on their otherprogram activities instead of extensive evaluation. They may also lack the researchexpertise to conduct evaluations. Further, while academia has a high demand forpublishing results, most non-profits have little incentive for making public anyevaluations which they do complete. Notable exceptions came from evaluations ofpublicly funded programs, academic case studies, and professional associationsworking to improve best practices.
ReferencesAARP (1996). Telemarketing Fraud Victimization of Older Americans: An AARP Survey.Washington, DC: AARP.
AARP (2003). Off the Hook: Reducing Participation in Telemarketing Fraud. Washington,DC: AARP.
AARP (2007). Stolen Futures: An AARP Washington Survey of Investors and Victims ofInvestment Fraud. Washington, DC: AARP.
AARP (2008). Consumer Fraud: A 2008 Survey of AARP Colorado Members’ Experiences andOpinions. Washington, DC: AARP.
AARP (2011). AARP Foundation National Fraud Victim Survey. Washington, DC: AARP.Anderson, K. (2004). Consumer Fraud in the United States: An FTC Survey. Washington,DC: Federal Trade Commission.
Anderson, K. (2007). Consumer Fraud in the United States: The Second FTC Survey.Washington, DC: Federal Trade Commission.
Anderson, K. (2013). Consumer Fraud in the United States, 2011: The Third FTC Survey.Washington, DC: Federal Trade Commission.
Asch, S. (1956). ‘Studies of Independence and Conformity: A Minority of OneAgainst a Unanimous Majority’. Psychological Monographs 70(9): 1–70.
Barber, B. and T. Odean (2001). ‘Boys Will Be Boys: Gender, Overconfidence, andCommon Stock Investment’. Quarterly Journal of Economics 116(1): 261–91.
Beals, M., M. DeLiema, and M. Deevy (2015). ‘Framework for a Taxonomy of Fraud’.Working Paper. Palo Alto, CA: Stanford Center on Longevity.
Brehm, S. and J. Brehm (1981). Psychological Reactance: A Theory of Freedom and Control.New York: Academic Press.
Button, M., C. Lewis, and J. Tapley (2014). ‘Not a Victimless Crime: The Impact ofFraud on Individual Victims and Their Families’. Security Journal 27(1): 36–54.
Castle, E., N. Eisenberger, T. Seeman, W. Moons, I. Boggero, M. Grinblatt, andS. Taylor (2012). ‘Neural and Behavioral Bases of Age Differences in Perceptionsof Trust’. Proceedings of the National Academy of Sciences 109(51): 20848–52.
Cialdini, R. (2001). Influence: Science and Practice. Boston, MA: Allyn & Bacon.Consumer FraudResearchGroup (2006). Investor Fraud Study Final Report. Washington,DC: NASD Investor Education Foundation.
Understanding and Combating Investment Fraud 209

Deevy, M. and M. Beals (2013). ‘The Scope of the Problem: An Overview of FraudPrevalence Measurement’. Working Paper. Palo Alto, CA: Stanford Center onLongevity.
Deevy, M., S. Lucich, and M. Beals (2012). ‘Scams, Schemes and Swindles: A Reviewof Consumer Financial Fraud Research’. Working Paper. Palo Alto, CA: StanfordCenter on Longevity.
DeLiema, M. (2015). ‘Using Mixed Methods to Identify the Characteristics of OlderFraud Victims’. Unpublished dissertation. Los Angeles, CA: University of SouthernCalifornia.
Federal Bureau of Investigation (2014). Fraud Target: Senior Citizens. Washington,DC: FBI.
FINRA (2015). 2015 Exam Letter. Washington, DC: FINRA.FINRAInvestorEducationFoundation (2007).National Risk Behavior Study.Washington,DC: FINRA Foundation.
FINRA Investor Education Foundation (2013a). Financial Fraud and Fraud Suscepti-bility in the United States. Washington, DC: FINRA Foundation.
FINRA Investor Education Foundation (2013b). Financial Capability in the UnitedStates: Report of Findings from the 2012 National Financial Capability Study. Washington,DC: FINRA Foundation.
FINRA Investor Education Foundation (2015). Non-Traditional Costs of FinancialFraud. Washington, DC: FINRA Foundation.
Gamble, K., P. Boyle, L. Yu, and D. Bennett (2014). ‘The Causes and Consequencesof Financial Fraud Among Older Americans’. Working Paper. Boston, MA: BostonCollege Center for Retirement Research.
Ganzini, L., B. McFarland, and J. Bloom (1990). ‘Victims of Fraud: ComparingVictims of White Collar and Violent Crime’. Journal of the American Academy ofPsychiatry and the Law Online 18(1): 55–63.
Gouldner, A. (1960). ‘The Norm of Reciprocity: A Preliminary Statement’. AmericanSociological Review 25(2): 161–78.
Graham, W. (2014). A Quantitative Analysis of Victims of Investment Crime. London:Financial Conduct Authority.
Hume, C. and S. Canan (2016). Older Consumers Targeted by Fraudsters Not Once, ButTwice! Consumer Financial Protection Bureau [website]. <http://www.consumerfinance.gov/about-us/blog/older-consumers-targeted-by-fraudsters-not-once-but-twice>.
Jenkins, P., G. Earle-Richardson, D. Slingerland, and J. May (2002). ‘TimeDependent Memory Decay’. American Journal of Industrial Medicine 41(2): 98–101.
Job, S. (1988). ‘Effective and Ineffective Use of Fear in Health Promotion Cam-paigns’. American Journal of Public Health 78(2): 163–7.
Kahneman, D. and A. Tversky (1979). ‘Prospect Theory: An Analysis of DecisionUnder Risk’. Econometrica 47(2): 263–92.
Kerley, K. and H. Copes (2002). ‘Personal Fraud Victims and Their OfficialResponses to Victimization’. Journal of Police and Criminal Psychology 17(1):19–35.
Kircanski, K., N. Notthoff, D. Shadel, G. Mottola, L. Carstensen, and H. Gotlib(2016). ‘Emotional Arousal Increases Susceptibility to Fraud in Older Adults’.Working Paper. Palo Alto, CA: Stanford Center on Longevity.
210 Financial Decision Making and Retirement Security

Knutson, B. and G. Samanez-Larkin (2014). ‘Individual Differences in Susceptibilityto Investment Fraud’. Working Paper. Palo Alto, CA: Stanford University.
Lee, J. and H. Soberon-Ferrer (1997). ‘Consumer Vulnerability to Fraud: InfluencingFactors’. Journal of Consumer Affairs 31(1): 70–89.
Lerner, J., D. Small, and G. Loewenstein (2004). ‘Heart Strings and Purse Strings:Carryover Effects of Emotions on Economic Decisions’. Psychological Science 15(5):337–41.
Liao, T. (1994). Interpreting Probability Models: Logit, Probit, and Other Generalized LinearModels. London: Sage.
Loewenstein, G., E. Weber, C. Hsee, and N. Welch (2001). ‘Risk as Feelings’.Psychological Bulletin 127(2): 267–86.
Lusardi, A. and O. Mitchell (2006). ‘Baby Boomer Retirement Security: The Roles ofPlanning, Financial Literacy, and Housing Wealth’. Journal of Monetary Economics54(1): 205–24.
McCannon, T., C. Asaad, and M. Wilson (2015). ‘Financial Competence, Overcon-fidence, and Trusting Investments: Results from an Experiment’. Journal of Eco-nomic Finance 40(3): 590–606.
Milgram, S. (1965). ‘Some Conditions of Obedience and Disobedience to Authority’.Human Relations 18(1): 57–76.
Milgram, S. (1974). Obedience to Authority. New York: Harper & Row.Mottola, G. (2015). A Snapshot of Investor Households in America, Washington, DC:FINRA Foundation.
Myers, D. (1993). Social Psychology. New York: McGraw-Hill.Organisation for Economic Co-operation and Development (2005). ‘ExaminingConsumer Policy: A Report on Consumer Information Campaigns ConcerningScams’. OECD Digital Economy Working Papers No. 103. Paris: OECD.
Pratkanis, A. (2007). ‘Social Influence Analysis: An Index of Tactics’. In A. Pratkanis(ed.), The Science of Social Influence: Advances and Future Progress. New York: Psych-ology Press, pp. 17–82.
Pratkanis, A. and P. Farquhar (1992). ‘A Brief History of Research on PhantomAlternatives: Evidence for Seven Empirical Generalizations about Phantoms’.Basic and Applied Social Psychology 13(1): 103–22.
Rhoades, L. and R. Eisenberger (2002). ‘Perceived Organizational Support:A Review of the Literature’. Journal of Applied Psychology 87(4): 698–714.
Ross, M., I. Grossmann, and E. Schryer (2014). ‘Contrary to Psychological andPopular Opinion, There is no Compelling Evidence that Older Adults are Dispro-portionately Victimized by Consumer Fraud’. Perspectives on Psychological Science9(4): 427–42.
Scheibe, S., N. Notthoff, J. Menkin, L. Ross, D. Shadel, M. Deevy, and L. Carstensen(2014). ‘Forewarning Reduces Fraud Susceptibility in Vulnerable Consumers’.Basic and Applied Social Psychology 36(3): 272–9.
Schoepfer, A. and N. Piquero (2009). ‘Studying the Correlates of Fraud Victimizationand Reporting’. Journal of Criminal Justice 37(2): 209–15.
Securities and Exchange Commission, North American Securities AdministratorsAssociation, and the Financial Industry Regulatory Authority (2007). ProtectingSenior Investors: Report of Examinations of Securities Firms Providing Free Lunch SalesSeminars. Washington, DC: Securities and Exchange Commission.
Understanding and Combating Investment Fraud 211

Shadel, D., K. Pak, and J. Gannon (2010). ‘The Effects of Investment FraudWorkshopson Future Investor Resistance’. Presentation at National Academy of Sciencesmeeting on Elder Mistreatment and Abuse and Financial Fraud,Washington, DC,June 22.
Shadel, D., K. Pak, J. Mathisen, B. Carlson, and J. Edwards (2007). Inside the Con ManMind: Advanced Training for Fraud Fighters. Seattle, WA: AARP.
Titus, R., F. Heinzelmann, and J. Boyle (1995). ‘Victimization of Persons by Fraud’.Crime and Delinquency 41(1): 54–72.
Van Dijk, J., J. Van Kesteren, and P. Smit (2007). Criminal Victimisation in InternationalPerspective: Key Findings from the 2004–2005 ICVS and EU ICS. The Hague: Ministry ofJustice, Wetenschappelijk Onderzoeken Documentatiecentrum.
Van Wyk, J. and M. Benson (1997). ‘Fraud Victimization: Risky Business or Just BadLuck?’ American Journal of Criminal Justice 21(2): 163–79.
West, S. (1975). ‘Increasing the Attractiveness of College Cafeteria Food:A Reactance Theory Perspective’. Journal of Applied Psychology 60(5): 656–8.
Worchel, S., J. Lee, and A. Adewole (1975). ‘The Effects of Supply and Demand onRatings of Object Value’. Journal of Personality and Social Psychology 32(5): 906–14.
Zimmerman, G., C. Olsen, and M. Bosworth (2000). ‘A Stages of Change Approachto Helping Patients Change Behavior’. American Family Physician 61(5): 1409–16.
212 Financial Decision Making and Retirement Security