Embed Size (px)
Citation preview

Contents lists available at ScienceDirect
Geothermics
journal homepage: www.elsevier.com/locate/geothermics
Understanding amorphous silica scaling under well-constrained conditionsinside geothermal pipelines
Daniela B. van den Heuvela,⁎, Einar Gunnlaugssonb, Ingvi Gunnarssonb, Tomasz M. Stawskia,c,Caroline L. Peacocka, Liane G. Benninga,c,d
a Cohen Geochemistry Group, School of Earth and Environment, University of Leeds, Leeds, LS2 9JT, UKb Reykjavik Energy, Bæjarhals 1, 110, Reykjavik, IcelandcGerman Research Center for Geosciences, GFZ, 14473, Potsdam, Germanyd Department of Earth Sciences, Free University of Berlin, 12249, Berlin, Germany
A R T I C L E I N F O
Keywords:SilicaGeothermal energyPrecipitationMineral scalingSilica sinter
A B S T R A C T
Amorphous silica is a common precipitate in modern and ancient hot springs and in geothermal power plants,yet the corresponding precipitation rates and mechanisms are still highly debated, primarily due to the plethoraof parameters that can affect the reactions in natural waters. Here, we report the results from a first ever in-dustrial-scale time-resolved (1 day to 10 weeks) study of silica precipitation conducted at the Hellisheiði geo-thermal power plant (SW-Iceland). We show that such in-work pipelines of a geothermal power plant are idealenvironments to investigate silica precipitation because the physicochemical conditions are well constrained andconstantly monitored. Our results document that amorphous silica forms via two distinct precipitation modes:(1) the fast deposition of continuous botryoidal silica layers and (2) the growth of 3D fan- or ridge-shaped silicaaggregates. The continuous layers grow by heterogeneous nucleation and subsequent surface controlled growthby monomer addition. In contrary, the 3D aggregates form through homogeneous nucleation of silica nano- andmicroparticles in solution, followed by deposition and cementation on the surface of the botryoidal layer. Fromthe time-resolved data, silica precipitation rates of over 1 g m−2 day-1 are derived. Over time, this deposition ofsilica on pipelines and fluid handling equipment is detrimental to geothermal power production. Our data doesnot only help improve our understanding of silica precipitation from geothermal fluids, but the determined silicaprecipitation mechanisms and rates help improve mitigation strategies against silica scaling inside in-workgeothermal power plants.
1. Introduction
Silica (SiO2) is the most common chemical compound in the Earth’scrust and a major component in most geothermal reservoirs. Themaximum concentration of silica in geothermal fluids depends on thereservoir temperature and is controlled by quartz solubility or, if thetemperature is below 110 °C, by the solubility of chalcedony(Arnórsson, 1975; Fournier and Rowe, 1966). When these geothermalfluids rise through the crust and emerge at the Earth’s surface, rapidcooling results in supersaturation with respect to amorphous silica andprecipitation. This sinter formation was studied in numerous modernand ancient terrestrial settings (Braunstein and Lowe, 2001; Cady andFarmer, 1996; Handley et al., 2005; Jones and Renaut, 2004; Konhauseret al., 2004, 2001; Mountain et al., 2003; Tobler et al., 2008) and re-cently, evidence for ancient silica sinter formation has even been
documented on Mars (Preston et al., 2008).Identical to their natural analogues, amorphous silica precipitation
also occurs in geothermal power plants, where fluids are rapidly cooledduring energy production, resulting in precipitation of amorphous si-lica. This so called “silica scaling” is common in high-enthalpy geo-thermal power plants around the world e.g. Iceland, New Zealand,Japan, the USA, the Lesser Antilles and El Salvador (Dixit et al., 2016;Gunnarsson and Arnórsson, 2003, 2005; Harrar et al., 1982; Meieret al., 2014; Mroczek et al., 2017; Padilla et al., 2005; Rothbaum et al.,1979; Yokoyama et al., 1993). In such systems, amorphous silica pre-cipitation occurs in fluids characterized by a wide range of total silicaconcentrations (250–900mg/L), temperatures (20–200 °C), pH(7.2–10.2), total dissolved solid concentrations (1300–93′000mg/L)and different types of geothermal power plants (e.g. flash steam andbinary). Because of the ubiquity and importance of this natural process
https://doi.org/10.1016/j.geothermics.2018.07.006Received 30 November 2017; Received in revised form 23 April 2018; Accepted 5 July 2018
⁎ Corresponding author. Current address: Rock-Water Interaction Group, Institute of Geological Sciences, University of Bern, 3012, Bern, Switzerland.E-mail address: [email protected] (D.B. van den Heuvel).
Geothermics 76 (2018) 231–241
Available online 07 August 20180375-6505/ © 2018 Elsevier Ltd. All rights reserved.
T

to renewable energy production and sinter formation, amorphous silicaprecipitation was studied extensively in the laboratory. Amorphous si-lica forms via the condensation of silica monomers (H4SiO4) into Si-O-Sibonds (Iler, 1979), through polymerisation that can either occur at aninterface (e.g., minerals, bacteria or plant matter) where it is describedas “heterogeneous nucleation” or in the bulk fluid (“homogeneous nu-cleation”) (Benning and Waychunas, 2007). In both cases, once silicanuclei have reached a critical size (< 0.5 to 2 nm, Iler, 1979; Nogueraet al., 2015; Tobler et al., 2009), they grow spontaneously by the ad-dition of silica from solution. Monomers are the dominant growthspecies (Bohlmann et al., 1976; Bremere et al., 2000; Mroczek andMcDowell, 1988) due to their predominantly neutral charge (Ka
∼10−8.8 at 120 °C) (Fleming and Crerar, 1982; Seward, 1974) in theslightly alkaline pH regime of silica-rich geothermal waters. In contrast,silica polymers and nuclei have a higher dissociation constant (Ka> 10-8) (Dugger et al., 1964; Hair and Hertl, 1970), resulting in an overallnegative surface charge. Their attachment to existing silica particles orsurfaces and the aggregation of silica particles in solution in the absenceof bridging cations will thus be limited by electrostatic repulsion. Ex-perimental evidence showed that silica polymerisation, nucleation andgrowth are enhanced at slightly alkaline pH, elevated temperature,medium to high ionic strength (especially the presence of Al and Fe)and high total silica concentrations (Alexander et al., 1954; Creraret al., 1981; Fleming, 1986; Gallup, 1997; Goto, 1956; Gunnarsson andArnórsson, 2005; Icopini et al., 2005; Iler, 1979; Kitahara, 1960; Toblerand Benning, 2013; Weres et al., 1981).
These physicochemical factors also affect amorphous silica pre-cipitation from naturally occurring geothermal fluids, where they are incompetition with one another and it is often difficult to isolate thedominant parameter in any given fluid. In addition, microbial activityin hot springs (Mountain et al., 2003; Tobler et al., 2008) and high flowrates in geothermal power plants (Meier et al., 2014) make the un-derstanding of these systems highly challenging. Therefore, most la-boratory findings cannot be directly transferred and applied to silicaprecipitation from natural geothermal fluids (Carroll et al., 1998) andalthough a number of field studies investigating silica sinter formationaround hot springs (e.g. Braunstein and Lowe, 2001; Handley et al.,2005; Jones and Renaut, 2004; Konhauser et al., 2004; Mountain et al.,2003; Tobler et al., 2008) give insights into what happens once geo-thermal solutions reach the Earth surface, they do not address processesthat govern formation of amorphous silica inside geothermal powerplants. This is despite the fact that in-production geothermal powerplants represent systems with very well constrained physicochemicalconditions that are thus ideal sites to investigate silica precipitation.Such studies would not just help quantify real world silica precipitationbut would also inform silica scaling mitigation strategies, thus im-proving efficiency of geothermal energy production and reduce costs.
The main reason for the dearth of on-site studies lies in the diffi-culties in accessing both fluids and silica scales during energy produc-tion, without affecting normal operations. A few studies aimed to cir-cumvent these problems by conducting experiments in bypass systemsfrom the main production (Carroll et al., 1998; Dixit et al., 2016; Harraret al., 1982; Mroczek et al., 2017; Rothbaum et al., 1979). However, theconditions in such bypass systems are most often markedly differentfrom inside in-work pipelines and the bypass is often less well con-strained, resulting in data that are only partly applicable to the in-production systems.
To change this landscape, we have for the first time conducted adetailed study inside actual in-work geothermal pipelines of a highenthalpy geothermal power plant at Hellisheiði, SW-Iceland. We mon-itored silica precipitation for up to 10 weeks using stainless steel scalingplates deployed at different positions within the pipelines and char-acterized the precipitated solids, as well as fluid composition and thephysicochemical conditions, under which precipitation occurred. Ourresults reveal that two largely independent pathways control silicaprecipitation. We observe the formation of a continuous, botryoidal
layer of silica on the scaling plate surfaces and the growth of 3Dstructures consisting of silica particles that nucleate homogeneously inthe fast travelling fluid and are then deposited and cemented to thesilica layer. Through this work, we evaluate the first ever amorphoussilica precipitation rates and mechanisms inside in operando pipelinesof an active geothermal power plant.
2. Materials and methods
2.1. Field deployments
The time-resolved deposition of amorphous silica was studied onstainless steel scaling plates (5.4× 2–2.5 cm) deployed for between 1day and 10 weeks (Table 1) at four different locations within the pi-pelines of the Hellisheiði power plant (Fig. 1): (1) several metres beforethe heat exchangers, (2) several metres after the heat exchangers, (3)several tens of metres downstream of location 2, after a bypass withfluid that had not passed through the heat exchangers that then re-joined the main pipeline and before mixing with condensed steam(equivalent to almost pure water) and (4) ∼1300m downstream fromlocation 3, at the Húsmúli re-injection site. These locations were chosenbecause they differed with respect to physicochemical conditions of thefluid (temperature, flow rate, silica concentration etc.) thus allowing usto study how these parameters affected silica precipitation. It is worthnoting that due to operational constraints the time resolved deploy-ments were not done in order of deployment length (Table 1).
At each location, scaling plates made from S316 stainless steel(Fig. 1B–D) were attached to a sampling rod and inserted into the fastflowing geothermal fluid through valves in the pipeline walls. Thesurfaces of the plates were aligned to be parallel to the flow. The powerplant operators monitor the temperatures and flow rates at each of thechosen sampling locations hourly to identify changes in productionparameters and as a guide for when maintenance (e.g., heat exchangercleaning) is required. These continuous datasets helped make sure thatthe scaling plate deployments were started/finished during periodswhere no maintenance was required. At the end of each deployment,the plates were removed from the fluid, gently rinsed with distilledwater to prevent the precipitation of salts during evaporation of thegeothermal fluid and then dried at 40 °C for up to 16 h. For short de-ployments (1 day, 3 days and 1 week), the scaling plates were weightedpre- and post-deployment in order to determine the mass of precipitatedsilica. For deployments of 2 weeks or longer this was not consideredfeasible as in most cases larger amounts of silica precipitated on theplates and some of the accumulated silica would have been either lostbecause of the fast fluid flow rates (fluid flow 280 to 430 L/s) or duringscaling plate handling post removal.
At the beginning and end of each deployment, the fluid at eachlocation was sampled. It was cooled down to ambient values (21–27 °C)using a ∼5m stainless steel coil and temperature and pH were
Table 1Duration and starting/end dates of individual scaling plate deployments. Thecleaning of the heat exchangers in early October 2014 (after the 10 week andbefore the 2 week deployment) was part of regular (every 4–6 months) andscheduled maintenance at the Hellisheiði power plant to remove the accumu-lated silica scales.
Deployment [days] Start date End date
1 day 1 02/02/2015 03/02/20153 days 3 16/03/2015 19/03/20151 week 7 27/10/2014 03/11/20142 weeks 14 03/11/2014 17/11/20144 weeks 28 23/06/2014 21/07/20146 weeks 41 03/02/2015 16/03/201510 weeks 72 21/07/2014 01/10/2014Cleaning of heat exchangers 06/10/2014 07/10/2014
D.B. van den Heuvel et al. Geothermics 76 (2018) 231–241
232

measured using a Metrohm Aquatrode plus pH electrode with a ther-mocouple. Fluid samples were then collected into two Teflon gassampling bulbs (300mL, rinsed 3x with separated water before use),assuring no air remained trapped within the bulbs. These samples wereused for analysis of dissolved CO2 and H2S. Subsequently a stainlesssteel holder containing single-use 0.2 μm polycarbonate filter mem-branes (Whatman®) was used to collect filtered fluid samples. Thesesamples were divided into three different aliquots. For cation analyses,aliquots were transferred into 120mL into Nalgene bottles containing2.5 mL of ultrapure HNO3 while for anions, 60mL of the filtered geo-thermal fluid were transferred into pre-cleaned Nalgene bottles. At se-lected time points, 5 mL of the filtered waters were in addition trans-ferred into Nalgene bottles containing 20mL of MilliQ water foranalysis of monomeric silica contents. The dilution ensures that furtherpolymerisation of silica is prevented. After collection, the samples werestored at 3–6 °C for maximum 2 days before analysis of the dissolvedgases and monomeric silica and for maximum 3 weeks for the analysisof cations or anions. Finally, at locations 1 to 3, two litres of separatedwater were filtered through ten pre-weighted 0.2 μm polycarbonatemembranes to assess particles load, and separate 0.2 μm polycarbonatemembranes were used to filter 100mL to assess particle sizes, shapesand distribution via electron microscopic imaging All membranes weredried at 40 °C for ∼16 h and re-weighed.
2.2. Analyses of separated water
Chloride was analysed by ion chromatography (IC) using aThermoscientific Dionex system DX600, equipped with a AG16(2× 5mm) and AS16 (2×250mm) column, with an analytical un-certainty of± 5%, based on multiple standard measurements. The
concentrations of the major cations (Al, Ca, K, Na, Si) were analysed byinductively coupled plasma optical emission spectrometry (ICP-OES,Thermo Scientific iCAP7400; analytical uncertainty of< 4% based onmultiple standard measurements) while the trace cations (Mg, Fe) wereanalysed by inductively coupled plasma mass spectrometry (ICP-MS,Thermo Scientific iCAPQc; analytical uncertainty of< 3% based onmultiple standard measurements).
The concentrations of dissolved CO2 and H2S were analysed by totalalkalinity titration (Metrohm 905 Titrando equipped with a MetrohmAquatrode plus) and titration with mercury acetate using dithizone asan indicator, respectively (Arnórsson et al., 2006). The analytical un-certainties are± 1% for total alkalinity titration and± <0.1% fortitration of H2S. The monomeric silica content was analysed based onthe method described by Gunnarsson et al. (2010) using a JENWAY6300 spectrophotometer. In addition to total and monomeric silica,“polymeric” silica was determined by subtracting the concentration ofmonomeric silica from the total silica concentration (< 0.2 μm filteredfraction).
2.3. Analyses of precipitates on scaling plates and filter membranes
The materials deposited on the scaling plates and filter membraneswere analysed by field emission gun scanning electron microscopy(FEG-SEM, FEI Quanta 650 at 15 keV, coated with ∼40 nm of gold).Selected, non-coated filter membranes were also imaged at ultra-highresolution, using a low kV cold-field emission scanning electron mi-croscope (CFE-SEM, Hitachi SU8230 at 2 kV). The FEG-SEM imageswere used to determine the dimensions of the observed structures bymeasuring widths and lengths of 70–100 structures or particles that hadformed or were deposited in the top side of each plate or filter
Fig. 1. System schematic of the Hellisheiði geothermal power plant (A) indicating the four sampling locations (stars) at which the scaling plates (B) were immersed.FEG-SEM images (C & D) showing the irregular texture of the steel surfaces before deployment.
D.B. van den Heuvel et al. Geothermics 76 (2018) 231–241
233
manually.The elemental composition of the precipitates was determined by
energy dispersive spectroscopy (EDS; AZtec software, OxfordInstruments, Version 2.2). From the scaling plates onto which enoughmaterial had precipitated, material was scraped off and analysed by X-ray diffraction (XRD; Bruker D8 diffractometer, CuKα1; 5–90° 2θ; 0.01°/step; data evaluation by the EVA software, Bruker, Version 3.0). XRDanalyses of the materials on the filter membranes was done with thefilters glued directly onto the XRD silicon holders.
The internal structure, composition and thickness of the precipitateson the scaling plates from location 1 were investigated via two ap-proaches. For high resolution work, sections (15× 10×0.15 μm) wereprepared by focused ion beam (FIB) milling at the German ResearchCenter for Geosciences (GFZ) Potsdam, Germany from the 1 day, 3 dayand 1 week scaling plates following the method described by Wirth(2009). The FIB foils were analysed using a high-resolution transmis-sion electron microscope (HR-TEM, TECNAI F20 X-Twin, 200 kV) atGFZ equipped with a Gatan Tridiem Imaging Filter and an EDAX X-rayanalyser. Secondly, all scaling plates from location 1 (1 day to 10weeks) were embedded in epoxy resin, cut along the width of thescaling plates and polished before being imaged by FEG-SEM as de-scribed above.
2.4. Geochemical simulations
The composition of the separated waters as well as the measured pHand temperatures were used as input parameters for geochemical si-mulations using PHREEQC (version 3.0, Parkhurst and Appelo, 2013)with the phreeqc.dat database, updated with the thermodynamic datafor amorphous silica solubilities from Gunnarsson and Arnórsson(2000). Simulations were conducted to derive the in-situ pH and Ehconditions and the saturation indices (SI) of the compounds of interestin the geothermal fluid.
2.5. Determination of precipitation rates
The precipitation rates were evaluated via two approaches: (1) wequantified the amount of material deposited on each plates (in mg)from the 1 day, 3 day and 1 week deployments at each location and (2)we measured the average thickness of the precipitation layer for the 1
week and longer deployments at location 1 only.For the first approach, the precipitated amount was measured by
weighting of the scaling plates before and after the deployments andconverted to a volume using a density of ρSiO2 = 2.25mg/mm3 for ahigh density vitreous silica scale (Mroczek et al., 2011). Assuming thatthe layers were all made of silica and that they were of roughly constantthickness around the plate, the thickness of the precipitates was cal-culated. We then used the mass of silica precipitated and the surfaceareas of the individual scaling plates to calculate precipitation rates.Based on an average precipitation rate determined for the deploymentsup to 1 week, the thickness of the precipitated silica layer was calcu-lated from linear extrapolations for the longer deployments. In order toevaluate the validity of such a linear extrapolation, the thickness ofsilica layers on all plates from location 1 (from 1 to 10 weeks) weremeasured on the FIB sections and the epoxy-embedded samples by HR-TEM and FEG-SEM respectively (as described above). The thickness ofeach precipitated silica layer was measured at multiple locationsaround each plate (n= 36–113) to derive an average value. Using thesame ρSiO2 = 2.25mg/mm3, the mass of silica was calculated andconverted to a precipitation rate.
3. Results
3.1. Composition of separated water
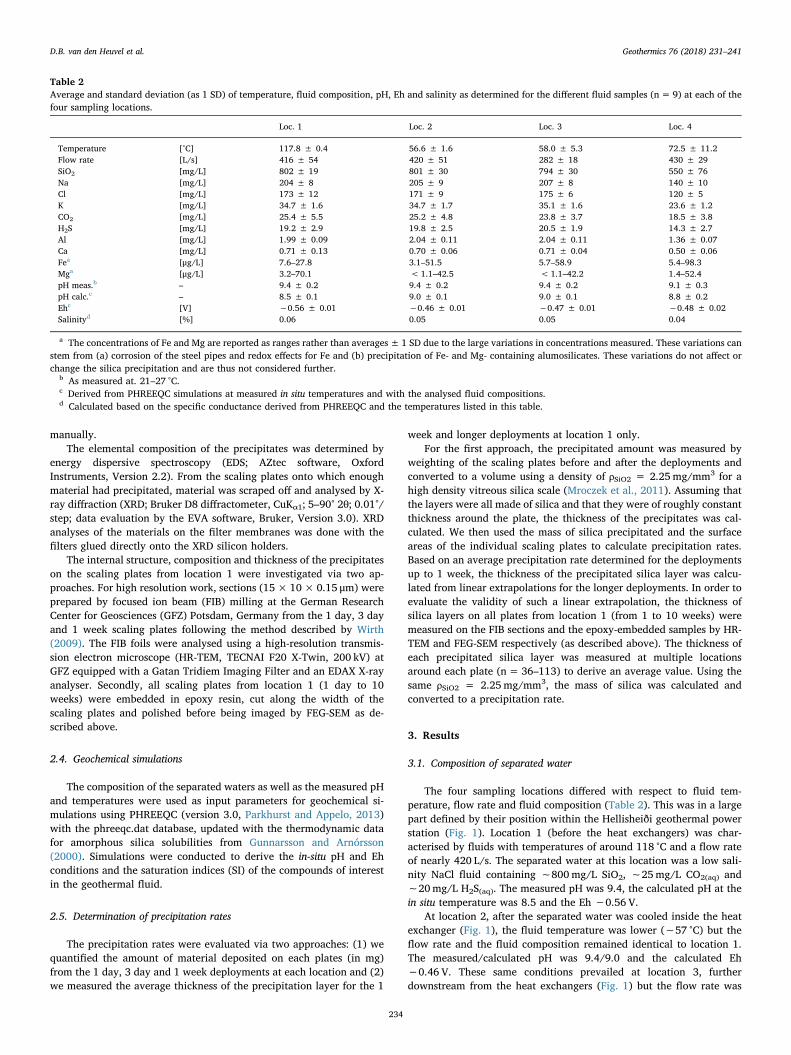
The four sampling locations differed with respect to fluid tem-perature, flow rate and fluid composition (Table 2). This was in a largepart defined by their position within the Hellisheiði geothermal powerstation (Fig. 1). Location 1 (before the heat exchangers) was char-acterised by fluids with temperatures of around 118 °C and a flow rateof nearly 420 L/s. The separated water at this location was a low sali-nity NaCl fluid containing ∼800mg/L SiO2, ∼25mg/L CO2(aq) and∼20mg/L H2S(aq). The measured pH was 9.4, the calculated pH at thein situ temperature was 8.5 and the Eh −0.56 V.
At location 2, after the separated water was cooled inside the heatexchanger (Fig. 1), the fluid temperature was lower (∼57 °C) but theflow rate and the fluid composition remained identical to location 1.The measured/calculated pH was 9.4/9.0 and the calculated Eh−0.46 V. These same conditions prevailed at location 3, furtherdownstream from the heat exchangers (Fig. 1) but the flow rate was
Table 2Average and standard deviation (as 1 SD) of temperature, fluid composition, pH, Eh and salinity as determined for the different fluid samples (n=9) at each of thefour sampling locations.
Loc. 1 Loc. 2 Loc. 3 Loc. 4
Temperature [°C] 117.8 ± 0.4 56.6 ± 1.6 58.0 ± 5.3 72.5 ± 11.2Flow rate [L/s] 416 ± 54 420 ± 51 282 ± 18 430 ± 29SiO2 [mg/L] 802 ± 19 801 ± 30 794 ± 30 550 ± 76Na [mg/L] 204 ± 8 205 ± 9 207 ± 8 140 ± 10Cl [mg/L] 173 ± 12 171 ± 9 175 ± 6 120 ± 5K [mg/L] 34.7 ± 1.6 34.7 ± 1.7 35.1 ± 1.6 23.6 ± 1.2CO2 [mg/L] 25.4 ± 5.5 25.2 ± 4.8 23.8 ± 3.7 18.5 ± 3.8H2S [mg/L] 19.2 ± 2.9 19.8 ± 2.5 20.5 ± 1.9 14.3 ± 2.7Al [mg/L] 1.99 ± 0.09 2.04 ± 0.11 2.04 ± 0.11 1.36 ± 0.07Ca [mg/L] 0.71 ± 0.13 0.70 ± 0.06 0.71 ± 0.04 0.50 ± 0.06Fea [μg/L] 7.6–27.8 3.1–51.5 5.7–58.9 5.4–98.3Mga [μg/L] 3.2–70.1 < 1.1–42.5 < 1.1–42.2 1.4–52.4pH meas.b – 9.4 ± 0.2 9.4 ± 0.2 9.4 ± 0.2 9.1 ± 0.3pH calc.c – 8.5 ± 0.1 9.0 ± 0.1 9.0 ± 0.1 8.8 ± 0.2Ehc [V] −0.56 ± 0.01 −0.46 ± 0.01 −0.47 ± 0.01 −0.48 ± 0.02Salinityd [%] 0.06 0.05 0.05 0.04
a The concentrations of Fe and Mg are reported as ranges rather than averages± 1 SD due to the large variations in concentrations measured. These variations canstem from (a) corrosion of the steel pipes and redox effects for Fe and (b) precipitation of Fe- and Mg- containing alumosilicates. These variations do not affect orchange the silica precipitation and are thus not considered further.
b As measured at. 21–27 °C.c Derived from PHREEQC simulations at measured in situ temperatures and with the analysed fluid compositions.d Calculated based on the specific conductance derived from PHREEQC and the temperatures listed in this table.
D.B. van den Heuvel et al. Geothermics 76 (2018) 231–241
234

much lower (∼280 L/s) due to the differences in pipe geometry. Justafter location 3, steam condensate was added to the fluid (around 0.4 Lof condensate per 1 L of separated water). The condensate was hotterthan the separated water, thus the temperature of the fluid at location 4was higher (∼73 °C). The addition of the condensate downstream oflocation 3 and differences in pipe geometry resulted in the highestmeasured flow rate (Table 2). The biggest effect of the mixing withcondensate (= almost pure water) was on the chemistry as it resulted inthe concentrations of all fluid components and the pH being lower atlocation 4.
The saturation index calculations revealed that the separated waterswere supersaturated with respect to amorphous silica at all locations(Table 3). The total silica reported in Table 2 represents the sum of allsilica species: monomers (H4SiO4), oligomers/polymers (dimers, tri-mers, tetramers etc.) and (nano) particulate silica< 0.2 μm. Parti-tioning the various silica species reveals that in all cases monomericsilica was by far the dominant component (Table 3). The proportion ofmonomeric silica decreased along the flow path from 85% down to 75%from location 1 to 3. At the same time, the proportion of polymericsilica increased from 15 to 25% due to continuous polymerisation. Atlocation 4, the dilution by the addition of steam condensate caused thepercentage of monomeric silica to increase to 86%.
XRD analyses and imaging of the filter residues revealed that theyconsisted of amorphous silica particles. The proportion of particulatesilica retained by the filter membranes, as evaluated from the differencein weight of the filters, accounted for less than 0.05% of the total silica(Table 3) at all locations. The particles on the filters had a mean dia-meter identical or smaller than the pore sizes of the filter membranes(0.2 μm), yet particle sizes varied between<0.1 μm and in some ex-ceptional cases over 20 μm. The particles could be subdivided into twogroups: (1) particles with a relatively smooth surface (Fig. 2A & B,marked a) and (2) particles consisting of aggregates of much smallerand rougher surfaced particles (0.01–0.05 μm; Fig. 2A & B, marked b).In addition, at locations 1 to 3, a few platy Al-Si containing phases wereidentified (Fig. 2A) by FEG-SEM EDS and confirmed as alumosilicates,specifically clinochlor by XRD. At location 4, silica particles were veryrare and the abundance of chlorite minerals such as chamosite andclinochlore and the magnesium silicate sepiolite (identified by XRD,FEG-SEM EDS analyses and PHREEQC simulations) was high (Fig. 2C).
3.2. Composition and structure of precipitates on scaling plates
The majority of the precipitates on the deployed scaling plates wereidentified as amorphous silica by XRD and EDS spot analyses. Theseamorphous silica precipitates were rarely interspersed with other mi-neral and metal flakes, identified as alumosilicates (based on FEG-SEMEDS) and in some samples confirmed to be clinochlore (by XRD). Inaddition to these alumosilicates, EDS analyses also revealed that thesilica was not pure but most often peaks for various ions from thegeothermal fluid (Na, Cl, S, Al, Fe etc.) were observed associated withthe silica precipitates.
The scaling plates were completely covered by a layer of amorphoussilica, even after just 1 day. This layer was very dense and it lacked anyinternal structure (Fig. 3A & B). The average thickness of the silica layerwas the same around each plate and no differences between the in-dividual faces of the plates (top vs. bottom, main face vs. edge) wereobserved. The layer thickness increased over time; for example, it in-creased from 0.3 μm to> 20 μm over 10 weeks on the plates deployedat location 1. The surface of the precipitation layer was uneven with abotryoidal texture consisting of individual half-spheres (Fig. 3C & D)which grew in size over time (Fig. 4; evaluated through measurement oflengths and widths) but the number of spheres decreased per area ofplate.
At all four locations rapid growth of the half-spheres during the 1day to 2 week deployments was followed by reduced growth rates forthe longer deployments. The increase in area of the half-spheres wasfastest at locations 1 and 2, where the area of individual half-spheresincreased from 0.05 μm2 after 1 day to around 75 μm2 at 10 weeks. Atlocation 3, the growth was slower with the maximum area of half-spheres only reaching 15 μm2. Although silica half-spheres were alsoobserved at location 4, their growth was very slow and even after 10weeks they only reached areas of 0.1 μm2. In all samples, measurementswere carried out on the top side of the scaling plates, yet for the 1 weekdeployment the areas of the half-spheres were also measured on thebottom side of the scaling plates at all four locations to confirm that theaverage areas on both sides were identical (open symbols in Fig. 4).
In many cases, on top of the botryoidal silica layer, individual ormerged silica particles were observed (Fig. 5). These spherical particleslooked identical to the particles found on the filters (Fig. 2), but onaverage, they were markedly larger (Table 3). The spatial distributionof the particles on the plates was completely random with some platescontaining only few particles, while other having larger areas covered
Table 3Silica speciation in the separated water at Hellisheiði.
Loc. 1 Loc. 2 Loc. 3 Loc. 4
Total concentration SiO2 [mg/L] 802 ± 19 801 ± 30 794 ± 30 550 ± 76Solubilitya [mg/L] 465 204 209 261SIb amorphous SiO2 [−] 0.10 ± 0.02 0.44 ± 0.02 0.42 ± 0.02 0.18 ± 0.08
SpeciationMonomericc [%] 85.0 81.4 75.5 85.8“Polymeric”d [%] 15.0 18.6 24.5 14.2Particulatee [%] < 0.02 <0.03 <0.03 n/a
Particle sizes [μm]f
on the filters mdn [μm] 0.2 0.1 0.1 n/aIQR [μm] (0.1–0.3) (0.1–0.3) (0.1–0.2)
on the plates mdn [μm] 3.4 0.8 1.0 0.9IQR [μm] (1.7–6.8) (0.4–1.7) (0.4–1.7) (0.5–3.1)
a Calculated based on Gunnarsson and Arnorsson (2000).b Saturation index, derived from PHREEQC simulations using the in-situ temperatures and with the fluid compositions given in Table 2.c Determined by analysing filtered (0.2 μm) and diluted sample aliquots using the spectrophotometric molybdate method.d Determined from subtracting the concentration of monomeric silica from the concentration of total silica (Table 3).e Determined from the weight difference of the 10 filter membranes before/after sampling and a density of 2.25 mg/mm3 for glass-like, high density amorphous
silica (Mroczek et al., 2011).f Determined from manual measurement of silica particles in FEG-SEM images found on filter membranes or scaling plates; mdn=median, IQR= interquartile
range (n=70–100 particles per scaling plate or filter).
D.B. van den Heuvel et al. Geothermics 76 (2018) 231–241
235

by silica particles. In some instances, neighbouring particles were ce-mented together (Fig. 5A) or to the surface of the existing silica layer(Fig. 5B) by the deposition of dissolved silica. A very small number ofthese individual silica particles became embedded into the botryoidalsurface layer (Fig. 5C).
Another mode of silica particle deposition was as 3D aggregates thathad fan- to ridge-shaped structures (Fig. 6A–C), pointing towards thedirection of the flow and that were cemented together (Fig. 6D). Thesemicrostructures were exclusively found on the top face and along theplate edges oriented towards the flow in the 2, 4 and 10 week de-ployments (Fig. 6A). During the 2 week deployment at location 1, singlefans reached a maximum of 300 μm in height. During the 4 week de-ployment, the fans grew to 700 μm in height (Fig. 6A) while on the 10week scaling plate from this location, the fans had merged into ridgesthat were up to 10mm long and 1mm high (Fig. 6B & C). At locations 2and 3, fewer and smaller fans (maximum 300 and 500 μm after 4 and 10weeks, respectively; no fans after 2 weeks) were observed. Interestingly,during the 6 week deployment, independent of the location, no 3Dstructures were observed to have grown on the ubiquitous botryoidalsilica layer.
4. Discussion
4.1. Precipitation pathways
We observed two different silica textures on the scaling plates(Figs. 3 and 6): dense silica layers with a botryoidal surface and in-dividual silica particles cemented into 3D structures. While the silicalayers were identified on all scaling plates and grew continuously inthickness, the 3D structures were only observed during the 2, 4 and 10week long deployments and never at location 4, indicating that theirformation was controlled by different processes and precipitationpathways.
The botryoidal silica layers formed by heterogeneous nucleationand growth on/at the steel-fluid-interface. All plates were made of thesame non-polished S316 stainless steel (Fig. 1C & D) and in all casesbotryoidal layers covered the steel surfaces completely, even during the1 day deployment. Thus, the plate surface properties were not a reasonfor the observed differences in layer thickness (Fig. 3) or size of half-spheres (Fig. 4) between locations. These differences are a consequenceof the changing silica precipitation depending on local physicochemicalconditions. The surface of the half-spheres appeared smooth (Fig. 3)
Fig. 2. FEG-SEM images of 0.2 μm polycarbonate filter membranes with (A & B) two types of silica particles (smooth particles marked a and rough particle aggregatesmarked b) from location 1 and (C) platy alumosilicates with very few and very small silica spheres (arrows) from location 4.
Fig. 3. Electron microscope images showing a cross sec-tion of the precipitation layer after (A) 1 day (FIB sectionimaged by TEM) and (B) 10 weeks (FEG-SEM image of asample embedded in epoxy resin, cut perpendicular to theplate). FEG-SEM images of the surface of scaling platesdeployed for (C) 1 day and (D) 10 weeks, respectively. Allsamples were from location 1. Note the difference in scale.
D.B. van den Heuvel et al. Geothermics 76 (2018) 231–241
236

and the scarcity of homogeneously formed particles (partly) embeddedin the silica layer (Fig. 5C) suggests that the growth primarily occurredby addition of dissolved silica from the fast flowing fluid, likelymonomers. This is in line with results from previous studies (Bohlmannet al., 1976; Bremere et al., 2000; Mroczek and McDowell, 1988), whichsuggested that at neutral to slightly alkaline pH growth occurs primarilyvia monomeric silica addition due to the negative surface charge oflarger species and the resulting electrostatic repulsion.
The attachment of monomers to pre-existing silica surfaces followsthe same mechanism as silica polymerisation and growth is thus natu-rally enhanced when polymerisation rates are high (i.e., at high totalsilica concentrations, high percentage of monomers, elevated tem-perature and alkaline pH; Alexander et al., 1954; Bremere et al., 2000;Gunnarsson and Arnórsson, 2005; Icopini et al., 2005; Weres et al.,1981). This explains why the growth rate of the half-spheres is highestat location 1 (Fig. 4). The fluid at location 1 had a high concentration of
total silica (∼800 ppm), a high percentage of silica monomers (85%) aswell as the highest temperature (∼120 °C), facilitating rapid attach-ment of monomeric silica from solution onto the scaling plates. Loca-tion 2 shows identical total silica concentrations, but a somewhat lowermonomeric silica content (81%) and a lower temperature (∼60 °C),explaining why the growth of the half-spheres as a function of time isslower. At location 3 on the other hand, the total silica content and fluidtemperature were equal to location 2 but the fluid contained an evenlower percentage of silica monomers (∼76%) and thus an even slowergrowth of the half-spheres. Finally, location 4 was characterised by thelowest growth rate for the half-spheres (Fig. 4). The fluid at this loca-tion was characterised by a higher temperature than at location 2 and 3(∼73 °C) and the highest monomer content (86%) of all locations.However, the substantially lower total silica concentration (∼550 ppm)was likely the reason for the much slower growth rate, suggesting thatthe total silica concentration was the dominant factor in controllingpolymerisation rate of silica and thus attachment and growth of thehalf-spheres. This is in agreement with previous studies (Gunnarssonand Arnórsson, 2005; Icopini et al., 2005; Weres et al., 1981). The samestudies also report a strong dependence of silica precipitation on pH.However, the pH variation between the four locations in this study wasonly half a pH unit (Table 2) and thus no marked effect of pH on silicaprecipitation was observed. The effect of gravity was also investigatedby not only measuring the half-spheres on the top sides of the plates butalso on the bottom sides (Fig. 4). The half-spheres on both sides wereidentical at all locations, indicating that gravity had no effect, an ob-servation which is in line with heterogeneous nucleation and sub-sequent growth by monomer addition.
The reduced growth of the silica half-spheres as a function of de-ployment time (Fig. 4) and the decrease in absolute numbers due tomerging (Fig. 3C & D and Fig. 7) is a consequence of preferential de-position of silica at half-sphere boundaries. Such intersections show aninfinitely small negative radius of curvature and thus a solubility of zero(Iler, 1979). This relationship suggests that the growth of the silicalayer was controlled by the rate of attachment of monomeric silica fromthe solution and not diffusion controlled, which is in line with previousstudies (Bohlmann et al., 1980; Crerar et al., 1981; Weres et al., 1981).
The 3D structures on the other hand were composed of individualsilica particles, which formed through homogeneous nucleation in thefluid. Once a nucleus formed, it grew by addition of monomeric silicauntil it reached its optimal size (Fig. 7). Homogeneous nucleation andparticle growth were only controlled by the physicochemical conditionsof the fluid. Under ambient conditions and up to 60 °C particles grow to≤10 nm in laboratory experiments (Goto, 1956; Icopini et al., 2005;Iler, 1979; Tobler and Benning, 2013; Tobler et al., 2009). However, atalkaline pH and in the absence of salts, particles can grow to sizes of100 nm (Iler, 1979). While this could explain the presence of thesmallest particles observed on the filter membranes (Fig. 2B), it doesnot explain the particles with diameters of several micrometres and
Fig. 4. Increase in the average area of the half-spheres over time at all fourlocations as evaluated based on measured lengths and widths of between 70and 100 half-spheres on each plate. No 10 week sample was recovered at lo-cation 2. The empty symbols (highlighted by arrows) represent the sizes of thehalf-spheres measured on the underside of the 1 week deployment at locations 1to 3. Note the logarithmic scale on the y-axis.
Fig. 5. FEG-SEM images showing particles deposited onto the botryoidal silica layer where they were (A) cemented together and/or (B) cemented to the surface or(C) (rarely) incorporated into the botryoidal silica layer. Images from locations 1 and 2.
D.B. van den Heuvel et al. Geothermics 76 (2018) 231–241
237

smooth surfaces (Fig. 2A). They likely formed due to the favourableconditions for growth inside the pipelines (alkaline pH, elevated tem-perature, constant re-supply of dissolved silica and at low salt con-centrations) which are similar to the conditions in the industrial “build-up process”, developed for the production of large particle silica sols(Morris and Vossos, 1970). In addition, the fast flow rates inside thepipelines favour the transport of larger particles without deposition.However, these large particles only account for a small proportion ofthe total particulate silica in the fluid. Nevertheless, they are of im-portance as they are preferentially deposited as shown by the largeraverage particle size on the plates compared to the filters (Table 3). The
difference is most pronounced at location 1 and smaller at locations 2and 3, indicating that the particles grew larger at higher temperaturesand/or that the fluid got depleted with respect to large particles alongthe flow path, despite the high flow rate. Both factors also explain whysuch particles were rare at location 4.
As the separated water also contained low concentrations of mul-tivalent cations (Table 2), they potentially acted as flocculants betweenthe negatively charged silica particles leading to some particles be-coming aggregated into larger particles (Fig. 2B) and the formation of3D fan- and ridge-shaped structures (Fig. 6) very similar to the dendriticprecipitates predicted in hydrodynamic simulations (Hawkins et al.,2013, 2014). Within these 3D structures, the individual particles werecemented together by monomeric silica from solution (Fig. 6). Thisoccurred in the embayment between particles (Chigira and Watanabe,1994; Rimstidt and Cole, 1983), where the solubility of amorphous si-lica is zero due to the infinitely small negative radius of curvature at thecontact point (Iler, 1979). The 3D structures grew largest at location 1,likely due to the larger average size and higher number of particles, andwere absent at location 4 where there were only few silica particles inthe fluid (Table 3). The 3D structures only grew during the 2 week (onlylocation 1), 4 week (locations 1+ 2) and 10 week (locations 1 to 3)deployments. This indicates that deployment time as well as particlenumbers and/or sizes (both highest at location 1) were the crucialfactors controlling growth of these 3D structures. Interestingly, the fan-and ridge-shaped structures were not observed during the 6 week de-ployment. This was due to the much higher average flow rate of 516 L/sat locations 1 and 2 (compared to 416 L/s measured during the otherdeployments, Table 2) recorded during this deployment. While thereason for this substantial increase in flow rate is unknown, it indicatesthat a threshold flow rate exists, above which not enough particles aredeposited for such 3D structures to form.
Silica precipitates with morphologies similar to the botryoidal silicalayers and 3D particle aggregates described here for the Hellisheiðipipelines, were also described at other power plants in Iceland and NewZealand (Brown and McDowell, 1983; Carroll et al., 1998;Gudmundsson and Bott, 1979; Rothbaum et al., 1979; Thórhallssonet al., 1975), in silica sinters from Iceland (Jones and Renaut, 2010) andin laboratory experiments mimicking the growth of silica veins(Okamoto et al., 2010). This indicates that the silica precipitation
Fig. 6. Microphotographs showing the 3D, fan-shaped structuresfound at location 1 following the 4 and 10 week deployments.Images (A) shows the edge of the plate and (B) the surface of theplate. The fans (C) consisted of spherical silica aggregates thatgrew as a function of time seemingly by addition of individualparticles that were then cemented together (D). Flow directionindicated by arrows.
Fig. 7. Schematic of the two silica precipitation pathways (SiO2 (aq) = silicamonomers in solution) as they occur inside the pipelines of the Hellisheiðigeothermal power plant.
D.B. van den Heuvel et al. Geothermics 76 (2018) 231–241
238

mechanisms described here operate over a wide range of physico-chemical conditions and different geological settings.
4.2. Quantification of precipitation rates
The precipitation rates could only be determined for the hetero-geneous pathway and the formation of the botryoidal layer due to thestrong dependency on flow rate and thus more erratic deposition be-haviour of the homogeneous pathway.
Initially, we determined the amount of silica deposited on thescaling plates by weight up to the 1 week deployment. The amountincreased four- to five-fold from 1 day to 1 week at all locations(Table 4), yet the absolute mass deposited differed substantially be-tween the four locations. The total accumulated silica was highest atlocation 1 (13.2 mg) and slightly lower at locations 2 (12.3mg) and 3(11.4 mg). Substantially less silica (3.2 mg) was deposited at location 4during the same time interval. As for the growth of the half-spheres(Fig. 4), the differences between the locations could be explained bychanges in physicochemical conditions affecting the attachment ofdissolved silica from the fluid (i.e. silica concentration and monomercontent as well as temperature). The mass of silica deposited was usedto calculate the thickness of the formed silica layer and determineprecipitation rates. The botryoidal silica layers ranged from 1.7 to2.4 μm at locations 1 to 3 and only 0.5 μm at location 4. The determinedprecipitation rates strongly decreased from the 1 day to the longerdeployments (Table 4). This was due to the changing interactionscontrolling precipitation. Initially, deposition took place at the steel-fluid interface and was controlled by the steel surface properties (e.g.roughness) and the nucleation behaviour of silica. Once the surface wascovered by silica nuclei, which happened at some point during the first24 h of the deployments as evidenced by the continuous botryoidallayer found on all plates deployed for 1 day, precipitation was
controlled by silica-silica interactions only. The precipitation rates de-termined for the 1-day deployments (800 to over 1100mgm−2 day-1 atlocations 1 to 3 and 315mgm−2 day-1 at location 4) were stronglyinfluenced by the interactions between silica and the steel plates andthus do not represent the long-term precipitation behaviour of silicafrom the fluid. Therefore, these rates were not used to calculate anaverage precipitation rate for each location and linearly extrapolate thethickness of the precipitation layer to 10 weeks (Fig. 8A). However, aswith the evolution of the size of the half-spheres (Fig. 4), it was ex-pected to see a decrease in growth of this silica layer over time,meaning the extrapolation is representing a ‘worst case’ scenario ratherthan the behaviour of silica precipitation as a function of time.
In order to better constrain the time-dependant deposition of silica,precipitation rates up to 10 weeks were also determined at location 1 bymeasuring the thickness of the silica layer using FIB sections and byimaging plates embedded in epoxy resin and cut perpendicularly. Thesilica layer grew from 0.3 μm after 1 day to over 20 μm after 10 weeks(Table 5). The values of the shorter deployments are in good agreement
Table 4Thickness of the botryoidal silica layer based on the difference in pre- and post-deployment weights of scaling plates.
Amount of silicaprecipitated
Thickness of layer[μm]c
Precipitation rate [mgm−2 day-1]d
[mg]a [mm3]b
Location 11 day 2.5 1.1 0.5 10273 days 5.7 2.5 1.0 7681 week 13.2 5.9 2.4 766Location 21 day 2.8 1.2 0.5 11243 days 5.6 2.5 1.0 7561 week 12.3 5.5 2.2 717Location 31 day 2.0 0.9 0.4 8033 days 5.8 2.6 1.0 7831 week 11.4 5.1e 1.7 663Location 41 day 0.8 0.3 0.1 3153 days 0.6 0.3 0.1 821 week 3.2 1.4e 0.5 189
a Calculated based on the weight difference of the scaling plate before andafter deployment.
b Calculated based on a density of 2.25mg/mm3 for glass-like, high densityamorphous silica (Mroczek et al., 2011).
c Calculated assuming a constant thickness of the silica layer around thewhole plate.
d Calculated using the amount precipitated and the surface area of thescaling plates. The average of the 3 day and 1 week rates was used for theextrapolation of the thickness of the silica layer to 10 weeks (Fig. 8A).
e Scaling plates 2.5 cm wide (all other scaling plates were 2 cm wide). Takeninto account when calculating the thickness of the layer and the precipitationrate.
Fig. 8. Increasing thickness of the botryoidal silica layer over time: (A) calcu-lated from the weight of silica and a density of 2.25mg/mm3 (Mroczek et al.,2011) at all locations up to 1 week (solid symbols) and linear extrapolations upto 10 weeks (empty symbols) and (B) derived from the weight of the scalingplates pre- and post-deployment (red) as well as thickness measurements fromFIB sections (orange) and embedded samples (purple) by electron microscopy atlocation 1 (For interpretation of the references to colour in this figure legend,the reader is referred to the web version of this article).
D.B. van den Heuvel et al. Geothermics 76 (2018) 231–241
239

with the thicknesses calculated and extrapolated based on the amountof silica. For the longer deployments (6 and 10 weeks), the measuredthickness was around 20% lower than the extrapolated value showingthat the extrapolation indeed represents a ‘worst case’ scenario(Fig. 8B). The discrepancy is due to the steadily decreasing precipita-tion rates (Table 5), which are not taken into account in the linearextrapolation of the average precipitation rates. The decrease is causedby the disappearance of preferential deposition sites (i.e. half-sphereboundaries) over time due to continuous merging. This highlights theneed for time-resolved and long-term studies (i.e. over weeks tomonths) to determine reliable precipitation rates of silica inside in-usegeothermal power plants.
The above derived silica precipitation rates compare well with ratesfrom other sites where the physicochemical conditions of the fluids aresimilar. This includes the Sumikawa power plant, Japan (Okazaki et al.,2017) and Ohaaki power station, New Zealand (Brown and McDowell,1983) where silica precipitation rates of around 840 and 1300 to1800mgm−2 day-1 respectively were reported. However, care has to betaken to only compare processes, which are indeed similar. Mroczeket al. (2017) for example also studied silica precipitation at Ohaakipower station and reported much higher precipitation rates (up to4500mgm−2 day-1), yet the precipitates were described by the authorsas “wavy silica spicules” and these seem more akin to the 3D structuresreported here, rather than the dense botryoidal layer from which wedetermined our precipitation rates. It is thus likely that the rates de-termined by Mroczek et al. represent the deposition rate of silica par-ticles rather than silica precipitation via the heterogeneous pathwayand cannot therefore be compared directly to the rates reported in thisstudy. Care is also needed when comparing different precipitation set-tings. Several studies reported silica precipitation rates from in situsinter growth experiments around hot springs or geothermal waste-water drains (Handley et al., 2005; Mountain et al., 2003; Tobler et al.,2008). The rates reported in these studies are generally higher than theones reported for silica scaling inside geothermal power plants. Forexample, the rates reported from Krafla (Tobler et al., 2008) underphysicochemical conditions comparable to the separated water studiedhere, are more than 50 times higher. This is because subaerial silicasinter formation occurs predominantly at the air-water interface whererecurring wetting-evaporation cycles occur as well as other hydro-dynamic processes including wave action, capillary action, diffusionand splash which enhance silica precipitation. In addition, the presenceof microbes and biofilms also accelerates silica precipitation and thusincreases the deposition rates compared with purely abiotic precipita-tion. The factors affecting silica precipitation most strongly are there-fore vastly different in these settings compared to geothermal pipelines.
4.3. Implications on predicting silica scaling
Based on the growth of the half-spheres (Fig. 4) and the determinedamounts of silica precipitated in this study (Tables 4 and 5) we canconclude that silica precipitation was fastest at locations 1 and 2 andslowest at location 4. This is in conflict with the saturation indices (SIs)calculated by PHREEQC (Table 3), which suggested that precipitationshould be fastest at locations 2 and 3 (highest SIs= highest drivingforce for precipitation). However, the SI is a purely thermodynamicconcept, which is only of limited use in a system as dynamic as ageothermal power plant where changes in the physicochemical condi-tions (e.g., cooling in the heat exchangers, dilution by steam con-densate) occur rapidly and over short distances due to the fast flowrates. Therefore, it is also not surprising that our precipitation rates donot agree with theoretical calculations based on Rimstidt and Barnes(1980), which, when taking into account our solution composition andsaturation indices derived from PHREEQC, yielded theoretical pre-cipitation rates of 0.35–0.75mgm−2 day-1. However, even if we wereto take kinetics into account to simulate the precipitation, the accuracyof our extrapolation predictions would likely not improve as the ki-netics of silica polymerisation and silica (nano)particle formation arestill highly contentious (reviewed by Tobler et al., 2017). This lack ofpredictability is a major issue in the development of geothermal re-sources as it is commonly cheaper and easier to keep the fluid at tem-peratures high enough to prevent silica supersaturation rather than tomitigate substantial silica scaling during operation.
5. Summary
In this study, we evaluated for the first time silica precipitation ratesand mechanisms inside pipelines of an in-work high-entropy geo-thermal power station in a time resolved manner, showing how a well-constrained geothermal power plant is a prefect study site for mineralprecipitation. Our results documented that amorphous silica pre-cipitates via two pathways at Hellisheiði: (1) rapid heterogeneous nu-cleation of silica on any exposed surface resulting in half-spheres which,by addition of monomeric silica from solution, grow into a botryoidalsilica layer and (2) homogeneous nucleation of nano- and micro-par-ticles in the fast flowing fluid, followed by their growth and depositionon the pre-existing botryoidal layers leading to 3D fan- and ridge-shaped structures. Both pathways are predominantly controlled by totalsilica concentration, silica monomer content and temperature, whileparticle deposition is also strongly affected by hydrodynamics.Observations from other geothermal systems suggest that these pre-cipitation modes are not unique to Hellisheiði but occur over a widerange of different conditions.
Acknowledgments
This research was made possible by Marie Curie grants from theEuropean Commission in the framework of the MINSC Initial TrainingResearch network [Project number 290040] to Liane G. Benning andCaroline L. Peacock and the framework of the NanoSiAl IndividualFellowship [Project No. 703015] to Tomasz Stawski. Daniela B. van denHeuvel acknowledges financial support by the InternationalGeothermal Association (IGA) in the framework of the 2014 PhDStudent Grant. Tomasz Stawski and Liane G. Benning also acknowledgethe financial support of the Helmholtz Recruiting Initiative. We thankT. Windross and S. Burgess for preparation of all scaling plates and H.Bergmann for his help with the deployments at Hellisheiði power plant.We are grateful for the fluid analyses done at Reykjavik Energy and byS. Reid and F. Keay at the University of Leeds. We thank A. Schreiberand R. Wirth at the GFZ Potsdam for preparation of FIB foils and sub-sequent analyses by TEM. We also acknowledge analytical support by L.Neve (XRD) and R. Walshaw (SEM), both University of Leeds. We wouldlike to thank H. Williams (University of Leeds), Th. Aebi and N.
Table 5Thickness of the precipitated silica layer at location 1 from FIB sections andsamples embedded in epoxy as well as calculated precipitation rates.
Measured [μm] Amount ofsilica [mg]a
Precipitation rate [mgm−2 day-1]b
FIB sections Embedded
1 day 0.3 – 1.7 6753 days 1.5 – 8.3 11251 week 3.0 2.6 16.6 / 14.4 965 / 8362 weeks – 4.5 24.9 7254 weeks – 9.6 53.2 7736 weeks – 12.2 67.4 66910 weeks – 20.2 111.7 632
a Calculated based on a density of 2.25mg/mm3 for glass-like, high densityamorphous silica (Mroczek et al., 2011) and the volume of silica precipitatedassuming a constant thickness of the precipitation layer all around the scalingplates.
b Calculated using the amount precipitated and the surface area of thescaling plates.
D.B. van den Heuvel et al. Geothermics 76 (2018) 231–241
240

Lötscher (both University of Bern) for help with embedding of thesamples in resin and the subsequent cutting and polishing.
References
Alexander, G.B., Heston, W., Iler, R., 1954. The solubility of amorphous silica in water. J.Phys. Chem. 58, 453–455.
Arnórsson, S., 1975. Application of the silica geothermometer in low temperature hy-drothermal areas in Iceland. Am. J. Sci. 275.
Arnórsson, S., Bjarnason, J.Ö., Giroud, N., Gunnarsson, I., Stefánsson, A., 2006. Samplingand analysis of geothermal fluids. Geofluids 6, 203–216.
Benning, L.G., Waychunas, G.A., 2007. Nucleation, growth, and aggregation of mineralphases: mechanisms and kinetic controls. Kinetics of Water-Rock Interaction.Springer, pp. 259–333.
Bohlmann, E., Shor, A., Berlinski, P., 1976. Precipitation and Scaling in DynamicGeothermal Systems. Oak Ridge National Laboratories p. 21680.
Bohlmann, E.G., Mesmer, R.E., Berlinski, P., 1980. Kinetics of silica deposition from si-mulated geothermal brines. Soc. Pet. Eng. J. 20, 239–248.
Braunstein, D., Lowe, D.R., 2001. Relationship between spring and geyser activity and thedeposition and morphology of high temperature (& 73 C) siliceous sinter,Yellowstone National Park, Wyoming, USA. J. Sediment. Res. 71, 747–763.
Bremere, I., Kennedy, M., Mhyio, S., Jaljuli, A., Witkamp, G.-J., Schippers, J., 2000.Prevention of silica scale in membrane systems: removal of monomer and polymersilica. Desalination 132, 89–100.
Brown, K., McDowell, G., 1983. pH control of silica scaling. In: Proceedings of the 5thNew Zealand Geothermal Workshop. New Zealand. pp. 157–161.
Cady, S., Farmer, J., 1996. Fossilizationprocessesin siliceous thermal springs: trends inpreservation along thermal gradients. Evol. Hydrotherm. Ecosyst. Earth Mars150–173.
Carroll, S., Mroczek, E., Alai, M., Ebert, M., 1998. Amorphous silica precipitation (60 to120 C): comparison of laboratory and field rates. Geochim. Cosmochim. Acta 62,1379–1396.
Chigira, M., Watanabe, M., 1994. Silica precipitation behavior in a flow field with ne-gative temperature gradients. J. Geophys. Res.: Solid Earth 99, 15539–15548.
Crerar, D.A., Axtmann, E.V., Axtmann, R.C., 1981. Growth and ripening of silica polymersin aqueous solutions. Geochim. Cosmochim. Acta 45, 1259–1266.
Dixit, C., Bernard, M.-L., Sanjuan, B., André, L., Gaspard, S., 2016. Experimental study onthe kinetics of silica polymerization during cooling of the Bouillante geothermal fluid(Guadeloupe, French West Indies). Chem. Geol. 442, 97–112.
Dugger, D.L., Stanton, J.H., Irby, B.N., McConnell, B.L., Cummings, W.W., Maatman,R.W., 1964. The Exchange of twenty metal ions with the weakly acidic silanol groupof silica Gel1, 2. J. Phys. Chem. 68, 757–760.
Fleming, B.A., 1986. Kinetics of reaction between silicic acid and amorphous silica sur-faces in NaCl solutions. J. Colloid Interface Sci. 110, 40–64.
Fleming, B., Crerar, D., 1982. Silicic acid ionization and calculation of silica solubility atelevated temperature and pH application to geothermal fluid processing and re-injection. Geothermics 11, 15–29.
Fournier, R., Rowe, J., 1966. Estimation of underground temperatures from the silicacontent of water from hot springs and wet-steam wells. Am. J. Sci. 264, 685–697.
Gallup, D.L., 1997. Aluminum silicate scale formation and inhibition: scale character-ization and laboratory experiments. Geothermics 26, 483–499.
Goto, K., 1956. Effect of pH on polymerization of silicic acid. J. Phys. Chem. 60,1007–1008.
Gudmundsson, J.S., Bott, T.R., 1979. Deposition of silica from geothermal waters on heattransfer surfaces. Desalination 28, 125–145.
Gunnarsson, I., Arnórsson, S., 2000. Amorphous silica solubility and the thermodynamicproperties of H4SiO4 in the range of 0 to 350 C at Psat. Geochim. Cosmochim. Acta 64,2295–2307.
Gunnarsson, I., Arnórsson, S., 2003. Silica scaling: the main obstacle in efficient use ofhigh-temperature geothermal fluids. In: Proceedings International GeothermalConference. Reykjavik. pp. 30–36.
Gunnarsson, I., Arnórsson, S., 2005. Impact of silica scaling on the efficiency of heatextraction from high-temperature geothermal fluids. Geothermics 34, 320–329.
Gunnarsson, I., Ívarsson, G., Sigfússon, B., Thrastarson, E.Ö., Gíslason, G., 2010. Reducingsilica deposition potential in waste waters from Nesjavellir and Hellisheiði PowerPlants, Iceland. In: Proceedings World Geothermal Congress. Bali.
Hair, M.L., Hertl, W., 1970. Acidity of surface hydroxyl groups. J. Phys. Chem. 74, 91–94.Handley, K., Campbell, K., Mountain, B., Browne, P., 2005. Abiotic–biotic controls on the
origin and development of spicular sinter: in situ growth experiments, ChampagnePool, Waiotapu, New Zealand. Geobiology 3, 93–114.
Harrar, J., Locke, F., Otto Jr, C., Lorensen, L., Monaco, S., Frey, W., 1982. Field tests oforganic additives for scale control at the Salton Sea geothermal field. Soc. Pet. Eng. J.22, 17–27.
Hawkins, C., Angheluta, L., Hammer, Ø., Jamtveit, B., 2013. Precipitation dendrites inchannel flow. Europhys. Lett. 102, 54001.
Hawkins, C., Angheluta, L., Jamtveit, B., 2014. Hydrodynamic shadowing effect duringprecipitation of dendrites in channel flow. Phys. Rev. E 89, 022402.
Icopini, G.A., Brantley, S.L., Heaney, P.J., 2005. Kinetics of silica oligomerization andnanocolloid formation as a function of pH and ionic strength at 25 C. Geochim.
Cosmochim. Acta 69, 293–303.Iler, R.K., 1979. The Chemistry of Silica: Solubility, Polymerization, Colloid and Surface
Pro Perties, and Biochemistry. Wiley, London.Jones, B., Renaut, R.W., 2004. Water content of opal-A: implications for the origin of
laminae in geyserite and sinter. J. Sediment. Res. 74, 117–128.Jones, B., Renaut, R.W., 2010. Impact of seasonal changes on the formation and accu-
mulation of soft siliceous sediments on the discharge apron of Geysir, Iceland. J.Sediment. Res. 80, 17–35.
Kitahara, S., 1960. The polymerization of silicic acid obtained by the hydrothermaltreatment of quartz and the solubility of amorphous silica. Rev. Phys. Chem. Jpn. 30,131–137.
Konhauser, K.O., Phoenix, V.R., Bottrell, S.H., Adams, D.G., Head, I.M., 2001.Microbial–silica interactions in Icelandic hot spring sinter: possible analogues forsome Precambrian siliceous stromatolites. Sedimentology 48, 415–433.
Konhauser, K.O., Jones, B., Phoenix, V.R., Ferris, G., Renaut, R.W., 2004. The microbialrole in hot spring silicification. AMBIO: J. Hum. Environ. 33, 552–558.
Meier, D., Gunnlaugsson, E., Gunnarsson, I., Jamtveit, B., Peacock, C., Benning, L., 2014.Microstructural and chemical variation in silica-rich precipitates at the Hellisheiðigeothermal power plant. Mineral. Mag. 78, 1381–1389.
Morris, M. and Vossos, P.H. (1970) Large particle silica sols and method of production.Google Patents.
Mountain, B., Benning, L., Boerema, J., 2003. Experimental studies on New Zealand hotspring sinters: rates of growth and textural development. Can. J. Earth Sci. 40,1643–1667.
Mroczek, E., McDowell, G., 1988. Silica scaling field experiments. In: New ZealandGeothermal Workshop. Auckland.
Mroczek, E., Graham, D., Bacon, L., 2011. Manila. Silica Deposition Experiments: PastWork and Future Research Directions Proceedings International Workshop onMineral Scaling in Geothermal Environments.
Mroczek, E., Graham, D., Siega, C., Bacon, L., 2017. Silica scaling in cooled silica satu-rated geothermal water: comparison between Wairakei and Ohaaki geothermal fields,New Zealand. Geothermics 69, 145–152.
Noguera, C., Fritz, B., Clément, A., 2015. Precipitation mechanism of amorphous silicananoparticles: a simulation approach. J. Colloid Interface Sci. 448, 553–563.
Okamoto, A., Saishu, H., Hirano, N., Tsuchiya, N., 2010. Mineralogical and texturalvariation of silica minerals in hydrothermal flow-through experiments: implicationsfor quartz vein formation. Geochim. Cosmochim. Acta 74, 3692–3706.
Okazaki, T., Orii, T., Ueda, A., Ozawa, A., Kuramitz, H., 2017. Fiber optic sensor for Real-time sensing of silica scale formation in geothermal Water. Sci. Rep. 7.
Padilla, S.R.M., Barnett, P., Castro, M., Guerra, E., Henríquez, J.L., 2005. Silica poly-merization and deposition trials at the Berlin geothermal Field, El Salvador.Proceedings World Geothermal Congress.
Parkhurst, D.L., Appelo, C., 2013. Description of Input and Examples for PHREEQCVersion 3: a Computer Program for Speciation, Batch-Reaction, One-DimensionalTransport, and Inverse Geochemical Calculations. US Geological Survey.
Preston, L., Benedix, G., Genge, M., Sephton, M., 2008. A multidisciplinary study of silicasinter deposits with applications to silica identification and detection of fossil life onMars. Icarus 198, 331–350.
Rimstidt, J.D., Barnes, H., 1980. The kinetics of silica-water reactions. Geochim.Cosmochim. Acta 44, 1683–1699.
Rimstidt, J., Cole, D., 1983. Geothermal mineralization. I. The mechanism of formation ofthe Beowawe, Nevada, Siliceous sinter deposit. Am. J. Sci. (United States) 283.
Rothbaum, H., Anderton, B., Harrison, R., Rohde, A., Slatter, A., 1979. Effect of silicapolymerisation and pH on geothermal scaling. Geothermics 8, 1–20.
Seward, T., 1974. Determination of the first ionization constant of silicic acid from quartzsolubility in borate buffer solutions to 350 C. Geochim. Cosmochim. Acta 38,1651–1664.
Thórhallsson, S., Ragnars, K., Arnórsson, S., Kristmannsdóttir, H., 1975. Rapid scaling ofsilica in two district heating systems. In: United Nations Symposium on theDevelopment and Use of Geothermal Resources. San Fransico. pp. 1445–1449.
Tobler, D.J., Benning, L.G., 2013. In-situ and time resolved nucleation and growth of silicananoparticles forming under simulated geothermal conditions. Geochim.Cosmochim. Acta 114, 156–168.
Tobler, D.J., Stefansson, A., Benning, L.G., 2008. In-situ grown silica sinters in Icelandicgeothermal areas. Geobiology 6, 481–502.
Tobler, D.J., Shaw, S., Benning, L.G., 2009. Quantification of initial steps of nucleationand growth of silica nanoparticles: an in-situ SAXS and DLS study. Geochim.Cosmochim. Acta 73, 5377–5393.
Tobler, D.J., Stawski, T.M., Benning, L.G., 2017. Silica and alumina nanophases: naturalprocesses and industrial applications. New Perspectives on Mineral Nucleation andGrowth. Springer, pp. 293–316.
Weres, O., Yee, A., Tsao, L., 1981. Kinetics of silica polymerization. J. Colloid InterfaceSci. 84, 379–402.
Wirth, R., 2009. Focused Ion Beam (FIB) combined with SEM and TEM: advanced ana-lytical tools for studies of chemical composition, microstructure and crystal structurein geomaterials on a nanometre scale. Chem. Geol. 261, 217–229.
Yokoyama, T., Sato, Y., Maeda, Y., Tarutani, T., Itoi, R., 1993. Siliceous deposits formedfrom geothermal water I. The major constituents and the existing states of iron andaluminium. Geochem. J. 27, 375–384.
D.B. van den Heuvel et al. Geothermics 76 (2018) 231–241
241


![Physicochemical and Additive Controls on the Multistep …homepages.see.leeds.ac.uk/~earlgb/Publications/Ossorio et... · 2017-09-29 · Minerals 2017, 7, 140 2 of 14 plants [4]](https://img.dokumen.tips/doc/110x75/5f9167d9d33dfa0e32308ff9/physicochemical-and-additive-controls-on-the-multistep-earlgbpublicationsossorio.jpg)