Embed Size (px)
Citation preview

Understanding Advanced Placement Grading in BC
October 2018
Prepared for BCCAT by Andrew Drinkwater, Patrick Lougheed, and Lynne Jamieson, Plaid Consulting
BC COUNCIL ON ADMISSIONS & TRANSFER 709 – 555 Seymour Street, Vancouver BC Canada V6B 3H6 bccat.ca | bctransferguide.ca | 604 412 7700 | [email protected]
© BCCAT October 2018
Prepared for BCCAT by Andrew Drinkwater, Patrick Lougheed, and Lynne Jamieson, Plaid Consulting
Understanding Advanced Placement Grading in BC

Table of Contents EXECUTIVE SUMMARY 1
AP grading at BC high schools 1AP perceptions and practices at BC post-secondary institutions 2Post-secondary academic performance of students with AP courses 2Future research opportunities 4
INTRODUCTION 5Curriculum changes 6Additional types of advanced study 7
LITERATURE REVIEW 8
ENVIRONMENTAL SCAN 15Post-secondary institutions 15
AP policies and practices at post-secondary institutions 15Key themes from post-secondary institution interviews 16
Secondary schools 17Participants 17Grading policies and practices in secondary schools 17Secondary school questions and challenges related to AP 20
School districts 21The College Board 21
CASE STUDY 22Data summary 22
Data transformation and statistical analysis 24Comparisons of performance between similar AP and non-AP courses 25Results 25Student post-secondary performance 27
Kwantlen Polytechnic University 30The University of British Columbia 32The University of Victoria 34
CONCLUSION 36
REFERENCES 38
APPENDIX 1: Data Request to Institutions 42Case study key questions 42Datasets necessary to answer these questions 43
APPENDIX 2: Telephone Survey Instruments 46Post-secondary institutions 46Secondary schools 46

APPENDIX 3: Potential Future Research 48
APPENDIX 4: Detailed Case Study Data Description 49Kwantlen Polytechnic University 49The University of British Columbia 50The University of Victoria 51
APPENDIX 5: Data Transformation, and Model Selection and Fitting 53Kwantlen Polytechnic University 53The University of British Columbia 56The University of Victoria 62
TABLE OF FIGURESFIGURE 1 : Growth in AP exams written by year and region, 2006-2016 (College Board, 2016) 5FIGURE 2: AP offerings by BC school district 12FIGURE 3: Proportion of KPU students in dataset with AP courses by English 12 grade 30FIGURE 4: Average first-year grade point average compared to English 12 grade for KPU students in the dataset 30FIGURE 5: Number and percentage of KPU students with AP courses and BC course analogue on their high school transcript by grade difference between AP and BC course 31FIGURE 6: Proportion of UBC students in dataset with AP courses by admission average 32FIGURE 7: Average first-year session average compared to admission average for UBC students in the dataset 32FIGURE 8: Number and percentage of UBC students with AP courses and BC course analogue on their high school transcript by grade difference between AP and BC course 33FIGURE 9: Proportion of UVic Students in Dataset with AP Courses by Admission Average 34FIGURE 10: Average first-year session average compared to admission average for UVic students in the dataset 34FIGURE 11: Number and percentage of UVic students with AP courses and BC course analogue on their high school transcript by grade difference between AP and BC course 35FIGURE 12: Top 10 AP courses completed by students at KPU in dataset 49FIGURE 13: Top 10 AP courses completed by students at UBC in dataset 51FIGURE 14: Top 10 AP courses completed by Ssudents at UVic in dataset 52
TABLE OF TABLESTABLE 1: Description of the case study cohorts and grades on transcripts 23TABLE 2: Course pairs used for grade comparisons between AP and BC courses 26TABLE 3: OLS model results for KPU 53TABLE 4: OLS model results individual grade 12 courses for KPU 54TABLE 5: OLS model results for UBC 57TABLE 6: OLS model results individual grade 12 courses for UBC 58TABLE 7: BMA model results for UBC for BMA majority-selected AP course indicators 59TABLE 8: OLS model results for UBC for BMA-selected AP course indicators 59TABLE 9: OLS model results for UVic 62TABLE 10: OLS model Rrsults individual grade 12 courses for UVic 63
BCCAT 1Understanding Advanced Placement Grading in BC
The Advanced Placement (AP) program provides the opportunity for high school students to enrol in advanced level coursework in a number of subjects, and potentially earn college or university transfer credit. AP is owned, created, and administered by the non-profit College Board, and many post-secondary institutions provide transfer credit or advanced standing for completed AP exams, or will factor in AP scores into admissions decisions (or both).
This project, sponsored by the British Columbia Council on Admis-sions and Transfer and conducted by Plaid Consulting, sought to:
• Gather and summarize existing AP grading practices at British Columbia high schools and school districts;
• Analyze policies and practices for evaluating the AP grade and exam score information, and for grading AP standing at post-secondary institutions;
• Determine whether any insight can be provided on the appropriate equivalencies between AP course grading and British Columbia high school course grades based on student post-secondary performance; and
• Identify areas for future research and, if appropriate, the development of suggested practices.
This research was conducted in the spring of 2017 and focused on grading practices in AP courses in both public and independent schools throughout British Columbia. As part of the research, surveys were conducted with BC AP teach-ers and coordinators, post-secondary admissions directors, and representatives of the College Board. A case study compared the post-secondary performance of students who participated in AP with those who did not participate in AP.
AP grading at BC high schoolsPlaid reached out to 29 public and independent secondary schools across BC, completing eight telephone interviews spanning the Lower Mainland, Fraser Valley, and Vancouver Island. We spoke mostly to AP teachers, and a few AP coordinators. The study participants identified that AP course grading practices are varied within and between schools. The teachers and AP coordinators generally did not have insight into grading practices in other schools or districts.
The environmental scan highlighted that different secondary schools have different practices in how they award credit for both AP courses and their BC provincial analogues, with some schools automatically granting credit for the BC
Understanding Advanced Placement Grading in BCExecutive Summary
This research was focused on grading practices in AP, and the post-secondary performance of students who participated in AP as compared with those who did not participate in AP.
2 BCCAT Understanding Advanced Placement Grading in BC
course, others requiring an additional coursework component, and others not granting credit for the analogue BC course. The interviewees universally indicated that grades in AP courses and their BC provincial analogues would be different. Teachers noted that it was nearly always the case that students had higher grades in the provincial course. The interviewees confirmed that the grades awarded for AP and BC courses reflected mastery of those curricula, respectively.
AP perceptions and practices at BC post-secondary institutions Most post-secondary institutions have specific criteria posted to their websites that outlines how AP courses are evaluated, and what types of transfer credits are received for certain scores on the AP exam. While the exact scores required differ by institution, the policies overall are quite similar and have stayed consistent for several years, with limited review beyond regular transfer credit requests. AP exam scores can be used towards admission averages at Kwantlen Polytechnic University (KPU), Simon Fraser University (SFU), and the University of British Columbia (UBC).
UBC notes that AP course grades may be combined with an approved high school curriculum to meet the University’s admission requirements. Other institutions do not explicitly address on their webpages whether AP course grades can be used in admission averages.
Most BC institutions award transfer credit for an AP exam score of 4 or higher, though some institutions will grant either transfer credit or advanced standing – the ability to take an advanced course, but not the prerequisite – based on an exam score of 3 or higher.
The post-secondary institution representatives we spoke with identified a few key themes related to AP grading practices:
• their own policies have not been studied recently,
• they feel there are differences in AP grading between different schools,
• course transcription practices are not clear, and
• there are challenges in granting transfer credit or advanced standing based on AP due to academic units within institutions requiring different standards than the institutional minimum.
Post-secondary academic performance of students with AP coursesCompared to students who did not participate in AP, AP students tend to be better prepared academically, complete more coursework, take additional high-level college courses related to their AP subjects, have superior leadership abilities, more likely to have a double major, and are twice as likely to move on to graduate or professional school (Curry, MacDonald, & Morgan, 1999), especially if they received a score of 4 or higher on the AP exam (Mattern, Shaw, & Xiong, 2009). The link between AP coursework and college success has not been strongly demonstrated: AP exam performance is strongly correlated to college performance, but coursework itself is not a useful predictor of post-secondary performance (Geiser & Santelices, 2006). AP students who complete both the AP course and exam out-perform those who complete the course only or the exam only (Hargrove, Godin, & Dodd, 2008).

BCCAT 3Understanding Advanced Placement Grading in BC
TABLE 1: Description of the case study cohorts and grades on transcripts
KPU UBC UVicTotal students 6,389 6,589 3,662
Students with AP courses (% of total) 489 (7.7%) 2,197 (33.3%) 670 (18.3%)Total enrolments in AP courses 611 4,258 1,012
Most common AP courses (* indicate predictive capability of post-secondary per-
formance in subject areas)
AP Calculus AB 12*AP English Literature & Composition 12AP Psychology 12
AP Calculus AB 12* AP English Literature & Composition 12 AP Chemistry 12 AP Psychology 12 AP Biology 12.
AP Calculus AB 12* AP English Literature & Composition 12 AP English Language & Composition 12AP Psychology 12 AP Chemistry 12
Both BC and AP course analogues on transcripts (% of all enrolments) 66.2% 64.0% 67.6%
BC grade = AP grade 68.1% 22.1% 21.7%BC grade > AP grade 19.4% 67.1% 64.8%BC grade < AP grade 12.5% 10.8% 13.5%
BC course grade higher average 0.8pp 3.3pp 3.3ppBC course grade higher median 0.0pp 2.0pp 2.0pp
Three BC post-secondary institutions - KPU, UBC, and the University of Victoria (UVic) – participated in case study analyses whether AP course grades can provide signals to the institutions regarding post-secondary performance, either in aggregate or in specific subject areas or courses. AP exam scores were not included into the analyses. The data covered two entry cohorts of students who entered each institution directly from BC secondary schools.
The case study performed utilized two separate analyses, with the first considering general AP indicators such as whether a student took any AP courses, or whether they took specific AP courses, coupled with the institution’s admis-sion average. The second analysis looked at specific course grades and an indicator of whether a student took an AP analogue of the specific BC course.
Compared to students who did not participate in AP, AP students tend to be better prepared academically, complete more course-work, take additional
high-level college courses related to their AP subjects, have superior leadership abilities, more likely to have a double major, and are twice as likely to move on
to graduate or or professional school (Curry, MacDonald, & Morgan, 1999), especially if they received a score of 4 or higher on the AP exam
(Mattern, Shaw, & Xiong, 2009).
4 BCCAT Understanding Advanced Placement Grading in BC
The case study highlights that for some course pairs (particularly English and science courses, such as biology, chem-istry, and physics), more than 80% of students received credit for both the AP course and its BC provincial analogue, with more than 60% receiving a better grade for the BC course. There were, however, exceptions: students who pur-sued the AP Calculus courses received credit for Calculus 12 only about 20-25% of the time, and AP Macroeconomics 12 and AP Microeconomics 12 students only received credit for Economics 12 around 35% of the time. The case study reinforces that, when students have both an AP and a non-AP version of a course on their transcript, we cannot make the assumption that students will receive a higher grade in the non-AP version.
In the general AP indicator analysis, KPU and UBC data had small predictive capabilities. The analysis indicated that students with AP courses would likely perform better in aggregate. At UBC certain AP courses were good indicators. At the University of Victoria (UVic), there were no general AP indicators that had predictive capabilities for aggregate performance. For specific subject areas and courses, both general indicators and an indicator for whether a student completed AP Calculus AB 12 provided some predictive ability in some subject areas and courses. At KPU, one subject area additionally showed that AP English Language & Composition 12 had a small predictive ability.
In the specific course analysis at all three institutions, we obtained better predictive models by factoring in whether a student took an AP analogue of the BC course. For many of these courses, particularly those that are non-English-focused language courses, students with AP grades performed similarly to students with BC analogue grades higher than the AP grade suggested. Their performance similarly outstripped what would be expected from looking at the transcripted grade of the BC analogue of the course when both appeared on the student’s transcript.
Future research opportunitiesWith the data available in our case study, we could not determine a suitable equivalency scale between AP exam scores and course grades. Additionally, we could not determine whether the substantial differences in patterns between the post-secondary institutions (e.g., which AP courses students choose to take, the grades they receive in those AP courses relative to the grades received in similar BC provincial versions of the course, and which post- secondary subject areas are most impacted by students taking AP courses) are a result of the course offerings avail-able to students in secondary school, course selection by students based on post-secondary study paths, or post-secondary program and course design. Additionally, post-secondary institutions suggested during the environmental scan they would like to assess how AP and non-AP students compare in courses which follow from post-secondary courses for which students are given transfer credit on the basis of AP coursework.
The challenge for institutional admission officers is how to appropriately utilize signals from Advanced Placement courses in evaluations. Unlike the International Baccalaureate program, AP students seldom have an entire program of credits, on average having one to two AP courses along with non-AP courses. What is clear from this research is that the utility of those signals depends highly on the context, and that institutions need to look into their own data to determine what works best for their context. There is no one approach that will work in all, or even most, cases. As the results of our analysis vary by both institution and individual course, we highly recommend that institutions conduct an analysis to determine the appropriate equivalencies between grades in AP and BC analogues of a course for their context, and for individual AP courses.

BCCAT 5Understanding Advanced Placement Grading in BC
IntroductionThe Advanced Placement (AP) program provides the opportunity for high school students to enrol in advanced level coursework in a number of subjects, and potentially earn college or university transfer credit. AP is owned, created, and administered by the nonprofit College Board, and many post-secondary institutions provide transfer credit or advanced standing for completed AP exams, or will factor in AP scores into admissions decisions (or both).
AP programs are growing in popularity (Figure 1). The College Board statistics indicate that AP exam volume has grown in Canada by 72% between 2006 and 2016, by 101% in the United States, and by 302% outside of the US and Canada (College Board, 2016). Notwithstanding these growth rates, it should be noted that more than 95% of the AP exam enrolments are in the United States. At this time, these reports are not broken out by Canadian province. Canadian growth annually has slowed over the past decade but is still often greater than 3% annually.
FIGURE 1: Growth in AP exams written by year and region, 2006-2016 (College Board, 2016)
Some explanations for this growth are based on the demand side: in a survey of teachers, 90% felt that students participated in AP for utilitarian reasons such as improving college applications rather than pragmatic reasons such as academic challenge (Duffett & Farkas, 2009). There is also a supply side effect, where district and school policies encourage additional enrolments (Duffett & Farkas, 2009) as well as government incentives, policies, and programs (Klopfenstein, 2003) and philanthropic donations in the United States (Byrd, Ellington, Gross, Jago, & Stern, 2007),
6 BCCAT Understanding Advanced Placement Grading in BC
This project, sponsored by the British Columbia Council on Admissions and Transfer and conducted by Plaid Consult-ing, sought to:
• Gather and summarize existing AP grading practices at British Columbia high schools and school districts;
• Analyze policies and practices for evaluating the AP grade and exam score information, and for grading AP standing at post-secondary institutions;
• Determine whether any insight can be provided on the appropriate equivalencies between AP course grading and British Columbia high school course grades based on student post-secondary performance; and
• Identify areas for future research and, if appropriate, the development of suggested practices.
This research was conducted in the spring of 2017 and focused on grading practices in AP courses in both public and independent schools throughout British Columbia. As part of the research, surveys were conducted with BC AP teach-ers and coordinators, post-secondary admissions directors, and representatives of the College Board. A case study compared the post-secondary performance of students who participated in AP with those who did not participate in AP.
This paper is broken into three major sections: the literature review which highlights published research related to AP, the environmental scan which covers the interviews with post-secondary admissions directors and BC AP teachers and coordinators, and the case study which overviews the analysis of grading equivalencies between students who partici-pated in AP and those who did not.
Curriculum changesThe College Board began revising the core AP curriculum in a number of different course areas, with changes to start taking effect in the 2012-13 academic year (Drew, 2011). Previous iterations of AP focused on what core concepts would be included in the exams; these changes were intended to provide teachers with detailed standards in each subject area in addition to the creation of new exams based on the new curriculum. The courses themselves better empha-sized active learning and experimentation, paring down the breadth of material in favour of exploring key topics in each subject.
The first courses to receive major revisions were in the areas of languages, physics, chemistry, European history, world history, and art history (Drew, 2011). The changes to the AP curriculum also fostered debate, with Byrd et al. (2007) suggesting that the revision was an “enormous process to recreate something that’s already better than good” (p. 18). The authors questioned why more states did not use curricula like the AP or IB, rather than “paying twice: once to develop their own standards and assessments that don’t function effectively, and again to fund these independent programs because they do a better job” (Byrd et al., 2007, p.18).
While not explicitly identified as the impetus for AP curriculum changes, a study by Parker et al. (2011) delivered an experimental AP US Government and Politics course using active project-based learning in an attempt to address the breadth and depth tension often found in AP courses. “Students in the experimental course scored, on average, as well as (in study 2) or better than (study 1) students in the control classes on the AP exam (p < 0.05), and both scored better than control classes on an alternative, complex-scenario test of deep conceptual learning (p < 0.05)” (Parker et al., 2011, p. 555). However, the authors also found that students had to become accustomed to a new style of course-

BCCAT 7Understanding Advanced Placement Grading in BC
work that did not reward rote memorization: the adaptive learning used in this experimental course required students to continually iterate through understanding, reading, questioning the teacher, and communicating with other stu-dents.
Many schools are also offering honours curricula that they brand as “pre-AP.” Students who “complete multiple semes-ters of both pre-AP and AP course work had earned higher GPAs and ultimately graduate with a higher class rank” (Wehde-Roddiger et al., 2012).
In addition, the Government of British Columbia is currently revising its core curriculum in the K-12 system. The new curriculum attempts to foster “personalized learning, through quality teaching and learning, flexibility and choice, and high standards” (Government of British Columbia, 2015, page Curriculum Overview). The introduction of this new curriculum does not have a definitive timeline as of this writing, but it could impact the overlap (or the lack thereof ) between AP course curriculum and the BC curriculum.
Additional types of advanced studyWhile generally outside the scope of this research project, other types of advanced study appear in the literature in comparison to AP student performance. One such example is the International Baccalaureate program which offers programs focused on developing the “intellectual, personal, emotional, and social skills needed to live, learn, and work in a rapidly globalizing world” (International Baccalaureate, n.d.)
Other methods that allow secondary school students to participate in advanced or accelerated learning targeted at future movement to college or university study, include:
• Examination-based college credit: a student earns transfer credit by completing a standardized exam (Hoff-man, 2003, p.45).
• In BC, both of the following types of advanced learning noted by Hoffman are referred to as dual credit:
• School-based credit (or concurrent enrolment): college-level courses “taught by high school teachers in high school classrooms under the guidance of college professors” (Hoffman, 2003, p. 45).
• College-based credit (or dual enrolment): college-level courses “taught on a college campus or satellite center and are taught by college faculty” (Hoffman, 2003, p. 45) while students remain formally enrolled in high school.
• Virtual-college credit courses: college credits delivered via distance education (Hoffman, 2003, p. 45).
• Honours coursework: “Honours” can be used in multiple fashions within high schools. It can represent advanced level locally developed coursework offered at the senior level, but it can also represent a “pre- Advanced Placement” curriculum offered at the junior level (Sadler, 2010). Honours courses can typically provide more depth in laboratories and project work, leading many elite schools to shift from AP offerings to Honours offerings (Sadler, 2010). Note that this type of “Honours” coursework is predominantly US-based.

8 BCCAT Understanding Advanced Placement Grading in BC
Literature ReviewThe literature review highlighted a number of recurring themes, some of which overlap with the themes that emerge in environmental scan and case study aspects of this report. In brief, the key themes of the literature were:
Course, Exam, or Both?
• Students who take both the course and the exam are best placed for success. Those who score a 4 or 5 on the exam typically have the best academic outcomes (Morgan & Ramist, 1998; Morgan & Klaric, 2007).
• Course grades often appear higher than exam scores, leading to suggestions of grade inflation (Hallett & Venegas, 2007).
Benefits of Advanced Placement
• AP student course performance in post-secondary is better than non-AP students, especially where the post-secondary course relates to the AP subject area, particularly for students who scored a 4 or higher on the AP exam (Curry et al., 1999).
• Students and teachers appreciate the rigour and challenge of the AP courses (Hertberg-Davis & Callahan, 2008).
Challenges with Advanced Placement
• AP is frequently cited for trying to cram too much material into the time provided, emphasizing the lec-ture format, and the importance of the exam. Students report a lack of sleep and feeling rushed and over-whelmed. Teachers feel the emphasis on the exam forced them to rush material and limit depth of material (Drew, 2011; Hertberg-Davis, 2008; Parker et al., 2011).
• Grading practices are inconsistent: some courses “bump” AP grades to the level they think the student would attain on the provincial analogue. Questions of grade inflation emerge due to teachers benefiting financially (in certain US states) from student performance, coupled with a steady rise in high school GPA relative to SAT scores (Conley, 2000; Geiser & Santelices, 2006; Godfrey, 2011; Santoli, 2002).
• Advanced Placement is criticized for uneven accessibility, with relatively affluent urban high schools tending to have the greatest options for AP participation (Geiser & Santelices, 2006; Hallet and Venegas, 2011; Hoffman, 2003; Klopfenstein, 2004; Klopfenstein & Lively, 2012; Shaw, Marini, & Mattern, 2013; Wakelyn, 2009).
Policy Considerations for Admissions Officers for Advanced Placement Grades
• Consideration of students’ AP coursework in the context of what AP offerings were available at their school is challenging in part for logistical reasons, and also because the link between AP course grades and post-secondary performance has not been strongly demonstrated (Geiser & Santelices, 2006; Sternberg, 2010).
• Awarding extra weight to AP coursework used in admissions decisions, but only where the student has com-pleted the AP exam with a sufficient score. This option is challenged by how late in the cycle AP exam grades materialize, often after admission offers are finalized (Geiser & Santelices, 2006).
BCCAT 9Understanding Advanced Placement Grading in BC
• Reducing the weight given to AP coursework: this solution is intended to still reward students for pursuing advanced coursework, while minimizing the impact on those where such opportunities do not exist (Geiser & Santelices, 2006).
The research into students who take just the AP course, just the AP exam, or both, supports the notion that taking both the course and the exam is beneficial to students. Students who complete both the AP course and the exam outperform non-AP students and AP students with the course only, or the exam only, and dual enrolment students on many measures of postsecondary success: GPA, credits earned, four-year graduation rate, subject specific grades (Hargrove et al., 2008; Keng & Dodd, 2008; Adelman, 1999). These findings extend across gender and ethnic groups (Hargrove et al., 2008; Scott, Tolson, & Lee, 2010).
Hallett and Venegas note that students received “dramatically lower scores on the AP exams compared to grades received in AP courses” (2011, p. 474), leading to suggestions of grade inflation. Further, Geiser and Santelices (2006) found that even after controlling for academic and socioeconomic factors, “the number of AP and honors courses tak-en in high school bears little or no relationship to students’ later performance in college” (p. 1), with only performance on the AP exam being strongly correlated to college performance. In general, the idea that the AP exam provides the most benefit to students (Warne et al., 2015) is well supported.
Students who participate in AP are widely lauded in the literature for their academic success, especially those who complete the exams. There is some disagreement in the literature around whether an exam score of 3 or higher leads to the best outcomes (Warne, Larsen, Anderson, and Odasso, 2015; Geiser & Santelices, 2006) or an exam score of 4 or higher (Mattern et al., 2009; Curry et al., 1999). Curry et al. (1999) noted that AP motivates students, matches them with enthusiastic teachers, and provides strong preparation, creating an “AP Effect”. The authors found that AP stu-dents in college are:
• better prepared academically;
• more likely to specialize in majors with tougher grading standards (cited by Curry et al. (1999), Willingham and Morris (1986) observed that upper division natural sciences programs had tougher grading standards).
• more likely to complete more coursework;
• likely to take additional higher-level college courses in their AP subjects;
• more likely to be superior in terms of leadership and significant accomplishments;
• more likely to graduate with a double major; and
• twice as likely to go on to graduate or professional school (Curry et al., 1999).
The findings of Curry et al. (1999) are further enforced by Morgan & Klaric (2007), who found that AP students enrol in considerably more coursework in their AP discipline in post-secondary.
Students who complete both the AP course and the exam outperform non-AP students and AP students with the course only, or the exam only, and dual en-
rolment students on many measures of post-secondary success.

10 BCCAT Understanding Advanced Placement Grading in BC
AP students who scored a 4 or higher on the exam and were consequently granted transfer credit to skip the intro-ductory course also outperformed both students who did not take AP and those who studied in AP but also took the introductory course in the department (Morgan & Ramist, 1998; Morgan & Klaric, 2007).
AP students themselves appreciate the challenge afforded them, seeing it as “an opportunity to escape the drudgery of less challenging courses” (Hertberg-Davis & Callahan, 2008, p. 202), appreciating “the opportunity to work with other advanced students and the highly positive, adult-like relationship with their teachers” (Hertberg-Davis et al., 2006, p. xi). Students also benefit from motivated, capable teachers, and save both time and money by not retaking material in college that they have already mastered (Santoli, 2002).
In addition to highlighting the success of the AP program, the literature also notes challenges that affect the program. These challenges can be loosely grouped into three major themes:
• workload and depth of material,• grading practices, and• accessibility.
Advanced Placement coursework is challenging both for the students who enrol and for those who teach the courses. AP courses are frequently criticized for trying to cram too much material into a short time period (Drew, 2011; Hert-berg-Davis, 2008; Parker et al., 2011), emphasizing the lecture format, and “minimiz[ing] time-consuming student- centred activities such as laboratory experimentation, student projects, and student presentations” (Herr, 1992, p. 530). AP (and IB) students were consistently reporting a lack of sleep, observed through students going to bed late or outright forgoing sleep (Foust, Hertberg-Davis, & Callahan, 2008). Students enrolled in AP and IB programs report that the workload was significant, and that the “courses often felt rushed and overwhelming due to the hurry to cover a great deal of content in time for the exams” (Hertberg-Davis and Callahan, 2008, p. 202-203). Teachers also feel that the AP exam scores are of utmost importance, causing them to use the exam questions to drive curricular and instruc-tional decisions, to rush through material to ensure they covered enough, to limit the depth in favour of breadth of material, and to preclude them from attending to student interests (Hertberg-Davis, Callahan, & Kyburg, 2006). The emphasis on exam scores may contribute to student perception that the purpose of advanced courses like AP or IB is not learning and understanding, but rather acquiring content, credentials, college credit, and admissions desirability (Hertberg-Davis et al., 2006).
Grading practices in AP are also the subject of some controversy. Geiser and Santelices (2006) found that some schools gave “bonus points” for AP courses, bumping students up to the grade they would have received in a non-AP course, such as from a “B” to an “A”, leading to grade inflation. Godfrey (2011) also found that AP grading practices were inconsistent between schools in the same subject areas, which made using AP course grades for evaluation complex. AP course grades, like other forms of grading, has been shown to include constructs beyond pure achieve-ment such as effort and cooperation to grade their students, with no two teachers having the same grading system within the same-named course (Conley, 2000). Further, in some schools, such as those in Dallas, teachers benefit financially from their students' scores” (Santoli, 2002, p. 32), which may lead to accusations of grade inflation.
In a study comparing AP exams written in 1996 versus 2006 in one large, diverse (US) state public school system, Godfrey showed the high school GPA of the 2006 group was 2.90 while the 1996 group was 2.64 (both on a 4.0 scale), with standardized exams like the SAT seeing little change in average, suggesting increasing grade inflation (Godfrey, 2011).
BCCAT 11Understanding Advanced Placement Grading in BC
Advanced Placement programming is criticized due to its uneven accessibility (Shaw et al., 2013; Hallet and Venegas, 2011; Hoffman, 2003; Geiser & Santelices, 2006), with most AP offerings being in large, non-rural high schools (Klopfenstein, 2004; Wakelyn, 2009), whose population tends to be high in socioeconomic status (Klopfenstein & Live-ly, 2012). While a number of government incentives and programs (Klopfenstein, 2003), including No Child Left Behind, various state policies, and philanthropic donations in the United States (Byrd et al., 2007) provide subsidies to schools for offering Advanced Placement, research shows that access for traditionally under-served students is increasing in absolute but not relative terms (Klopfenstein, 2004). Even those schools that do offer AP may have restrictions on the number of courses available, or only offer seats to the best and brightest, sometimes due to government incentives that reward high exam scores (Klopfenstein, 2003). By way of example, Wakelyn (2009) reports that 51% of students from high income households participated in AP or IB, while only 16% from low income households participated. Patterson, Packman, and Kobrin (2011) also highlighted that AP participants, where their parents’ highest educa-tion level was a bachelor ’s degree, earned subject-area GPAs of 0.04-0.11 higher than students with parents who had completed only high school diplomas. Further, as the AP program has expanded, some schools have seen a decline in exam scores, causing some to question the effectiveness of expanding the program (Vaughn, 2010).
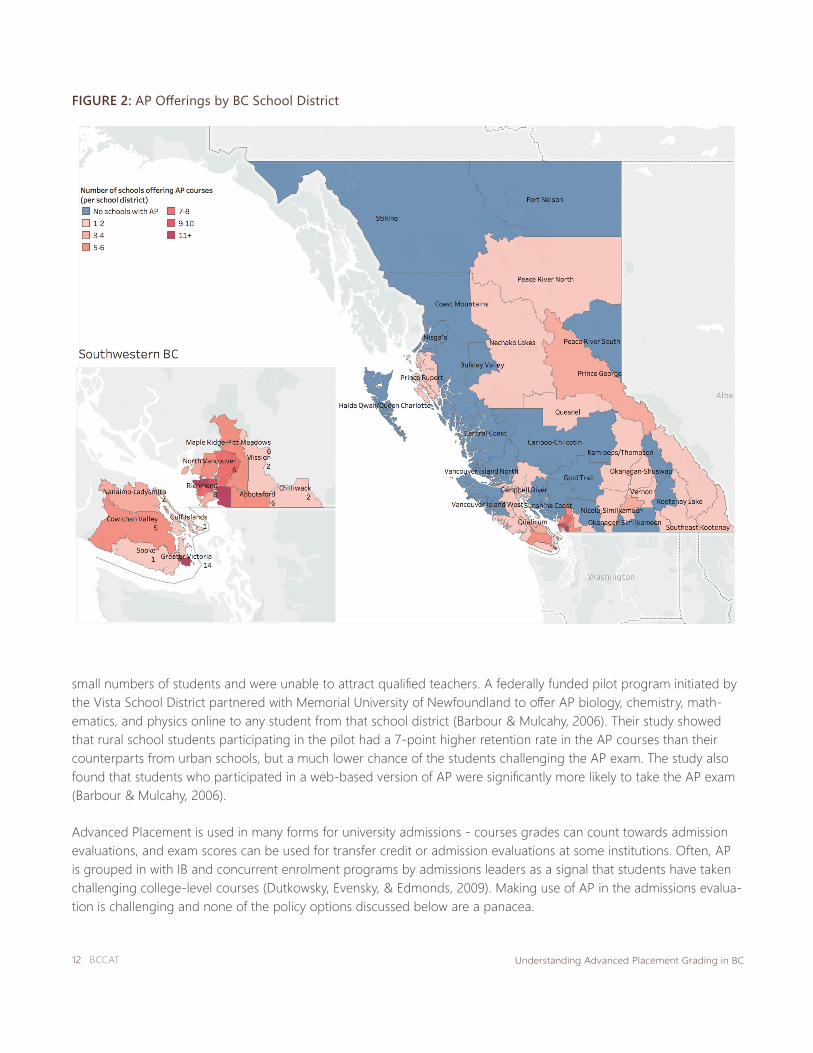
In British Columbia’s context, roughly two-thirds (39 of 59) of the school districts in the province offer at least one AP course1, as illustrated in Figure 2 below. Every school district within the Capital, Fraser Valley, and Greater Vancouver Regional Districts’ offers at least one AP course at one or more of its schools, which accounts for 18 of the school districts that offer AP. Overall, 20 of the province’s remaining school districts offer AP courses, while 20 districts do not offer AP, illustrating the AP accessibility challenges faced by BC students from outside the 3 most-populous regional districts.
Figure 2 shows the geographic distribution of school districts offering AP courses. At the time of writing, a list of specif-ic course offerings was not available provincially, but the College Board website listed schools that offered at least one AP course in BC. This information was mapped to school districts and administrative areas publicly available from BC Stats (1996, 2011). The maps show concentrations of schools offering AP located primarily, but not exclusively, in urban regions in BC. A note of caution in using map based analysis: the colour coding may overemphasize school districts with multiple schools offering AP (such as a school district with 5 schools offering one AP course each versus a school district with one school offering 5 courses), and the geographic representation may overemphasize geographically large school districts regardless of enrolment.
One interesting Canadian study highlighted AP accessibility challenges in Newfoundland and Labrador, which intro-duced the AP curriculum in 1992-93. Urban and rural schools quickly adopted the curriculum initially, however, only the large, urban schools continued this after the first few years (for context, urban was defined as a community of 5,000 or more residents; Barbour and Mulcahy, 2006). Rural schools found that it was unfeasible to offer the courses to
1 Author's calculations. Information on schools offering AP from College Board (n.d.b.) and translation from school names to school districts and administrative areas based on BC Stats (1996 and 2011)
In British Columbia's context, roughly two-thirds (39 of 59) of the school dis-tricts in the province offer at least one AP course, as illustrated in Figure 2.
12 BCCAT Understanding Advanced Placement Grading in BC
FIGURE 2: AP Offerings by BC School District
small numbers of students and were unable to attract qualified teachers. A federally funded pilot program initiated by the Vista School District partnered with Memorial University of Newfoundland to offer AP biology, chemistry, math-ematics, and physics online to any student from that school district (Barbour & Mulcahy, 2006). Their study showed that rural school students participating in the pilot had a 7-point higher retention rate in the AP courses than their counterparts from urban schools, but a much lower chance of the students challenging the AP exam. The study also found that students who participated in a web-based version of AP were significantly more likely to take the AP exam (Barbour & Mulcahy, 2006).
Advanced Placement is used in many forms for university admissions - courses grades can count towards admission evaluations, and exam scores can be used for transfer credit or admission evaluations at some institutions. Often, AP is grouped in with IB and concurrent enrolment programs by admissions leaders as a signal that students have taken challenging college-level courses (Dutkowsky, Evensky, & Edmonds, 2009). Making use of AP in the admissions evalua-tion is challenging and none of the policy options discussed below are a panacea.
BCCAT 13Understanding Advanced Placement Grading in BC
Geiser and Santelices (2006), in their study based on 81,445 freshmen entering the University of California between 1998 and 2001, identified some policy options for admissions officers to consider:
• Award extra weight to AP coursework in admissions decisions only where students have completed the AP exam with a sufficient score. This method is rooted in using the AP exam’s predictive validity of college per-formance. The University of California began this practice in the early 1980s, and it is reasonably common at selective institutions in the United States.
• Reduce the weight given to AP and honours coursework.
• Consider students’ AP and honours coursework in the local context - the extent to which students took ad-vantage of curriculum at their school. This policy is intended to level the playing field between urban and rural schools that offer differing levels of advanced coursework.
Awarding extra weight to AP coursework only where the exam has been completed with a sufficiently high score runs into the challenge that AP exam grades are made available too late in the admissions cycle. This could have the unintended effect of encouraging students to take AP coursework before they have the necessary experience to be successful. This policy could unfairly penalize other advanced programs, such as honours, that do not have the option of national standard exams (Geiser & Santelices, 2006).
The local context policy suffers from the fact that the link between AP coursework and college success has not been strongly demonstrated: AP exam performance relates strongly to college performance, but merely taking AP or honours courses is not a valid predictor of postsecondary performance (Geiser & Santelices, 2006; Clark, Scafidi, & Swinton, 2012). Geiser and Santelices found that many students who take AP courses do not complete the associated exams (2006). Further, the grading practices between the high school AP courses and college course curricula are dif-ferent, accounting for more of the variation in grades than simply which high school the grade came from (Patterson et al., 2011).
Inconsistent grading practices between high schools and postsecondary institutions, as well as grade inflation, will make it challenging for institutions to appropriately make comparisons across groups of students from different schools (Godfrey, 2011). Optimally, an admissions officer needs to be able to not only factor in which courses were taken, but which were available to be taken, in the context of the students’ other activities (Sternberg, 2010).
Reducing the weights assigned to AP coursework aims to:
strike a balance between two fundamental, but competing, policy concerns: maintaining an incentive for students to take rigorous, higher-level coursework while minimizing disparities among disadvantaged and underrepresented minority students. The issue is often simplified as a question of balance between “aca-demic quality” and “fairness,” and the reduced-weight option “splits the difference,” in effect, between these two core values. Granting only a half point for AP/honors, for example, preserves an incentive for students to take advanced coursework in high school but at the same time is intended to mitigate the adverse impact of such coursework as a criterion for college admission. (Geiser & Santelices, 2006, p. 22)
Leaving any weights assigned to AP could still leave disparities between groups able to participate in AP and those not, just smaller disparities than with larger weights (Geiser & Santelices, 2006). Further, Godfrey (2011) notes that in jurisdictions where class rank can determine admission, some students may reconsider their decision to enrol in AP.

14 BCCAT Understanding Advanced Placement Grading in BC
Another challenge of using AP exams for admissions purposes is the construct validity of the exams - whether they are measuring what they are intended to measure. Sternberg (2012) found that inserting items assessing creative and practical thinking into the AP psychology, statistics, and physics exams resulted in higher construct validity, while reducing the differences between ethnic groups.
Part of the challenge of including AP in admissions criteria is determining exactly what the metric of success that justi-fies such inclusion is. One method of measuring student success is the fact whether the student completed a creden-tial or not. Adelman (1999) shows that post-secondary performance is related to curriculum intensity and quality more so than class rank and GPA when graduating high school. When comparing three outcome measures entering post-secondary, completing either an associate’s or bachelor ’s degree, and completing a bachelor ’s degree – all by age 30, Adelman (1999) found that performance is more related to completing the degree program than it is to entering post-secondary, “even though 85 percent of those who took AP courses continued their education after high school” (p. 20).
Sadler and Tai’s (2007) study, which focused on the performance of AP and honours students in science related courses, found the practice of adding bonus points for AP and honours courses is supported as these students per-form better in postsecondary study in related areas. However, there is a limit to the value of the advanced courses: “students who end their high school years with a B in an AP course do not do better in the college subject than those who earn an A in the regular course. Those who earn a C in AP science do significantly worse than those who earn an A in a regular science course” (Sadler & Tai, 2007, p. 24).
Of particular interest is research showing minimal difference in post-secondary course grades between students who scored a 4 on the AP exam and those who scored a 3, suggesting institutions may want to consider awarding transfer credit or at least advanced standing to students who scored a 3 (Morgan & Klaric, 2007).
Of particular interest is research showing minimal difference in post-secondary course grades between students who scored a 4 on the AP exam and those
who scored a 3, suggesting institutions may want to consider awarding transfer credit or at least advanced standing to students who scored a 3
(Morgan & Klaric, 2007).

BCCAT 15Understanding Advanced Placement Grading in BC
Environmental Scan
Post-secondary institutionsInterviews were conducted with representatives of the following BC Post-Secondary institutions:
• Capilano University (Capilano)• Kwantlen Polytechnic University (KPU)• The University of British Columbia (UBC)• The University of Victoria (UVic)• Vancouver Island University (VIU)
In addition to the interviews, information from Admissions websites of the following institutions are included in this environmental scan:
• Simon Fraser University (SFU)• Thompson Rivers University (TRU)• University of Northern BC (UNBC)• University of the Fraser Valley (UFV)• Camosun College (Camosun)• Langara College (Langara)• Douglas College (Douglas)
The authors recognize that this is a relatively small sample set and therefore we are only able to identify emerging themes and areas that warrant further data gathering and analysis. Appendix 2 contains the full list of interview ques-tions.
AP policies and practices at post-secondary institutions
Most post-secondary institutions have specific criteria posted to their websites that outlines how AP courses are evaluated, and what types of transfer credits are received for certain scores on the AP exam. While the exact scores required differ by institution, the policies overall are quite similar.
AP in admissions evaluationKPU, SFU, and UBC may substitute AP exam results in the admission calculation if those results are available at the time of admission (in practice, this is most common for students who completed the AP exam prior to their grade 12 year). These institutions convert exam scores to a percentage (5 = 96%, 4 = 86%, 3 = 80%, and 2 = 70%). Capilano, UVic, and VIU do not explicitly state whether they will substitute an AP exam for the purposes of calculating an admission average.
UBC notes that AP course grades may be combined with an approved high school curriculum to meet the University’s admission requirements. The other institutions do not explicitly state whether AP course grades may be counted towards admission averages.

16 BCCAT Understanding Advanced Placement Grading in BC
AP for transfer creditMost BC institutions award transfer credit for a score of 4 or higher, though some institutions will grant either transfer credit or advanced standing - the ability to take an advanced course, but not the prerequisite - based on an exam score of 3 or higher. There are a few exceptions currently in the BC Transfer Guide. UVic’s introductory Chemistry sequence (CHEM 101 & 102) requires an exam score of 5 in AP Chemistry, and UVic’s introductory Physics course sequence (PHYS 102A & 102B) requires an exam score of 5 in either AP Physics B or both of AP Physics 1 and AP Physics 2. Langara will accept a 3 in AP Studio Art: General and AP Studio Art: Drawing pending a departmental review. As an alternative to transfer credit, some institutions will award advanced standing – the ability to skip the introductory course, but not re-ceive the transfer credit for it – with scores of 3 or 4 on the AP exam. UVic’s transfer credit website explains that advanced standing may be granted with a score of 3 or higher, while Spanish Language, and Spanish Literature and Culture at SFU will grant advanced standing with a score of 4 or higher.
Key themes from post-secondary institution interviews
This section focuses on themes emerging from the interviews conducted with Capilano, KPU, UBC, UVic, and VIU.
AP policy and practice has not been studied latelyMost post-secondary institutions interviewed have had their existing AP policies in place for a long time. While review occurs at least annually on transfer credit requests related to AP, most institutions we spoke to (with the exception of UBC) have not studied the success of AP students in recent memory.
Differences in AP grading between schoolsSome admission officers wonder whether there are differences in grading between schools that offer AP courses, though so far none have studied whether there is a significant difference based on school attended. Post-secondary interviewees generally feel there are likely differences in terms of rigour between schools but have no way to confirm this.
Course transcription practicesThe universities have also identified questions around the courses that appear on the transcript and what the grades actually mean. It appears some high schools may employ different grading practices. Some examples of this are schools that grade an AP course based exactly on that curriculum and assign an appropriate percentage. Others give an AP grade based on how they think the student would perform in the analogous non-AP course. Some schools give credit for both the AP course and for the non-AP analogue; these could have different grades. The university interviewees also felt some schools add grades to the transcript based on the student taking just the AP exam.
BC’s graduation handbook indicates that AP (or IB) courses should be recorded on the transcript based on the school mark, as both percentage and letter grade (Government of British Columbia, 2017). The handbook does not provide a recommendation on equivalencies between the BC curriculum and the AP curriculum.
The post-secondary institutions that were interviewed for this report generally feel they lack insight into what is actually happening in the schools. For example, if a school offers a combined class of an AP course and a non-AP course, and both appear on the transcript, the post-secondary institution would have no way of knowing whether the student actu-ally took part in activities for both unique courses, or whether credit was granted simply based on the AP course. We note this as an area for further investigation.

BCCAT 17Understanding Advanced Placement Grading in BC
Challenges to granting AP transfer credits within post-secondary institutionsOne additional challenge facing post-secondary institutions is that their academic departments will sometimes require a higher AP standard than the university requires generally. This practice can have the effect of denying transfer cred-its based on discipline even if the course nominally should grant transfer credit for AP. Some interviewees also noted that AP transfer credits can be challenging to evaluate when new courses are introduced.
Secondary schoolsThis section focuses on secondary school participants, key questions raised by post-secondary representatives in the project invitation and in the interviews conducted for this project (see Appendix 2 section on Secondary Schools), and questions and concerns raised by secondary school teachers or counsellors.
Participants
We contacted 29 secondary school teachers or counsellors affiliated with the AP program at their respective schools. Our initial contact was on March 16, 2017 (during Spring Break for many teachers), and a follow up was sent on April 10, 2017 to anyone who had not yet responded. In total, 14 have responded, with 8 participating in interviews, 2 de-clining to participate, and 2 asking us to contact the school district for permission first (permission was later received from the Burnaby School District), and 2 that we connected with but were unable to schedule prior to the end of the academic year.
We interviewed teachers, counsellors, or principals in the following geographic areas:
• Burnaby: Burnaby North Secondary, Cariboo Hill Secondary• West Vancouver: Rockridge Secondary, Sentinel Secondary• Vancouver: St. George’s School*2, York House School*• Abbotsford: Yale Secondary• Vancouver Island: Saint Michaels University School*
Grading policies and practices in secondary schools
Several key themes related to AP grading were identified by the BC’s post-secondary interviewees in this study. The interviews with representatives from the secondary school sector centered around these themes:
1. options for earning both AP and non-AP credit; 2. differences in grading between AP courses and their non-AP counterparts; 3. the mastery of which curriculum is reflected by a particular grade; 4. how AP exams relate to AP course grades; 5. whether curving, weighting, or scaling are used in grading; and 6. whether there are inconsistencies between subject areas, schools, or geographic areas.
2 *indicates an Independent School

18 BCCAT Understanding Advanced Placement Grading in BC
Given the small number of secondary schools that participated in interviews (only 8 interviews were conducted) it would be useful to conduct further research on secondary school practices related to the above themes. The results of a more comprehensive study could inform development of provincial guidelines for consistent practices.
Earning credit for both AP and non-AP coursesMost schools provide students the opportunity to earn credit for both an AP course and a non-AP course - for ex-ample, earning credit for both AP Chemistry 12 and Chemistry 12. Practices between schools were different, however. At some schools, the courses were scheduled in the same room at the same time, and some questions or assignments related to the AP curriculum and some to the non-AP curriculum. Other practices included offering an additional lab component for about 45 minutes per week (for science courses) that would allow an AP student to earn credit for the ministry course in addition to the AP course. Other schools indicated that acquiring the non-AP credit could be achieved by taking the AP course and then writing the school-created exam related to the non-AP course, in disci-plines that do not have provincial exams.
Practices around earning credit for both AP and non-AP courses generally coalesced around how closely the curricula for the AP and non-AP courses aligned. If the curricula were closely aligned, most schools provided the option for students to earn credit for both versions. An example of closely aligned curricula is AP Chemistry 12 and Chemistry 12. If the curricula were significantly different between the courses, then credit for both courses was not typically offered, with an example of low alignment being AP Human Geography 12 and Geography 12.
One other area where earning both credits was not always an option is when a school does not offer both curricula. A common example was AP Macroeconomics 12, where the school did not offer Economics 12. Only in rare cases would credits appear differently – one school mentioned that if a student was struggling severely in the AP course, they could be given credit based on the high school curriculum instead.
Grading and credits of AP and non-AP coursesOur interviews with secondary school representatives delved more deeply into whether there are differences in grading practices between AP courses (for example, AP Chemistry 12) and their non-AP counterparts (for example, Chemistry 12). All participating schools indicated that the grades between these courses can be different, and stu-dents can earn credit for both courses, though the methods of how this is achieved differ by school (as discussed above). At most of the schools who participated in this study, if students earn credit for both the AP and non-AP course, the AP course will receive a lower percentage grade than the non-AP course, but that is not a rule, rather a generally observed phenomenon. As currently presented, neither the transcript nor post-secondary data yields insight into whether the student participated in two separate courses with distinct outcomes nor whether credit was granted automatically for a provincial course due to completion of the AP course. One representative did identify that they
Practices around earning credit for both AP and non-AP courses generally coalesced around how closely the curricula for the AP and non-AP courses
aligned. If the curricular were closely aligned, most schools provided the option for students to earn credit for both versions.
BCCAT 19Understanding Advanced Placement Grading in BC
make the provincial non-AP course 5% higher than the AP course, as a rule, where analogous courses exist between the provincial and AP curricula. No interviewees mentioned an automatic award of an identical grade in each course.
Most interviewees mentioned that grading was an individual instructor responsibility. While there is a set curriculum, exact grading is in the hands of teachers. Different levels of professional development opportunities can help ensure consistency: the College Board offers workshops and conferences, some school districts encourage their AP teachers to collaborate or have an AP coordinating committee, and the Independent Schools Association will occasionally have subject matter targeted at AP. Further, school districts with multiple offerings of AP (such as Burnaby and West Vancouver) tend to have coordinating committees or meetings of AP teachers, which provide guidance.
The mastery of which curriculum is reflected by a particular gradeThe interview participants indicated that the grade on the transcript for an AP course was reflective of mastery of the AP curriculum, and the grade for the non-AP course was reflective of mastery of the non-AP curriculum. One repre-sentative mentioned that they struggled to determine a BC percentage grade equivalent for AP courses, and conse-quently used the predicted AP exam score and converted it to a percentage grade for the AP course, based on UBC’s conversion scale. This practice was likely not consistent between different teachers.
How AP exams relate to AP course gradesSome schools require their students to take the AP exam as a condition of signing up for the AP course. These schools also typically prevent students from challenging the exams without taking the course. The exceptions to this rule occur where the student has acquired mastery elsewhere. For example, an AP Music Theory challenge would be permitted for a student studying at the Royal Conservatory of Music; AP Chinese is not offered as a course, but some students speak the language already.
There are also many students who challenge the AP exam and do not enrol in the course. In some locations, School Board offices provide the option to write the AP exam, thereby bypassing the classroom learning experience. Gener-ally, the secondary schools do not know about this, and if they do, it is not typically recorded in any way. Only one interviewee noted that they had recently started showing a course grade on the transcript for those who challenge the AP exam, converting the exam grade into a percentage using UBC’s conversion scales.
Whether curving, weighting, or scaling are used in grading All participants indicated that they did not use curving, weighting, or scaling explicitly in their AP grading practices. However, as mentioned previously, grading is done by individual instructors, so there may be a lack of visibility into whether this practice is used for individual learning components. The one interviewee who indicated this may occur suggested that scaling is a bit more common in science and mathematics disciplines than the humanities. There was inconsistency between subject areas and teachers, so the practice may not be widely observable. Another school rep-resentative also brought up that teachers were aware that AP coursework is university level and very challenging, and did not want to penalize students for taking the course. Our contact indicated this was not an explicit grading policy, but may be a factor nevertheless.
Some participants indicated that schools were asked to provide predicted AP grades, particularly for US universities. When this happens, the teacher will use a scale similar to UBC’s percentage conversion (exam score of 5 = 96%) in terms of assigning a predicted grade.

20 BCCAT Understanding Advanced Placement Grading in BC
No interviewee indicated that they “bumped” final AP grades up – for example, moving a student from an 85% in AP Chemistry to a 90% to reflect how they would perform in Chemistry 12. However, one participant identified that they “bumped” final non-AP grades up by 5% as a rule. In this case, if the student achieved 85% in AP Chemistry, they would automatically receive 90% in the non-AP course.
Inconsistencies between subject areas, schools, or geographic areas Most interviewees find that there are challenges in consistency across their different academic areas because the methods of assessment vary considerably subject to subject. Teachers generally were not aware whether grading practices were inconsistent outside of their own school. They did not generally have visibility into the phenomena. Teachers also commented that the AP exams provided a comparable standard in the absence of having provincial exams.
Secondary school questions and challenges related to AP
In the eight interviews we conducted with secondary school representatives, the following questions and challenges emerged. The authors recommend conducting further research to confirm the pervasiveness of these issues across the sector. We also note that where student views are presented, the information was gathered anecdotally, as shared by the teachers that were interviewed.
Perceptions of Advanced PlacementThe biggest challenges noted by our participants relate to how AP courses are perceived by students and parents versus how they are used for university admission. Students and parents nearly universally feel that AP courses are better preparation for university than non-AP courses. However, because of the more advanced curriculum and pace of the course, many students feel they receive lower grades in AP courses than they would have in a non-AP course. This lower grade can put them at a competitive disadvantage when it comes to applying to highly selective university programs: “If I take AP Physics 1, I’ll get an 83; if I take Physics 12 I’ll get a 91… why would I take AP?”
Value of transfer creditThe interviewees noted that many students did not view the transfer credit awarded as a consequence of earning a high score on the AP exam as an asset. The students’ views seem to split in two directions. They can decline the transfer credit and take the same first year course so that they can do really well and boost their GPA. Alternatively, they can accept the transfer credit and use the space in their calendar to enrol in an elective that will help set them apart from others studying in the same area. Students who took AP courses and then completed the first-year equiva-lent at the university found it helped them be successful. An example of such student sentiment was provided by one teacher: “I’m so glad I took AP Stats. I was the only one at [the university] who took it, and Stats was our hardest first year course. I’m not saying I found it easy, but AP ensured it was manageable. I was even able to help other students be successful.”
AP credits for university admissions evaluationThe teachers remarked that they would generally like to see students who complete one or more AP courses treated differently by the universities than those who do not pursue AP. The challenge here may be appropriately differentiat-ing students – should a student with one AP course be treated differently than a student with five?

BCCAT 21Understanding Advanced Placement Grading in BC
The interviewees did note that there was substantial pressure on students for university entry, which leads to pressure to increase marks.
Relationship between AP exams and secondary school course marksMany interview participants would like to better understand the relationship between the course grade and the AP exam grade. While the College Board provides professional development and training, this may be an area to pursue for future research.
Pre-AP and AP Capstone and Seminar SeriesMost interviewees offered some form of pre-AP studies, often in the form of honours courses at their school. Some mentioned that the lower level AP courses were being taught as pre-AP in grade 11 – for example, Physics 1.
Some schools are able to offer additional supports through the AP Capstone course series, which consists of an AP Seminar course typically taken during the grade 11 year, and an AP Research course typically taken during the grade 12 year (College Board, n.d.a). Students who receive scores of 3 or higher on the AP Seminar, AP Research, and 4 ad-ditional AP exams receive the AP Capstone Diploma; students who receive scores of 3 or higher on the AP Seminar and AP Research exams, but not on 4 additional AP exams, receive the AP Seminar and Research Certificate. As of this writing, 8 schools in BC offer the AP Capstone sequence: Brentwood College, Burnaby North Secondary, Burnaby South Secondary, Collingwood School, Crofton House School, Saint Michaels University School, Sentinel Secondary, Shawnigan Lake School. Southpointe Academy, and Walnut Grove Secondary. An additional 17 schools across Canada, offer the AP Capstone: 10 in Ontario, 4 in Alberta, 2 in New Brunswick and 1 in Nova Scotia. Of the 27 schools cur-rently offering the AP Capstone program 15 are independent/private schools and 12 are public schools.
School districtsAt this time, most teachers and counsellors we spoke to have indicated that AP was managed at the school level with minimal oversight from the school district. Richmond and Burnaby, thus far, appear to be exceptions – teachers have indicated school board approval is needed prior to their participation in research. This policy may not relate to AP, however. The Burnaby School District approved teacher participation in this study.
The College BoardWhile the College Board was not initially on the list of contacts for this project, a few secondary school teachers highly recommended that we reach out to George Ewonis, who oversaw AP in Canada for several decades for the College Board and had strong relationships with many of the BC AP teachers (Mr. Ewonis has since retired).
From the College Board’s vantage point, the existing system of recognizing the value of AP exams for transfer credit has generally worked fairly well for students, though it is noted that elite universities struggle with admissions deci-sions as there are too many students who are exceptionally well qualified.
George indicated that it was important that students should not be disadvantaged for choosing a more advanced curriculum. He supported the common BC practice of using both the AP or non-AP grade and choosing one that
22 BCCAT Understanding Advanced Placement Grading in BC
most benefits the student. It should be noted, however, that the College Board is only involved in the exam, not in the provision of course grades. Mr. Ewonis was aware that many universities had done studies on the performance of AP students, but these results were not available publicly.
The College Board maintains a large repository of research and data. While much of it is focused on the United States, there are a few Canadian focused datasets (e.g., College Board, 2016).
Case StudyFor the case study, Kwantlen Polytechnic University (KPU), the University of British Columbia (UBC), and the University of Victoria (UVic) elected to participate. The institutions provided anonymized case level data focused on aggregate performance (such as term or first year GPA), aggregate admission information (such as admission average, school district attended, and whether the student was domestic or international at the time of admission), subject level per-formance, and individual course performance, with which we created a number of datasets to be used for statistical modelling. All 3 participating institutions provided cohort data for BC Grade 12 students, including both those who participated in AP and those who did not. The datasets gathered are summarized in Appendix 1.
The case study attempted to answer 4 key questions:
1. In aggregate, is there a difference in performance (as measured by first-year GPA) between AP students and non-AP students?
2. In aggregate, is there an appropriate equivalency between the AP scales presented and post-secondary per-formance? By way of example, if there are two students, one who took only non-AP courses and achieved a 90% admission average, and the other took 4 AP courses also with a 90% admission average, could the latter student be expected to perform better than the former student?
3. At the course subject level, is there a difference in performance (as measured by subject area GPA in the first two years of study) between AP students and non-AP students?
4. At the individual course level, is there a difference in performance (as measured by course grades in the first two years of study) between AP students and non-AP students?
Before reporting on the findings, we’ll provide information on how the data was collected and what data was avail-able.
Data summaryThe data covered two entry cohorts of students who entered each institution directly from BC secondary schools. The cohorts of students from BC secondary schools began studying at the PSIs in 2013-14 and 2014-15 (Table 1).

BCCAT 23Understanding Advanced Placement Grading in BC
Due to differences in location (KPU in the western Fraser Valley, UBC in Vancouver, and UVic in Victoria) and mission (KPU as a special-purpose teaching university, UBC and UVic as research universities) we expected that the population drawn to and served by each institution would be distinct. Additionally, the three institutions use 3 different grading scales (KPU a 4.33 GPA scale, UBC a percentage scale, and UVic a 9.0 GPA scale).
In KPU’s case, as an open access institution, the notion of admission average is not applied in a universal and equal way; in turn, KPU elected to provide grades for English 12, Math 11, and Math 12 (when available) as the closest proxy that KPU has to an admission average. These grades were not the specific grades obtained by the student but rather thresholds; the discrete values included were 33, 40, 50, 60, and 80. KPU does not track AP exam dates, locations, or scores, nor does it keep records of transfer credits (including for AP) that were not awarded.
Further data caveats and details are provided in Appendix 4.
TABLE 1: Description of the case study cohorts and grades on transcripts
KPU UBC UVicTotal students 6,389 6,589 3,662
Students with AP courses (% of total) 489 (7.7%) 2,197 (33.3%) 670 (18.3%)Total enrolments in AP courses 611 4,258 1,012
Most common AP courses (* indicate predictive capability of post-secondary per-
formance in subject areas)
AP Calculus AB 12*AP English Literature & Composition 12AP Psychology 12
AP Calculus AB 12* AP English Literature & Composition 12 AP Chemistry 12 AP Psychology 12 AP Biology 12.
AP Calculus AB 12* AP English Literature & Composition 12 AP English Language & Composition 12AP Psychology 12 AP Chemistry 12
Both BC and AP course analogues on transcripts (% of all enrolments) 66.2% 64.0% 67.6%
BC grade = AP grade 68.1% 22.1% 21.7%BC grade > AP grade 19.4% 67.1% 64.8%BC grade < AP grade 12.5% 10.8% 13.5%
BC course grade higher average 0.8pp 3.3pp 3.3ppBC course grade higher median 0.0pp 2.0pp 2.0pp
UBC attracts a significant number of students who enter post-secondary directly from British Columbia’s secondary school system and who have completed Advanced Placement classes. Fully 1 in 3 of UBC’s BC direct entry new stu-dent population in our sample frame had completed at least 1 AP class in secondary school, compared with 1 in 6 at UVic and 1 in 13 at KPU (Table 1). UBC’s annual incoming AP population is also nearly 3 times UVic’s and 5 times KPU’s. Students who enter UBC and who took AP classes also tended to take more AP classes, averaging 1.9 AP classes per AP student, compared to 1.5 at UVic and 1.4 at KPU; UBC also has more students at a high number of AP classes, with some students taking as many as 11 AP classes.

24 BCCAT Understanding Advanced Placement Grading in BC
The AP students that attend the three institutions also take different mixes of AP classes. AP Calculus AB 12 is the most popular choice at all three institutions, followed by AP English Literature & Composition 12. Ranked 3rd at UVic in AP English Language & Composition 12, which is ranked 6th at both UBC and KPU. AP Psychology 12 is common across institutions in a similar rank – 3rd at KPU, 4th at UBC and UVic. But with AP Chemistry 12 and AP Biology 12, we see a different pattern emerging. At KPU, these courses have roughly similar number of students that took the courses (ranked 4th and 5th, respectively), but they lag well behind the top 3 AP courses. At UBC 40% more students take Chemistry to Biology, ranked 3rd and 5th, but they are solidly in a tier of major AP classes. At UVic nearly twice as many students take Chemistry (5th) to Biology (6th), and they mark a transition from major AP courses to ones seen much more rarely. (See Figures 12, 13, and 14 in Appendix 4.) Some of this pattern is likely explained by program. What we cannot answer with the data available to us for this case study is whether these selections by the students are based on the program they wish to pursue in post-secondary or the AP courses available to them in their second-ary school.
Data transformation and statistical analysis
Using the data provided by the institutions, we connected and transformed the data into similar formats to provide datasets that crossed all three institutions. Three datasets were created:
• A comparison between AP courses and the analogous grade 12 course;
• Student post-secondary performance aggregated by academic year, with indicators for classes taken at the grade 12 level; and
• Student post-secondary performance aggregated by course and subject area, with indicators for classes taken at the grade 12 level.
With the final dataset, analysis was undertaken in a variety of tools. Visual analysis was done with Tableau Software’s Tableau Desktop, while the statistical analysis was undertaken in a combination of Python using the pandas (McKinney, 2010), patsy, and statsmodels (Seabold & Perktold, 2010) packages for linear regressions and R using the BMA package for Bayesian model averaging (Raftery, Madigan, & Hoeting, 1997).
One of the difficulties in generating models is selecting the appropriate variables. In this study, while we have some general factors that often explain some of the variance we see in outcomes (measured either by first-year aggregate grade point average, or performance in individual courses or subject areas), we are not sure which AP-related indi-cators we have may be useful. Testing one factor or indicator at a time may yield statistical significance but little or no additional explanation of variance, and different combinations of factors may yield some useful results and other less-useful ones. One technique to deal with this difficulty is Bayesian model averaging, where a number (in our case, hundreds) of different models are created with combinations of factors and tested. Factors are then scored based on how many of the models that are classified as “good” (that is, are more likely to be the “true” or best model) they appear in. We utilize this technique, in addition to linear regressions, in the analysis below. More details on the analysis as well as model selection and fitting can be found in Appendix 5.

BCCAT 25Understanding Advanced Placement Grading in BC
Comparisons of performance between similar AP and non-AP coursesIn order to further our understanding of the PSI’s concerns about how grading practices differed between AP and non-AP courses, and whether students received credit for both the AP and non-AP course, we compared grades in the courses shown in Table 2. While some course pairs have more curricular similarities (AP Chemistry and Chemistry 12, for example) than others (AP Human Geography and Geography 12, for example), this test gave us a baseline for how frequently students received grades for both halves of the course pair, and by how much the grades differed. AP Physics 2 replaced AP Physics B for the 2014-15 school year, with the last exams of AP Physics B written in June 2014.
ResultsGenerally, the proportion of students who had completed an AP course was higher with higher admissions GPA (UVic) or Grade 12 English grades (KPU; used as a proxy admissions GPA) (Figure 9 and Figure 3 respectively). UBC data shows a similar trend, though at admission averages of 97% and above this trend does a sudden and dramatic rever-sal; it isn’t clear based on the data available to us why this might be (Figure 6).
Of AP courses that have a roughly analogous BC provincial courses (Table 2), approximately 2 in 3 students that entered one of our case study institutions in our sample frame and who had one of the AP courses on their transcript also had the analogous BC provincial course. The percentage of enrolments where this was, not surprisingly, the case is highest in the AP English courses (AP English Language & Composition 12 and AP English Literature & Composition 12) with nearly 100% of students having both courses. This phenomenon may be explained by the fact that English 12 is a graduation requirement, so schools will ensure it is present on the transcript. Following closely behind are the traditional secondary science courses (AP Biology 12, AP Chemistry 12, and the AP Physics variants) with between 80% and 100% of students having both courses, depending on institution and course. The remaining AP classes with matches lag much further behind, with 50% or fewer students (saving those cases with very small numbers of students with the AP class in our sample) having the matching BC course on their transcript.
Students who do have both the AP and BC analogue course on their transcript tend to have a higher grade in the BC analogue course, which reinforces what we heard during the environmental scan of secondary schools. However, this is far from universal - at UBC and UVic roughly 65%-67% of these matched enrolments had a higher grade in the BC version of the course, with about 22% having the same grade in both and 11%-13% having a higher grade in the AP version of the class (Table 2; Figure 8 and Figure 11). KPU shows a markedly different pattern to UBC and UVic, with 68% having the same grade in both version, 19% a higher grade in the BC version, and 13% a higher grade in the AP version (Figure 5). The median difference between the grades is 2.0 percentage points towards the BC version of the course at UBC and UVic and the same grade at KPU, with the average difference 3.3 percentage points at UBC and UVic and 0.8 percentage points at KPU, again towards the BC course (Table 2). Similar to the AP course selections, it is unclear why these differences exist between institutions. This may be a function of the students who select the institu-tion, or a function of grading practices of secondary school teachers in schools and districts from which KPU draws its students. These practices may be different from grading in the areas from which UBC and UVic draw significant student populations.

26 BCCAT Understanding Advanced Placement Grading in BC
AP Course Code AP Course Title BC Course Code BC Course TitleAP2DP12 AP 2-D Design Portfolio 12 No similar courseAP3DP12 AP 3-D Design Portfolio 12 No similar courseAPAR12 AP History of Art 12 No similar courseAPBIO12 AP Biology 12 BI12 Biology 12APCAL12A AP Calculus BC 12A CALC12 Calculus 12APCAL12B AP Calculus BC 12B CALC12 Calculus 12APCAL12 AP Calculus AB 12 CALC12 Calculus 12APCGP12 AP Comparative Government & Politics 12 No similar courseAPCHE12 AP Chemistry 12 CH12 Chemistry 12APCLC12 AP Chinese Language and Culture 12 MAN12 Mandarin 12APCSC12A AP Computer Science A 12 No similar courseAPCSC12 AP Computer Science AB 12 No similar courseAPEL12 To be confirmed No similar courseAPELC12 AP English Literature & Composition 12 EN12 English 12APEN12 AP English Language & Composition 12 EN12 English 12APENS12 AP Environmental Science 12 No similar courseAPFRL12 AP French Language 12 FR12 French 12APGE12 AP German 12 GE12 German 12APHG12 AP Human Geography 12 No similar courseAPHI12 AP European History 12 HI12 History 12APJLC12 AP Japanese Language & Culture 12 JA12 Japanese 12APMA12 AP Macroeconomics 12 EC12 Economics 12APMI12 AP Microeconomics 12 EC12 Economics 12APMU12 AP Music Theory 12 No similar courseAPPHH12 AP Physics 2 12 PH12 Physics 12APPHM12 AP Physics C: Mechanics 12 PH12 Physics 12APPHY12 AP Physics B 12 PH12 Physics 12APPSY12 AP Psychology 12 No similar courseAPSAD12 AP Studio Art: Drawing 12 No similar courseAPSAG12 AP Studio Art: General 12 No similar courseAPSLA12 AP Spanish Language 12 SP12 Spanish 12APSTA12 AP Statistics 12 No similar courseAPUSH12 AP US History 12 No similar courseAPWH12 AP World History 12 HI12 History 12
TABLE 2: Course pairs used for grade comparisons between AP and BC courses

BCCAT 27Understanding Advanced Placement Grading in BC
Student post-secondary performance
In aggregate, is there a difference in performance (as measured by first-year GPA) between AP students and non-AP students?
The first research question is whether AP students have a difference in performance from non-AP students as mea-sured by first-year GPA. At KPU, a special-purpose teaching institution serving relatively small numbers of AP students, the answer is certainly yes, even when English 12 grade is controlled for. However, the usefulness of models with the KPU information is relatively low (in the OLS model without any general AP indicators, R2=0.108) compared to simi-lar models from UBC (R2=0.275) and UVic (R2=0.433). It is unclear whether the small predictive improvement from including general AP indicators (i.e., did a student take an AP course, or did they take a specific AP course) would still appear if KPU had an admission average that was constructed similarly to UBC and UVic (that is, an aggregate over several courses).
A linear regression controlling for several potential factors – admission average, faculty of study, gender, and national status – at UBC saw a slight improvement (from R2=0.275 to R2=0.278) with the inclusion of general AP indicators. Those indicators were statistically significant, although none of the best models selected by Bayesian model averaging analysis included the general AP indicators. Several individual AP courses – in particular, AP Calculus AB 12, AP Chem-istry 12, and AP Chinese Language & Culture 12 – did appear to have predictive ability. At UVic, general AP indicators showed no statistical significance and were almost completed ignored by the Bayesian model averaging, while indi-vidual AP course indicators were only selected by a minority of the models. Worth noting is that the specific course AP indicators did not universally suggest that AP students perform better than non-AP students. In particular, at UBC the AP Chinese Language & Culture 12 indicator suggested students in that course would have lower sessional averages than otherwise similar students.
When we moved from a model that included admission average to a model that looked instead at grades in indi-vidual grade 12 courses, we similarly saw improvement in predictive ability between models that did not include an AP indicator and those that did. In this case our dataset looked at grade 12 courses for which there is both an AP and a BC analogue (based on Table 2). For these courses we constructed a regression that controlled for faculty of study, gender, and international status and included the link between grade 12 courses grade along with an indicator of whether the student took the AP analogue (0=no, 1=yes) and first-year GPA. Included were the BC grades for students that took only the BC analogue, and the AP grades for students that took the AP analogue; and excluded were grades in the BC analogue courses for students who took the AP analogue. In UBC’s case, we excluded students in AP courses with final course grades of 96%, 86%, 80%, and 70%, as with UBC’s data it was not possible to determine which of these grades were provided as a course grade and which were converted from an AP exam score based on UBC’s current equivalency table. The AP indicator was statistically significant at all three institutions with improvements in R2, though the improvement was marginal and greater at UBC (from R2=0.171 without the AP indicator to R2=0.178 with the indicator) than at either KPU (from R2=0.125 to R2=0.126) or UVic (R2=0.264 to R2=0.265).
We also ran this model focusing individually on each grade 12 course. At KPU the AP indicator was only statistically significant on the English 12 model, while at UVic it was only significant on the Chemistry 12 model. At UBC, the AP indicator was significant on the models for Biology 12, Calculus 12, Chemistry 12, Economics 12, English 12, and Phys-ics 12. All showed improvements in R2 of between 0.003 and 0.019. For non-English language courses, we did not find statistical significance for the AP indicator. In some cases, this was simply due to the sample size (e.g., there were not

28 BCCAT Understanding Advanced Placement Grading in BC
enough students who took AP German 12, or AP Japanese Language & Culture 12 in our sample frame for any useful modelling), but in others the inclusion of the indicator did not add to the model.
The case study provides mixed results to the first research question. At UBC, the evidence suggests there is cer-tainly a performance differential between students who take AP courses at high school and those who do not, but this evidence is much weaker at KPU and UVic. What is not clear from this data is why the difference exists between institutions and even between AP courses. This could be due to differences in the AP offerings at the feeder secondary schools for particular institutions, or differences at the post-secondary institution.
In aggregate, is there an appropriate equivalency between the AP scales presented and post-secondary performance? By way of example, if there are two students, one who took only non-AP courses and achieved a 90% admission average, and the other took four AP courses also with a 90% admission average, could the latter student be expected to perform better than the former student?
Our second research question asked if an equivalency could be found between AP grades and BC grades in order to predict post-secondary performance. This information was requested from the institutions as part of the case study.
With regards to AP exams scores, KPU provided information on transfer credits received based on AP exam scores for the students included in this study. While the data provided included enough information to differentiate the actual AP exam scores, there were two remaining problems - KPU grants transfer credit only for students who receive a 4 or a 5 on the AP exam, and there were only 66 students who received these transfer credits. UVic provided information on transfer credits, but we could not distinguish the actual exam scores, so students could have had either a 4 or a 5. None of the institutions had the student’s actual exam scores available. Without more data points with the ability to distinguish actual exam scores, we have been unable to tackle this question, and have to leave this as an open ques-tion requiring further research.
For AP grades, in our Grade 12 course to aggregate post-secondary performance model we also looked at the ratio between the regression coefficient for the AP indicator and the coefficient for the Grade 12 course grade. This gives us an estimate of the equivalency between a BC analogue grade and a AP analogue grade; for example, a ratio of 8.0 suggests that a student with an AP grade of 80% will perform, on average, equivalently to a student with a BC grade in the analogue course of 88%. The ratios found varied by institution and Grade 12 course. At KPU, the general model had a ratio of 7.8 while the English 12 model had a ratio of 13.0. At UBC, the general model had a ratio of 7.1 with individual course models between 5.6 and 8.6 with the English 12 model an outlier at 3.5. At UVic, the general model had a ratio of 3.1 while the Chemistry 12 model had a ratio of 7.3.
The ratios suggest that when a secondary school transcripts both an AP and an analogue BC course, the BC grade does not accurately reflect the likely post-secondary performance. At UBC and UVic, the BC grade was transcripted on average 3.3% higher with a median of 2.0% (KPU had an average of 0.8% and median of 0.0%), whereas the ratios are suggesting this should be closer to the 5.0 to 7.0% range. Additionally, this equivalency may not be the same for each combination of analogous courses. Some analogues had higher ratios, while in others (e.g., language courses outside English) the differences were not statistically significant. The ratios noted above are from an aggregate perspective,
BCCAT 29Understanding Advanced Placement Grading in BC
suggesting that a BC course will be 5-7% higher than an AP course. However, further research would be necessary to determine whether the ratio would be different at different points along the percentage grading scale, for example, whether an AP grade of 80 equals a BC grade of 85, and whether an AP grade of 90 equals a BC grade of 95.
At the course subject level, is there a difference in performance (as measured by subject area GPA in the first two years of study) between AP students and non-AP students?
Our third research question asks a similar question to the first, but at the course subject level rather than at an ag-gregate level. Here, the evidence is stronger, as certain subject codes at each institution saw statistically significant dif-ferences in performance when the general AP indicators were factored into account. While the specific list of courses varied by institution, biology appeared at all three institutions. KPU and UBC had a number of overlapping subject codes, in particular those related to mathematics, biology, chemistry, and physics. Other subject areas that showed some significance include business and economics at KPU, and applied sciences at UBC. UVic’s subject codes with significant differences showed little overlap with the other institutions. The subject codes in arts disciplines (anthropol-ogy and history) and environmental science appeared instead. The only overlap aside from biology was with KPU, with business/commerce subjects showing significance at both institutions.
Of the individual AP course indicators that showed significance, KPU included both AP English Language & Composi-tion 12, and AP English Literature & Composition 12, along with AP Psychology 12 in some subject areas. However, all three institutions showed significance in some subject areas for AP Calculus AB 12.
Grade 12 course grade to post-secondary performance model was also run on a subject level. There was a different pattern in the subject areas that showed statistical significance, with mathematics being the one subject area common to all three institutions. UVic’s subject areas in this model were more focused in the sciences, with biology, chemistry, and physics all appearing. UBC’s subject areas that showed AP indicator statistical significance expanded to include some other science disciplines, such as earth and oceans science and general science, while also including subject areas such as commerce, English, French, and kinesiology.
At the individual course level, is there a difference in performance (as measured by course grades in the first two years of study) between AP students and non-AP students?
The final research question was again similar, but at the more specific course level, rather than by subject or in ag-gregate. Some specific courses at all three participating institutions showed statistically significant differences in performance between AP and non-AP students, with many of the courses within the subject areas identified above and some new courses appearing. As with the subject level performance, AP Calculus AB 12 showed significance at all three institutions for specific courses. Unlike with the subject level, none of the other individual courses showed significance at any of the institutions.
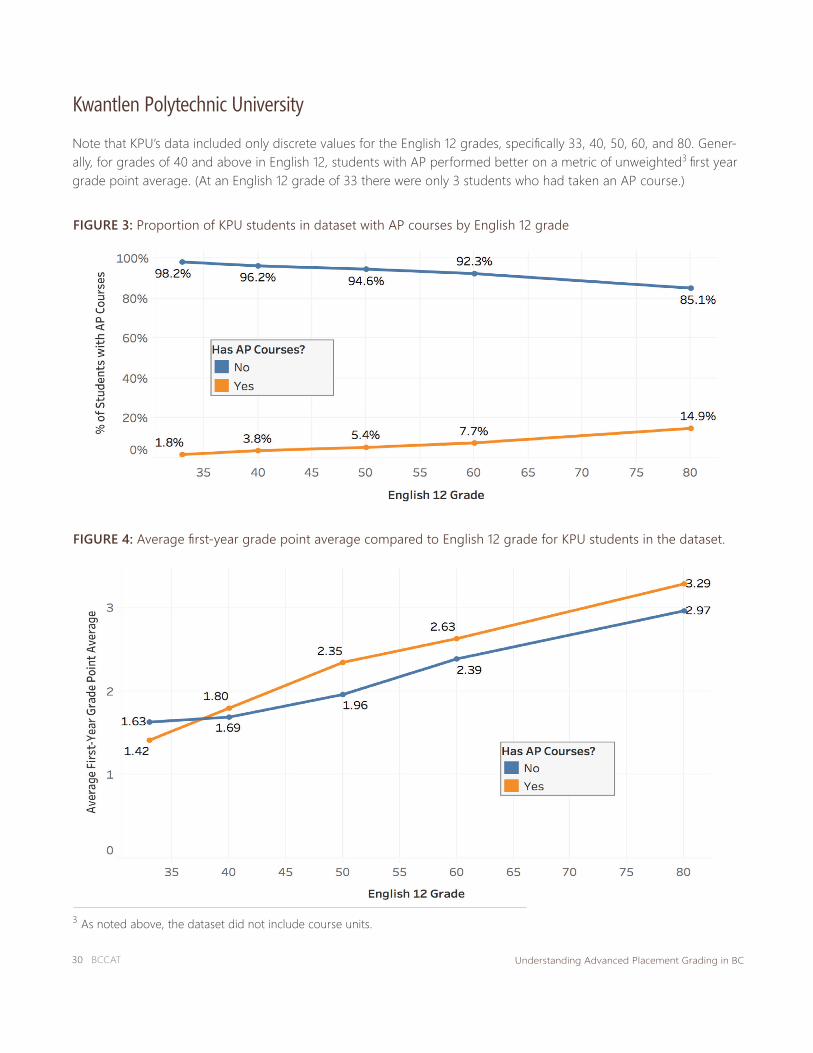
30 BCCAT Understanding Advanced Placement Grading in BC
FIGURE 3: Proportion of KPU students in dataset with AP courses by English 12 grade
FIGURE 4: Average first-year grade point average compared to English 12 grade for KPU students in the dataset.
3 As noted above, the dataset did not include course units.
Kwantlen Polytechnic University
Note that KPU’s data included only discrete values for the English 12 grades, specifically 33, 40, 50, 60, and 80. Gener-ally, for grades of 40 and above in English 12, students with AP performed better on a metric of unweighted3 first year grade point average. (At an English 12 grade of 33 there were only 3 students who had taken an AP course.)

BCCAT 31Understanding Advanced Placement Grading in BC
FIGURE 5: Number and percentage of KPU students with AP courses and BC course analogue on their high school transcript by grade difference between AP and BC course
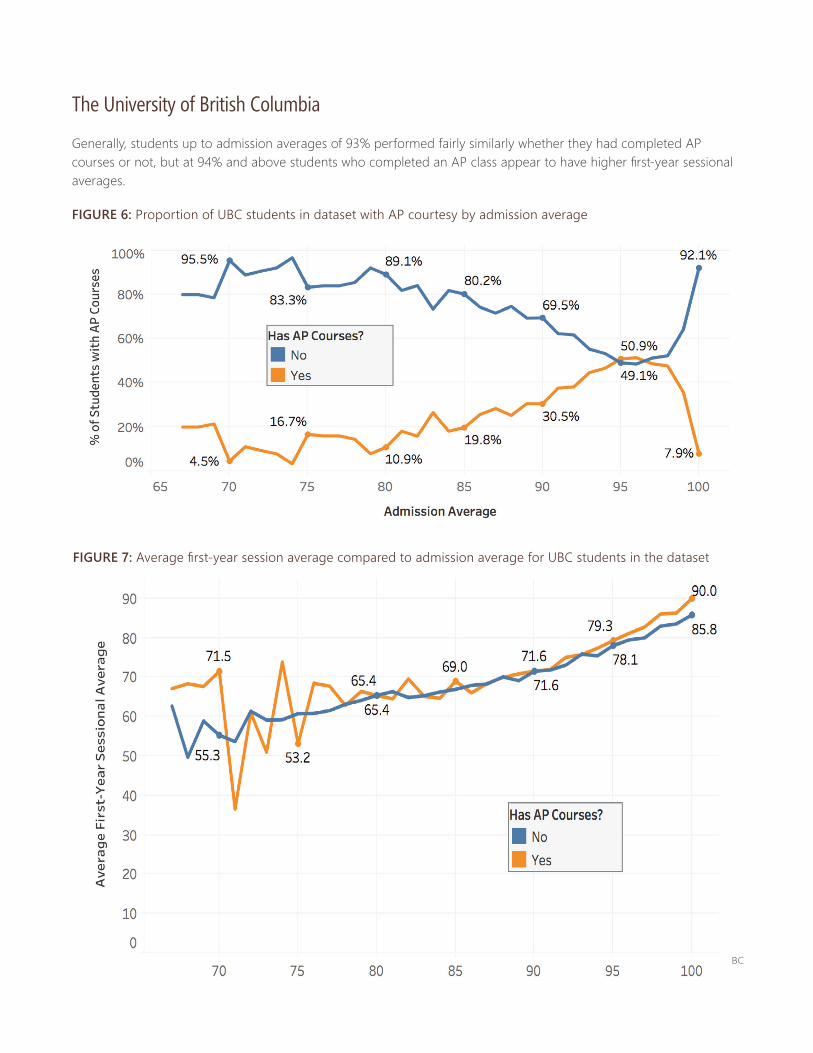
32 BCCAT Understanding Advanced Placement Grading in BC
FIGURE 7: Average first-year session average compared to admission average for UBC students in the dataset
FIGURE 6: Proportion of UBC students in dataset with AP courtesy by admission average
The University of British Columbia
Generally, students up to admission averages of 93% performed fairly similarly whether they had completed AP courses or not, but at 94% and above students who completed an AP class appear to have higher first-year sessional averages.

BCCAT 33Understanding Advanced Placement Grading in BC
FIGURE 8: Number and percentage of UBC students with AP courses and BC course analogue on their high school transcript by grade difference between AP and BC course

34 BCCAT Understanding Advanced Placement Grading in BC
FIGURE 9: Proportion of UVic students in dataset with AP courses by admission average
FIGURE 10: Average first-year session average compared to admission average for UVic students in the dataset.
The University of Victoria

BCCAT 35Understanding Advanced Placement Grading in BC
FIGURE 11: Number and percentage of UVic students with AP courses and BC course analogue on their high school transcript by grade difference between AP and BC course

36 BCCAT Understanding Advanced Placement Grading in BC
ConclusionThis case study, as well as the literature review related to Advanced Placement (AP), suggests that in certain con-texts there are advantages to students participating in AP while in secondary school. This advantage is not universal, however: effects appear for some institutions and in some subject areas. The case study supports this finding with the analysis of first-year averages compared to admission averages, and the analysis of which AP courses were significant predictors of first-year average. Our analysis took two separate lenses, with the first focusing on general AP indicators (did a student take an AP course, or did they take a specific AP course) along with an existing institutional admission average with the second focusing on specific course grades and an indicator of whether a student took an AP ana-logue of that specific BC course.
In the general AP indicator analysis, Kwantlen Polytechnic University (KPU) and the University of British Columbia (UBC) had small predictive capabilities. The analysis indicated that students with AP courses would likely perform better in aggregate. At UBC certain AP courses were good indicators. At the University of Victoria (UVic), there were no general AP indicators that had predictive capabilities for aggregate performance. For specific subject areas and courses, both general indicators and an indicator for whether a student completed AP Calculus AB 12 provided some predictive ability in some subject areas and courses. At KPU, one subject area additionally showed that AP English Language & Composition 12 had a small predictive ability.
In the specific course analysis at all three institutions obtained better predictive models by factoring in whether a student took an AP analogue of the BC course. For many of these courses, particularly those that are not language-focused outside English, students with AP grades performed similarly to students with BC analogue grades higher than the AP grade suggested. Their performance similarly outstripped what would be expected from looking at the transcripted grade of the BC analogue of the course when both appeared on the student’s transcript.
With these two different lenses, what is missing is the piece in the middle – connecting specific AP courses to the institutionally-calculated admission average. The admissions data provided for this project did not indicate which courses were included in the admission average. Based on this research project, students with a lower admission aver-age who had AP courses would perform as well as a student without AP courses at a higher admission average. With the information available to us for this project, we are unable to adjust the admission average to factor in AP grade equivalencies to test whether this improves the predictive ability of the admission average.
The environmental scan highlighted that different secondary schools have different practices in how they award credit for both AP courses and their BC provincial analogues, with some schools automatically granting credit for the BC course, others requiring an additional coursework component, and others not granting credit for the analogue BC course. The case study highlights that for some course pairs (particularly English and science courses, such as biol-ogy, chemistry, and physics), more than 80% of students received credit for both the AP course and its BC provincial analogue, with more than 60% receiving a better grade for the BC course. There were, however, exceptions: students who pursued the AP Calculus courses received credit for Calculus 12 only about 20-25% of the time, and AP Macro-economics 12 and AP Microeconomics 12 students only received credit for Economics 12 around 35% of the time.
BCCAT 37Understanding Advanced Placement Grading in BC
Additionally, the case study reinforces that, when students have both an AP and a non-AP version of a course on their transcript, we cannot assume that students will receive a higher grade in the non-AP version. Roughly 12% of students have a higher grade in the AP version of a course pair, while 22% at UBC and UVic and 68% at KPU have the same grade in both the AP and non-AP versions. The result for KPU may be reflective both of the smaller overall number of AP students at the institution (compared to UBC and UVic), and of the consequent smaller number of secondary schools offering AP that KPU’s applicant pool is comprised of.
This project has also suggested some future research opportunities. With the data available in our case study, we could not determine a suitable equivalency scale between AP exam scores and course grades. Additionally, we could not determine whether the substantial differences in patterns between the post-secondary institutions (e.g., which AP courses students choose to take, the grades they receive in those AP courses relative to the grades received in similar BC provincial versions of the course, and which post-secondary subject areas are most impacted by students taking AP courses) are a result of the course offerings available to students in secondary school, course selection by students based on post-secondary study paths, or post-secondary program and course design. Additionally, post-secondary institutions suggested during the environmental scan they would like to assess how AP and non-AP students compare in courses which follow from post-secondary courses for which students are given transfer credit on the basis of AP coursework (see Appendix 3 for more details on this).
The challenge for institutional admission officers is how to appropriately utilize signals from Advanced Placement courses in evaluations. Unlike the International Baccalaureate program, AP students seldom have an entire program of credits, on average having one to two AP courses along with non-AP courses. What is clear from this research is that the utility of those signals depends highly on the context, and that institutions need to look into their own data to determine what works best for their context. There is no one approach that will work in all, or even most, cases. As the results of our analysis vary by both institution and individual course, we highly recommend that institutions conduct an analysis to determine the appropriate equivalencies between grades in AP and BC analogues of a course for their context, and for individual AP courses
This case study, as well as the literature review related to Advanced Placement (AP), suggests that in certain contexts there are advantages to students partici-pating in AP while in secondary school. This advantage is not universal, however:
effects appear for some institutions and in some subject areas.
38 BCCAT Understanding Advanced Placement Grading in BC
ReferencesAdelman, C. (1999). Answers in the tool box: Academic intensity, attendance patterns, and bachelor's degree attainment.
Jessup, MD: US Department of Education. Retrieved from ERIC (ED431363).
Barbour, M., & Mulcahy, D. (2006). An inquiry into retention and achievement differences in campus based and web based AP courses. The Rural Educator. 27(3), 8-12.
BC Stats. (1996). School districts [Data file]. Retrieved from https://www2.gov.bc.ca/gov/content/data/geographic-data-services/land-use/administrative-boundaries
BC Stats. (2011). Translation of place names to BC administrative regions [Data file]. Retrieved from https://www2.gov.bc.ca/gov/content/data/geographic-data-services/land-use/administrative-boundaries
Byrd, S., Ellington, L., Gross, P., Jago, C., & Stern, S. (2007). Advanced Placement and International Baccalaureate: Do they deserve gold star status? Washington, DC: Thomas B Fordham Institute. Retrieved from ERIC (ED499005).
Clark, C., Scafidi, B., & Swinton, J. R. (2012). Does AP Economics improve student achievement? The American Economist, 57(1), 1-20. doi:10.1177/056943451205700101
College Board. (2016). Exam volume by region. Retrieved from https://research.collegeboard.org/programs/ap/data/archived/ap-2016
College Board. (n.d.a). How AP Capstone works. Retrieved from https://apcentral.collegeboard.org/courses/ap-cap-stone/how-ap-capstone-works
College Board. (n.d.b). International secondary schools with AP. Retrieved from https://international.collegeboard.org/programs/search-international-ap-schools
Conley, D. (2000). Who is proficient: The relationship between proficiency scores and grades. Paper presented at the meeting of the American Education Research Association, New Orleans, LA. Retrieved from ERIC (ED445025).
Curry, W., MacDonald, W., & Morgan, R. (1999). The Advanced Placement program: Access to excellence. Journal of Secondary Gifted Education, 11(1), 17–23. doi:10.4219/jsge-1999-612
Drew, C. (2011, January 7). Rethinking Advanced Placement. The New York Times. Retrieved from http://www.nytimes.com/2011/01/09/education/edlife/09ap-t.html
Duffett, A., & Farkas, S. (2009). Growing pains in the Advanced Placement program: Do tough trade-offs lie ahead? Washington, DC: Thomas B. Fordham Institute. Retrieved from ERIC (ED505527).
Dutkowsky, D. H., Evensky, J. M., & Edmonds, G. S. (2009). Should a high school adopt Advanced Placement or a concurrent enrolment program? An expected benefit approach. Education, 4(3), 263–277. doi:10.1162/edfp.2009.4.3.263

BCCAT 39Understanding Advanced Placement Grading in BC
Foust, R. C., Hertberg-Davis, H., & Callahan, C. M. (2008). “Having it all” at sleep's expense: The forced choice of par-ticipants in Advanced Placement courses and International Baccalaureate programs. Roeper Review, 30(2), 121-129. doi:10.1080/02783190801955293
Geiser, S., & Santelices, V. (2006). The role of advanced placement and honors courses in college admissions. In P. Gándara, G. Orfield, & C. Horn (Eds.), Expanding opportunity in higher education: Leveraging promise, 75-114. Albany, NY: State University of New York Press.
Godfrey, K. E. (2011). Investigating grade inflation and non-equivalence (College Board Report No. 2011-5). New York, NY: College Board. Retrieved from ERIC (ED521179).
Government of British Columbia. (2017). Handbook of procedures for the Graduation Program 2017/2018. Retrieved from https://www2.gov.bc.ca/gov/content/education-training/administration/kindergarten-to-grade-12/graduation
Government of British Columbia. (2015, August). Introduction to British Columbia's redesigned curriculum. Retrieved from https://curriculum.gov.bc.ca/curriculum-info
Hallett, R. E., & Venegas, K. M. (2011). Is increased access enough? Advanced placement courses, qual-ity, and success in low-income urban schools. Journal for the Education of the Gifted, 34(3), 468-487. doi:10.1177/016235321103400305
Hargrove, L., Godin, D., & Dodd, B. G. (2008). College outcomes comparisons by AP and non-AP high school experi-ences (College Board Report No. 2008-3). New York, NY: College Board. Retrieved from ERIC (ED561030).
Herr, N. E. (1992). A comparative analysis of the perceived influence of advanced placement and honors programs upon science instruction. Journal of Research in Science Teaching, 29(5), 521–532. doi:10.1002/tea.3660290507
Hertberg-Davis, H., Callahan, C. M., & Kyburg, R. M. (2006). Advanced Placement and International Baccalaureate programs: A “fit” for gifted learners? (Research Monograph RM06222). Storrs, CT: National Research Center on the Gifted and Talented, University of Connecticut. Retrieved from ERIC (ED505379).
Hertberg-Davis, H., & Callahan, C. M. (2008). A narrow escape: Gifted students' perceptions of Advanced Placement and International Baccalaureate programs. Gifted Child Quarterly, 52(3), 199–216. doi:10.1177/0016986208319705
Hoffman, N. (2003, July-August). College credit in high school: Increasing college attainment rates for underrepresent-ed students. Change: the Magazine of Higher Learning, 35(4), 42-48. doi:10.1080/00091380309604110
International Baccalaureate. (n.d.). About the IB. Retrieved from https://www.ibo.org/about-the-ib/
Keng, L., & Dodd, B. G. (2008). A comparison of college performances of AP and non-AP student groups in 10 subject areas (College Board Report Np. 2008-7). New York, NY: College Board. Retrieved from ERIC (ED561028).
Klopfenstein, K. (2003). Recommendations for maintaining the quality of advanced placement programs. American Secondary Education, 32(1), 39-48.

40 BCCAT Understanding Advanced Placement Grading in BC
Klopfenstein, K. (2004). The Advanced Placement expansion of the 1990s: How did traditionally underserved students fare? Education Policy Analysis Archives, 12(68), 1-15. doi:10.14507/epaa.v12n68.2004
Klopfenstein, K., & Lively, K. (2012). Dual enrolment in the broader context of college-level high school programs. New Directions for Higher Education, 2012(158), 59–68. doi:10.1002/he.20015
Mattern, K. D., Shaw, E. J., & Xiong, X. (2009). The relationship between AP exam performance and college outcomes (College Board Report No. 2009-4). New York, NY: College Board. Retrieved from ERIC (ED561021).
McKinney, W. (2010). Data structures for statistical computing in Python. In S. van der Walt, & J. Millman (Eds.), Proceedings of the 9th Python in Science Conference (pp. 51-56). Retrieved from https://conference.scipy.org/pro-ceedings/scipy2010/
Morgan, R., & Klaric, J. (2007). AP students in college: An analysis of five-year academic careers (College Board Report No. 2007-4). New York, NY: College Board. Retrieved from ERIC (ED561034).
Morgan, R., & Ramist, L. (1998). Advanced Placement students in college: An investigation of course grades at 21 colleges (Educational Testing Services Report No. SR-98-13). Princeton, NJ: Educational Testing Service.
Parker, W., Mosborg, S., Bransford, J., Vye, N., Wilkerson, J., & Abbott, R. (2011). Rethinking advanced high school coursework: tackling the depth/breadth tension in the AP US Government and Politics course. Journal of Curricu-lum Studies, 43(4), 533–559. doi:10.1080/00220272.2011.584561
Patterson, B. F., Packman, S., & Kobrin, J. L. (2011). Advanced Placement exam-taking and performance: relationships with first-year subject area college grades (College Board Report No. 2011-4). New York, NY: College Board. Re-trieved from ERIC (ED561033).
Raftery, A.E., Madigan, D., & Hoeting, J.A. (1997). Bayesian model averaging for linear regression models. Journal of the American Statistical Association, 92(437), 179-191. doi:10.1080/01621459.1997.10473615
Sadler, P. M. (2010). Advanced placement in a changing educational landscape. In P. Sadler, G. Sonnert, R.H. Tai, & K. Klopfenstein (Eds.), AP: A Critical Examination of the Advanced Placement Program (pp. 3-16). Cambridge, MA: Harvard Education Press.
Sadler, P. M., & Tai, R. H. (2007). Weighting for recognition: Accounting for Advanced Placement and honors courses when calculating high school grade point Average. NASSP Bulletin, 91(1), 5–32. doi:10.1177/0192636506298726
Santoli, S. P. (2002). Is there an Advanced Placement advantage? American Secondary Education, 30(3), 23-35. doi:10.2307/41064460
Scott, T. P., Tolson, H., & Lee, Y. H. (2010). Assessment of Advanced Placement participation and university academic success in the first semester: Controlling for selected high school academic abilities. Journal of College Admission, 208, 26-30. Retrieved from ERIC (EJ893892).

BCCAT 41Understanding Advanced Placement Grading in BC
Seabold, S., & Perktold, P. (2010). Statsmodels: Econometric and statistical modeling with Python. In S. van der Walt & J. Millman (Eds.), Proceedings of the 9th Python in Science Conference (pp. 57-61). Retrieved from https://conference.scipy.org/proceedings/scipy2010/
Shaw, E. J., Marini, J. P., & Mattern, K. D. (2013). Exploring the utility of Advanced Placement participation and performance in college admission decisions. Educational and Psychological Measurement, 73(2), 229–253. doi:10.1177/0013164412454291
Sternberg, R. J. (2010). College admissions for the 21st century. Cambridge, MA: Harvard University Press.
Sternberg, R. J. (2012). College admissions: Beyond conventional testing. Change: the Magazine of Higher Learning, 44(5), 6–13. doi:10.1080/00091383.2012.706534
Vaughn, E. S, (2010). Reform in an urban school district: The role of PSAT results in promoting Advanced Placement course-taking. Education and Urban Society, 42(4), 394–406. doi:10.1177/0013124510361843
Wakelyn, D. (2009). Raising rigor, getting results: Lessons learned from AP expansion (Research Report). Washington, DC: National Governors’ Association Center for Best Practices. Retrieved from ERIC (ED507635).
Warne, R. T., Larsen, R., Anderson, B., & Odasso, A. J. (2015). The impact of participation in the Advanced Placement program on students' college admissions test scores. The Journal of Educational Research, 108(5), 400–416. doi:10.1080/00220671.2014.917253
Wehde-Roddiger, C., Trevino, R., Anderson, P., Arrambide, T., O'Conor, J., & Onwuegbuzie, A. J. (2012). The influence of Advanced Placement enrolment on high school GPA and class rank: Implications for school administrators. International Journal of Educational Leadership Preparation, 7(3), 1-12. Retrieved from ERIC (EJ997448).
Willingham, W., & Morris, M. (1986). Four years later: A longitudinal study of Advanced Placement students in college (College Board Report No. 86-2). New York, NY: College Board.

42 BCCAT Understanding Advanced Placement Grading in BC
Appendix 1: Data Request to InstitutionsSent via email May 17, 2017.
Dear <name>
Following up on our conversation regarding Advanced Placement grading in BC on behalf of the BC Council on Admissions and Transfer, we’re now preparing to begin the case study. Most of our interviews with the secondary schools have now wrapped up, with a few more scheduled before the end of the school year.
When we last spoke, you expressed interest in participating in the case study. What we propose is to work with you (and/or with others on campus as appropriate) to acquire anonymous data to study how students who have partici-pated in AP perform in comparison to students who have not participated in AP in terms of overall first year perfor-mance, performance in particular subject areas, and performance in specific courses.
In addition to helping answer key questions in provincial level research, this case study would provide another angle of insight into the performance of your students who have participated in AP, and provide data and analysis that could inform policy conversations at your institution in the future.
We’re of course more than happy to sign any privacy and nondisclosure agreements necessary for success, and to reiterate we would need only anonymized data rather than identifiable data. Plaid is FIPPA compliant, and all data would be encrypted and stored within Canada.
Attached to this email is a more detailed overview of the data request, including key questions and example datasets.
Thank you for your consideration - we look forward to hearing from you. If you'd like to discuss by phone, or in person, we'd be happy to set up a time.
Case study key questions1. In aggregate, is there a difference in performance (as measured by first-year GPA) between AP students and
non-AP students?
2. In aggregate, is there an appropriate equivalency between the AP scales presented and post-secondary per-formance? By way of example, if there are two students, one who took only non-AP courses and achieved a 90% admission average, and the other took 4 AP courses also with a 90% admission average, could the latter student be expected to perform better than the former student?
3. At the course subject level, is there a difference in performance (as measured by subject area GPA in the first two years of study) between AP students and non-AP students?
4. At the individual course level, is there a difference in performance (as measured by course grades between in the first two years of study AP students and non-AP students?

BCCAT 43Understanding Advanced Placement Grading in BC
Datasets necessary to answer these questionsThis is a preliminary draft of the types of data that would be necessary to answer the case study questions above. We acknowledge that different institutions will store their data in different ways, so further refinement is expected in con-sultation with institutions as the project moves forward. In general, we’d need anonymized student information focused on aggregate performance in first and second year; admissions related information such as admission aver-age, high school courses at the grade 12 level, transfer credits (related to AP courses); and course specific perfor-mance data for the first two years of study.
This information would be needed for students who were admitted via BC Grade 12 for those who participated in AP and for those who did not. We expect datasets 4 and 5 below would ultimately identify who participated in AP and in what capacity. Note that some students in datasets 1-3 would not have participated in AP and may not have records in datasets 4 and/or 5.
In the example data below, the students have the following characteristics:
• Student 00001 participated in AP (AP courses in dataset 4) and received transfer credit (AP exam score in dataset 5) based on performance on the AP exam.
• Student 00002 participated in AP (AP courses in dataset 4) but did not receive transfer credit (AP exam score in dataset 5) due to an exam score of 3.
• Student 00003 did not participate in AP (no AP courses in dataset 4).
Dataset 1: Student Aggregate Performance by Term/Semester/Year
This dataset is intended to show aggregate student performance in post-secondary by Term/Semester/Session
Sample Data
Anonymous ID Year Term/Semester/Session Grade Point Average00001 2013 A 3.6700002 2013 A 3.8600003 2013 A 3.5000001 2013 B 3.7500002 2013 B 3.9100003 2013 B 3.61
Dataset 2: Student Course Performance by Term/Semester/Year
This dataset is intended to show student course performance in post-secondary. A list of all courses attempted and grading information at your institution.
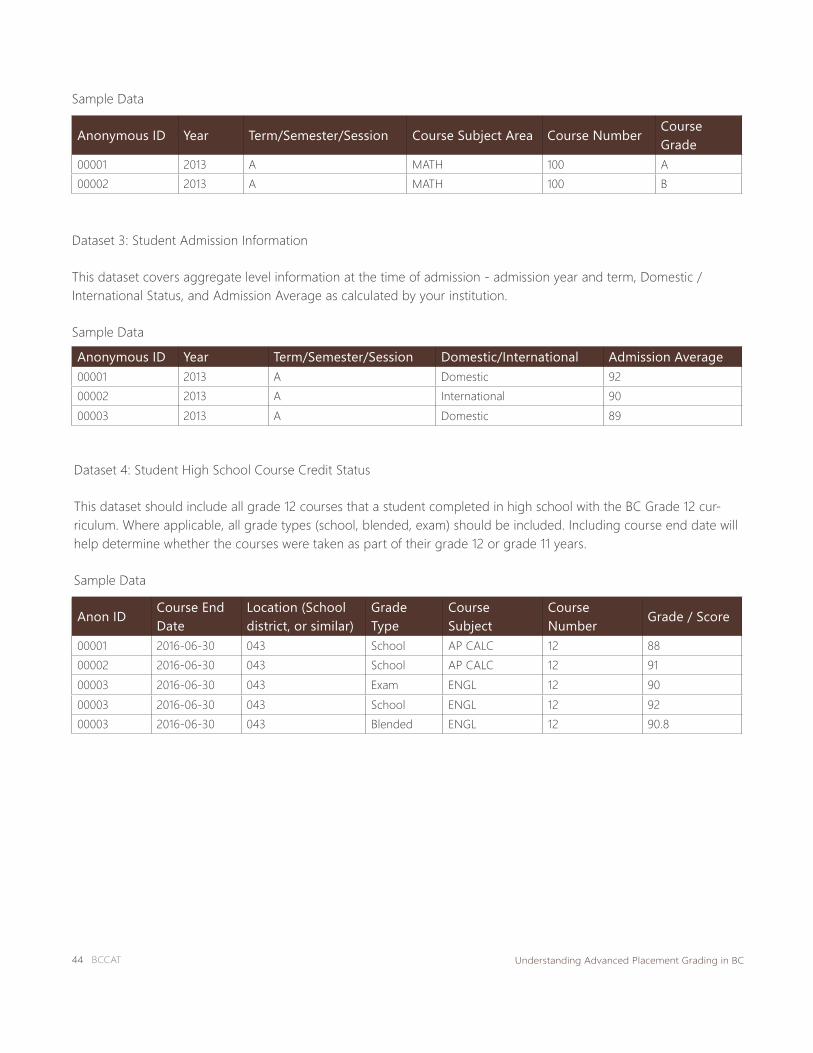
44 BCCAT Understanding Advanced Placement Grading in BC
Anonymous ID Year Term/Semester/Session Course Subject Area Course Number Course Grade
00001 2013 A MATH 100 A00002 2013 A MATH 100 B
Anonymous ID Year Term/Semester/Session Domestic/International Admission Average00001 2013 A Domestic 9200002 2013 A International 9000003 2013 A Domestic 89
Anon ID Course End Date
Location (School district, or similar)
Grade Type
Course Subject
Course Number Grade / Score
00001 2016-06-30 043 School AP CALC 12 8800002 2016-06-30 043 School AP CALC 12 9100003 2016-06-30 043 Exam ENGL 12 9000003 2016-06-30 043 School ENGL 12 9200003 2016-06-30 043 Blended ENGL 12 90.8
Sample Data
Dataset 3: Student Admission Information
This dataset covers aggregate level information at the time of admission - admission year and term, Domestic / International Status, and Admission Average as calculated by your institution.
Sample Data
Dataset 4: Student High School Course Credit Status
This dataset should include all grade 12 courses that a student completed in high school with the BC Grade 12 cur-riculum. Where applicable, all grade types (school, blended, exam) should be included. Including course end date will help determine whether the courses were taken as part of their grade 12 or grade 11 years.
Sample Data

BCCAT 45Understanding Advanced Placement Grading in BC
Dataset 5: Student AP-related Transfer Credit Status
This dataset is intended to capture performance on AP Exams for those students who submitted AP Exam scores to your institution.
Sample Data
Anon ID Exam Date
Location (School district, or similar)
AP Status
Course Subject
Course Number
Grade / Score
Transfer Credits Requested
Transfer Credits Received
00001 2016-05-30 043 AP Exam CALC AB 5 3 300002 2015-05-30 043 AP Exam CALC AB 3 3 0
46 BCCAT Understanding Advanced Placement Grading in BC
Appendix 2: Telephone Survey Instruments
Post-secondary institutionsHi, my name is <name> from Plaid Consulting and I’m calling on behalf of the BC Council on Admissions and Transfer. I’m conducting a research project focused on grading practices in Advanced Placement courses in BC. This environmental scan will look into how AP courses are graded in schools and school districts, and how universities and colleges evaluate AP grades that they receive.
We’d like to ask you a few questions about your experience advanced placement courses at <PSI>. If there are particular elements of your response you’d like anonymized or left out of the report, please let us know as the conversation contin-ues.
I’ve already reviewed the AP requirements as listed on your website. I’m hoping to gain some additional understanding beyond the core requirements.
1. Has your <PSI> studied whether students with AP credit perform differently than other direct-entry students? If so, are you willing to describe or share the results?
a. If you did study this, did you differentiate between those students who were awarded transfer credits via AP versus those students who completed AP courses and/or exams but did not receive transfer credit?
2. Have you experienced any challenges in determining whether a grade in the same AP course but from a different school is equivalent? (i.e.: do you feel that a 90% at one school is different from a 90% at another school?)
3. Does your institution adjust AP grades in order to calculate an admission average (for example, calling an 90% in AP Physics 12 a 95%)?
4. If a student presents only an AP exam grade (no course grade) how would this be evaluated for admission?
5. If a student presents both an AP course grade and an AP exam grade, do you emphasize one over the other for the purposes of:
a. Admission? b. Transfer credit?
6. When was the last time you revisited your admission requirements related to AP credit? When you last revisited your requirements, what were the revisions based on?
7. Is there any other information that you feel would be useful in helping us understand how AP grades are evalu-ated at your institution?
Secondary schoolsHi, my name is <name> from Plaid Consulting and I’m calling on behalf of the BC Council on Admissions and Transfer. I’m conducting a research project focused on grading practices in Advanced Placement courses in BC. This environmental

BCCAT 47Understanding Advanced Placement Grading in BC
scan will look into how AP courses are graded in schools and school districts, and how universities and colleges evaluate AP grades that they receive.
We’d like to ask you a few questions about your experience with grading in advanced placement courses at <school>. If there are particular elements of your response you’d like anonymized or left out of the report, please let us know as the conversation continues.
1. Are there key differences in how AP courses are graded at your school versus non-AP courses in the same sub-ject area and grade level?
2. In the case where a student is enrolled only in an AP course (example, AP Physics 12), do you enter a grade for just AP Physics 12, or also enter one for Physics 12?
3. In the case where a student is enrolled in both an AP course (example, AP Physics 12), and a non-AP equivalent (example, Physics 12), does a different grade get entered for each course or would the grade entered be the same?
4. Some schools note that the curricula used in AP classes is more advanced than non-AP curricula. When a student in an AP is given a grade, does this grade reflect their mastery of the AP curriculum or their mastery of the non-AP curriculum? For example, if a student gets 85% in AP Physics 12 does this reflect 85% in AP Physics 12 or 85% in the “regular” Physics 12?
5. If a student does not take an AP course but sits the AP exam, would you put this on their transcript? How would this appear? (Specific examples should be used based on their answers to 2-4 above; i.e. if they say “AP only” then we ask whether “AP Physics 12” would be on the transcript, but if they say “both AP and non-AP” then we ask whether “AP Physics 12” and “Physics 12.”)
6. Is any form of curve or weighting used to determine ultimate grading in an AP course at your school, or are grades directly tied to performance? Is there any difference between AP and non-AP courses in this respect?
7. Do you find there are differences in how AP courses are graded in different subject areas within your school (would similar grading practice be used for AP Human Geography 12 versus AP Chemistry 12 versus AP Macro-economics 12)?
8. Does your school require that students take the AP exam if they register in an AP course?
9. Does your school offer Pre-AP in grades 10 or 11?
10. Do you feel that there is a difference in how AP courses are graded at your school versus other schools in the same school district? Elsewhere in the province?
11. Is there any other information that you feel would be useful in helping us understand how AP courses are graded at your school?
12. PUBLIC SCHOOLS ONLY - Is there anyone who works at the school district level who could speak to AP grading practices across your school district?
13. INDEPENDENT SCHOOLS ONLY - is there a coordinating committee or similar that helps ensure curriculum across schools is similarly delivered and/or helps teachers with professional development?

48 BCCAT Understanding Advanced Placement Grading in BC
Appendix 3: Potential Future ResearchIn conversations with BC post-secondary institutions, it was identified that most would like a stronger understanding of performance in courses that follow on from Advanced Placement. While this falls outside the scope of the existing project, it is a very interesting area to study.
These two questions involve specific chains of courses related to advanced placement. An example of a course chain is shown in the diagram below for the Calculus AB course.
* Note: within the institutions there are several equivalent courses for Calculus I and II within different disciplines. This diagram is intended purely for illustration purposes. The respective institution’s Calendar should be consulted for the most up to date informa-tion on course pre-requisites.
Within specific course chains, is there a performance difference (as measured by course grade) between the follow-ing groups of students? For example, is there a performance difference in UBC’s MATH 100(3) for these four groups of students:
1. Did not participate in AP2. Completed any AP course3. Completed a specific related AP course (e.g. AP Calculus AB 12)4. Completed a specific related AP course (e.g. AP Calculus AB 12) AND received transfer credit via the AP exam
(Calculus AB)5. Completed a specific related AP course (e.g. AP Calculus AB 12) AND enrolled in the prerequisite post-secondary
course (UBC MATH 100(3))

BCCAT 49Understanding Advanced Placement Grading in BC
Appendix 4: Detailed Case Study Data Description
Kwantlen Polytechnic UniversityKwantlen Polytechnic University provided admissions and performance data for cohorts of students from BC sec-ondary schools that began studying at KPU in 2013-14 and 2014-15, as summarized in the table below. The 2013-14 dataset contained information on 3,270 students and the 2014-15 dataset contained information on 3,350 students. As some students were admitted but didn’t contain enough course information to analyze, we ended up with data on 3,174 students from 2013-14 and 3,215 students from 2014-15. Of these students, 249 (7.8%) of the 2013-14 students and 240 (7.5%) of the 2014-15 students had completed at least 1 AP course prior to attending KPU. The cohorts also contained 79 (2.5%) and 106 (3.3%) international students, respectively.
The dataset contained 42,014 grade 12 courses taken by the students, averaging 6.6 courses each. Of those courses, 611 were AP courses, 1.5% of the total; the 489 AP students averaged 1.4 AP courses each, with the minimum of 1 AP course taken by 406 (83.0%) students, 57 (11.7%) taking 2, 16 (3.3%) taking 3, 7 (1.4%) taking 4, and 3 (0.6%) taking 5. The most common AP courses presented by students were AP Calculus AB 12 (n=128), AP English Literature & Com-position 12 (n=127), and AP Psychology 12 (n=122); more detail can be seen in Figure 12.
FIGURE 12: Top 10 AP courses completed by students at KPU in dataset.

50 BCCAT Understanding Advanced Placement Grading in BC
The University of British ColumbiaThe University of British Columbia provided a dataset containing admissions and performance information for 3,707 students from BC secondary schools who began studying at UBC in 2014-15, and 2,882 who began in 2015-16.
The 2014-15 cohort contained 1,249 (33.7%) students who had completed an AP course, and 2,144 (57.8%) of the students were female while 93 (2.5%) were international. Female students made up a slightly higher proportion of students with an AP course (57.3% of those without compared to 58.9% of those with) while international students made up similar proportion of both groups (2.5% and 2.6%, respectively). The 2015-16 cohort contained 948 (32.9%) students who had completed an AP course, and 1,614 (56.0%) were female while 118 (4.1%) were international. Female students in this cohort made up a slightly lower proportion of students with an AP course (56.4% of those without compared to 55.3% of those with) as did international students (4.7% of those without compared to 2.8% of those with).
The dataset contained 58,748 grade 12 courses taken by the students, averaging 8.9 courses each. Of those courses, 4,258 were AP courses, 7.2% of the total; the 2,198 AP students averaged 1.9 AP courses each, with the minimum of 1 AP course taken by 1,165 (53.0%) students, 537 (24.4%) taking 2, 232 (10.6%) taking 3, 132 (6.0%) taking 4, and 131 (6.0%) taking 5 or more; 3 (0.1%) students presented 11 AP courses each on their transcript. The most common AP courses presented by students were AP Calculus AB 12 (n=1,158), AP English Literature & Composition 12 (n=697), AP Chemistry 12 (n=629), AP Psychology 12 (n=497), and AP Biology 12 (n=439); more detail can be seen in Figure 13.
A number of UBC’s students did not have an admission average in the dataset, and these were excluded from any analysis which controlled for admission average; this affected 53 (1.4%) of students in the 2014-15 cohort and 33 (1.1%) of students in the 2015-16 cohort. UBC grades courses on a percentage scale and provided the numerical grade as part of the dataset.
In KPU’s case, as an open access institution, the notion of admission average is not applied in a universal and equal way; in turn, KPU elected to provide grades for English 12, Math 11, and Math 12 (when available) as the closest proxy that KPU has to an admission average. These grades, in turn, were not the specific grades obtained by the student but rather thresholds; the discrete values included were 33, 40, 50, 60, and 80. KPU does not track AP exam dates, loca-tions, or scores, nor does it keep records of transfer credits (including for AP) that were not awarded.
KPU grades courses using letter grades on a 4.33-scale. The final dataset from KPU did not include information on student gender or program of study, or on the number of credit units assigned to each course.4
4 These dataset oversights fall on the researchers, not on KPU.

BCCAT 51Understanding Advanced Placement Grading in BC
FIGURE 13: Top AP courses completed by students at UBC in dataset
The University of VictoriaThe University of Victoria provided a dataset containing admissions and performance information for 1,926 students from BC secondary schools who began studying at UVic in 2015-16, and 1,736 who began in 2016-17.
The 2015-16 cohort contained 321 (16.7%) students who had completed an AP course, and 1,000 (51.9%) of the students were female while 82 (4.3%) were international. Female students made up a slightly higher proportion of stu-dents with an AP course (51.3% of those without compared to 55.1% of those with) as did international students (4.6% of those without and 2.5% of those with). The 2015-16 cohort contained 349 (20.1%) students who had completed an AP course, and 1,736 (51.6%) were female while 61 (3.5%) were international. Female students in this cohort made up a slightly lower proportion of students with an AP course (56.4% of those without compared to 55.3% of those with) as did international students (4.7% of those without compared to 2.8% of those with).
The dataset contained 32,555 grade 12 courses taken by the students, averaging 8.9 courses each. Of those courses, 1,012 were AP courses, 3.1% of the total; the 671 AP students averaged 1.5 AP courses each, with the minimum of 1 AP course taken by 448 (66.8%) students, 146 (21.7%) taking 2, 48 (7.2%) taking 3, 18 (2.7%) taking 4, 7 (1.0%) taking 5, and 3 (0.4%) taking 7; no students in the dataset presented 6 AP courses on the transcript. The most common AP

52 BCCAT Understanding Advanced Placement Grading in BC
FIGURE 14: Top AP courses completed by students at UVic
courses presented by students were AP Calculus AB 12 (n=198), AP English Literature & Composition 12 (n=155), AP English Language & Composition (n=138), AP Psychology 12 (n=99), and AP Chemistry 12 (n=77); more detail can be seen in Figure 14.
A number of UVic’s students had admission averages listed in the range used for scores on the International Baccalau-reate scale, and these were excluded from any analysis which controlled for admission average; this affected 8 (0.4%) students in the 2015-16 cohort and 6 students (0.3%) in the 2016-17 cohort. UVic grades courses using letter grades on a 9.0-scale.
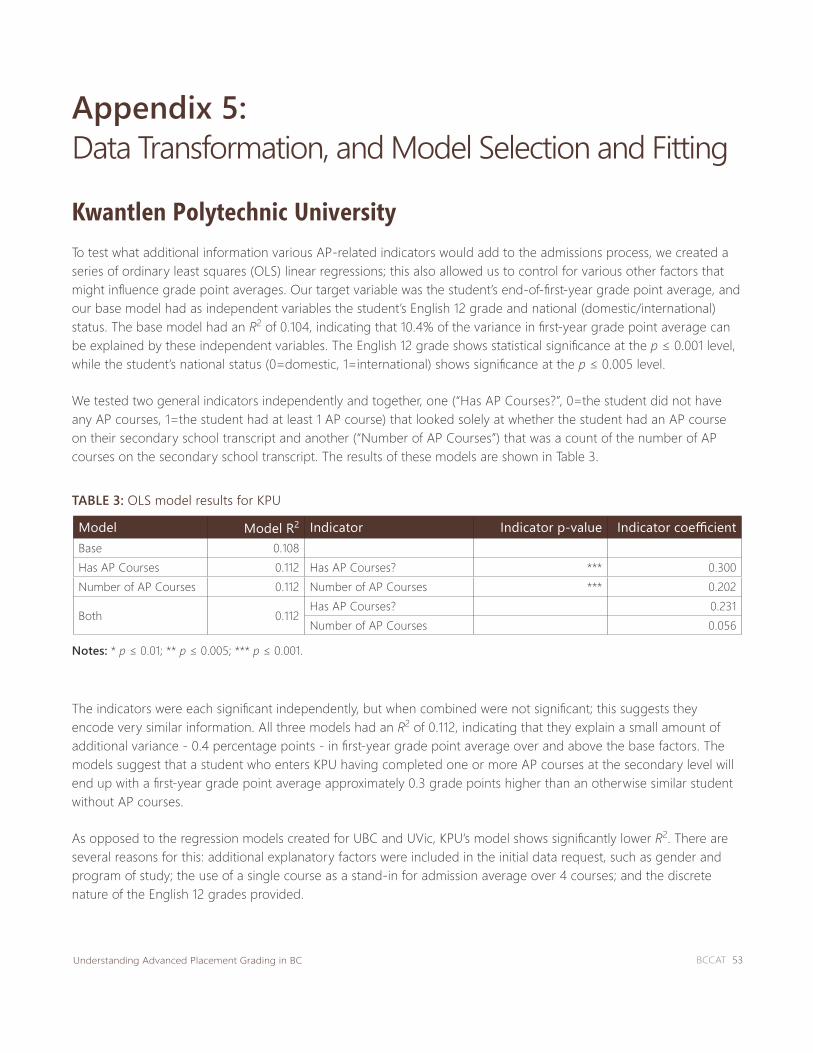
BCCAT 53Understanding Advanced Placement Grading in BC
Appendix 5: Data Transformation, and Model Selection and Fitting
Kwantlen Polytechnic UniversityTo test what additional information various AP-related indicators would add to the admissions process, we created a series of ordinary least squares (OLS) linear regressions; this also allowed us to control for various other factors that might influence grade point averages. Our target variable was the student’s end-of-first-year grade point average, and our base model had as independent variables the student’s English 12 grade and national (domestic/international) status. The base model had an R2 of 0.104, indicating that 10.4% of the variance in first-year grade point average can be explained by these independent variables. The English 12 grade shows statistical significance at the p ≤ 0.001 level, while the student’s national status (0=domestic, 1=international) shows significance at the p ≤ 0.005 level.
We tested two general indicators independently and together, one (“Has AP Courses?”, 0=the student did not have any AP courses, 1=the student had at least 1 AP course) that looked solely at whether the student had an AP course on their secondary school transcript and another (“Number of AP Courses”) that was a count of the number of AP courses on the secondary school transcript. The results of these models are shown in Table 3.
The indicators were each significant independently, but when combined were not significant; this suggests they encode very similar information. All three models had an R2 of 0.112, indicating that they explain a small amount of additional variance - 0.4 percentage points - in first-year grade point average over and above the base factors. The models suggest that a student who enters KPU having completed one or more AP courses at the secondary level will end up with a first-year grade point average approximately 0.3 grade points higher than an otherwise similar student without AP courses.
As opposed to the regression models created for UBC and UVic, KPU’s model shows significantly lower R2. There are several reasons for this: additional explanatory factors were included in the initial data request, such as gender and program of study; the use of a single course as a stand-in for admission average over 4 courses; and the discrete nature of the English 12 grades provided.
TABLE 3: OLS model results for KPU
Model Model R2 Indicator Indicator p-value Indicator coefficientBase 0.108Has AP Courses 0.112 Has AP Courses? *** 0.300Number of AP Courses 0.112 Number of AP Courses *** 0.202
Both 0.112Has AP Courses? 0.231Number of AP Courses 0.056
Notes: * p ≤ 0.01; ** p ≤ 0.005; *** p ≤ 0.001.

54 BCCAT Understanding Advanced Placement Grading in BC
We additionally tested indicators that encoded whether a student had taken a particular AP course, with a 0 repre-senting that the student did not take the course and a 1 representing that they did. While 4 of these indicators showed some level of significance - AP English Language & Composition 12 and AP English Language & Literature 12 at the p ≤ 0.001 level, AP Calculus AB 12 at the p ≤ 0.005 level, and AP Psychology 12 at the p ≤ 0.01 level - in all cases the general “Has AP Courses?” and “Number of AP Courses” performed better at explaining the variance.
We created a second regression model that looked at individual grade 12 course grades and their relation to first-year performance. Grade 12 courses were separated into 3 groups: AP courses without a BC analogue, BC courses without an AP analogue, and BC courses that had an AP analogue (based on Table 3). For this last group, we included BC grades for students who did not take the BC analogue and only AP grades for students that took the AP version; any grade obtained in the BC analogue, if present, was discarded. OLS was again used for the regression, with the target variable the student’s aggregate first-year performance and the independent variables was the course grade obtained, national status, and for the BC w/ AP analogue group an AP indicator (0=BC course, 1=AP course). The regression was run both for the three groups overall and, for the last group, at the level of the particular BC/AP course code. Overall results are shown in Table 4.
TABLE 4: OLS model results individual grade 12 courses for KPU
Model Model R2 without AP indicator
Model R2 with AP indicator
Indicator p-value Indicator to Grade coefficient ratio
AP-only courses 0.110
BC-only courses 0.076
BC w/ AP analogue 0.125 0.126 *** 7.8
Biology 12 0.136 0.137
Calculus 12 0.150 0.152
Chemistry 12 0.184 0.185
Economics 12 0.151 0.158
English 12 0.127 0.133 *** 12.9
History 12 0.151 0.153
Mandarin 12 0.046 0.046
Physics 12 0.134 0.135
Notes: * p ≤ 0.01; ** p ≤ 0.005; *** p ≤ 0.001. The BC w/ AP analogue model was not run for French 12, German 12, or Japanese 12 as there were too few students for usable results.
AP courses without a BC analogue are better predictors than are BC courses without an AP analogue, but courses for which both versions of the course exist are better than either other group. In this third group, the AP indicator was statistically significant at the p ≤ 0.001 level and added a small amount of predictor power, moving from an R2 of 0.125 to 0.126. The ratio of the coefficient on the AP indicator to the coefficient on the grade 12 course grade gives us an approximation of the equivalency between grades in BC courses compared to AP courses, and in this regression the ratio was approximately 7.8. This suggests a student with an 88% grade in an AP course such as AP Biology 12 would be expected to perform, on average, equivalently to an otherwise similar student who received 80% in BC Biology 12. Note that because we excluded grades in BC-analogue courses for students took the AP analogue of the course, this ratio is independent of the transcripted BC grade.

BCCAT 55Understanding Advanced Placement Grading in BC
When run for individual BC course codes, the AP indicator was statistically significant only for English 12. In this case the R2 was improved from 0.127 without the AP indicator to 0.133 with the indicator, and the coefficient ratio was 12.9, suggesting a student who received 93% in AP English Language & Culture 12 (or AP English Literature & Culture 12) would perform, on average, equivalently to an otherwise similar student who received 80% in BC English 12.
Lastly for aggregate performance, in order to look into which combinations of factors when all viewed together might be most useful, we utilized Bayesian model averaging (BMA, as discussed above, Raftery et al., 1997) to attempt to look at which indicators of secondary coursework may be useful in predicting first-year grade point average. The BMA modelling tested 326 models, of which 100% of the best models selected admission average and several indicators of students taking the BC provincial courses. Neither of the “Number of AP Courses” and “Has AP Courses?” indicators was selected by any of the best models. AP English Language & Composition 12 was selected by 40.0% of the top models, while AP Calculus AB 12 was selected by 5.5% and AP Psychology 12 by 2.3%. The best models created had R2s of 0.148, suggesting that with the right combination of indicators available can see improvements of 4.0 percent-age points in modelling first-year grade point average.
For course and subject area performance, we created a base OLS model and then models that tested the “Has AP Courses?,” “Number of AP Courses,” and individual AP course indicators. We limited the models to cases where courses or subjects had 50 enrolments within the dataset and at least 10 of those enrolments were by a student that had an AP course on their record; in cases where we were testing an individual course indicator (for example, “Took AP Calculus AB 12?”) we limited the analysis to cases where 10 students had that particular AP course on their second-ary transcript.
In general, the base model has smaller R2s when the dependent variable is course- or subject-level performance. Simi-lar to the issue of using the English 12 grade as a stand-in for admission average, there are fewer underlying observa-tions (enrolments) and those observations have discrete (4.33, 4.00, 3.67, 3.33, etc.) rather than continuous values that underlie them. The largest subject-level R2 at KPU is PSYC (Psychology) courses with R2 = 0.100, with some subjects showing a near-zero R2.
The “Has AP Courses?” indicator shows significance for 8 of 35 subjects tested (23%), at the p ≤ 0.001 level for BIOL (Biology) and MATH (Mathematics) courses, at the p ≤ 0.005 level for BUQU (Business & Quantitative Methods), PHYS (Physics), and PSYC (Psychology), and at the p ≤ 0.01 level for BUSI (Business), CHEM (Chemistry), and ECON (Eco-nomics). Overall improvements in R2 range from 0.003 (BUSI and PSYC) to 0.020 (MATH), though in the case of MATH the base model’s R2 is 0.012. The “Number of AP Courses” indicator shows significance for 5 of 36 subjects tested (14%), at the p ≤ 0.001 level for MATH courses, at the p ≤ 0.005 level for BUSI and ECON, and at the p ≤ 0.01 level for BIOL and BUQU; differences in R2 are similar to the “Has AP Courses?” indicator. In general, there is some small degree of usefulness in predicting performance in some subjects with AP indicators, but the specific indicator varies.
For the “AP course taken” indicators, only two showed any statistical significance in OLS models. AP English Language & Composition 12 is significant at the p ≤ 0.001 level for EDUC (Education) courses, with a small R2 lift from 0.057 to 0.059. AP Calculus AB 12 is significant at the p ≤ 0.001 level in BIOL, ECON, MATH, and PHYS, at the p ≤ 0.005 level for PSYC, and at the p ≤ 0.01 level for ACCT and BUQU.
For specific course-level performance, we see similar results. Only 6 courses meet our criteria for inclusion and show results of significance for the indicators, with one exception within the same subject areas that showed subject-level significance; the outlier is a CRIM (Criminology) class. Of the indicators, only our two general indicators and the “Took
56 BCCAT Understanding Advanced Placement Grading in BC
AP Calculus AB 12” indicator show any significance. AP Calculus AB 12 is statistically significant at the p ≤ 0.001 for ECON 1150 (Principles of Microeconomics) and MATH 1120 (Differential Calculus), at the p ≤ 0.005 level for BIOL 1110 (Introductory Biology I), and at the p ≤ 0.01 level for BUQU 1130 (Business Mathematics); 4 out of 33 courses tested (12%). The “Has AP Courses?” indicator is statistically significant for 4 courses of 84 tested (5%), at the p ≤ 0.001 level for BIOL 1110, BUSI 1210 (Essentials of Management), and MATH 1120, and at the p ≤ 0.005 level for CRIM 2331 (Socio-logical Explanations of Criminal Behaviour). Finally, the “Number of AP Courses” indicator is statistically significant for 5 of 89 courses tested (6%), at the p ≤ 0.001 level for BUSI 1210 and MATH 1120, at the p ≤ 0.005 level for BIOL 1110 and ECON 1150, and at the p ≤ 0.01 level for CRIM 2331.
As with aggregate performance, also tested a model that looked at individual grade 12 courses and their predictive ability for at the subject and course level. The model was run only for BC grade 12 courses that had an AP analogue and where we had at least 50 students who took both the grade 12 course and either the course or subject at UBC with a minimum of 10 of those 50 having taken the AP analogue in grade 12. The dependent variable was an un-weighted grade point average in the course or subject, with the independent variables the grade 12 course grade, national status, gender, and faculty of study; models were run both with and without the AP indicator.
The AP indicator was significant in 2 subjects when run for all grade 12 courses at the p < 0.001 level – ENGL and PSYC – as well as for MATH at the p < 0.005 level and ECON at the p < 0.010 level. Improvements in R2 for these 4 subjects ranged from 0.002 for ENGL to 0.004 for ECON and MATH, with ratios falling between 9.3 and 14.1.
When looking at models for individual grade 12 courses, the AP indicator was significant only for English 12. In this case, the indicator was significant at the p < 0.001 level for courses in ENGL with an R2 improvement from 0.115 to 0.126 and a ratio of 13.9; it was also significant at the p < 0.010 level for BUSI with an R2 improvement from 0.098 to 0.105 and a ratio of 14.8.
At the course level, there were 7 courses of 49 where the AP indicator is significant in the all-grade-12 courses model – 2 at p < 0.001, 1 at p < 0.005, and 3 at p < 0.010. These courses are spread across 6 subject areas, with 2 courses in MATH (1120 at p < 0.001, 1130, Calculus for Life Sciences I, at p < 0.010) and 1 each in BIOL (1110; p < 0.010), BUSI (1210; p < 0.005), ECON (1150; p < 0.010), ENGL (1100. Introduction to University Writing; p < 0.001), and PSYC (1200, Intro-duction to Psychology: Areas and Applications; p < 0.010). R2 improvements were between 0.002 and 0.019 and ratios between 8.1 and 36.3.
For grade 12 course/KPU course pairs, the AP indicator was significant only for 3 courses of 30 that could be tested (10%), all for English 12 at p < 0.001 – ENGL 1100, ENGL 1202 (Reading and Writing about Selected Topics: An Introduc-tion to Literature), and PSYC 1200. R2 improvements were between 0.008 and 0.042 and ratios are between 12.5 and 18.6.
The University of British ColumbiaTo test what additional information various AP-related indicators would add to the admissions process, we created a series of ordinary least squares (OLS) linear regressions; this also allowed us to control for various other factors that might influence grade point averages. Our target variable was the student’s end-of-first-year sessional average, and our base model had as independent variables the student’s admission average, national (domestic/international) sta-tus, gender, and faculty of study. The base model had an R2 of 0.275, indicating that 27.5% of the variance in first-year

BCCAT 57Understanding Advanced Placement Grading in BC
sessional average can be explained by these independent variables. The admission average shows statistical signifi-cance at the p ≤ 0.001 level, while the student’s national status (0=domestic, 1=international) shows significance at the p ≤ 0.005 level and gender shows significance at the p ≤ 0.01 level. Some faculties of study are statistically significant, while others are not.
We tested two general indicators independently and together, one (“Has AP Courses?”, 0=the student did not have any AP courses, 1=the student had at least 1 AP course) that looked solely at whether the student had an AP course on their secondary school transcript and another (“Number of AP Courses”) that was a count of the number of AP courses on the secondary school transcript. The results of these models are shown in Table 5.
TABLE 5: OLS model results for UBC
The indicators were each significant independently, but when combined only the “Number of AP Courses” indicator is significant, and then at the p ≤ 0.01 level; this suggests they encode very similar information. All three models had an R2 of 0.277 or 0.278, indicating that they explain a small amount of additional variance - 0.2 to 0.3 percentage points - in first-year sessional average over and above the base factors. The models suggest that a student who enters UBC having completed one or more AP courses at the secondary level will end up with a first-year grade point average ap-proximately 0.5 to 2.0 percentage points (depending on number of AP courses taken) higher than an otherwise similar student without AP courses.
We additionally tested indicators that encoded whether a student had taken a particular AP course, with a 0 repre-senting that the student did not take the course and a 1 representing that they did. While 9 of these indicators showed some level of significance - AP Calculus AB 12, AP Chemistry 12, AP Chinese Language and Culture 12, and AP Physics B 12 (since discontinued) at the p ≤ 0.001 level, AP 2-D Design Portfolio 12, AP English Literature & Composition 12, and AP Statistics 12 at the p ≤ 0.005 level, and AP Biology 12 and AP English Language & Composition 12 at the p ≤ 0.01 level - only AP Chemistry 12 outperformed the general “Has AP Courses?” and “Number of AP Courses” indica-tors at explaining the variance, with an R2 of 0.280, an improvement of 0.5 percentage points over the base model.
We created a second regression model that looked at individual grade 12 course grades and their relation to first-year performance. Grade 12 courses were separated into 3 groups: AP courses without a BC analogue, BC courses without an AP analogue, and BC courses that had an AP analogue (based on Table 3). For this last group, we included BC grades for students who did not take the BC analogue and only AP grades for students that took the AP version; any grade obtained in the BC analogue, if present, was discarded. OLS was again used for the regression, with the target variable the student’s aggregate first-year performance and the independent variables was the course grade obtained, national status, gender, faculty of study, and for the BC w/ AP analogue group an AP indicator (0=BC course, 1=AP course). We excluded students in AP courses with final course grades of 96%, 86%, 80%, and 70%, as with UBC’s data
Model Model R2 Indicator Indicator p-value Indicator coefficientBase 0.275Has AP Courses 0.277 Has AP Courses? *** 1.188Number of AP Courses 0.278 Number of AP Courses *** 0.514
Both 0.278Has AP Courses? 0.459Number of AP Courses * 0.385
Notes: * p ≤ 0.01; ** p ≤ 0.005; *** p ≤ 0.001.

58 BCCAT Understanding Advanced Placement Grading in BC
it was not possible to determine which of these grades were provided as a course grade and which were converted from an AP exam score based on the current equivalency table. The regression was run both for the three groups overall and, for the last group, at the level of the particular BC/AP course code. Overall results are shown in Table 6.
AP courses without a BC analogue are better predictors than are BC courses without an AP analogue, but courses for which both versions of the course exist are better than either other group. In this third group, the AP indicator was statistically significant at the p ≤ 0.001 level and added predictor power, moving from an R2 of 0.171 to 0.178 (4.1%). The ratio of the coefficient on the AP indicator to the coefficient on the grade 12 course grade gives us an approxima-tion of the equivalency between grades in BC courses compared to AP courses, and in this regression the ratio was approximately 7.1. This suggests a student with an 87% grade in an AP course such as AP Biology 12 would be ex-pected to perform, on average, equivalently to an otherwise similar student who received 80% in BC Biology 12. Note that because we excluded grades in BC-analogue courses for students took the AP analogue of the course, this ratio is independent of the transcripted BC grade.
When run for individual BC course codes, the AP indicator was statistically significant for six different courses at the p ≤ 0.001 level, and all six courses saw an improved R2. The coefficient ratio is typically between 5.6 and 8.6, with the exception of English 12 at 3.5. This latter ratio suggests a student who received 84% in AP English Language & Culture 12 (or AP English Literature & Culture 12) would perform, on average, equivalently to an otherwise similar student who received 80% in BC English 12.
Lastly for aggregate performance, in order to look into which combinations of factors when all viewed together might be most useful, we utilized Bayesian model averaging (BMA, as discussed above, Raftery et al., 1997) to attempt to
Notes: * p ≤ 0.01; ** p ≤ 0.005; *** p ≤ 0.001. The BC w/ AP analogue model was not run for German 12, or Japanese 12 as there were too few students for usable results.
TABLE 6: OLS model results individual grade 12 courses for UBC
Model Model R2 Indicator Indicator p-value Indicator coefficient
AP-only courses 0.192
BC-only courses 0.077
BC w/ AP analogue 0.171 0.178 *** 7.1
Biology 12 0.223 0.232 *** 6.1
Calculus 12 0.219 0.235 *** 7.7
Chemistry 12 0.233 0.251 *** 8.6
Economics 12 0.240 0.250 *** 5.6
English 12 0.191 0.194 *** 3.5
French 12 0.180 0.180
History 12 0.209 0.209
Mandarin 12 0.204 0.212
Physics 12 0.233 0.239 *** 6.2
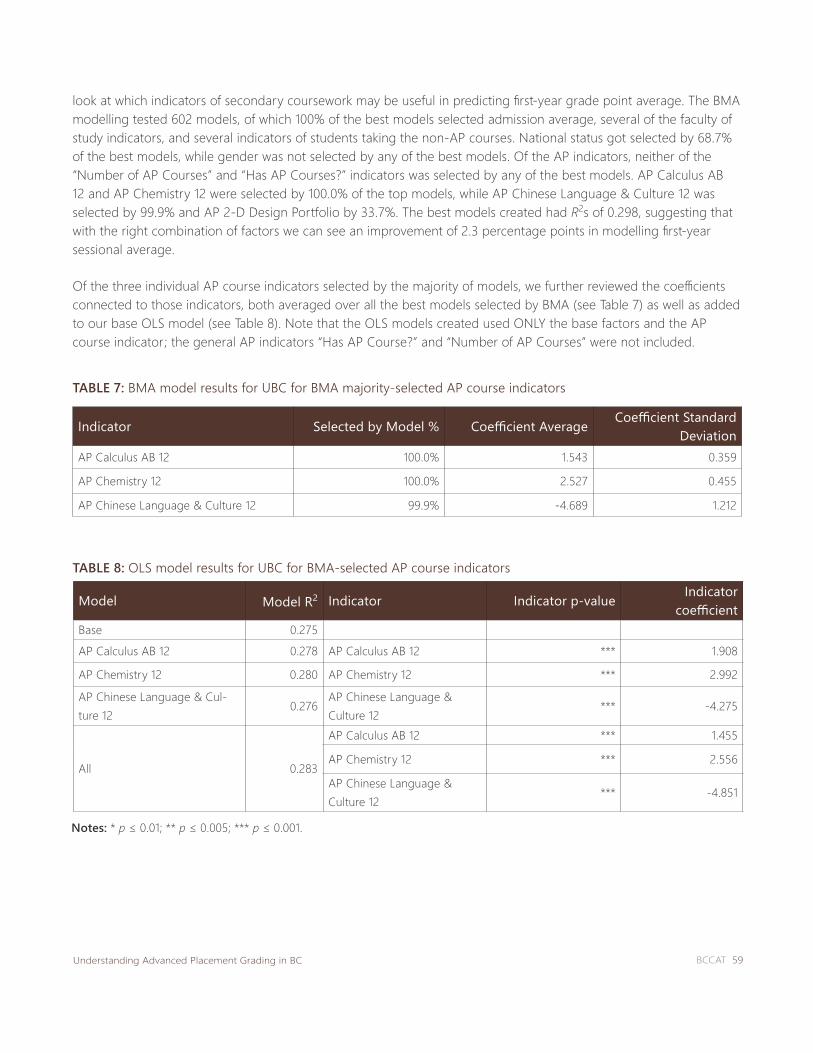
BCCAT 59Understanding Advanced Placement Grading in BC
look at which indicators of secondary coursework may be useful in predicting first-year grade point average. The BMA modelling tested 602 models, of which 100% of the best models selected admission average, several of the faculty of study indicators, and several indicators of students taking the non-AP courses. National status got selected by 68.7% of the best models, while gender was not selected by any of the best models. Of the AP indicators, neither of the “Number of AP Courses” and “Has AP Courses?” indicators was selected by any of the best models. AP Calculus AB 12 and AP Chemistry 12 were selected by 100.0% of the top models, while AP Chinese Language & Culture 12 was selected by 99.9% and AP 2-D Design Portfolio by 33.7%. The best models created had R2s of 0.298, suggesting that with the right combination of factors we can see an improvement of 2.3 percentage points in modelling first-year sessional average.
Of the three individual AP course indicators selected by the majority of models, we further reviewed the coefficients connected to those indicators, both averaged over all the best models selected by BMA (see Table 7) as well as added to our base OLS model (see Table 8). Note that the OLS models created used ONLY the base factors and the AP course indicator; the general AP indicators “Has AP Course?” and “Number of AP Courses” were not included.
TABLE 7: BMA model results for UBC for BMA majority-selected AP course indicators
Indicator Selected by Model % Coefficient Average Coefficient Standard Deviation
AP Calculus AB 12 100.0% 1.543 0.359
AP Chemistry 12 100.0% 2.527 0.455
AP Chinese Language & Culture 12 99.9% -4.689 1.212
Notes: * p ≤ 0.01; ** p ≤ 0.005; *** p ≤ 0.001.
TABLE 8: OLS model results for UBC for BMA-selected AP course indicators
Model Model R2 Indicator Indicator p-value Indicator coefficient
Base 0.275
AP Calculus AB 12 0.278 AP Calculus AB 12 *** 1.908
AP Chemistry 12 0.280 AP Chemistry 12 *** 2.992
AP Chinese Language & Cul-ture 12
0.276AP Chinese Language & Culture 12
*** -4.275
All 0.283
AP Calculus AB 12 *** 1.455
AP Chemistry 12 *** 2.556
AP Chinese Language & Culture 12
*** -4.851
60 BCCAT Understanding Advanced Placement Grading in BC
Based on these results, we would expect a student who took AP Calculus AB 12 to have a first-year sessional average of approximately 1.4 to 1.9 percentage points higher than an otherwise similar student who did not take AP Calculus AB 12; with AP Chemistry 12, the student who took the course should be expected to have a sessional average be-tween 2.5 and 2.9 percentage points higher. With AP Chinese Language & Culture 12 the difference is in the opposite direction, however: the student who took the class would be expected to have a sessional average approximately 4.3 to 4.9 percentage points lower than an otherwise similar student who didn’t take the course. In UBC’s dataset, there were 954 students who had completed AP Calculus AB 12, 527 who had completed AP Chemistry 12, and 63 who had completed AP Chinese Language & Culture 12.
The OLS models using the three indicators independently generally provided better predictive results than our general AP indicators, with the exception of AP Chinese Language & Culture 12; using all indicators together gets the model 0.5 percentage points better than any of the models using the general indicators.
For course and subject area performance, we created a base OLS model and then models that tested the “Has AP Courses?,” “Number of AP Courses,” and individual AP course indicators. We limited the models to cases where cours-es or subjects had 50 enrolments within the dataset and at least 10 of those enrolments were by a student that had an AP course on their record; in cases where we were testing an individual course indicator (for example, “Took AP Calculus AB 12?”) we limited to cases where 10 students had that particular AP course on their secondary transcript. In total 59 subject areas were tested.
The “Has AP Courses?” indicator shows significance for 4 (7%) subjects, at the p ≤ 0.001 level for CHEM (Chemistry), MATH (Mathematics), and PHYS (Physics) courses, and at the p ≤ 0.01 level for APSC (Applied Science). Overall im-provements in R2 range from 0.004 (CHEM) to 0.007 (APSC and MATH). The “Number of AP Courses” indicator shows significance for 5 (8%) subjects, at the p ≤ 0.001 level for CHEM, MATH, and PHYS courses, and at the p ≤ 0.005 level for APSC and BIOL (Biology); differences in R2 are similar to the “Has AP Courses?” indicator. In general, there is some small degree of usefulness in predicting performance in some subjects with AP indicators, but the specific indicator varies.
For the AP course taken indicators, only AP Calculus AB 12 showed any statistical significance in OLS models, with sig-nificance for 6 of 41 (15%) subjects tested: at the p ≤ 0.001 level for CHEM, MATH, and PHYS courses, at the p ≤ 0.005 level for ECON (Economics), and at the p ≤ 0.01 level for APSC and KIN (Kinesiology).
For specific course-level performance, we see significant overlap with subject-level performance. “Has AP Courses?” is statistically significant for 11 courses (6%), at the p ≤ 0.001 level for 3 courses in MATH and 1 in PHYS, at the p ≤ 0.005 level for 3 in CHEM in 1 in SCIE (Science), and at the p ≤ 0.01 level for 1 in APSC, 1 in COMM (Commerce), and 1 in KIN. “Number of AP Courses” is also significant for 11 courses, at the p ≤ 0.001 level for 1 course in APSC, 1 in BIOL, 1 in CHEM, 2 in MATH, 1 in PHYS, and 1 in SCIE, at the p ≤ 0.005 level for 1 in BIOL, and at the p ≤ 0.01 level for 1 in CHEM, 1 in COMM, and 1 in PHYS. Of the AP course indicators, AP Calculus AB 12 is again the only statistically significant indi-cator, at the p ≤ 0.001 level for 2 courses in CHEM, 1 in COMM, 1 in ECON, 5 in MATH, and 2 in PHYS, at the p ≤ 0.005 level for 1 in APSC, 1 in CHEM, and 1 in SCIE, and at the p ≤ 0.01 level for 1 in PHYS.
As with aggregate performance, also tested a model that looked at individual grade 12 courses and their predictive ability for at the subject and course level. The model was run only for BC grade 12 courses that had an AP analogue and where we had at least 50 students who took both the grade 12 course and either the course or subject at UBC with a minimum of 10 of those 50 having taken the AP analogue in grade 12. The dependent variable was an un-

BCCAT 61Understanding Advanced Placement Grading in BC
weighted grade point average in the course or subject, with the independent variables the grade 12 course grade, national status, gender, and faculty of study; models were run both with and without the AP indicator.
Of 57 subjects tested with the model across all grade 12 courses, the AP indicator was significant in a total of 13 (23%): 11 subjects at the p < 0.001 level – subjects include APSC, BIOL, CHEM, COMM, ECON, ENGL (English), KIN, MATH, PHYS, PSYC (Psychology), and SCIE – and 2 additional subjects – EOSC (Earth and Ocean Sciences) and FREN (French) – at the p < 0.010 level. Improvements in R2 for these 13 subjects ranged from 0.001 for ENGL to 0.020 for KIN, with 11 of the 13 ratios falling between 5.8 and 9.5; ENGL was the outlier on the low side with a ratio of 3.7 and KIN the outlier on the high side at 12.2.
When looking at models for individual grade 12 courses, the AP indicator is significant in 35 of 198 (18%) of grade 12 course/UBC subject pairs. For Biology 12 the AP indicator is significant in 7 subjects, 5 at the p < 0.001 level (BIOL, CHEM, MATH, PHYS, and PSYC) and 2 at the p < 0.005 level (ENGL, SCIE); R2 improvements are between 0.003 and 0.032, and ratios are between 4.8 and 8.0. For Calculus 12 the AP indicator is significant in 8 subjects, 5 at the p < 0.001 level (APSC, BIOL, CHEM, MATH, and PHYS) and 3 at the p < 0.005 level (ECON, EOSC, and KIN); R2 improve-ments are between 0.009 and 0.100, and ratios are generally between 6.1 and 8.6, though for EOSC the ratio is 15.5 and for KIN it is 24.8. For Chemistry 12 the AP indicator is significant in 8 subjects, 5 at the p < 0.001 level (BIOL, CHEM, MATH, PHYS, and PSYC) and 3 at the p < 0.005 level (APSC, CPSC (Computer Science), and ECON); R2 im-provements are between 0.010 and 0.037, and ratios are between 4.4 and 9.7. For Economics 12 the AP indicator is significant in 2 subjects at the p < 0.005 level (BIOL and COMM); R2 improvements are 0.030 and 0.037 and ratios are 10.4 and 6.1 respectively. For English 12 the AP indicator is significant in 2 subjects, PSYC at the p < 0.005 level and ENGL at the p < 0.010 level; R2 improvements are 0.001 and 0.003, and ratios are 2.5 and 3.5 respectively. Finally, for Physics 12 the AP indicator is significant in 6 subjects, 3 at the p < 0.001 level (CHEM, MATH, and PHYS), BIOL at the p < 0.005 level, and 2 at the p < 0.010 level (APSC and PSYC); R2 improvements are between 0.005 and 0.011, and ratios are between 4.8 and 9.2.
One outlier is Mandarin 12, in which the AP indicator is significant for both BIOL (p < 0.005) and CHEM (p < 0.010); in both cases, however, the coefficient for both the course grade and the AP indicator are negative, suggesting students with better grades in either the AP or BC analogues of Mandarin 12 perform worse at UBC than students with lower grades in those courses. It is worth noting that the number of AP cases in these models are the smallest of the subject areas for which we get significant results.
At the course level, there are 37 of 204 tested courses (18%) where the AP indicator is significant in the all-grade-12 courses model and 73 of 423 tested grade 12 course/UBC course pairs (17%) where the AP indicator is significant. For the all-grade-12 courses model, R2 improvements are between 0.001 and 0.013 for 32 of 37 courses (86%), with 4 (11%) between 0.015 and 0.021 and 1 (3%) outlier at 0.052. Ratios are between 2.7 and 13.7. There is a curious outlier in the case of APSC 181 where AP students tend to perform similarly to a non-AP students with a grade 12 course grade 16 percentage points higher; an 80% AP student performs on average similar to a non-AP student with a 96%.
For grade 12 course/UBC course pairs, 67 of the 73 (92%) cases where the AP indicator is significant had R2 improve-ments between 0.003 and 0.059; the remaining cases were between 0.080 and 0.0127. For 63 of the 73 (86%) ratios were between 3.0 and 12.9, with 4 (5%) between 14.2 and 16.0, 2 (3%) between 23.2 and 23.9, and 1 (1%) at 36.1. Mandarin 12 is similarly an outlier here as it was at the subject level, with negative coefficients for both grade 12 grade and AP indicator.
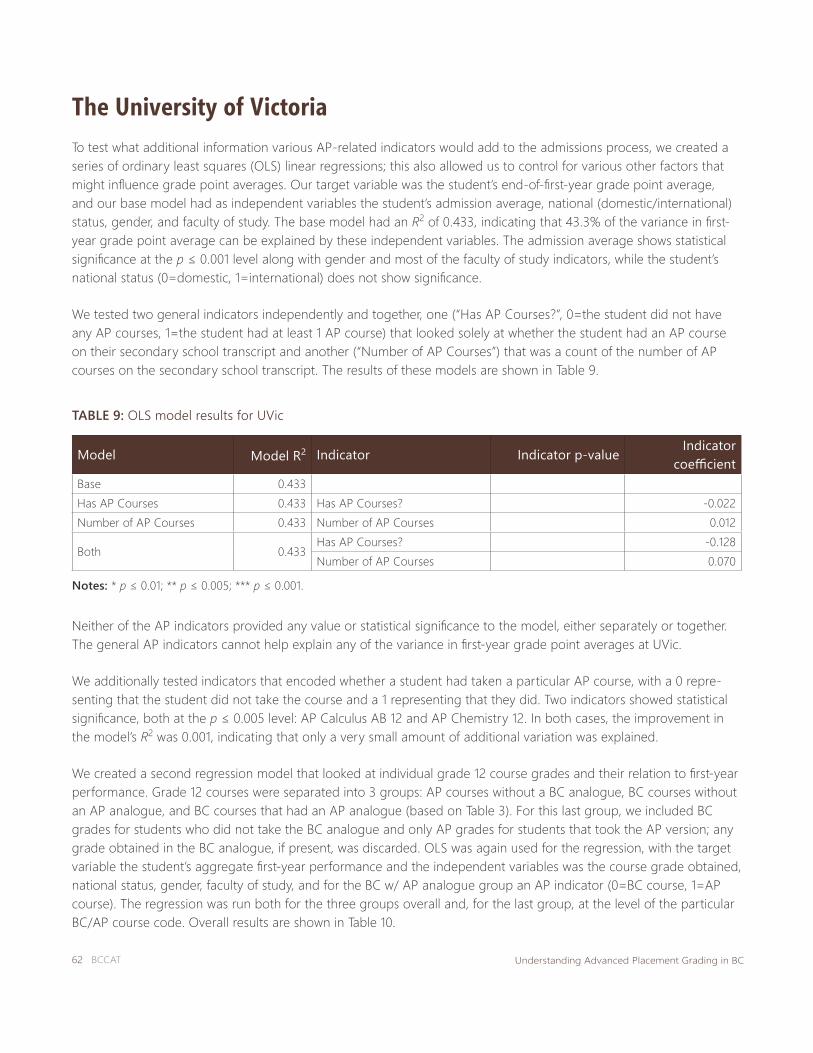
62 BCCAT Understanding Advanced Placement Grading in BC
The University of VictoriaTo test what additional information various AP-related indicators would add to the admissions process, we created a series of ordinary least squares (OLS) linear regressions; this also allowed us to control for various other factors that might influence grade point averages. Our target variable was the student’s end-of-first-year grade point average, and our base model had as independent variables the student’s admission average, national (domestic/international) status, gender, and faculty of study. The base model had an R2 of 0.433, indicating that 43.3% of the variance in first-year grade point average can be explained by these independent variables. The admission average shows statistical significance at the p ≤ 0.001 level along with gender and most of the faculty of study indicators, while the student’s national status (0=domestic, 1=international) does not show significance.
We tested two general indicators independently and together, one (“Has AP Courses?”, 0=the student did not have any AP courses, 1=the student had at least 1 AP course) that looked solely at whether the student had an AP course on their secondary school transcript and another (“Number of AP Courses”) that was a count of the number of AP courses on the secondary school transcript. The results of these models are shown in Table 9.
TABLE 9: OLS model results for UVic
Model Model R2 Indicator Indicator p-value Indicator coefficient
Base 0.433Has AP Courses 0.433 Has AP Courses? -0.022Number of AP Courses 0.433 Number of AP Courses 0.012
Both 0.433Has AP Courses? -0.128Number of AP Courses 0.070
Notes: * p ≤ 0.01; ** p ≤ 0.005; *** p ≤ 0.001.
Neither of the AP indicators provided any value or statistical significance to the model, either separately or together. The general AP indicators cannot help explain any of the variance in first-year grade point averages at UVic.
We additionally tested indicators that encoded whether a student had taken a particular AP course, with a 0 repre-senting that the student did not take the course and a 1 representing that they did. Two indicators showed statistical significance, both at the p ≤ 0.005 level: AP Calculus AB 12 and AP Chemistry 12. In both cases, the improvement in the model’s R2 was 0.001, indicating that only a very small amount of additional variation was explained.
We created a second regression model that looked at individual grade 12 course grades and their relation to first-year performance. Grade 12 courses were separated into 3 groups: AP courses without a BC analogue, BC courses without an AP analogue, and BC courses that had an AP analogue (based on Table 3). For this last group, we included BC grades for students who did not take the BC analogue and only AP grades for students that took the AP version; any grade obtained in the BC analogue, if present, was discarded. OLS was again used for the regression, with the target variable the student’s aggregate first-year performance and the independent variables was the course grade obtained, national status, gender, faculty of study, and for the BC w/ AP analogue group an AP indicator (0=BC course, 1=AP course). The regression was run both for the three groups overall and, for the last group, at the level of the particular BC/AP course code. Overall results are shown in Table 10.
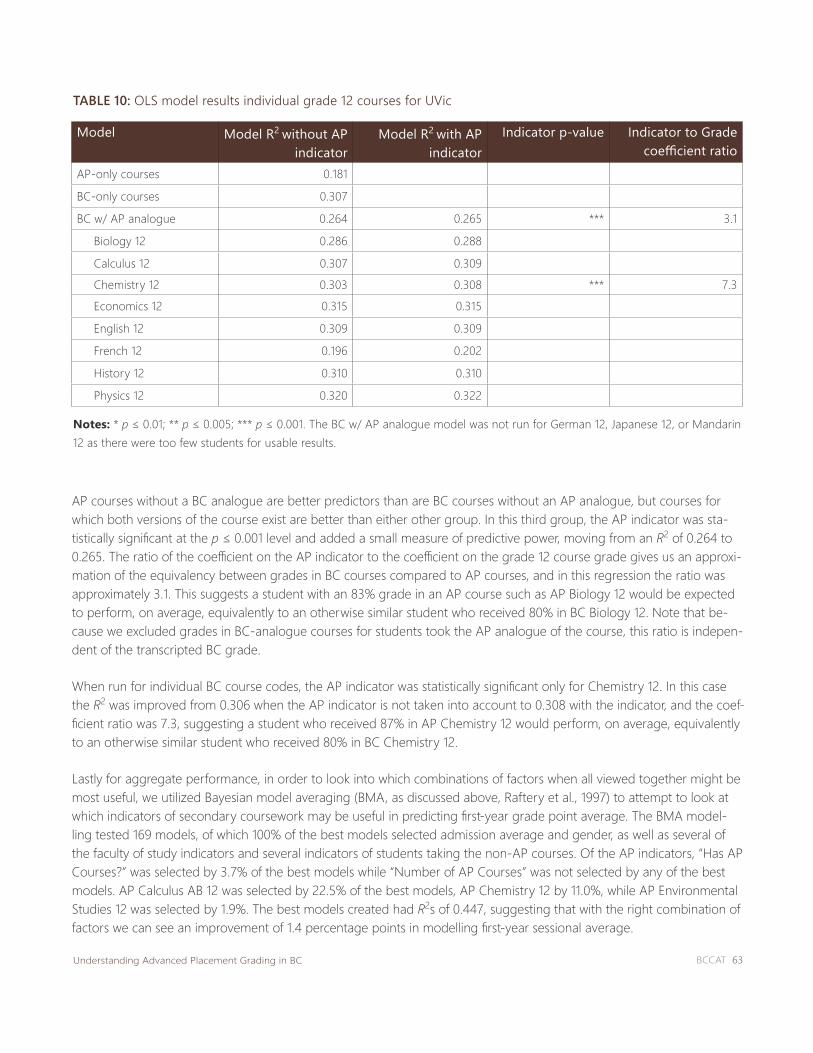
BCCAT 63Understanding Advanced Placement Grading in BC
TABLE 10: OLS model results individual grade 12 courses for UVic
Notes: * p ≤ 0.01; ** p ≤ 0.005; *** p ≤ 0.001. The BC w/ AP analogue model was not run for German 12, Japanese 12, or Mandarin 12 as there were too few students for usable results.
Model Model R2 without AP indicator
Model R2 with AP indicator
Indicator p-value Indicator to Grade coefficient ratio
AP-only courses 0.181
BC-only courses 0.307
BC w/ AP analogue 0.264 0.265 *** 3.1
Biology 12 0.286 0.288
Calculus 12 0.307 0.309
Chemistry 12 0.303 0.308 *** 7.3
Economics 12 0.315 0.315
English 12 0.309 0.309
French 12 0.196 0.202
History 12 0.310 0.310
Physics 12 0.320 0.322
AP courses without a BC analogue are better predictors than are BC courses without an AP analogue, but courses for which both versions of the course exist are better than either other group. In this third group, the AP indicator was sta-tistically significant at the p ≤ 0.001 level and added a small measure of predictive power, moving from an R2 of 0.264 to 0.265. The ratio of the coefficient on the AP indicator to the coefficient on the grade 12 course grade gives us an approxi-mation of the equivalency between grades in BC courses compared to AP courses, and in this regression the ratio was approximately 3.1. This suggests a student with an 83% grade in an AP course such as AP Biology 12 would be expected to perform, on average, equivalently to an otherwise similar student who received 80% in BC Biology 12. Note that be-cause we excluded grades in BC-analogue courses for students took the AP analogue of the course, this ratio is indepen-dent of the transcripted BC grade.
When run for individual BC course codes, the AP indicator was statistically significant only for Chemistry 12. In this case the R2 was improved from 0.306 when the AP indicator is not taken into account to 0.308 with the indicator, and the coef-ficient ratio was 7.3, suggesting a student who received 87% in AP Chemistry 12 would perform, on average, equivalently to an otherwise similar student who received 80% in BC Chemistry 12.
Lastly for aggregate performance, in order to look into which combinations of factors when all viewed together might be most useful, we utilized Bayesian model averaging (BMA, as discussed above, Raftery et al., 1997) to attempt to look at which indicators of secondary coursework may be useful in predicting first-year grade point average. The BMA model-ling tested 169 models, of which 100% of the best models selected admission average and gender, as well as several of the faculty of study indicators and several indicators of students taking the non-AP courses. Of the AP indicators, “Has AP Courses?” was selected by 3.7% of the best models while “Number of AP Courses” was not selected by any of the best models. AP Calculus AB 12 was selected by 22.5% of the best models, AP Chemistry 12 by 11.0%, while AP Environmental Studies 12 was selected by 1.9%. The best models created had R2s of 0.447, suggesting that with the right combination of factors we can see an improvement of 1.4 percentage points in modelling first-year sessional average.

64 BCCAT Understanding Advanced Placement Grading in BC
For course and subject area performance, we created a base OLS model and then models that tested the “Has AP Courses?,” “Number of AP Courses,” and individual AP course indicators. We limited the models to cases where courses or subjects had 50 enrolments within the dataset and at least 10 of those enrolments were by a student that had an AP course on their record; in cases where we were testing an individual course indicator (for example, “Took AP Calculus AB 12?”) we limited to cases where 10 students had that particular AP course on their secondary tran-script; this totaled 50 subject areas.
The “Has AP Courses?” indicator shows significance for 3 (6%) subjects, at the p ≤ 0.005 level for ANTH (Anthropol-ogy) and HSTR (History) courses, and at the p ≤ 0.01 level for ES (Environmental Studies). Overall improvements in R2 range from 0.009 (HSTR) to 0.020 (ES). The “Number of AP Courses” indicator shows significance for 5 subjects (10%) at the p ≤ 0.005 level for ANTH, BIOL (Biology), COM (Commerce), and HSTR courses, and at the p ≤ 0.01 level for ES; differences in R2 are similar to the “Has AP Courses?” indicator. In general, there is some small degree of usefulness in predicting performance in some subjects with AP indicators, but the specific indicator varies.
For the AP course taken indicators, only AP Calculus AB 12 showed any statistical significance in OLS models, with significance at the p ≤ 0.001 level for CHEM (Chemistry) and MATH (Mathematics) out of 29 subjects tested (7%). R2 improvements were 0.006 (CHEM) and 0.003 (MATH).
For specific course-level performance, we see significant overlap with subject-level performance. “Has AP Courses?” is statistically significant at the p ≤ 0.001 level for MATH 100 (Calculus I) and WRIT 100 (Introduction to Writing), at the p ≤ 0.005 level for ECE 216 (Electricity and Magnetism) and HSTR 115 (The Second World War), and at the p ≤ 0.01 level for ES 200 (Introduction to Environmental Studies); these 5 courses total 4% of the 132 courses tested. “Number of AP Courses” is significant for 4 of 132 courses tested (2%) at the p ≤ 0.001 level for MATH 100, at the p ≤ 0.005 level for COM 100 (Introduction to Business Decision Making), and at the p ≤ 0.01 level for HSTR 115 and PHYS 110 (Introduc-tory Physics I). Of the AP course indicators, AP Calculus AB 12 is again the only statistically significant indicator, for 4 of 61 courses tested (7%): at the p ≤ 0.001 level for MATH 100 and MATH 102 (Calculus for Students in the Social and Biological Sciences), and at the p ≤ 0.005 level for CHEM 101 (Properties of Materials) and ECE 216.
As with aggregate performance, also tested a model that looked at individual grade 12 courses and their predictive ability for at the subject and course level. The model was run only for BC grade 12 courses that had an AP analogue and where we had at least 50 students who took both the grade 12 course and either the course or subject at UBC with a minimum of 10 of those 50 having taken the AP analogue in grade 12. The dependent variable was an un-weighted grade point average in the course or subject, with the independent variables the grade 12 course grade, national status, gender, and faculty of study; models were run both with and without the AP indicator.
Of 67 subjects tested with the model across all grade 12 courses, the AP indicator was significant in a total of 5 (7%): 4 subjects at the p < 0.001 level – subjects include BIOL, CHEM, MATH, and PHYS – and in SOCI (Sociology) at the p < 0.005 level. Improvements in R2 for these 5 subjects ranged from 0.002 for BIOL and MATH to 0.010 for SOCI, with 4 of the 5 ratios falling between 4.6 and 5.1; SOCI was the outlier at 12.8.
When looking at models for individual grade 12 courses, the AP indicator is significant in 7 of 105 (7%) grade 12 course/UVic subject pairs. For Biology 12 the AP indicator is significant in BIOL at the p < 0.010 level, with an R2 improvement from 0.310 to 0.316 and a ratio of 7.0. For Calculus 12 the AP indicator is significant in CHEM at the p < 0.005 level, with an R2 improvement from 0.252 to 0.265 and a ratio of 7.0. For Chemistry 12 the AP indicator is significant in 4 subjects, 1 at the p < 0.001 level (PHYS), 2 at the p < 0.005 level (CHEM and MATH) and BIOL at the p

BCCAT 65Understanding Advanced Placement Grading in BC
< 0.010 level; R2 improvements are between 0.005 and 0.019, and 3 of 4 ratios are between 5.6 and 7.0 with PHYS an outlier at 9.0. For Physics 12 the AP indicator is significant in PHYS at the p < 0.010 level , with an R2 improvement from 0.326 to 0.333 and a ratio of 5.7.
At the course level, there are 7 courses out of 88 tested courses (8%) where the AP indicator is significant in the all-grade-12 courses model. At the p < 0.001 level the courses are CHEM 101, MATH 100, PHYS 102 (General Physics) and PHYS 110, BIOL 184 (Evolution and Biodiversity) at the p < 0.005 level, and BIOL 186 (Physiology and Cell Biology) and GMST 101 Beginning German I) at the p < 0.010 level. R2 improvements are between 0.002 and 0.023, while 6 of 7 ratios are between 3.6 and 7.6 with GMST 101 an outlier at 22.0. Note that GMST 101 has a much smaller number of cases on which to generate a model than the other subject areas.
For grade 12 course/UVic course pairs, there are 13 cases out of 142 tested (9%) where the AP indicator is significant. For Biology 12 the AP indicator is significant in BIOL 184 with an R2 improvement from 0.295 to 0.307 with a ratio of 7.9. For Calculus 12 the AP indicator is significant in 3 courses at the p < 0.005 level – CHEM 101, MATH 100, and PHYS 110; R2 improvements are between 0.009 and 0.016 with ratios between 4.4 and 8.1. For Chemistry 12 the AP indicator is significant in 2 courses at the p < 0.001 level – MATH 100 and PHYS 110 – with 3 more courses at the p < 0.005 level – BIOL 184, CHEM 101, and PHYS 102 – and PHYS 111 (Introductory Physics II) at the p < 0.010 level; R2 improvements are between 0.010 and 0.033 with ratios between 6.8 and 11.8. For Physics 12 the AP indicator is significant for MATH 100 at the p < 0.005 level with an R2 improvement from 0.310 to 0.308 and a ratio of 7.1.
There are two outliers in the course pair models, where the coefficient on the AP indicator is negative indicating that students in the BC analogue of the course perform better on average. One case is Economics 12 with ECON 104 (Prin-ciples of Macroeconomics) with a significance of p < 0.010, an R2 improvements from 0.440 to 0.486, and a ratio of -17.7, suggesting a BC Economics 12 student with a grade of 98% would perform on par with an otherwise similar stu-dent who took AP Macroeconomics 12 or AP Microeconomics 12 with a grade of 80%. Finally, in English 12 the model finds significance for the AP indicator when paired with EPHE 142 (Personal Health, Wellness and Potential) at the p < 0.010 level, with an R2 improvement from 0.350 to 0.368 and a ratio of -11.6. In both these cases, as with GMST 101, there are fairly small numbers of AP students with which to generate a model and so care should be exercised reading too much into the results.

Your guide through post-secondary education.