Embed Size (px)
Citation preview
East Tennessee State University East Tennessee State University
Digital Commons @ East Tennessee Digital Commons @ East Tennessee
State University State University
Electronic Theses and Dissertations Student Works
12-2020
Undergraduate Nursing Students’ Learning Style Preferences and Undergraduate Nursing Students’ Learning Style Preferences and
Preferred Faculty Teaching Methods Compared to the Actual Preferred Faculty Teaching Methods Compared to the Actual
Methods Used by Faculty Methods Used by Faculty
Linda Simpson East Tennessee State University
Follow this and additional works at: https://dc.etsu.edu/etd
Part of the Nursing Commons
Recommended Citation Recommended Citation Simpson, Linda, "Undergraduate Nursing Students’ Learning Style Preferences and Preferred Faculty Teaching Methods Compared to the Actual Methods Used by Faculty" (2020). Electronic Theses and Dissertations. Paper 3833. https://dc.etsu.edu/etd/3833
This Dissertation - unrestricted is brought to you for free and open access by the Student Works at Digital Commons @ East Tennessee State University. It has been accepted for inclusion in Electronic Theses and Dissertations by an authorized administrator of Digital Commons @ East Tennessee State University. For more information, please contact [email protected].
Undergraduate Nursing Students’ Learning Style Preferences and Preferred Faculty Teaching
Methods Compared to the Actual Methods Used by Faculty
________________________
A dissertation
presented to
the faculty of the Department of Nursing
East Tennessee State University
In partial fulfillment
of the requirements for the degree
Doctor of Philosophy in Nursing
______________________
by
L. Cathy Simpson
December 2020
_____________________
Lisa Haddad, PhD, Chair
Myra Carew, PhD
Sharon Loury, PhD
James Payne, PhD
Keywords: generation, nursing student, teaching preference, learning style, teaching method
2
ABSTRACT
Undergraduate Nursing Students’ Learning Style Preferences and Preferred Faculty Teaching
Methods Compared to the Actual Methods Used by Faculty
by
Cathy Simpson, MSN, RN
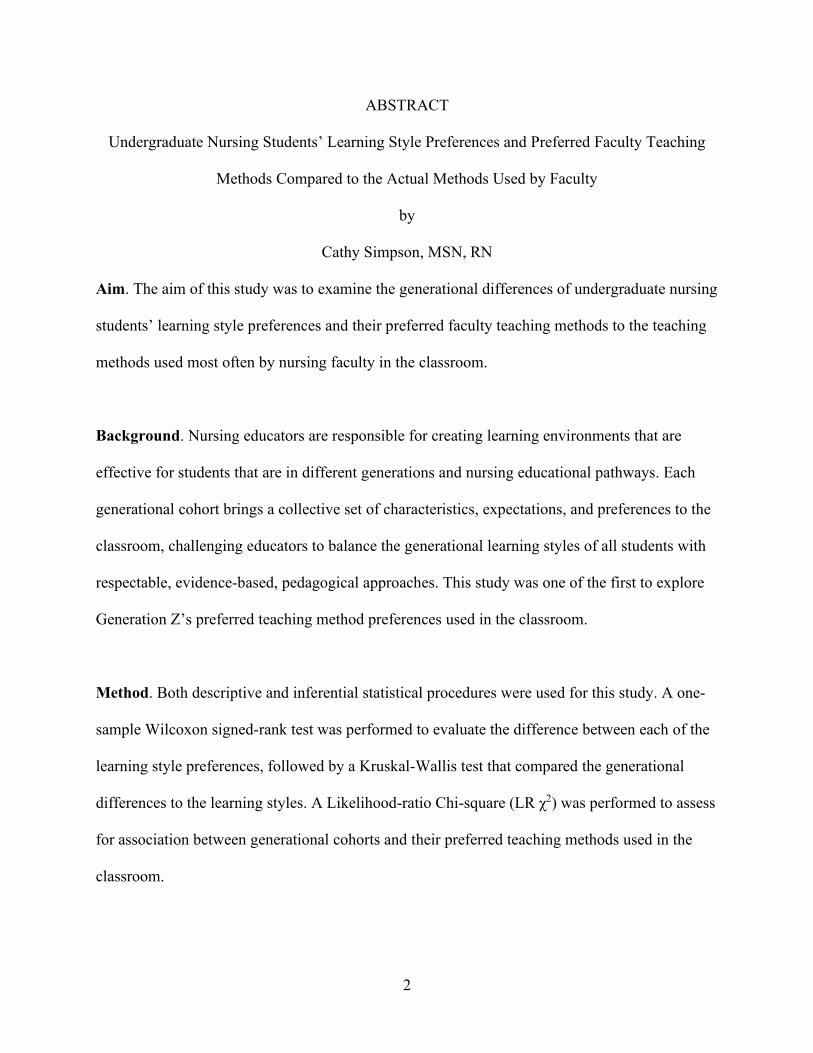
Aim. The aim of this study was to examine the generational differences of undergraduate nursing
students’ learning style preferences and their preferred faculty teaching methods to the teaching
methods used most often by nursing faculty in the classroom.
Background. Nursing educators are responsible for creating learning environments that are
effective for students that are in different generations and nursing educational pathways. Each
generational cohort brings a collective set of characteristics, expectations, and preferences to the
classroom, challenging educators to balance the generational learning styles of all students with
respectable, evidence-based, pedagogical approaches. This study was one of the first to explore
Generation Z’s preferred teaching method preferences used in the classroom.
Method. Both descriptive and inferential statistical procedures were used for this study. A one-
sample Wilcoxon signed-rank test was performed to evaluate the difference between each of the
learning style preferences, followed by a Kruskal-Wallis test that compared the generational
differences to the learning styles. A Likelihood-ratio Chi-square (LR χ2) was performed to assess
for association between generational cohorts and their preferred teaching methods used in the
classroom.
3
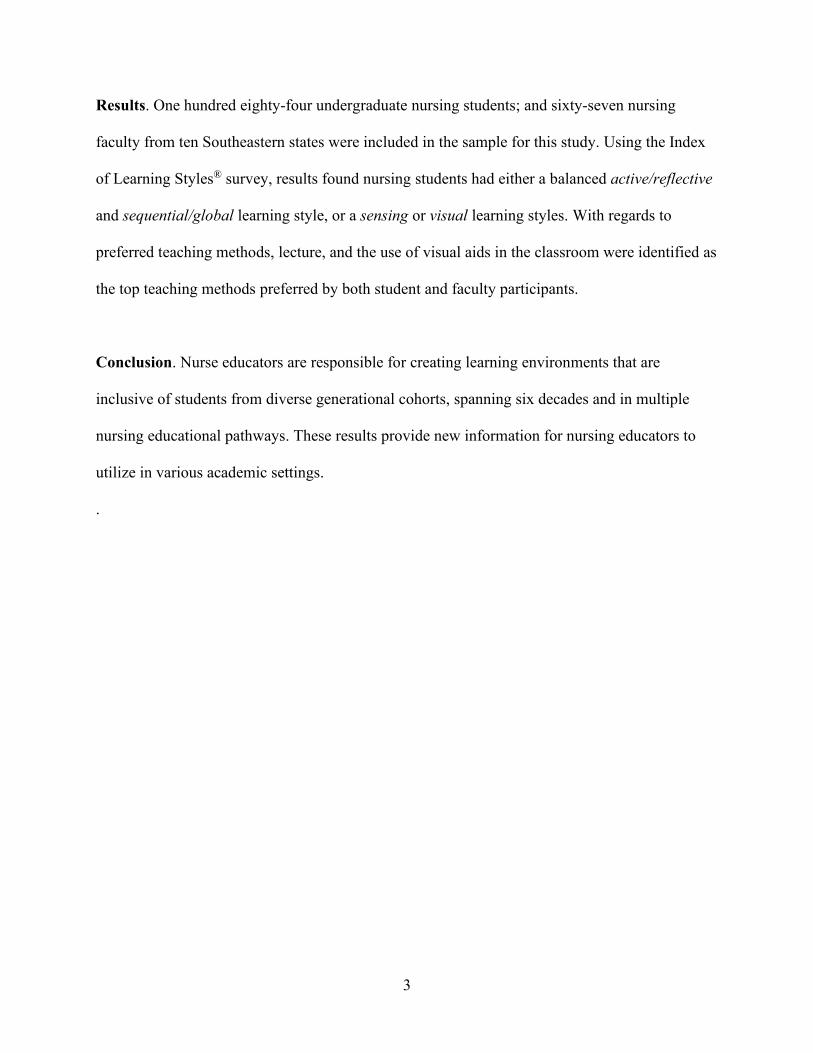
Results. One hundred eighty-four undergraduate nursing students; and sixty-seven nursing
faculty from ten Southeastern states were included in the sample for this study. Using the Index
of Learning Styles® survey, results found nursing students had either a balanced active/reflective
and sequential/global learning style, or a sensing or visual learning styles. With regards to
preferred teaching methods, lecture, and the use of visual aids in the classroom were identified as
the top teaching methods preferred by both student and faculty participants.
Conclusion. Nurse educators are responsible for creating learning environments that are
inclusive of students from diverse generational cohorts, spanning six decades and in multiple
nursing educational pathways. These results provide new information for nursing educators to
utilize in various academic settings.
.

4
Copyright 2020 by Cathy Simpson, MSN, RN
All Rights Reserved
5
DEDICATION
I dedicate the accomplishment of this dissertation to my Lord and Savior, Jesus Christ.
Undoubtedly, God’s presence in my life was the sustaining force that allowed me to accomplish
a task so dauntingly difficult. The completion of this dissertation is for His glory, not mine. To
my parents, Jim and Ruth Simpson, who taught me the value of education and that any goal is
achievable. Although you are not here to tell me in person, I know that you are proud of my
accomplishments and are looking down from above with joy in your hearts. I look forward to our
celebratory reunion one day in Heaven.
To my family and friends for understanding when I said numerous times that I could not
be there. Your love, encouragement, and unswerving support will be forever treasured. I could
not have completed this journey without all of you!
To my sweet, adopted parents in Tennessee, Don and Nan Gordon, who have believed in
me and cheered me on from day one. I love you both! To Dr. DeAnne Messias for the inspiration
to continue my educational trajectory and for our unwavering friendship.
To my dearest friends Edwina Roller, Liz Watson, Kathryn Hill, Cheri Dawson,
Elizabeth White, Gary Winton, Dr. Phyllis Adams, and Dr. Cheryl Hyland, I am forever grateful
for your unconditional love and friendship. Your enduring words of encouragement and support
helped bring this project to fruition. I love you all more than you will ever know.
To my colleagues and friends at Calhoun Community College, thank you for your
continuous support, encouragement, and friendship. You were my cheerleaders at the finish line
that pushed me until the very end.
To Dr. Cheryl Smith, and Dr. Deborah Henry, WE DID IT!
6
ACKNOWLEDGEMENTS
I would like to express my deep admiration and gratitude to my dissertation committee
members for your patience, guidance, and expertise that you afforded me throughout this
journey. Because of you, I have not only grown as a student but also have been inspired by the
high expectations of academic excellence and lifelong learning that you have demonstrated
throughout this process. To my chair, Dr. Lisa Haddad, thank you for your profound belief in my
abilities and your gentle, repetitive nudges that kept me moving forward each time- even when I
was ready to quit. Without them, I would not have completed this daunting task. To Dr. Sharon
Loury, your words of wisdom, support, and passion for research have been my source of
inspiration throughout my doctoral journey. To Dr. Myra Carew, thank you for stepping in and
providing constructive, substantial feedback within a nurturing environment. To Dr. James
Payne, thank you for your expertise, patience, and for reminding me to “relax” so I could focus
on one statistical test at a time, which helped me further expand my knowledge about statistics!
7
TABLE OF CONTENTS
ABSTRACT .................................................................................................................................... 2
DEDICATION ................................................................................................................................ 5
ACKNOWLEDGEMENTS ............................................................................................................ 6
LIST OF TABLES ........................................................................................................................ 13
LIST OF FIGURES ...................................................................................................................... 15
Chapter 1. Introduction ................................................................................................................. 16
Background ............................................................................................................................... 18
Generational Cohorts ............................................................................................................ 18
Educational Pathways ........................................................................................................... 20
Ways of Knowing ................................................................................................................. 21
Statement of the Problem .......................................................................................................... 23
Purpose of the Study ................................................................................................................. 24
Specific Aims and Hypotheses .................................................................................................. 24
Theoretical Framework ............................................................................................................. 26
Conceptual Definition of Terms ................................................................................................ 28
Operational Definition of Terms ............................................................................................... 29
Assumptions .............................................................................................................................. 30
Limitations ................................................................................................................................ 31

8
Delimitations ............................................................................................................................. 32
Significance of the Study to Nursing ........................................................................................ 32
Summary ................................................................................................................................... 32
Chapter 2. Literature Review ........................................................................................................ 34
Method ...................................................................................................................................... 34
Generational Cohorts................................................................................................................. 34
Traditional Educational Pathways for Registered Nurses ......................................................... 37
Diploma................................................................................................................................. 37
Associate Degree Nursing..................................................................................................... 37
Bachelor of Science in Nursing ............................................................................................ 38
Learning Style Theories ............................................................................................................ 38
Kolb’s Experiential Learning Style ...................................................................................... 39
Dunn and Dunn’s Learning Style Model .............................................................................. 41
Myers-Briggs Type Indicator® (MBTI®) .............................................................................. 41
Felder and Solomon’s Index of Learning Styles................................................................... 42
Nursing Students Learning Style Preferences ........................................................................... 43
Generational Differences in Learning Style .............................................................................. 47
Nursing Students Preferred Teaching Methods ........................................................................ 48
Faculty Teaching Methods ........................................................................................................ 51
Gaps in Literature ...................................................................................................................... 52

9
Summary ................................................................................................................................... 53
Chapter 3. Methods ....................................................................................................................... 55
Research Design ........................................................................................................................ 55
Population.................................................................................................................................. 56
Setting........................................................................................................................................ 56
Sample ....................................................................................................................................... 56
Instrumentation.......................................................................................................................... 57
Learning Style Preference ..................................................................................................... 58
Learning Style Survey....................................................................................................... 58
Reliability and Validity. ................................................................................................ 60
Preferred Teaching Methods ................................................................................................. 61
Student Survey .................................................................................................................. 62
Reliability and Validity ................................................................................................. 62
Faculty Survey. ................................................................................................................. 63
Reliability and Validity. ................................................................................................ 63
Protection of Human Subjects ................................................................................................... 64
Procedure ................................................................................................................................... 65
Data Analysis Plan .................................................................................................................... 66
Summary ................................................................................................................................... 66
Chapter 4. Results ......................................................................................................................... 68

10
Student Demographics .............................................................................................................. 68
Students’ Generational Cohort .............................................................................................. 69
Students’ Gender ................................................................................................................... 70
Students’ Race/Ethnicity ....................................................................................................... 70
Students’ Nursing Program Location.................................................................................... 71
Students’ Type of Nursing Program ..................................................................................... 71
Students’ Other Degrees ....................................................................................................... 72
Faculty Demographics............................................................................................................... 73
Faculty Generational Cohorts ............................................................................................... 73
Faculty Gender ...................................................................................................................... 74
Faculty Race/Ethnicity .......................................................................................................... 74
Faculty Nursing Program Location ....................................................................................... 75
Faculty Type of Nursing Program ........................................................................................ 75
Faculty Highest Degree Earned ............................................................................................ 76
Faculty Years Taught ............................................................................................................ 77
Specific Aim I ........................................................................................................................... 78
Specific Aim II .......................................................................................................................... 83
Student Survey Part 1............................................................................................................ 84
Student Survey Results for Questions 1-23 ...................................................................... 84
Student Survey Results for Questions 24-30 .................................................................... 88
11
Student Survey Part 2............................................................................................................ 90
Teaching Methods Most Preferred by Students ................................................................ 90
Teaching Methods Least Preferred by Students ............................................................... 91
Walker’s Teaching Methods Student Survey Results ............................................................... 92
Specific Aim III ......................................................................................................................... 95
Faculty Survey Part 1 ............................................................................................................ 96
Faculty Survey Results for Questions 1-23 ...................................................................... 96
Faculty Survey Results for Questions 24-30 .................................................................... 99
Faculty Survey Part 2 .......................................................................................................... 100
Teaching Methods Most Used by Faculty ...................................................................... 100
Teaching Methods Least Used by Faculty ...................................................................... 101
Specific Aim IV ...................................................................................................................... 102
Chapter 5. Discussion ................................................................................................................. 113
Summary of Results ................................................................................................................ 113
Specific Aim I ......................................................................................................................... 114
Specific Aim II ........................................................................................................................ 116
Specific Aim III ....................................................................................................................... 120
Specific Aim IV ...................................................................................................................... 121
Limitations of the Study .......................................................................................................... 125
Implications for Nursing Education ........................................................................................ 126
12
Recommendations for Future Research .................................................................................. 127
Summary ................................................................................................................................. 127
References ................................................................................................................................... 128
APPENDICES ............................................................................................................................ 145
Appendix A: Felder’s Learning Style Inventory ..................................................................... 145
Appendix B: Walker/Delahoyde Teaching Methods Survey .................................................. 148
Appendix C: Walker’s Teaching Methods Survey ................................................................. 152
Appendix D: Delahoyde Teaching Methods Faculty Survey.................................................. 156
Appendix E: Demographic Data ............................................................................................. 160
Appendix F: Permission to Use Index of Learning Study ...................................................... 161
Appendix G: Permission to Use WDTMS and DTMS ........................................................... 162
Appendix H: Permission to Use WTMS ................................................................................. 163
Appendix I: Sample Recruitment Letter ................................................................................. 164
Appendix J: Recruitment Letter for Participants..................................................................... 165
VITA ........................................................................................................................................... 166

13
LIST OF TABLES
Table 1. Students Enrolled in Nursing Educational Pathways ..................................................... 21
Table 2. Generational Cohorts Defined ........................................................................................ 35
Table 3. Index of Learning Styles Distribution of Questions ....................................................... 58
Table 4. Cronbach Alpha Coefficients.......................................................................................... 60
Table 5. Students Learning Style Preference ................................................................................ 79
Table 6. Generational Learning Style Preference ......................................................................... 80
Table 7. Active-Reflective Learning Style ................................................................................... 81
Table 8. Sensing-Intuitive Learning Style .................................................................................... 81
Table 9. Visual-Verbal Learning Style ......................................................................................... 82
Table 10. Sequential-Global Learning Style ................................................................................. 83
Table 11. Student Survey Results Questions 1-23 ........................................................................ 85
Table 12. Students' Preferred Teaching Methods (Q1-23) ........................................................... 87
Table 13. Gen XY’s Preferred Teaching Methods (Q1-23) ......................................................... 87
Table 14. Gen Z's Preferred Teaching Methods (Q1-23) ............................................................. 87
Table 15. Classroom Environment Student Questions 24-30 ....................................................... 88
Table 16. Teaching Methods Most Preferred by Students ............................................................ 90
Table 17. Teaching Methods Least Preferred by Students ........................................................... 91
Table 18. Results of Walker Teaching Method Survey ................................................................ 93
Table 19. Faculty Survey Results Questions 1-23 ........................................................................ 97
Table 20. Classroom Environment Faculty Questions 24-30 ....................................................... 99
Table 20. Teaching Methods Most Used by Faculty .................................................................. 101
Table 22. Teaching Methods Least Used by Faculty .................................................................. 102

14
Table 23. Generational Difference of Learning Styles ............................................................... 104
Table 24. Correlation between Learning Style and Teaching Methods ...................................... 104
Table 25. Student’s Top Five Teaching Methods ....................................................................... 108
Table 26. Faculty’s Top Five Teaching Methods ....................................................................... 108
Table 27. Rank of all 12 Teaching Methods ............................................................................... 109
Table 28. Teaching Methods Ranked by Entire Sample............................................................. 110
Table 29. Teaching Methods Compared by Generation ............................................................. 111
15
LIST OF FIGURES
Figure 1. Felder & Solomon Index of Learning Style® Scale....................................................... 60
Figure 2. Student Generations ....................................................................................................... 69
Figure 3. Nursing Programs of Students ....................................................................................... 72
Figure 4. Faculty Generations ....................................................................................................... 74
Figure 5. Nursing Programs of Faculty......................................................................................... 75
Figure 6. Highest Degree Earned for Faculty ............................................................................... 76
16
Chapter 1. Introduction
“One generation passes away, and another generation comes...”
(Ecclesiastes 1:4 New King James Version)
Today’s nurse educators are responsible for creating learning environments that are
inclusive of students from four, diverse generational cohorts, spanning six decades who are
enrolled in multiple nursing educational pathways, including three traditional programs:
Diploma, Associate Degree in Nursing (ADN), and Bachelor of Science in Nursing (BSN).
Generation Z (born between 1995 and 2010), currently represents the largest population in the
United States (U.S.), and has joined the Baby Boomers (born between 1946 and 1964),
Generation X (born between 1965 and 1979), and Generation Y (born between 1980 and 1994)
in the college classroom (Statista, 2019). Additionally, Generation Y represents the largest
population of nursing students in the classroom (47%), followed by Generation Z (34%), and a
combination of Baby Boomers and Generation X who make up the remaining 19% (National
League for Nursing, n.d.-b).
Although Generation Z (Gen Z) represents the second largest population of nursing
students in the classroom, research including Gen Z is just beginning to appear in the literature.
Some research has been written about the generational differences in the nursing workforce;
however, due to the dearth amount of research in the literature, little is known about Gen Z in the
workforce or in the nursing classroom. A brief review of the literature from 2013 to 2019, using
keywords Generation Z and nursing students, yielded a mere eight articles. As Gen Z continues
to enter college and the nursing workforce, additional information about this generation will
evolve (Williams, 2018). Whereas, some characteristics of Gen Z have emerged, additional
17
literature and evidenced-based data are needed to validate any individual differences, specifically
identifying their preferred learning styles and teaching method preferences.
Learning is a process that engages students in a manner that best enhances their individual
learning styles (DiBartola, 2006; Kolb & Kolb, 2005). In nursing, the academic rigor of the
courses requires students to apply, synthesize, and evaluate all information and interventions.
The challenge is for nurse educators to create learning environments that support critical thinking
through skills and strategies utilizing all types of learning styles (Dibartola, 2006; Marek, 2013).
Additionally, educators need to know how to validate connections between learning styles and
preferred teaching methods. Each generational cohort brings a collective set of characteristics,
expectations, and preferences to the classroom, challenging educators to balance the generational
learning styles of all students with respectable pedagogical approaches (Johnson & Romanello,
2005; Robb, 2013).
Effective learning is achieved by using creative teaching strategies designed to include
the learning characteristics of each generational cohort in the classroom. For this reason, nurse
educators need evidence-based data to support modifications in curricular design, including
teaching methods that will not only enhance student learning and academic performance, but will
also promote student success and achievement. Similarly, the nurse educators’ desire for students
to be engaged, enthused, and motivated requires a stronger focus on student-centered learning
(Stanley & Dougherty, 2010). This chapter will include background information, a statement of
the problem, the purpose of the study, the theoretical framework, hypotheses, conceptual and
operational definitions. Finally, the chapter concludes by noting the limitations, delineations,
assumptions, and significance of the study.
18
Background
In 2010, the Carnegie Foundation for the Advancement of Teaching and the Institute of
Medicine (IOM), released reports calling for nursing education reform and the transformation of
the nursing profession (Benner et al., 2010; Institute of Medicine, 2011). The Carnegie report,
Educating Nurses: A Call for Radical Transformation, was the first national nursing education
study in over 30 years. This report explored the strengths and weaknesses in nursing education,
along with the challenges confronting the nursing profession. Likewise, the report also identified
the most effective practices for teaching nursing, avenues for the ease of educational pathways to
nursing licensure, as well as the revitalization of the nursing curriculum (Benner et al., 2010).
The IOM (2011) multidisciplinary study, The Future of Nursing: Leading Change,
Advancing Health, examined the nursing workforce, suggesting evidenced-based
recommendations to meet the U.S. patient population’s diverse health care needs across the
lifespan. This report was designed to serve as a blueprint for changes in the nursing profession
and in America’s complete health care system. Overall, the IOM study and the Carnegie report
called for considerable changes in nursing education which included lifelong learning, seamless
transitions to higher degree programs, a diverse workforce, as well as educational opportunities
for interprofessional education and practice (Institute of Medicine, 2011). When creating and
selecting effective teaching methods which “engage, stimulate, and promote transference and
assimilation of new knowledge,” it is essential for nurse educators to have a clear understanding
of the historical aspects of nursing education (Gallo, 2011, p. 195; Parker & Schoenhofer, 2008).
Generational Cohorts
Today, generational cohorts are defined as a group of individuals born within a time span
with upper limits of 15 years, whose life stages are shaped by the events, trends, and
19
developments occurring during that time span (McCrindle, 2014; Nisen, 2013). Individuals
within a generational cohort offer differing views regarding their desires, dreams, values, and
expectations about work and life.
Baby Boomers, individuals born between 1946 and 1964, are characteristically regarded
as being optimistic, productive, and collaborative. Firmly believing that respect is a quality that
is earned, they are well- educated, exhibiting both clinical and organizational skills. Boomers,
often referred to as workaholics, are loyal employees who identify self-worth when rewarded
with promotions or monetary compensations in their jobs (Cook, 2016; Lancaster & Stillman,
2002; McCrindle, 2006; Seemiller & Grace, 2016; Shatto & Erwin, 2016; Smith-Trudeau, 2016).
Generation X (Gen X), individuals born between 1965 and 1979, are identified as being
independent, family-focused, socially responsible, informal, innovative, and creative
(McCrindle, 2006; Smith-Trudeau, 2016). In addition, Gen X excels at multi-tasking, are hard-
working, yet skeptical individuals viewing time as their most precious commodity; they demand
work-life balance, flexible schedules, and value external recognition by monetary compensation
or awards (Cook, 2016; Lancaster & Stillman, 2002). With regards to relationships with
authority, this generation prefers an informal “first name basis” approach to their supervisors
(Cook, 2016).
Generation Y (Gen Y), individuals born between 1980 and 1994, often referred to as
Millennials, are represented as being confident, entitled, highly social, techno-savvy, and socially
responsible. Like Gen X, Gen Y insist on having work-life balance (Lancaster & Stillman, 2002;
McCrindle, 2006; Miers et al., 2007; McCrindle, 2006; Smith-Trudeau, 2016). Regarding their
work hours, Gen Y desires flexibility in their employment, with the ability to work from home
20
using online and hybrid-approaches. Although this generation has respect for authority, they
question why it should be “unconditional and automatic” (Cook, 2016).
Generation Z (Gen Z) consists of individuals born between 1995 and 2010. Having been
exposed to a lifelong immersion of technology, such as the internet, instant messaging, texting,
smartphones, and tablets has shaped Gen Z into the most technologically savvy of all
generations. Likewise, this has prompted the acquisition of additional names including iGen,
Net Gen, or digital natives (Clark, 2017; Cross-Bystrum, 2015; Horovitz, 2012; Loehr, 2017;
McCrindle, 2006; Twenge, 2017; Wiedmer, 2015). In addition, the constant saturation of media
has influenced their inclination to reach for some type of smart device “every seven seconds,”
spending an average of nine or more hours a day on these devices (Cook, 2016). Gen Z’s
constant media exposure has had a negative impact on their attention span levels, decreasing its
length to eight-seconds, which is four seconds less than that of Gen Y. The aspects which Gen Z
lacks in the areas of attention span and critical thinking skills, though, they make up for as risk
takers and entrepreneurs (Kaiser Family Foundation, 2010; Pew Research Center, 2014).
Educational Pathways
Registered nursing students can choose from three, traditional educational pathways to
obtain their registered nursing (RN) degree. The Diploma, Associate Degree Nursing (ADN),
and Bachelor of Science in Nursing (BSN) programs all prepare students to provide
comprehensive patient care to diverse patient populations (Anderson, 1981; Bureau of Labor
Statistics, 2018; LaRocco, 2010). According to the National League of Nurses (NLN), Biennial
Survey of Schools of Nursing Academic Year 2017-2018, forty-four percent of the responding
NLN member schools offered BSN or higher degrees and 56% offered Diploma, ADN, or
vocational nursing degrees (National League for Nursing, n.d.-b).

21
The percentage of students by generation in each traditional RN pathways in 2018 is
illustrated in Table 1. Forty-seven percent of Gen Z nursing students were enrolled in a diploma
program, followed by 45% of Gen Y, and approximately 8% of Baby Boomers and Gen X
combined. Thirty-eight percent of Gen Z nursing students were enrolled in an ADN program,
followed by 45% of Gen Y, and 11% of Baby Boomers and Gen X combined. In the BSN
program, 77% of Gen Z nursing students were enrolled, followed by 20% of Gen Y, and only 3%
of Baby Boomers and Gen X combined (National League for Nursing, n.d.-b).
Table 1
Students Enrolled in Nursing Educational Pathways
Generational Cohorts Nursing Programs
Diploma ADN BSN
Baby Boomers/Gen X ~8% 11% 3%
Gen Y 45% 51% 20%
Gen Z 47% 38% 77%
Ways of Knowing
In education today, there has been a paradigm shift from a focus on teacher-centered
learning to student-centered learning. This curricula change places a greater emphasis on
educators to implementing learning activities based on students’ preferred learning styles, rather
than their own preferred teaching method (D’Amore et al., 2012). One of the National League
for Nursing’s (2013) core competencies recommends that educators identify learning styles in
nursing students in order to tailor teaching strategies to correlate with the learning style
preferences of the students, empowering them to increase their acquisition of knowledge and
skills essential in professional nursing (Madu et al., 2019). Molsbee (2011) identified limited and
inconsistency in the literature associated with dominant learning styles of nursing students. This
22
study confirmed Molsbee’s (2011) results, identifying minimal research exploring nursing
students’ learning styles and preferred teaching methods.
Nurse educators’ understanding of the “multiple ways of knowing” is essential in nursing
education and practice as they strive to incorporate innovative teaching methods that will not
only engage the student, but also will transfer the knowledge which is critical for preparing
competent healthcare providers (Cannon & Boswell, 2012, p. 3; Parker & Schoenhofer, 2008, p.
8). Although, there are several “ways of knowing” recognized with relevance to nursing
education, it was Carper’s (1978) seminal work that identified the four patterns of knowing
which have served as the foundation for developing nursing knowledge essential for teaching,
learning, and the practice of nursing (Henry, 2018; Zander, 2007). “The four [fundamental]
patterns [of knowing] are distinguished according to logical type of meaning and designated as
(1) empirics, the science of nursing; (2) esthetics, the art of nursing; (3) the component of a
personal knowledge in nursing; and (4) ethics, the component of moral knowledge in nursing”
(Carper, 1978, p. 22). For understanding the complexity and diversity of nursing knowledge,
comprehension of the four “separate but interrelated and interdependent patterns of knowing,” is
critical for both the nurse educators and nursing (Carper, 1978, p. 22).
The Competencies for Nursing Education, created by the NLN, align education and
practice, promoting the role of the nurse educators, while providing standards for nursing
graduates from all types of nursing programs (National League for Nursing, 2013). Knowing and
using a variety of teaching methods to engage and facilitate learning in students from four
generations is complex and multifaceted. The NLN’s eight core competencies: Facilitate
Learning; Facilitate Learner Development and Socialization; Use Assessment and Evaluation
Strategies; Participate in Curriculum Design and Evaluation of Program Outcomes; Function as
23
a Change Agent and Leader; Pursue Continuous Quality Improvements in the Nurse Educator
Role; Engage in Scholarship; and Function Within the Educational Environment, provide nurse
educators a framework to develop curriculum that facilitates positive teaching and learning
environments for the next generation of new nurses and their professional roles. According to the
World Health Organization [WHO] (2016), these core competencies are the minimum
competencies that a qualified nurse educator should possess (p. 11). When all eight core
competencies are implemented, nurse educators are equipped with innovative resources that help
shape and transform their nursing faculty roles (Halstead, 2007).
Teaching Gen Z students will challenge nursing instructors to adopt and incorporate new
teaching methods, including project-based, active-learning opportunities that accommodate their
collaborative nature. Consequently, the nurse educators’ focus on creating dynamic learning
environments will prompt nursing students to become more effective learners (Renfro, 2012;
Shatto & Erwin, 2017; Wiedmer, 2015).
Statement of the Problem
The NLN, the Carnegie Foundation for the Advancement of Teaching, and the IOM have
called for the transformation of the nursing profession and nursing education reform (Benner et
al., 2010; Institute of Medicine, 2011; National League for Nursing, 2003; National League for
Nursing, 2005). This educational reform challenges nurse educators to create learning
environments that are inclusive and representative of each generational cohort with respect to
their individual learning styles and preferred teaching methods; while at the same time,
incorporating innovative changes to pedagogical approaches and retaining the academic rigor of
the nursing program (Gallo, 2011; Mangold, 2007).
24
Multi-generational nursing classrooms across the U.S. are composed of four generational
cohorts, enrolled in traditional registered nursing educational pathways, each having diverse
characteristics that impact the dynamics of education. Few studies examine generational
differences of nursing students and their preferred teaching methods, and none of the studies
include Gen Z. The lack of empirical evidence has impeded the call for nursing education
reform.
Purpose of the Study
The purpose of this study was to compare undergraduate nursing students' differences in
learning preferences and the students' preferred teaching methods used in the classroom to the
actual methods used by faculty. In addition, the goal of this study was to increase knowledge and
understanding of these concepts, as well as provide nurse educators with evidence-based data to
assist with making modifications in curricular design, teaching methods, and instructional
strategies.
Specific Aims and Hypotheses
The specific aims and hypotheses for the study were:
Specific Aim I: To compare the generational differences of undergraduate nursing
students’ learning style preferences.
H1. There are statistically significant differences in the learning style preferences of
undergraduate nursing students based on the generational cohort in which they belong.
H0. There are no statistically significant differences in the learning style preferences of
undergraduate nursing students based on the generational cohort in which they belong.
Specific Aim II: To compare the generational differences of undergraduate nursing
students’ preferred teaching methods used in the classroom.

25
H1. There are statistically significant differences in the preferred teaching methods used
in the classroom of undergraduate nursing students based on the generational cohort in
which they belong.
H0. There are no statistically significant differences in the preferred teaching methods
used in the classroom of undergraduate nursing students based on the generational cohort
in which they belong.
Specific Aim III: To compare the generational differences of teaching methods nursing
faculty use most frequently in undergraduate nursing programs.
H1. There are statistically significant differences in the teaching methods that nursing
faculty use most frequently in the classroom based on the generational cohort in which
they belong.
H0. There are no statistically significant differences in the teaching methods that nursing
faculty use most frequently in the classroom based on the generational cohort in which
they belong.
Specific Aim IV: To compare the generational differences of undergraduate nursing
students’ a) learning style preferences and preferred teaching methods, and b) students’
preferred faculty teaching methods to the actual teaching methods used by faculty.
H1. There are statistically significant differences in the a) learning style preferences and
preferred teaching methods, and b) students’ preferred faculty teaching methods to the
actual teaching methods used by faculty.
H0. There are no statistically significant differences in the a) learning style preferences
and preferred teaching methods, and b) students’ preferred faculty teaching methods to
the actual teaching methods used by faculty.
26
Theoretical Framework
The theoretical foundation for this study was based Malcolm Knowles’s Andragogical
Theory of Adult Learning (Knowles et al., 2015). Convinced that adults learned differently than
children, Knowles began his quest to develop a theory based on the concepts formulated from his
field of inquiry of andragogy. In 1968, Knowles first introduced andragogy to the U.S. in his
article, “Andragogy, Not Pedagogy” as a science and an art of adult learning, as opposed to
pedagogy that focused on children (Knowles, 1968; Knowles et al., 2015; Smith, 2002). Within
two years, Knowles’s seminal work produced a discrete and unified theory of adult learners
(Knowles, 1968, p. 2).
Based on a conceptual, humanistic approach framework, Knowles’s Adult Leaning
Theory (ALT), regards the practice of teaching and educating adults as one that enables
educators to facilitate learning through effective processes, which are specifically designed for
self-directed adults. Knowles’s ALT is based on the following six assumptions: the learners’
need to know; the learners’ self-concept; the role of the learners’ experiences; the learners’
readiness to learn; the learners’ orientation to learning; and the learners’ motivation to learn
(Knowles et al., 2015, p.43-47). The six assumptions of Knowles’s ALT focus on understanding
the ways adults learn, as well as applying the role the teacher has as a facilitator in student-
centered learning (Cosejo, 2012; Galbraith & Fouch, 2007; Knowles et al., 2015).
The first assumption of Knowles’s theory, the learners’ “need to know,” refers to
individuals developing a “need to know” rationale behind why they need to learn something as
they mature. The learning enhances when adults apply the information learned to real-life
experiences (Knowles, 1984). Additionally, Knowles’s et al. (2015) suggest that when adults
engage as ‘collaborative partners’ in learning experiences, their “need to know” appeals to their
27
self-concept as independent learners, making learning more effective. This assumption focuses
on the how, the what, and why of learning. Research related to the “need to know” premise
purports that adults need to know “how learning will be conducted, what learning will occur, and
why learning is important” (Knowles et al., 2015, p. 169).
The second assumption of Knowles’s theory, the “learners’ self-concept,” is that adults
mature and become responsible for their own decisions, moving from a dependent personality to
becoming autonomous and self-directed (Knowles, 1973). A primary goal for adult educators is
“to create learning experiences in which adults are helped to make the transition from dependent
to self-directed learners” (Knowles et al., 2015, p. 44). Examples of self-directed learning
experiences include internships, capstone projects, dissertations, and study groups.
The third assumption of Knowles’s theory is the “role of the learners’ experiences.”
Knowles (1973), recognized the significance that prior experiences play in shaping adult learning
through the diversity of the leaners’ “background, learning style, motivation, needs, interests,
and goals” (Knowles et al., 2015, p. 45). When individualizing teaching and learning strategies,
the vast sum of the learners’ prior experiences provides fertile resources for educators supporting
the inclusion of experiential teaching opportunities.
The fourth assumption in Knowles’s theory, “readiness to learn,” centers on the
assumption that adults are more interested in learning when the “need to know” has a direct
relevance to real-life situations, such as their jobs and their personal lives (Knowles, 1973). The
critical implication for this assumption, identified by Knowles et al. (2015), is to ensure that the
timing of the learning experiences coincides with the learners’ developmental phases.
The fifth assumption of Knowles’s theory, the learners’ “orientation to learning” is the
premise that as individuals mature, their focus on learning shifts from what they might need to
28
know in the future to what they need to know for their immediate life situations. For adults, this
immediacy of learning creates a “problem-centered” approach to learning (Knowles, 1973;
Knowles, 1980; Knowles et al., 2015; Wills & McEwen, 2011).
The sixth assumption of Knowles’s theory, “motivation,” refers to self-directed adult
learners determining what they need to learn, how they will learn, and what responsibility for
learning they will assume (Knowles et al., 2015). Although, external motivation exists,
motivation for learning is primarily internal and is the key factor that propels adult learners to
“keep growing and developing” (Knowles 1990; Knowles et al., 2015, p. 47).
The assumptions of Knowles’s ALT provide an understanding of how adult learners learn
best through their individual learning needs and learning styles (Forrest, 2004; Lieb, 1991;
Parker & Schoenhofer, 2008). Knowles’s ALT aligns with the adult population of undergraduate
nursing students across four generational cohorts discussed in this study and can provide nursing
educators direction for shaping the students’ learning experiences.
Conceptual Definition of Terms
The following is a list of conceptual definitions used in this study:
• generational cohorts: a group of people who are born within a time span with upper
limits of 15 years whose life stages are shaped by the events, trends, and
developments occurring during that time span (McCrindle, 2014; Nisen, 2013;
Twenge, 2017).
• educational pathways for nursing students: the “broadest range of preferred modes
and environments for learning” where nursing students can choose from three,
traditional educational pathways to obtain their degree. The Diploma, ADN, and BSN
29
programs all prepare students to provide comprehensive patient care to diverse patient
populations (Anderson, 1981; Bureau of Labor Statistics, 2018; LaRocco, 2010).
• adult learners: individuals who perform roles associated by today’s culture with
adults, perceiving themselves responsible for their own lives (Knowles, 1990),
• learning style preference: identified through a series of questions on how an
individual receives and processes new information as either active/reflective;
sensing/intuitive; visual/verbal; or sequential/global (Felder & Silverman, 1988).
• preferred teaching method: the learning environment that individuals identify as
being essential to successfully acquiring knowledge. Examples of nursing students’
preferred teaching methods include lecture, hands-on activities, visual aids, and
handouts (Appleman, 2016; Delahoyde, 2009; Kitko, 2011; Walker, 2006).
• faculty teaching methods: pedagogical strategies used for the delivery of the
curriculum (Leady, 2008). Examples of preferred teaching methods include lecture,
storytelling, case studies, visual aids, and the use of handouts (Appleman, 2016;
Delahoyde, 2009; Kitko, 2011; Walker, 2006).
Operational Definition of Terms
The following is a list of operational definitions used in this study:
• generational cohorts: Baby Boomers, individuals born between 1946 and 1964; Gen
X, individuals born between 1965 and 1979; Gen Y, individuals born between 1980
and 1994; and Gen Z, individuals born between 1995 and 2010 were identified from
the demographic data.
• educational pathways for nursing students: Undergraduate nursing students who
participated in the study had to be enrolled in one of the three, traditional educational

30
pathways: Diploma, ADN, or BSN program. Demographic data captured this
information.
• learning Style preferences: Undergraduate nursing students’ learning style
preference was measured using Felder & Soloman’s (1994) 44-item Index of
Learning Styles® (Appendix A).
• preferred teaching methods: The 30-item Walker/Delahoyde Teaching Method
Survey (Delahoyde, 2009, Walker et al., 2006) was used to measure the nursing
students’ preferred teaching methods used in the classroom (Appendix B).
• faculty teaching methods: The 30-item Delahoyde Teaching Method Faculty Survey
(Delahoyde, 2009) was used to identify the teaching methods used by faculty in the
classroom (Appendix C).
• demographic data: Questions were used to capture the following student
information: year born; state where enrolled in a nursing program; type of nursing
program enrolled; number of nursing courses completed; gender; race/ethnicity and
additional academic degrees. Likewise, for the nursing faculty, the following
information was obtained: year born; years of teaching experience; type of nursing
program; state where currently teaching; gender; race/ethnicity; and highest degree
earned (Appendix D).
Assumptions
The assumptions for this study were:
• Participants will respond freely and honestly will answer the questions on the chosen
tools.
• Nursing students are in college to learn, and learning is based on teaching.

31
• The generational age of nursing students impacts their learning style and preferred
teaching method.
• Nursing students within their generational cohorts will have similar learning styles
and preferred teaching methods.
• Nursing faculty have a preferred methodology in delivering evidenced-based content
in their respective nursing classrooms.
• Nursing faculty have the capability to use various teaching methods to facilitate
learning.
• Undergraduate nursing students from different generational cohorts will have
different learning style preferences and preferred teaching methods compared to the
teaching methods actually used by faculty.
Limitations
The most notable limitation of this study was the challenge in recruitment that occurred
during a global health pandemic. Furthermore, the onset of the pandemic delayed distribution of
the online survey until the end of the semester which may have adversely reduced participation.
Additionally, recruitment for participants had to be shifted from a national to a regional sample
of undergraduate Diploma, ADN and BSN nursing students, and nursing faculty. A national
study would have been more representative of the population, allowing for more generalization.
Instead of one entity sending out the surveys to potential participants, surveys were asked to be
sent out by almost five hundred different individuals.
Another limitation was the unequal representation of nursing students and faculty from
each generational cohort, which makes the results less representative of the general population.
Likewise, participants may not have been truthful with their age which could inadvertently affect
32
the categorized generational cohorts. To adapt for this, disclaimers were included in an
information letter ensuring confidentiality of the participants’ survey information. Students may
have ranked their preferred teaching method according to the methods used by their favorite
nursing faculty; and, if students with different learning preferences did not respond, the
generational group results could be affected.
Delimitations
Undergraduate nursing students and nursing faculty in Diploma, ADN, and BSN
programs from all generations in the Southeastern U. S. were included in the study. Students in
licensed practical, non-traditional, or graduate nursing programs were excluded from the study.
The study only examined classroom-teaching methods, excluding methods used in the nursing
lab, as well as the clinical setting.
Significance of the Study to Nursing
Supporting the NLN position statement calling for the reform of nursing education, nurse
educators are challenged to move from the paradigm of long-held teaching traditions to an
evidence-based curriculum which is flexible, student-centered, and infused with current
technology (Stanley & Dougherty, 2010). Moreover, to promote academic success of nursing
students, as well as adequately prepare future generations of nurses. Nurse educators must also
identify ways to enhance the learning environment and develop teaching methods that fit with
the values, expectations, and learning needs of the four generations currently in the nursing
classroom.
Summary
While the landscape of nursing education continues to change, nurse educators must be
willing to adapt their teaching pedagogy and create meaningful learning environments which
33
include the largest generation in the nursing classroom, Gen Z, as they continue to infiltrate
colleges and universities. Knowledge gained from this study will provide nurse educators with a
better understanding of generational learning styles and teaching preferences that can be used for
innovative and transformative nursing education.

34
Chapter 2. Literature Review
This chapter provides a review of literature that supports the implications for this study.
Beginning with the literature review, the first section describes the methods used to search the
professional literature. Following this section, relevant themes were identified and reviewed.
Generational cohorts, learning styles and preferences, learning style theories, generational
differences in nursing students and their preferred teaching methods, and the teaching methods
used by nursing faculty were presented, and gaps in the literature were discussed.
Method
The East Tennessee State University (ETSU) online library was used for the systematic
review of literature of databases: EBSCOhost, Cumulative Index to Nursing and Allied Health
Literature (CINAHL), the Education Full Text (H.W. Wilson), and PsycINFO. Key terms used in
the literature search were generations, undergraduate nursing student, learning styles, and
teaching preference. Additionally, combinations of the key term used in the literature search
were generational cohorts, Baby Boomers, Generation X, Generation Y, Generation Z, nursing
education, diploma nursing, associate degree nursing, baccalaureate degree nursing, preferred
learning style, teaching method, teaching strategy, and teaching style. Inclusion criteria involved
in the comprehensive search were studies published in English between 2000-2019. Studies prior
to 2000 were selected to provide historical information in the areas of learning styles and
generational differences.
Generational Cohorts
In response to world events, new technologies, societal values, career options, and
economical shifts, the definition of generational cohorts has changed over time. Historically,
generational cohorts were limited to a time span ranging from 20 to 25 years. Currently, the

35
definition focuses not only on time, but also on life stages that are shaped by events, trends, and
new developments. Now, the generational cohorts’ time span has an upper limit of 15 years
(McCrindle, 2014; Strauss & Howe, 1991). Table 2 illustrates generational cohorts defined by
various authors.
Table 2
Generational Cohorts Defined
Source Baby
Boomers Gen X Gen Y Gen Z
Dimock (2019) 1946-1964 1965-1980 1981-1996 1997-2012
Swanson (2018) 1946-1964 1965-1985 1978-2000 1995-2012
Twenge (2017) 1946-1964 1965-1979 1980-1994 1995-2012
Stillman and Stillman (2017) 1946-1964 1965-1979 1980-1994 1995-2012
Seemiller and Grace (2016) 1946-1964 1965-1980s 1980s-early 1990s 1995-2010
McCrindle (2014) 1946-1965 1965-1980 1980-1995 1995-2010
Strauss and Howe (1991) 1943-1960 1961-1981 1982-2005 -----------
According to Twenge (2017), there is “no exact science or official consensus to
determine which birth years belong to which generation” (p. 6). In an attempt to rectify the
arbitrary year cutoffs for defining generational cohorts, the terms “micro-generation,” “fringe,”
“cusp years,” or “cusper,” are used to identify individuals born immediately before and after
traditional generational year ranges, that may share or exhibit characteristics from the two
generations that overlap during the year they were born (Campbell et al., 2017; Strauss & Howe,
1991; Taylor, 2018; Twenge, 2017). For clarity, this research study used the terms Baby
Boomers, Gen X, Gen Y, and Gen Z and the birth years identified by McCrindle (2014) to define
generational cohorts, including participants in the micro-generations. Correspondingly, these
terms are representative of the most commonly published ranges of generational cohorts.
36
Baby Boomer Generation
Characteristically, when it comes to learning, Baby Boomer students are internally
focused and extrinsically motivated to succeed. With regards to education and learning, Boomers
are punctual, prepared, grade conscientious, and will seek guidance and mentoring if they
struggle, especially with technology related challenges. Boomer students are willing to learn
what is required to ensure their success (Cook, 2016; Johnson & Romanello, 2005).
Generation X
When it comes to learning, Gen X students desire to be taught what they “need to know”
in the shortest amount of time possible, using the easiest, available learning format. Specifically,
they are intrinsic learners who prefer working independently, with an expectation of receiving
some type of external motivation such as a reward (points or grades) for completion of class
assignments. Moreover, for Gen X, education is viewed as a means to an end that will provide
financial stability in their career (Cook, 2016; Johnson & Romanello, 2005).
Generation Y
When it comes to learning, Gen Y students’ instant access to internet information, often
rely on using web-based data, rather than developing evidenced-based research skills. Likewise,
they believe the learning environment is a reciprocal process between the instructor and the
student. Furthermore, Gen Y students are achievement oriented, showing a preference for
working in groups or teams while demanding immediate feedback on exams and/or class
assignments (Johnson & Romanello, 2005).
Generation Z
Gen Z students are described as learners that are driven by graphics, dislike lecture-test
classrooms, expect instant feedback, and prefer customized learning experiences (Renfro, 2015).
37
Although, they appreciate the value of a college education, they will analyze the return on
investment (ROI) associated with earning a college degree. In addition, Gen Z understands
complex, visual imagery, making visible approaches to teaching more effective than other
approaches (Hallowell & Ratey, 2011). Desiring a more hands-on approach to learning, they
expect to obtain practical and transferrable skills during the educational process, which will be
used later in their careers. Instead of reading and listening to PowerPoint® presentations, they
prefer to learn by observation and practice, making traditional lecture-format classes obsolete
(Loveland, 2017).
Traditional Educational Pathways for Registered Nurses
Nursing students can choose from three, traditional educational pathways to obtain their
degree. The Diploma, ADN, and BSN programs all prepare students to provide comprehensive
patient care to diverse patient populations (Anderson, 1981; Bureau of Labor Statistics, 2018;
LaRocco, 2010).
Diploma
The Diploma program, the oldest form of nursing healthcare education, is almost extinct
today. Since the late 1800s, diploma programs allowed students to become nurses in two or three
years, using an apprenticeship model that included working in a hospital while completing
required course work. Although, most diploma programs are hospital-based, they are usually
partnered with colleges and universities to obtain co-requisite course work (Anderson, 1981;
Valiga, 2012).
Associate Degree Nursing
To alleviate the critical shortage of nurses after World War II, ADN programs,
decreasing the length of time for entry into practice from three to two years were created
38
(Organization for Associate Degree Nursing, 2015). Community colleges, vocational schools,
along with some universities, offer this efficient and economical educational pathway to
becoming a RN, as their graduates continue to contribute to the nations nursing workforce
(Mahaffey, 2002; National League for Nursing, n.d.-a; Organization for Associate Degree
Nursing, 2015).
Bachelor of Science in Nursing
Typically offered at colleges and universities, BSN programs include courses beyond the
scope of those required in the diploma and ADN programs, which serve to enhance the student's
professional development and prepare them for broader nurse practice roles. Examples of these
courses include: physical and social sciences; public and community health; humanities; nursing
management; and nursing research (Health Resources and Services Administration [HRSA],
2007; Raines & Taglaireni, 2008).
Learning Style Theories
Several factors which can develop over time or change with new experiences influence
individual learning styles. These include demographic characteristics, internal personality traits,
and external teaching environments (Cassidy, 2004; Felder & Brent, 2005). Although the
concept of “learning style” as a primary method for individualized learning began early in the
mid-20th century, it was not until the 1970’s that it became popular (Coffield et al., 2004). Over
the next several decades, many learning style theories emerged and became prevalent in
education. According to Coffield et al. (2004) and Reid (2005), there are now over 70 learning
style models, theories, and frameworks that describe and measure an individual’s unique and
distinctive approach to learning.
39
For nurse educators to effectively create conducive, learning environments, it is crucial
for them to have an understanding of various learning style theories. Adult learning style theories
can be grouped into related categories which often overlap and include: instrumental, humanistic,
transformative, social, motivational, reflective, and constructivist. While each of the learning
style theories have their strengths, it is recommended that nursing faculty use a combination of
learning style theories and frameworks to complement their teaching environment while
supporting evidence-based educational practices (Mukhalalati & Taylor, 2019; Taylor & Hamdy,
2013). Some of the common learning style theories/models used in nursing education research
include Kolb’s Experiential Learning Style Model; Dunn and Dunn’s Learning Style; Myers-
Briggs Type Indicator®; and Felder and Solomon’s Index of Learning Style®, which was used in
this study. A brief summary of each learning style theory is described.
Kolb’s Experiential Learning Style
Based on the synthesis of the works of the “foundational scholars of experiential
learning” (Kolb & Kolb, 2017, p. 10), David A. Kolb developed the Experiential Learning
Theory (ELT) from the belief that learning is a process where knowledge is created through the
transformation of experiences or new situations (Kolb, 1984, p. 38). The ELT offers a dynamic
view of learning “based on a learning cycle driven by the resolution of the dual dialectics of
action/reflection and experience/ abstraction” (Kolb & Kolb, 2017, p. 10). The ELT focuses on
information processed through a cyclical model of learning, where the learners encounter,
reflect, and transform new situations or experiences. Emphasizing the role that experience plays
in the learning process is one of the distinguishing aspects of ELT that separate if from other
learning theories (Kolb et al., 2001).
40
The ELT incorporates two levels, the experiential learning cycle and learning styles. The
first level of the ELT, the cycle of learning, consists of four stages that explain the conditions in
which the learner learns best: the concrete experience; the reflective observation; the abstract
conceptualization; and active experimentation. The first stage, concrete experience, is the
“hands-on” experience of encountering a new experience or reinterpreting a previous experience.
The second stage, reflective observation, allows time to review or reflect on the experience,
clarifying any inconsistencies between the experience and understanding of the experience. The
third stage, abstract conceptualism, occurs when reflecting on the experience, allows conclusions
to be drawn from results occurring from experiences. The fourth stage, active experimentation,
affords opportunities to apply and test hypothesis formed in stage three in future situations,
resulting in a new experience (Kolb, 1984; McLeod, 2017).
The second level of the ELT includes four learning styles that are integrated with the
learning cycle which explain the conditions which are more conducive to effective learning.
These learning styles include: the diverging learner; the assimilating learner; the converging
learner; and the accommodating learner (Kolb, 1984; McLeod, 2017). The first learning style,
the diverging learner, is sensitive, learns best from concrete experiences, and reflective
observations. The second learning style, the assimilating learner, thinks more abstract and
prefers to follow a logical approach to learning. The third learning style, the converging learner,
considered the problem solvers, are the thinkers and doers. The fourth learning style, the
accommodating learner, prefers learning through ‘hands-on’ experiences (Kolb, 1984; McLeod,
2017).
41
Dunn and Dunn’s Learning Style Model
The Dunn and Dunn Learning Style Model, based on Cognitive Style and Brain
Lateralization Theories, is a comprehensive model that identifies learning styles by analyzing
individuals’ unique strengths and preferences for how they learn best. The initial model
identified 12 variables that were different among students. The second revision included 18
variables. Currently, the model includes a total of 20 (five stimuli and the respective elements
within each stimulus) that differentiate the conditions in which individuals actually learn (Dunn,
1984; Dunn, 1990; Dunn & Burke, 2006; Dunn & Dunn, 1979).
The variable and its elements include: the environment (sound, light, temperature, seating
or room design); emotion (motivation, persistence, responsibility, structure); sociological
preferences (colleagues, learning alone, in pairs, or part of a team, authority, with variety);
physiological characteristics (perceptual, time of day, intake, mobility while learning); and,
psychological (global/analytic, impulsive/reflective) suggest simultaneous and successive
processing (Dunn 1990; Dunn & Burke, 2006, p.4; Dunn & Dunn, 1979). The current
Productivity Environmental Preference Survey (PEPS) self-report questionnaire (Dunn, Dunn, &
Price, 1996) analyzes patterns through which learning occurs. In return, the results of the
questionnaire can improve the effectiveness of instructional education by linking an individual’s
learning style preference with the appropriate evidenced-based teaching strategy(s).
Myers-Briggs Type Indicator® (MBTI®)
Expanding Carl Jung’s Theory of Personality Types, Katherine Briggs and her daughter
Isabel Briggs Myers, developed the Myers-Briggs Type Indicator® (MBTI®) which affords the
opportunity for individuals to identify their personality type, strengths, and preferences including
that of learning and teaching (Cohen, 2008; The Myers & Briggs Foundation, 2019a). Used

42
worldwide, the MBTI® personality assessment provides a constructive framework, revealing four
areas of personality, each with two dichotomous preferences. These include how a person directs
their energy, introverted versus extroverted (IE); how information is processed, sensing versus
intuition (SN); how decisions are made, thinking versus or feeling (TF); and, the preference for
organization, judging versus perceiving (JP) (Brownfield, 1993; McCaulley, 2000).
The MBTI® has been used in counseling, business, industry, and medicine; this
assessment has proven useful for educational purposes, assisting students with understand their
various learning styles (Mayfield 2012; The Myers & Briggs Foundation, 2019b). According to
Cohen (1992), when used in education, the MBTI® helps students understand their most effective
learning style through thorough analysis and explanation of each personality type.
Felder and Solomon’s Index of Learning Styles
The Index of Learning Styles® (ILS) psychometric learning style assessment instrument,
developed by Felder and Soloman, evolved from Felder and Silverman’s learning style model
(Felder & Silverman, 1988; Felder & Soloman, 1994; Zywno, 2003). Components of the ILS
were borrowed from Kolb’s (1984) ELT, and the MBTI® model based on Carl Jung's personality
type theories (The Myers & Briggs Foundation, 2019a). The initial Felder-Silverman model had
five dimensions of scale: inductive-deductive, sensing-intuitive, visual-verbal, active-reflective,
and the sequential-global dimension (Felder & Soloman, 1988; Litzinger et al., 2005). Soon after
the development of the ILS, the inductive-deductive dimension was deleted from the model after
it was determined that this dimension was not necessarily the best style to facilitate learning, nor
was there a reliable way to assess the dimension (Felder, 1998).
The Index of Learning Styles® is a 44-item assessment-based instrument that is designed
to assess 11 items in four dimensions of learning styles through dichotomies. Each of the four
43
dimensions have polar opposites with the preferences identified as strong, moderate, or mild
(balanced); omitting the option of “no preference” (Felder & Spurlin, 2005). The Index of
Learning Styles® purports that a student’s leaning style may be defined by answering the
following four questions:
1. “What type of information does the student preferentially perceive: sensory (sights,
sounds, physical sensations) or intuitive (memories, thoughts, insights)?
2. What type of sensory information is most effectively perceived: visual (pictures,
diagrams, flow charts, demonstrations) or verbal (written and spoken explanations)?
3. How does the student prefer to process information: actively (through engagement in
physical activity or discussion) or reflectively (through introspection)?
4. How does the student characteristically progress toward understanding: sequentially (in a
logical progression of incremental steps) or globally (in large “big picture” jumps)?”
(Felder, 1993; Felder & Spurlin, 2005, p. 60; Felder & Silverman, 1988).
Although originally designed for engineering and business students, the ILS is now used
across many disciplines internationally, including education, nursing, and psychology (Brannan
et al., 2016; Felder, 1988; Felder & Brent, 2005; Felkel & Gosky, 2012; Gonzales et al., 2017;
McCrow, 2014; Platsidou & Metallidou, 2008).
Nursing Students Learning Style Preferences
Over the past decade, nursing educators have been encouraged to embrace the paradigm
shift from a historically teacher-centered to a student-centered learning model. This paradigm
shift “calls for nursing education to respond to the changing needs of our student population”
while developing a creative, innovative pedagogy that integrates students’ learning styles
preferences with an environment that is most effective for knowledge acquisition (Knowles et
44
al., 2015; Stanley & Dougherty, 2010, p. 378). A review of literature reveals studies that
employed various theorists and their assessment tools used to determine the learning style
preferences among students from all types of nursing programs, including diploma, associate
degree, and baccalaureate degree programs.
Kolb's ELT and LSI have been used frequently as the theoretical framework to identify
the learning styles of nursing students in the literature. The results of a study conducted by
Rakoczy and Money (1995), found that nursing students in a diploma program preferred learning
from concrete, “hands-on” experiences. Closely related to nursing students, Robinson et al.
(2012), opted to explore generational and learning styles of nurses employed at a large
metropolitan medical center. Like Rakoczy and Money (1995), the most preferred learning style
was predominantly diverger, providing concrete, “hands-on” experiences. In a similar study,
Molsbee (2011) combined Knowles’ ALT and Kolb’s ELT, to examine the association between
the dominant learning styles and gender, race, and age of traditional and nontraditional ADN
students ranging from 19 to 60 years old. Although there was no statistically significant
association between learning style and age groups, there was a statistically significant association
between learning style and gender. From an international perspective, BSN students in Australia
(D'Amore et al., 2012) and Nigeria (Madu et al., 2019) also preferred learning from concrete,
“hands-on” experiences.
Frequently used with elementary students, Dunn and Dunn’s Productive Environmental
Preference Survey (PEPS), has also been used in nursing education to analyze individuals’
unique strengths and preferences for how they learn best (Dunn et al., 1996). Using the PEPS,
Hallin (2014), identified nursing students at a university in Sweden as being ‘flexible’ in their
preferred learning styles. With regard to gender, as compared to the male students, women were

45
highly motivated; preferred structure and mobility; and, identified auditory, tactile, and
kinesthetic learning preferences. A more recent study using the PEPS, Hallin et al. (2016),
showed no strong preference for a specific learning style; however, several students indicated
that “they would benefit from special accommodation to their learning style preferences” when a
variation of interactive teaching strategies was implemented (p. 7).
The Myers-Briggs Type Inventory ® is also used to identify students learning and teaching
preferences. In a study conducted by Puylert (2006), BSN students with an average age of 23.5
years, showed that ISFJ (introverted, sensing, feeling, judging) typology was the groups’
dominant four-letter score, indicating a preference for applying facts and using practical
applications for learning. Students with ISFJ learn best from well-organized, structured, learning
environments, including lecture-style teaching. Individually, three predominate learning-style
preferences were identified: the ESFJ (20%), the ISFJ (18%), and the ISTJ (12%). Educators
wanting to reach most of these students should use a variety of teaching strategies to the top
three dominant learning-styles of ESFJ, ISFJ, and ISTJ types. Interestingly, the study showed no
INTJ or ISTP types in the sample. These types of learners have visions for long-range planning
and exhibit critical, as well as independent thinking skills. Further, they are analytical,
organizers, and accel at problem solving. Without visionaries, the nursing profession would lack
the innovation and foresight for further growth and advancement of the science of nursing.
Additional studies are needed to examine nursing students from multiple colleges and in various
types of 2-year and 4-year nursing programs.
Although the use of the Index of Learning Styles® is relatively new in nursing research,
several studies examining the learning styles of nursing students and registered nurses were
found in the literature. The ILS allows learners to identify being balanced (have no strong
46
preference for a particular domain) across the learning dimensions of sensing-intuitive, visual-
verbal, active-reflective, and the sequential-global; or to identify a moderate or strong preference
for just one domain (Felder & Soloman, 1988; McCrow et al., 2014). In studies by Perks (2017)
and Gonzales et al. (2017); the predominate learning domain for nursing students was sensing on
the sensing-intuitive dimension without regards to difference in age.
Studies, whose focus was registered nurses, reported the ILS results of the learning style
preferences by combining each side of the four dimensions scale and then reporting the two-
groupings. McCrow et al. (2014), identified the most common preferred learning styles, as being
a balance between the sensing (n = 97, 68%) and visual (n = 76, 53%) domains among acute care
nurses in South-East Queensland, Australia. Keef’s (2014) study, also using the two-grouping
result reporting, identified a balance between the visual and verbal domains as the learning styles
preferred by the majority of the registered nurse participants. In both studies, no significant
relationships were found between learning styles and age.
The findings from the following studies using the ILS, revealed all four dimensions of the
learning style preferences. Zhang & Lambert (2008) identified the primary learning styles of
Chinese baccalaureate nursing students as reflective, sensing, visual, and global; as compared to
Yockey’s (2015) study that revealed sensing, sequential, visual, and active as the preferred
learning style when exploring nursing students’ anxiety associated with simulation. However, in
Brannan et al., (2016), active, visual, sensing, and sequential learning styles were preferred by
nursing students exploring their confidence and knowledge in placed in high fidelity simulation
settings. Regardless of the order of the preferred learning style domain, there was a common
theme suggesting that an awareness of learning styles may empower faculty to incorporate
engaging teaching strategies in the nursing classroom.
47
Generational Differences in Learning Style
Although researchers have examined specific characteristics that influence learning
styles, the possible influence of generational diversity among nursing students have been
minimally researched. According to Johnson and Romanello (2005), understanding of
generational diversity “gives nurse educators insight into how students from different
generations learn best” (p. 212). Once generational differences in learning are recognized and
understood, “faculty can adjust their teaching methods to meet the learning needs of
multigenerational students” (Johnson & Romanello, 2005, p. 215).
Within the nursing profession, Walker et al. (2006) seminal study examined generational
differences of Gen X and Gen Y nursing students’ preferred teaching methods. Whereas the
study yielded no statistically significant differences between the two generations preferred
teaching methods, lecture was identified as the dominate teaching method preferred by the
majority (83%) of the students from both generations. Knight (2016) used a mixed-method study
to determine generational learning style preferences of healthcare workers. The statistical results
from this study indicated that representatives from each generation utilized some degree of the
visual, auditory, and kinesthetic learning style. Similarly, the data revealed a significant
difference for a visual learning style preference for Baby Boomers and Gen X.
With a focus on law enforcement, Stephens (2015), investigated generational differences
in learning style preferences. Three generational cohorts represented in the study identified the
converging learning style as the dominant preferred learning style. Although, there were no
generational differences identified in learning styles, the recognition of a shared dominant
learning style can benefit law enforcement instructors and students, permitting a better alignment
between training methodology and student needs.
48
Achieving an understanding of generational differences in learning style preferences
among adult learners across the U.S. would allow leaders to develop a more effective training
design across the organization. The challenges of effectively training employees from five
generational cohorts in the current workforce was the impetus for Shepherd’s (2017) study
comparing the generational cohorts of Baby Boomers, Gen X, and Gen Y. Whereas the cohorts
were similar with their learning style preferences, there were no significant differences identified
between the generational cohort’s learning style preferences. The results support using a variety
of teaching and training activities that are inclusive of all generational cohorts.
Nursing Students Preferred Teaching Methods
A limited number of studies exist that examined the generational differences of
undergraduate nursing students’ preferred teaching methods, and none of the studies investigated
Gen Z (Appleman, 2016; Delahoyde, 2009; Kitko, 2011; Walker et al., 2006, & Walker et al.,
2007). Walker et al. (2006) studied the differences in Gen X and Gen Y in BSN students, as well
as their preferred teaching methods. This quantitative descriptive study surveyed 134
undergraduate nursing students, comprised of 25 students representing Gen X, and 105 students
representing Gen Y. Although, there were no statistically significant differences found between
Gen X and Gen Y students regarding their teaching method preferences, the majority (83%) of
the students from both generations identified lecture as the preferred teaching method. In
addition, the same percentage of students indicated that they did not prefer group work
conducted inside or outside of the classroom. In the classroom, the students indicated the desire
to have handouts that corresponded with the lecture, along with other supplemental materials.
Ninety percent of the students surveyed showed low levels of desire for completely web-based or
web-enhanced coursework, despite coming from technological savvy generations. While, on the
49
other hand, 100% of the student responses supported the first assumption of Knowles’s ALT, the
learners’ “need to know,” demonstrating the “pragmatic” nature of Gen X and Y learners’
needing to know the “why” behind learning the material (Knowles et al., 2015; Walker et al.,
2006, p. 218).
Another study, Walker et al. (2007), compared preferred teaching methods between two
groups of BSN students: traditional nursing students without a degree and those with a previous
college degree. This quantitative descriptive study surveyed 171 undergraduate nursing students,
comprised of 81 traditional students and 48 students with a previous college degree. From a
sample size of 171 students, 129 surveys were completed and included in the results. Regarding
their teaching method preferences, most of the students from both groups identified lecture as
their preferred teaching method; with group work being the least preferred method. Both groups
of students in this study indicated that they preferred not to participate in group work conducted
either inside or outside the classroom. The students with a previous college degree were
motivated and had stronger preferences for a totally web-based classroom, which allowed for
self-directed learning, reinforcing the sixth assumption of Knowles’s ALT of “motivation”
(Knowles et al., 2015).
Expanding on the research conducted by Walker et al. (2006) and Walker et al. (2007),
Delahoyde (2009) compared the preferred teaching methods of multigenerational BSN students
and the faculty use of teaching methods at five private colleges, located in the Midwest. This
quantitative descriptive study surveyed 367 participants, composed of nursing faculty (n = 38)
and nursing students (n = 329). Gen Y (n = 272) represented most of the students, followed by
Gen X (n = 49), and the Baby Boomers, representing the least amount with only six students.
The statistically significant findings between Gen X and Y students showed that their preferred
50
teaching methods included lecture, listening to the lecture versus working in groups; and
engaging in group discussions, along with group assignments. Lecture remains the most
preferred teaching method identified by the students, as well as the teaching method most
frequently used by faculty. Like Walker et al. (2006), this study showed students’ low preference
for notetaking, along with having a totally web-based course of study. The importance of this
study addressed the second assumption of Knowles’s theory, the “learners’ self-concept,” as well
as, his fifth principle, the learners’ “orientation to learning” (Knowles et al., 2015).
Another study, conducted by Kitko (2011), focused on ADN students instead of BSN
students. This study compared multigenerational nursing students’ preferred teaching methods
and the faculty use of teaching methods at four colleges and universities located in the Northeast.
The quantitative descriptive study surveyed 289 participants, comprised of nursing faculty (n =
45) and nursing students (n = 244). In this study, Gen X (n = 156) represented the majority of the
students, followed by Gen Y (n = 67); Baby Boomers represented the least amount with only 20
students. There were eight statistically significant findings among Gen Y, Gen X, and Baby
Boomers in this study. Most significant, the students identified lecture as the most preferred
teaching method which, incidentally, is the most frequent teaching method used by faculty.
Moreover, the least preferred method was a total web-based course of study without class
meetings. This study acknowledged the third assumption of Knowles’s theory, the “role of the
learners’ experiences” (Knowles, 1973). Specifically, the majority of the students indicated that
they preferred a “high level of classroom structure” and guidance from the professor shaped by
their background and prior learning experiences (Kitko, 2011, p. 137).
Appleman’s (2016) quantitative non-experimental study investigated the preferred
teaching methods among BSN students based on age, gender, academic year, and
51
traditional/non-traditional status. The study included a nationwide sample of nursing students (n
= 355) from which Appleman evaluated the relationships between preferred teaching strategies
and self-identified learning styles. In sharp contrast to the other four studies (Delahoyde, 2009;
Kitko, 2011; Walker et al., 2006, & Walker et al., 2007) that identified lecture as the preferred
teaching method, this study indicated simulation as the preferred teaching method, followed by
PowerPoint©, then lecture, with concept mapping being the least preferred teaching method. This
study acknowledged the fourth assumption of Knowles’s theory, the learners’ “readiness to
learn” (Knowles, 1973). The critical implication for this principle, identified by Knowles et al.
(2015), was to ensure that the timing of the learning experiences coincided with the learners’
developmental phases.
Faculty Teaching Methods
Leady (2008) defined teaching methods as the pedagogical strategies that educators use
for the delivery of the curriculum. Although, nursing education reform continues, faculty
teaching methods have remained relatively unchanged (Benner et al., 2010; Tanner, 2002).
Examples of teaching methods most frequently used in the nursing classroom included: lecture,
case studies, simulation, group work, concept mapping, hands-on projects, games, storytelling,
handouts, visual aids, role playing, and web-based activities (Bradshaw & Lowenstein, 2010).
When comparing preferred teaching methods across generational cohorts, all traditional
educational pathways for registered nurses should be evaluated. Although research has indicated
minimal statistically significant results for preferred teaching methods, implications for
application in higher education were recommended. Additional research on teaching methods
used by faculty is needed to support evidenced-based practices. Overall, students and faculty,
regardless of age, generation, or educational pathway, identified lecture as the most preferred

52
teaching methodology. Following lecture, hands-on activities, case studies, visual aids, and the
use of handouts were the students’ most preferred teaching methods. Faculty identified lecture as
the most common teaching method followed by case studies and visual aids. With regards to the
least preferred teaching method, the results for students and faculty were inconsistent regardless
of age, generation, or educational pathways. Gen X students favored a total web-based course, as
opposed to Gen Y students who are considered as being technologically savvy. Moreover, group
work was least preferred by Gen Y students, who preferred working in teams, in contrast to Gen
X students, who preferred working independently. The effectiveness of the use of traditional
lecture alone, versus a combination of lecture in addition to other teaching strategies was missing
from the literature.
Gaps in Literature
Research identifies four generations (Baby Boomers, Gen X, Gen Y, and Gen Z) of
students with varying characteristics, expectations, and preferences for learning currently in the
nursing classroom; however, only three (Baby Boomers, Gen X, and Gen Y) of the four
generations have been extensively studied. Knowing that generational differences exist and the
implications these differences have for nursing education, there remains dearth studies regarding
the latest generation in the nursing classroom, Gen Z, identifying a gap in research that needs to
be investigated.
Although, preferred teaching methods of generational cohorts have been researched since
2006, there has been only five studies that examined the generational differences of nursing
students and their preferred teaching methods (Delahoyde, 2009; Kitko, 2011; Walker et al.,
2006, & Walker et al., 2007) Regardless, none of the studies included Gen Z. Research studying
53
the preferred teaching methods of all generational cohorts is not only needed, but also essential
for furthering evidenced-based teaching in nursing education (Earle & Myrick, 2009).
When comparing preferred teaching methods across generational cohorts, future research
should be inclusive of all traditional educational pathways for registered nurses across the nation.
From the literature, the majority of the studies focused on BSN students; with minimal research
investigating ADN students, and none examining students from a Diploma program.
Consequently, further research conducted on multi-generational classrooms from all nursing
educational pathways is warranted and needs to include the advanced nursing degrees. Evidence-
based data from future research could provide nurse educators the basis for making changes in
curriculum design, improving student learning, academic performance, and ultimately leading to
student success and achievement.
Lecture was identified as the most preferred teaching methodology of both faculty and
students (Delahoyde, 2009; Kitko, 2011; Walker et al., 2006). Therefore, more studies need to be
conducted on the effectiveness of lecture, along with the pairing of traditional lecture used with a
combination of other teaching methods, such as visual aids, the use PowerPoint©, and/or
technology. Additionally, for nursing education reform to occur, research needs to be expanded
in the area of effective teaching methods by including qualitative and/or mixed-methods
methodology which incorporates a much-needed student voice. Findings in this study were
limited to results from a quantitative study design.
Summary
Today’s nurse educators are challenged to create learning environments that are inclusive
of students from four, diverse generations, spanning six decades enrolled in one of three
traditional nursing educational pathways. The literature revealed general characteristics and
54
learning preferences for three of the four generations (Baby Boomers, Gen X, and Gen Y),
including specific characteristics of nursing students. However, there was limited information for
Gen Z, the latest population of nursing students currently in the classroom.
While the literature revealed traditional lecture as the most preferred teaching method, as
well as, the most frequently used teaching method, the need for a paradigm shift from teacher-
centered learning to student-centered learning was apparent (Delahoyde, 2009). This shift in
instructional pedagogy calls for the implementation of teaching methods that not only fit with the
values and expectations, but also the learning needs of all four generations in the nursing
classroom.

55
Chapter 3. Methods
This chapter describes the specific methods and procedures that were used to compare the
relationship of undergraduate nursing students’ learning style preferences and preferred teaching
methods from different generational cohorts to the teaching methods used by faculty. This
chapter explains the research design, describes the setting, population, and the sample of the
study. A description of the instruments and psychometric properties to support the validity and
reliability of the measures are provided. Finally, the chapter concludes with the data collection
procedure, an explanation of how human subjects were protected, the data analysis plan,
interpretation of the results, and a summary.
Research Design
A quantitative, descriptive correlational design was used to guide the study and examine
the preferred teaching methods of undergraduate nursing students from four generations with
their learning styles and the teaching methods used by faculty. Using an online survey distributed
to undergraduate nursing students and their faculty from Diploma, ADN or BSN nursing
programs in the Southeastern U.S., data was collected. Student participants were asked basic
demographic information, questions designed to determine their learning style, and to identify
teaching method preferences. The student survey concluded with identifying the top five
teaching methods that helped them learn the most. Nursing faculty participants were asked basic
demographic and questions designed to determine what teaching methods they used in the
classroom. The faculty survey concluded with identifying the top five teaching methods they
used most frequently in the classroom.
The analysis and synthesis of the participant responses provided statistical data used to
answer the research questions and test the stated hypotheses. The researcher’s contact
56
information was provided as a reference for participants if any questions or concerns occurred.
Participants were able to complete the survey at their convenience, from a location of their
choice, within a four-week timeframe.
Population
The target population for this study was undergraduate nursing students enrolled in, and
faculty who teach in, Diploma, ADN, and BSN programs from the following 12 Southeastern
states: Alabama, Arkansas, Florida, Georgia, Kentucky, Louisiana, Mississippi, North Carolina,
South Carolina, Tennessee, Virginia, and West Virginia. Although participants were invited to
participate from 12 Southeastern states, there were no participants from Mississippi or West
Virginia.
Setting
The study was conducted entirely in an online setting using the secure Survey Monkey®
data collection system as the survey instrument. A non-probability purposive sampling of
undergraduate nursing students enrolled in and faculty who taught in Diploma, ADN, and BSN
programs from ten Southeastern states were included in this study. Participants included male
and female nursing students, currently enrolled at any level of their nursing program, and their
faculty that was willing to participate by ranking scaled survey questions. Exclusion criteria
included: students enrolled in licensed practical, non-traditional, or graduate nursing programs,
and their faculty; those unable or unwilling to participate in the study; or who did not complete
the survey.
Sample
A convenience sample of all undergraduate nursing students enrolled in, and faculty who
teach in, Diploma, ADN, and BSN programs from colleges and universities in the 12
57
Southeastern states were invited to participate in this study. Since the population size was
unknown for students and faculty, the sample size was calculated using the following formula for
a two-proportion test: “n = (Zα/2+Zβ)2 * (p1(1-p1)+p2(1-p2)) / (p1-p2)2; where Zα/2 is the
critical value of the Normal distribution at α/2 (e.g. for a confidence level of 95%, α is 0.05 and
the critical value is 1.96), Zβ is the critical value of the Normal distribution at β (e.g. for a power
of 80%, β is 0.2 and the critical value is 0.84) and p1 and p2 are the expected sample proportions
of the two groups” (Select Statistical Services, n.d.; Wang & Chow, 2007, p 3-4).
When calculating the student sample size with p1 = 0.65 and p2 = 0.4, a sample size of
58.64 (n = 59) per group was suggested. When calculating the faculty sample size with p1 = 0.65
and a lower power of p2 = 0.35 size since the results are considered exploratory, a sample size of
24.69 (n = 25) per group was suggested. Due to the low numbers of Gen X and Gen Y students,
they were combined into one group, Gen XY prior to data analysis. Additionally, the Gen X and
Gen Y faculty were also combined into one group, Gen XY prior to data analysis.
Instrumentation
Four instruments for survey instrumentation and associated scoring were used in the
study. First, the Felder and Silverman’s Index of Learning Styles® (ILS) questionnaire (Appendix
A) was used to measure the dependent variable of students identified learning style. Second, the
Walker/Delahoyde Teaching Method Survey (WDTMS; Appendix B), was used to measure
independent variables: generational, academic, and demographic variables: age, gender,
race/ethnicity, and type of nursing program enrolled, location of nursing program, and the
number of nursing courses completed. In addition, this survey measured the dependent variables
of faculty teaching method preferences and expectations. Third, the Walker Teaching Method
Survey (WTMS; Appendix C) also measured faculty teaching method preferences and
58
expectations of nursing students from different generational cohorts. The main purpose of
administering this instrument, was used to provide additional support for the internal consistency
and reliability of the original WDTMS survey instrument. Fourth, the Delahoyde’s Teaching
Method Faculty Survey (DTMFS; Appendix D), was used to measure the following independent
variables of faculty: generational, academic, and demographic variables: age, gender,
race/ethnicity, and type of nursing program employed, location of nursing program, number of
years teaching, and the highest degree earned. In addition, this survey measured the dependent
variable of teaching methods used in the classroom. Following is a discussion of each
instrument.
Learning Style Preference
Learning Style Survey. Felder and Soloman’s (1994) Index of Learning Styles® (ILS), is
a 44-item, dichotomous response survey, revised from the original Felder and Silverman ILS,
designed to identify perceptual preferences for learning from four dimensions of learning styles.
There are 11 items in each of the four learning style dimensions, with two opposing categories in
each dimension, active-reflective (ACT/REF), sensing-intuitive (SEN/INT), visual-verbal
(VIS/VER), and sequential-global (SEQ/GLO). Table 3 illustrates the ILS distribution of
questions. To determine the degree of preference, the reported score in each dimension is
calculated from -11 to +11 in increments of 2 (-11, -9, … 9, 11). If the score is between one and
three, then it is determined that the learner is well balanced with a “mild preference” for one of
the categories from that dimension. If the score is between five and seven, then is it determined
that the learner has a “moderate preference” for one category from that dimension. If the score is
between nine and eleven, then it is determined that the learner has a “strong preference” for one
category from that dimension (Felder & Soloman, 1994).
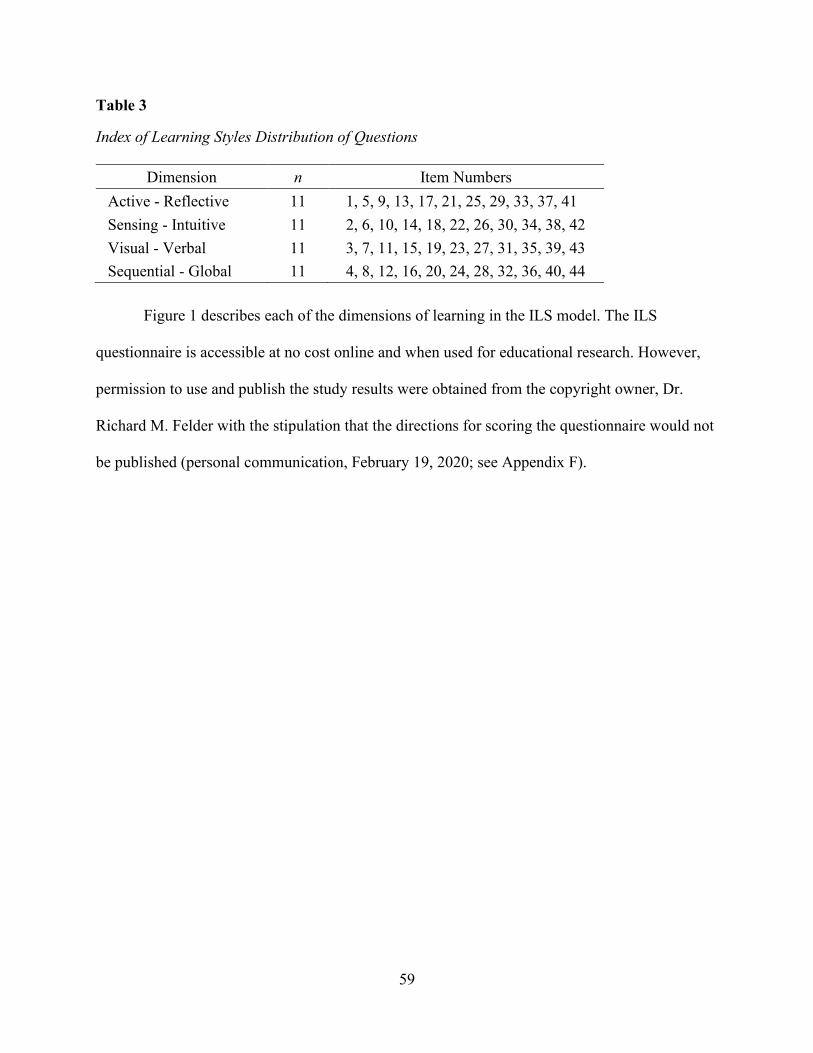
59
Table 3
Index of Learning Styles Distribution of Questions
Figure 1 describes each of the dimensions of learning in the ILS model. The ILS
questionnaire is accessible at no cost online and when used for educational research. However,
permission to use and publish the study results were obtained from the copyright owner, Dr.
Richard M. Felder with the stipulation that the directions for scoring the questionnaire would not
be published (personal communication, February 19, 2020; see Appendix F).
Dimension n Item Numbers
Active - Reflective 11 1, 5, 9, 13, 17, 21, 25, 29, 33, 37, 41
Sensing - Intuitive 11 2, 6, 10, 14, 18, 22, 26, 30, 34, 38, 42
Visual - Verbal 11 3, 7, 11, 15, 19, 23, 27, 31, 35, 39, 43
Sequential - Global 11 4, 8, 12, 16, 20, 24, 28, 32, 36, 40, 44

60
Figure 1
Felder & Solomon Index of Learning Style® Scale
Strong Moderate Balanced Moderate Strong
11 9 7 5 3 1 1 3 5 7 9 11
Processing
Information
Active
Retains and understands information best by
doing something active with it and likes
group work.
Reflective
Likes to think about it first and prefers
working alone.
Perceiving
Information
Sensing
Likes learning facts and solving problems
by well-established methods; Detailed
oriented; Good at memorizing facts and
doing hands-on (laboratory) work; Dislikes
complications and surprises.
Intuitive
Prefers discovering possibilities and
relationships. Likes innovation, dislikes
repetition; grasps new concepts and
comfortable with abstractions and
mathematical formulations. Don’t like
course that involve a lot of memorization
and routine calculations.
Receiving
Information
Visual
Remembers best what they see (pictures,
diagrams, flow charts, timelines, films, and
demonstrations).
Verbal
Gets more out of words; prefer written and
spoken explanations.
Understanding
Information
Sequential
Gain understanding in linear steps in finding
solutions, consequently, may not fully grasp
total picture. Prefers working in organized,
systematic way.
Global
Learns in large jumps, absorbs material
sometimes without seeing connections,
suddenly “gets it.” Solves complex
problems quickly in novel ways but may
not be able to explain the steps to solution.
Note: Felder-Silverman learning styles scale for each domain. Adapted from Brannan, J., White, A., &
Long, J. (2016). Learning styles: Impact on knowledge and confidence in nursing students in simulation
and classroom. International Journal of Nursing Education Scholarship, 13(1), 63–73.
https://doi.org/10.1515/ijnes-2015-0052. Adapted with permission.
Reliability and Validity. Although psychometric testing was not performed initially on
the ILS when developed, numerous studies have since performed construct validity supporting
the internal consistency reliability of the instrument. Results of some of the studies are listed in
Table 4 for comparison to the current study. According to Tuckman (1999), the reliability of
Cronbach’s alpha is determined by the criteria of acceptability for alpha that is appropriate for
two different tests. Either the “quantity being measured is univariate, as in an achievement test of
knowledge of a subject area or mastery of a particular skill;” or it is “the quantity being
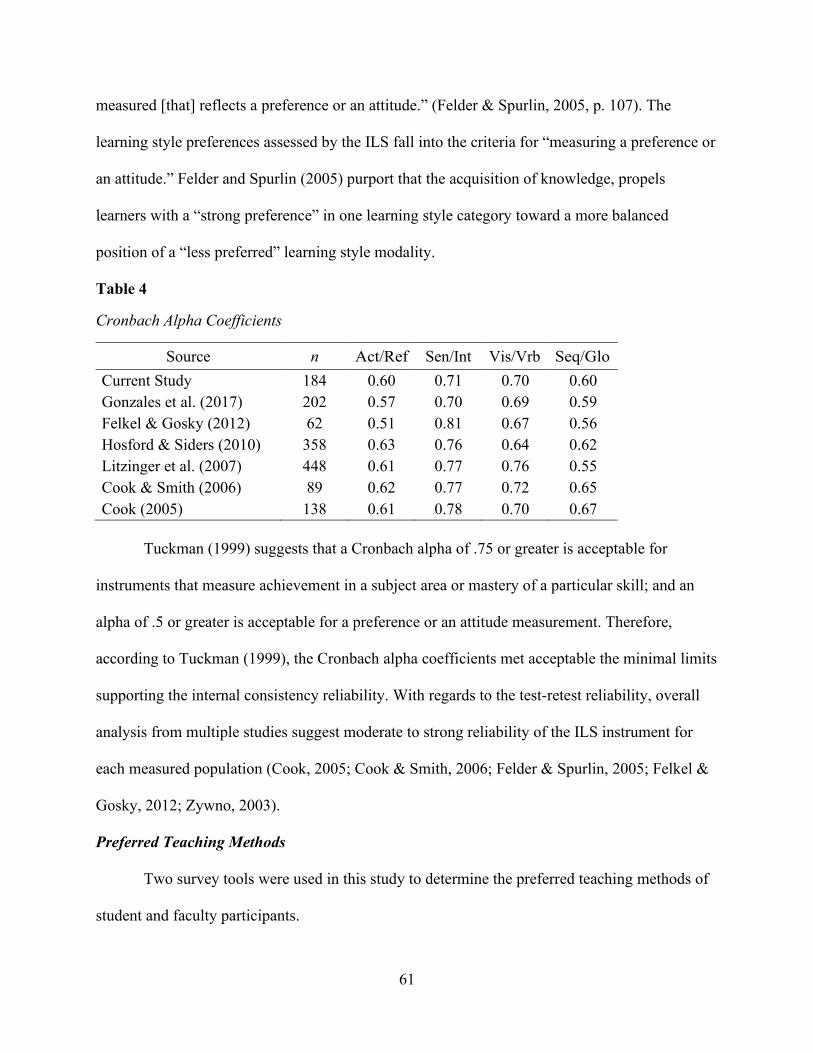
61
measured [that] reflects a preference or an attitude.” (Felder & Spurlin, 2005, p. 107). The
learning style preferences assessed by the ILS fall into the criteria for “measuring a preference or
an attitude.” Felder and Spurlin (2005) purport that the acquisition of knowledge, propels
learners with a “strong preference” in one learning style category toward a more balanced
position of a “less preferred” learning style modality.
Table 4
Cronbach Alpha Coefficients
Source n Act/Ref Sen/Int Vis/Vrb Seq/Glo
Current Study 184 0.60 0.71 0.70 0.60
Gonzales et al. (2017) 202 0.57 0.70 0.69 0.59
Felkel & Gosky (2012) 62 0.51 0.81 0.67 0.56
Hosford & Siders (2010) 358 0.63 0.76 0.64 0.62
Litzinger et al. (2007) 448 0.61 0.77 0.76 0.55
Cook & Smith (2006) 89 0.62 0.77 0.72 0.65
Cook (2005) 138 0.61 0.78 0.70 0.67
Tuckman (1999) suggests that a Cronbach alpha of .75 or greater is acceptable for
instruments that measure achievement in a subject area or mastery of a particular skill; and an
alpha of .5 or greater is acceptable for a preference or an attitude measurement. Therefore,
according to Tuckman (1999), the Cronbach alpha coefficients met acceptable the minimal limits
supporting the internal consistency reliability. With regards to the test-retest reliability, overall
analysis from multiple studies suggest moderate to strong reliability of the ILS instrument for
each measured population (Cook, 2005; Cook & Smith, 2006; Felder & Spurlin, 2005; Felkel &
Gosky, 2012; Zywno, 2003).
Preferred Teaching Methods
Two survey tools were used in this study to determine the preferred teaching methods of
student and faculty participants.
62
Student Survey. The Walker/Delahoyde Teaching Method Survey (WDTMS), a 30-item
questionnaire, was modified from the original Walker’s Teaching Method Survey (WTMS;
Appendix C) used by Walker et al. (2006) to examine the generational teaching method
preferences and expectations. The WDTMS includes examples of current teaching methods used
in the nursing classrooms, as well as a section for students to choose their top five teaching
method preferences. The instrument has a five-point Likert-Type data scale ranging from: 1 =
None at all; 2 = Occasionally; 3 = Frequently; 4 = Always; and 5 = Not applicable. A higher
score (3 or 4) indicates a higher preference to teaching preferences. The only modification in this
survey was the addition of demographics to include: the type of nursing program the student was
enrolled in; the state where the student attended nursing school; the number of nursing courses
completed; identifying gender as “other;” and, race/ethnicity. Permission to use, modify, and
adapt the original survey tool was requested and granted by Dr. Jean T. Walker (personal
communication, November 27, 2019; see appendix G) and Dr. Theresa Delahoyde (personal
communication, November 27, 2019; see appendix H).
Reliability and Validity. Walker’s original survey, WTMS, was found to have a
reliability coefficient, Cronbach’s alpha of .82, as well as construct validity from a panel of 15
expert nurse educators with more than 50 years of collective teaching experience (Walker et al.,
2006). This study found the Cronbach’s alpha for the WTMS to be .66 which is significantly less
than the original survey. One contributing factor to the discrepancy was that only 75% of the
students completed the WTMS portion of the overall student survey.
Delahoyde (2009) established construct validity for the modified WDTMS through a
pilot study conducted with faculty and students from a small, private college in the Midwest,
along with eliciting feedback from ten nursing education experts. However, the Cronbach’s alpha
63
was .67 and “was determined to be an ineffective measure of reliability for this type of research
tool, because each item on the faculty and student survey were measured separately” (p. 75).
Delahoyde (2009) acknowledged that “a test-retest may have been a better choice to determine
the reliability, but was not completed due to the time frame for which the study took place and
the inability to have the same participants each time” (p. 75).
The Cronbach’s alpha for this study was determined to be .64. Due to the global COVID-
19 pandemic occurring at the time of this study, a test-retest was not able to be performed.
However, the results of the WTMS reported here, while not conclusive, do provide additional
evidence for the internal consistency of this instrument.
Faculty Survey. The Delahoyde’s Teaching Method Faculty Survey (DTMFS), a 30-item
questionnaire, was used for nursing faculty participants to determine what teaching methods
were used in the classroom, in addition to, identifying the top five teaching methods used most
frequently (see Appendix J for faculty survey). The DTMFS has a five-point Likert-Type data
scale ranging from: 1 = None at all; 2 = Occasionally; 3 = Frequently; 4 = Always; and 5 = Not
applicable. A higher score (3 or 4) indicates teaching methods used in the classroom. The only
modification in this survey included: the state where the faculty taught; the type of program
where the faculty taught; the faculty’s highest degree earned; gender; and race/ethnicity.
Permission to use, modify, and adapt the original survey tool was requested and granted by Dr.
Jean T. Walker (personal communication, November 27, 2019; see appendix G) and Dr. Theresa
Delahoyde (personal communication, November 27, 2019; see appendix H).
Reliability and Validity. Walker’s original survey, WTMS, was found to have a
reliability coefficient, Cronbach’s alpha of .82, as well as, construct validity from a panel of 15
expert nurse educators with more than 50 years of collective teaching experience (Walker et al.,

64
2006). Construct validity was established for the modified DTMFS through a pilot study,
conducted with faculty and students from a small, private college in the Midwest and by eliciting
feedback from ten nursing education experts. The Cronbach’s alpha was determined to be .56
(Delahoyde, 2009). This study found the Cronbach’s alpha for the DTMFS to be .82 which
supports the internal consistency reliability of the instrument.
Protection of Human Subjects
Initial permission to conduct this study using the National Student Nurses’ Association
(NSNA) membership database to recruit study participants was obtained from the Institutional
Review Board (IRB) at East Tennessee State University (ETSU). However, due to the COVID-
19 global pandemic crisis, that option was suspended indefinitely, and the sample population was
changed to include nursing students and nursing faculty enrolled in, or teach in Diploma, ADN
or BSN nursing programs in the Southeastern United States. The IRB was notified, and approval
of the modification was received.
Additionally, upon request, IRB permission was obtained at some of the colleges and
universities included in the survey. The IRB permits were completed and submitted as requested.
Since the college where the researcher is employed was part of the sample population, the
director of nursing at the college, like all other nursing programs participating in the study,
distributed the recruitment letter and survey link via email to the student and faculty participants.
All undergraduate students enrolled in, and faculty who taught in, Diploma, ADN, and
BSN programs in the ten Southeastern states had equal opportunity to participate in the study. No
discrimination based on age, year in nursing program, gender, or race/ethnicity occurred. The
recruitment letter explained that the involvement in the study was strictly voluntary and could
cease at any time during the study.

65
Procedure
Upon receipt of IRB approval, an email introducing the study (see Appendix I) was sent
to the Dean/Director of Nursing at approximately 490 nursing programs in 12 Southeastern
states. The introductory email contained the participant recruitment letter (see Appendix J) which
included the electronic link to the SurveyMonkey® data collection instrument. If requested, proof
of the IRB approval and a copy of the survey was provided to the designated person from the
requesting college or university. The Dean/Director of Nursing, or other designated person was
responsible for sending the recruitment email with the electronic survey link to potential
participants. The recruitment letter explained the purpose of the study, eligibility criteria,
approximate time needed to complete the survey, and the electronic link to the SurveyMonkey®
data collection instrument. Additionally, the researcher’s email address and phone number were
provided in the recruitment letter sent via email to the participants for direct contact if questions
or concerns arose during the study.
To ensure confidentiality and privacy, the Dean/Director of Nursing or designee did not
release the students' email addresses but maintained responsibility for sending the broadcast
emails. No identifiable personal information was captured in the survey, and there was not any
financial compensation provided to survey participants. All students and faculty participating in
the study were given approximately four weeks to complete the survey. Due to schedule changes
in the colleges and universities caused by the unexpected global pandemic, an additional week
was allowed for participants to complete the survey.
Participation in the study was voluntary, and participants could decline to participate at
any time. The participants could only respond once to the survey using their choice of
technology with internet access. If they were interested in participating, participants were
66
instructed to click the link to the SurveyMonkey® data collection instrument. The first page of
the survey contained the detailed informed consent. The participants were instructed to click on
the “I agree to participate” link if they wished to continue with the survey. However, if they
clicked on the “I do not agree to participate” link, the participants were directed to the end of the
survey. Once study participants were recruited via broadcast email by their Dean/Director of
Nursing, they were able to complete the online survey during a five-week period in their own
environment. The participants’ anonymous raw data was organized within the Survey Monkey®
database, analyzed using Statistical Package for the Social Sciences (SPSS), Version 26.0, and
transferred to a secure encrypted USB drive. This encrypted USB drive will be kept secure for
three years, in a locked cabinet, in the Office of Research, within the College of Nursing at East
Tennessee State University in Johnson City, Tennessee.
Data Analysis Plan
The Statistical Package for the Social Sciences Version 26.0 (SPSS) was used for data
entry and analysis of the ILS, the WDTMS, the WTMS, the DTMFS, and demographic data.
Once the data was transferred into the SPSS computer program and checked for accuracy, both
descriptive and inferential statistical procedures were used to answer the research questions. The
statistical tests included: descriptive analysis and frequencies; Chi-Square (χ2) Test; One-sample
Wilcoxon signed-rank test; Likelihood-ratio Chi-square (LR χ2); Kruskal-Wallis; Kendall’s tau-
b; and the Pearson-r correlation.
Summary
This chapter provides in-depth discussion of the methods used to compare the
generational differences of undergraduate Diploma, ADN, and BSN nursing students’ preferred
teaching methods, identified learning style preference, and the teaching methods used by nursing
67
faculty. Included in this chapter was a description of how the population and sample were
recruited, selected, and protected. Detailed descriptions of the instruments were provided
including measurements of validity and reliability. Finally, the procedure for the study was
explained in detail, along with the methods of data reporting and analysis.
68
Chapter 4. Results
This study was designed to extend the knowledge of generational differences in
undergraduate nursing students’ learning styles preferences and preferred teaching methods
compared to the teaching methods used by nursing faculty. This chapter presents the data
analysis procedures, along with the corresponding results used to answer the research questions
in this study. There was a total of total of 251 participants: 184 nursing students and 67 nursing
faculty from colleges and universities across ten Southeastern states. During the analysis, two
nursing students started the survey but stopped midway through the learning style section which
resulted in a large amount of missing data; therefore, they were deleted from the final data
analysis. In addition, two nursing faculty who started the survey only completed the
demographic section; consequently, they were also deleted from the final data analysis.
The statistical program SPSS, Version 26.0, was used to analyze all of the data in this
research study. The specific statistical tests used include the following: descriptive analysis and
frequencies; Chi-Square (χ2); One-sample Wilcoxon signed-rank test; Likelihood-ratio Chi-
square (LR χ2) test; Kruskal-Wallis; Kendall’s tau-b; and, the Pearson-r correlation’s r test. Each
statistical test used in the data analysis for each specific aim is discussed within the text in its
respective section.
Student Demographics
One hundred eighty-four nursing students between the ages of 19 to 57 years with an
average age of 29 years, participated in the study. The following demographic questions were
asked on the student survey: birth year; gender; race/ethnicity; zip code of home address; state
where enrolled in nursing school; type of nursing program enrolled (Diploma, ADN, BSN); and,
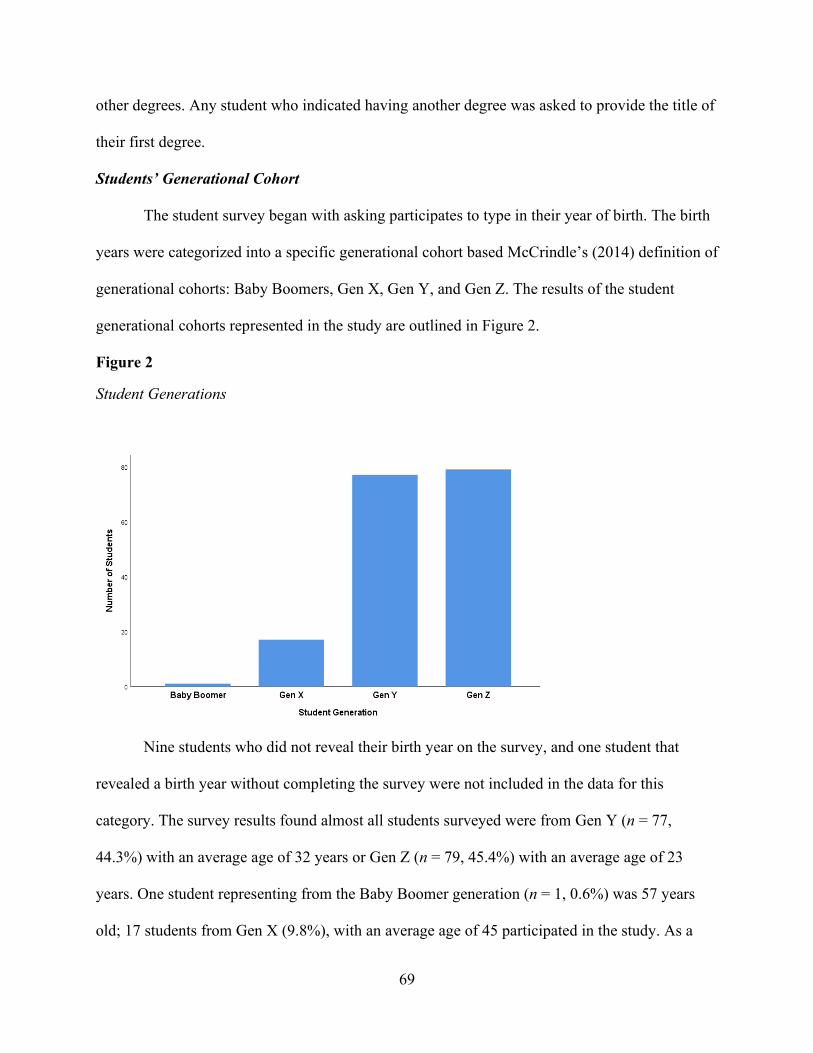
69
other degrees. Any student who indicated having another degree was asked to provide the title of
their first degree.
Students’ Generational Cohort
The student survey began with asking participates to type in their year of birth. The birth
years were categorized into a specific generational cohort based McCrindle’s (2014) definition of
generational cohorts: Baby Boomers, Gen X, Gen Y, and Gen Z. The results of the student
generational cohorts represented in the study are outlined in Figure 2.
Figure 2
Student Generations
Nine students who did not reveal their birth year on the survey, and one student that
revealed a birth year without completing the survey were not included in the data for this
category. The survey results found almost all students surveyed were from Gen Y (n = 77,
44.3%) with an average age of 32 years or Gen Z (n = 79, 45.4%) with an average age of 23
years. One student representing from the Baby Boomer generation (n = 1, 0.6%) was 57 years
old; 17 students from Gen X (9.8%), with an average age of 45 participated in the study. As a
70
result of these disproportionally low numbers, the data from the Baby Boomer and Gen X
students was not used during the final analysis of the relationships between the different
generations of students. Therefore, only the differences between Gen Y and Gen Z were
examined during the data analysis.
Students’ Gender
The student survey asked the participants to indicate their gender as female, male, or
other. The results indicated that 90.8% (n = 167) of the student participants were female and only
9.2% (n = 17) were male. No participate specified “other” as their gender. Nine students who did
not reveal their birth year on the survey and one student who revealed a birth year but did not
complete the survey were excluded from the results in this data category.
There were almost equal percentages of females in Gen Y (n = 70, 90.9%) and Gen Z (n
= 71, 89.9%). Only one female student represented the Baby Boomer generation, and 16 students
from Gen X were female (94.1%). As well, there were almost equal percentages of male student
participants in Gen Y (n = 7, 9.1%) and Gen Z (n = 8, 10.1%). There was only one male student
participant who represented Gen X in the study. The N for the overall gender demographic was
184 students and 174 for generational gender.
Students’ Race/Ethnicity
The student survey asked the participants to indicate their race/ethnicity. The majority of
the students 84.2% (n = 155) classified themselves as Caucasian, followed by 9.2% (n = 17)
African American students. The remaining ethnicities Asian (n = 3, 1.6%), Hispanic (n = 5,
2.7%), and another race (n = 4, 2.2%) were almost evenly distributed. Gen Y and Gen Z had
similar percentages of Asian, African American, Hispanic, Caucasian, and other ethnicities. Gen
71
X was a mixture of African American and Caucasian, while the Baby Boomer student was
Caucasian.
Students’ Nursing Program Location
The student survey asked the participants to identify the location of the nursing program
where they were enrolled in by a zip code. The results of the study indicated that 40.8% (n = 75)
of the students who participated in the study were enrolled in a nursing program in Tennessee.
Approximately, 36% of the students were from Alabama (n = 33, 17.9%) and North Carolina (n
= 34, 18.5%); and 14% were from Georgia (n = 13, 7.1%) and Virginia (n = 10, 5.4%). The
remaining 10% of the students were enrolled in nursing programs in Arkansas (n = 7, 3.8%),
Florida (n = 3, 1.6%), and Kentucky (n = 9, 4.9%). Most students from Gen X, Gen Y, and Gen
Z were enrolled in a nursing program in Tennessee, while the Baby Boomer student participant
was enrolled in Alabama.
Students’ Type of Nursing Program
The survey asked student participants to identify the type of nursing program they were
enrolled in and provide three options to choose from: Diploma, ADN, and BSN. The majority of
student participants, 59.2% (n = 109), indicated that they were enrolled in an ADN program. A
total of 72 (39.1%) students were enrolled in a BSN program, and only three (1.6 %) were
enrolled in a Diploma nursing program (see Figure 3). Nursing student participants from all four
generational cohorts were enrolled in an ADN program. Students from Gen X, Gen Y, and Gen
Z were enrolled in the BSN program, and students from Gen Y and Gen Z were enrolled in a
diploma program. The majority of students from each generation was enrolled in the ADN
program versus the BSN program.
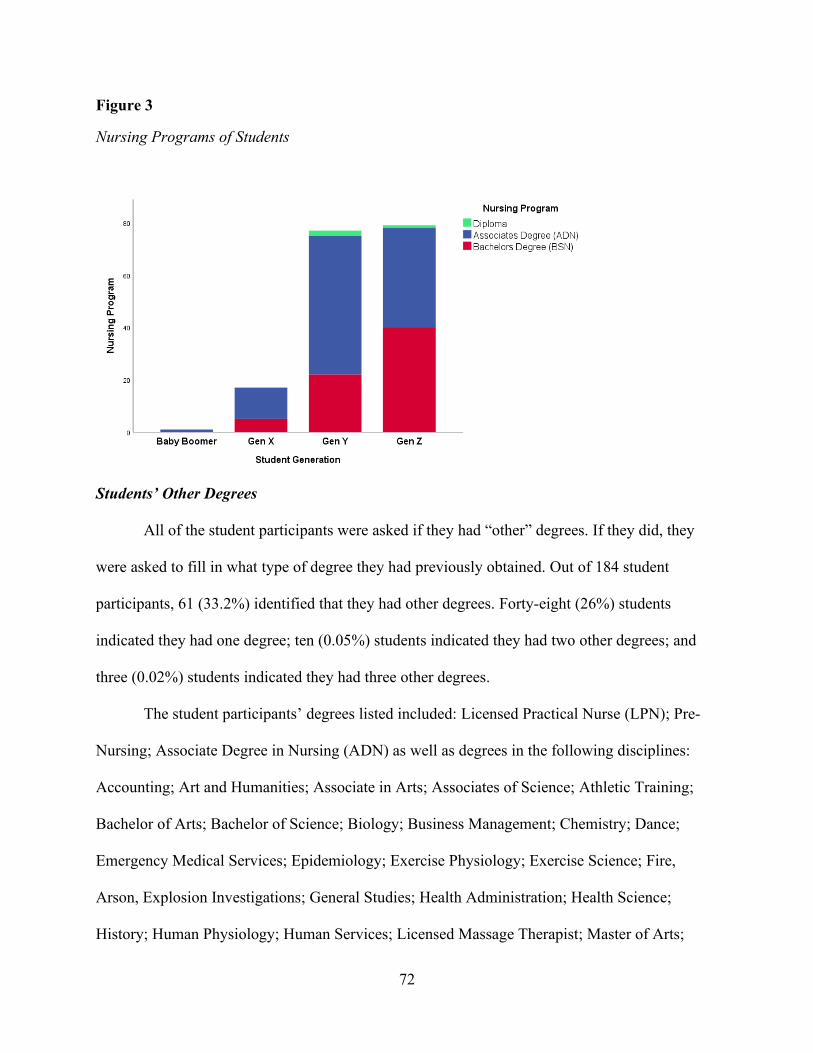
72
Figure 3
Nursing Programs of Students
Students’ Other Degrees
All of the student participants were asked if they had “other” degrees. If they did, they
were asked to fill in what type of degree they had previously obtained. Out of 184 student
participants, 61 (33.2%) identified that they had other degrees. Forty-eight (26%) students
indicated they had one degree; ten (0.05%) students indicated they had two other degrees; and
three (0.02%) students indicated they had three other degrees.
The student participants’ degrees listed included: Licensed Practical Nurse (LPN); Pre-
Nursing; Associate Degree in Nursing (ADN) as well as degrees in the following disciplines:
Accounting; Art and Humanities; Associate in Arts; Associates of Science; Athletic Training;
Bachelor of Arts; Bachelor of Science; Biology; Business Management; Chemistry; Dance;
Emergency Medical Services; Epidemiology; Exercise Physiology; Exercise Science; Fire,
Arson, Explosion Investigations; General Studies; Health Administration; Health Science;
History; Human Physiology; Human Services; Licensed Massage Therapist; Master of Arts;
73
Master of Public Health; Medical Assisting; Medical Office Management; Nutrition and Foods;
Paramedic; Physical Education; Physical Therapy Assistance (PTA); Pre-Health; Public Health;
Religion; and, Safety, Security, and Emergency Management.
Faculty Demographics
Sixty-seven nursing faculty participated in the study. Ranging from 31 to 65 years of age,
with the average age being 52 years old, the faculty taught in the same colleges and universities
as the student participants. The demographic section included questions to identity their
generation by the year of birth; gender; race/ethnicity; zip code where they lived; the type of
nursing program where they taught (Diploma, ADN, BSN); the number of years of teaching
experience; and, the highest degree they had earned.
Faculty Generational Cohorts
The generational cohorts of faculty were classified in the same method as the student
generations using McCrindle’s (2014) definition of Baby Boomers, Gen X, Gen Y, and Gen Z.
Only 62 (92.5%) nursing faculty participates provided their year of birth, identifying their
generational cohort. The remaining five (7.5%) nursing faculty who did not reveal their birth
year on the survey were excluded from the results in this data category. The results found 84% (n
= 52) of the nursing faculty nearly evenly distributed between the Baby Boomers (n = 24,
38.7%) with an average age of 60 years old and Gen X (n = 28, 45.2%) with the average age
being fifty. The remaining 16% (n = 10) of faculty participants was from Gen Y had an average
age of 37 years as seen in Figure 4.

74
Figure 4
Faculty Generations
Faculty Gender
The faculty participants were asked to indicate their gender as female, male, or other. As
expected, the results indicated that 92.5% (n = 62) of the faculty participants were female and
with 7.5% (n = 5) were male. No nursing faculty specified “other” as their gender. With regards
to the distribution of gender across the generations, the results showed approximately 77% (n =
48) of the female nursing faculty were evenly distributed between the Baby Boomers (n = 22,
35.4%) and Generation X (n = 26, 41.9%). The remaining 15% (n = 9) faculty participants were
from Generation Y. The five (7.5%) nursing faculty who omitted their birth year on the survey
were excluded from the results in this data category.
Faculty Race/Ethnicity
The majority of the nursing faculty who participated in the study were predominantly
Caucasian (n = 52, 84.8%). Almost 10% of the faculty were African American (n = 6) and the
remaining ethnicities: Asian (n = 1, 1.5%); American Indian or Alaska Natives (n = 1, 1.5%);
and, Hispanics (n = 2, 3%) being evenly distributed. Nursing faculty from the Baby Boomer
generation were comprised of two ethnicities, Caucasian (n = 22, 91.7%) and African American
75
(n= 2, 8.3%). Gen X represented four ethnicities: American Indian or Alaska Natives (n = 1,
3.8%); African American (n = 2, 7.1%); Hispanic (n = 2, 7.1%); and Caucasian (n = 23, 82.1%).
The least number of nursing faculty participants were from Gen Y, and they were composed of
Asian (n = 1, 10%), African American (n = 2, 20%), and Caucasian (n = 7, 70%) ethnicities.
Faculty Nursing Program Location
The faculty survey asked the participants to identify the location zip code. of the nursing
program where they taught. The results of the study indicated that over half of the faculty who
participated in the study taught in a nursing program in either Alabama (n = 20, 30.3%) or
Tennessee (n = 14, 21.2%). Almost 26% of the faculty taught in either Florida (n = 8, 12.1%) or
North Carolina (n = 9, 13.6%). The remaining faculty taught in Arkansas (n = 5, 7.6%); Georgia
(n = 3, 4.5%); Kentucky (n = 2, 3%); Louisiana (n = 3, 4.5%); South Carolina (n = 1, 1.5%); and,
West Virginia (n = 1, 1.5%). Although the majority of faculty were either Baby Boomers (n =
24) or part of Gen X (n = 27), nursing faculty from all three generations were relatively
represented across most states that participated in the study.
Faculty Type of Nursing Program
The faculty participants were asked to identify the type of nursing program in which they
taught from the following options: Diploma, ADN, and BSN. The results showed that the
majority of faculty 71.6% (n = 48) teach in an ADN program, with the remaining faculty
teaching in either a BSN program (n = 18, 26.9%) or a Diploma nursing program (n = 1. 1.5%).
More nursing faculty from each generation taught in the ADN programs than the BSN programs.
Only one faculty taught in the Diploma program, and they represented Gen X. Figure 5 displays
the distribution of data for each of the four options where the faculty taught.
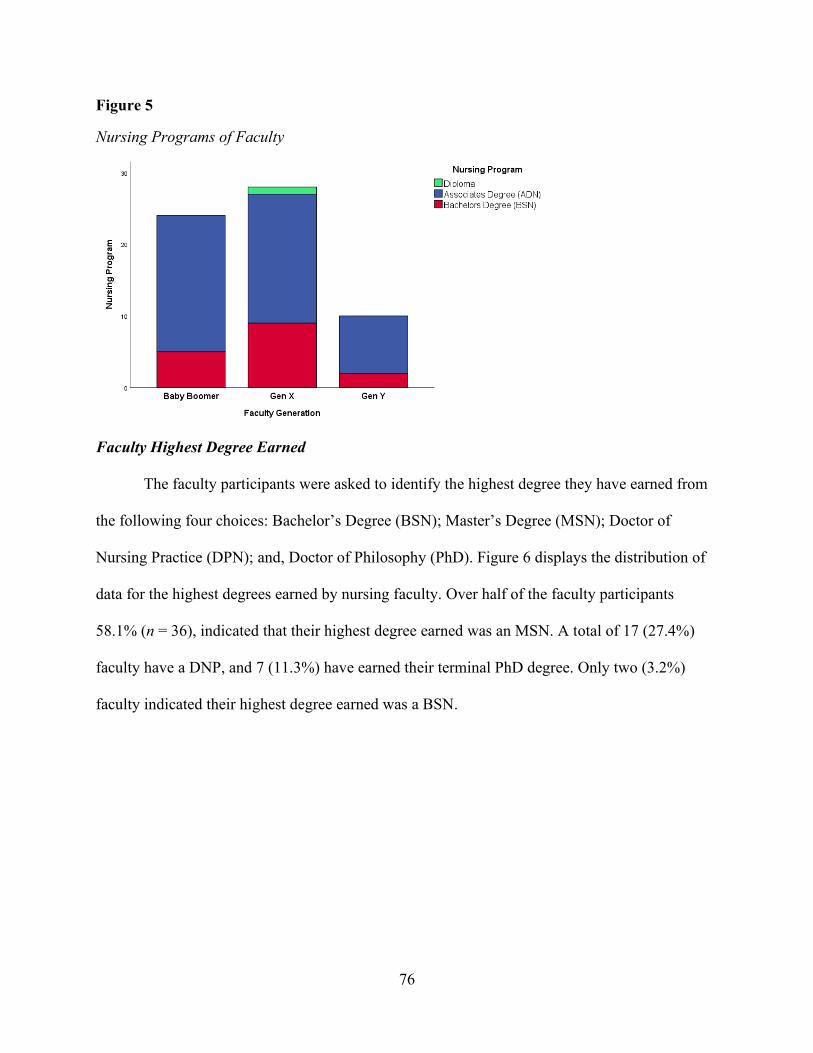
76
Figure 5
Nursing Programs of Faculty
Faculty Highest Degree Earned
The faculty participants were asked to identify the highest degree they have earned from
the following four choices: Bachelor’s Degree (BSN); Master’s Degree (MSN); Doctor of
Nursing Practice (DPN); and, Doctor of Philosophy (PhD). Figure 6 displays the distribution of
data for the highest degrees earned by nursing faculty. Over half of the faculty participants
58.1% (n = 36), indicated that their highest degree earned was an MSN. A total of 17 (27.4%)
faculty have a DNP, and 7 (11.3%) have earned their terminal PhD degree. Only two (3.2%)
faculty indicated their highest degree earned was a BSN.

77
Figure 6
Highest Degree Earned for Faculty
The faculty were given the opportunity to specify their specialty area for DNP or PhD. A
total of thirteen out of 67 faculty chose the “other” option and submitted their specialty area for
their highest earned degree. The following specialty areas were documented: EdD (n = 5); MSN
in Executive Nursing Leadership (n = 1); MSN in Nursing Education (n = 1); MSN in Pediatrics
(n = 1); PhD in Nursing Science (n = 2); PhD in Curriculum & Instruction (n = 1); and, PhD in
Nursing (n = 1). One faculty participate documented a “DrPH.”
Faculty Years Taught
The faculty were asked to disclose the numbers of years they have taught in a nursing
program. The number of years of the faculty participants ranged from one to thirty-five years
with a mean of 11.1 years. Although more faculty from Gen X participated in the study, the
faculty from the Baby Boomer generation (n = 23, 38.7%) had more years of teaching experience
M = 15.41, than the Gen X faculty participants (M = 9.06) or the Gen Y faculty participants (M =
4.8).
78
Specific Aim I
Aim I: To compare the generational differences of undergraduate nursing students’
learning style preferences.
H1. There are statistically significant differences in the learning style preferences of
undergraduate nursing students based on the generational cohort in which they belong.
H0. There are no statistically significant differences in the learning style preferences of
undergraduate nursing students based on the generational cohort in which they belong.
Using the Index of Learning Styles® survey (Appendix A), the student participants were
asked to answer a 44-question survey designed to assess 11 items in four dimensions of preferred
learning styles: active-reflective, sensing-intuitive, visual-verbal, and sequential-global. Each
question had two possible answers which were coded as (a = 1; positive value) or (b = -1;
negative value), from which the student had to choose the one that applied to them more
frequently. In the first dimension, the learning style active was coded (a) and the learning style
reflective was coded (b). In the second dimension, the learning style sensing was coded (a) and
the learning style intuitive was coded (b). In the third dimension, the learning style visual was
coded (a) and the learning style verbal was coded (b). And in the last dimension, the learning
style sequential was coded (a) and the learning style global was coded (b).
Once the students answered the questions for each dimension, the numbers corresponding
from each learning style were tabulated and the difference was calculated ranging from 11 to -11.
The learning style with the largest value was identified as the learning style preference. The
value was then used to determine if the student had a mild (or balanced) preference [score 1 to 3,
or -1 to -3]) between the two learning styles in the dimension; a moderate preference [score 5 to
7, or -5 to -7]; or, a strong preference [score 9 to 11 or -9 to -11] for the identified learning style.
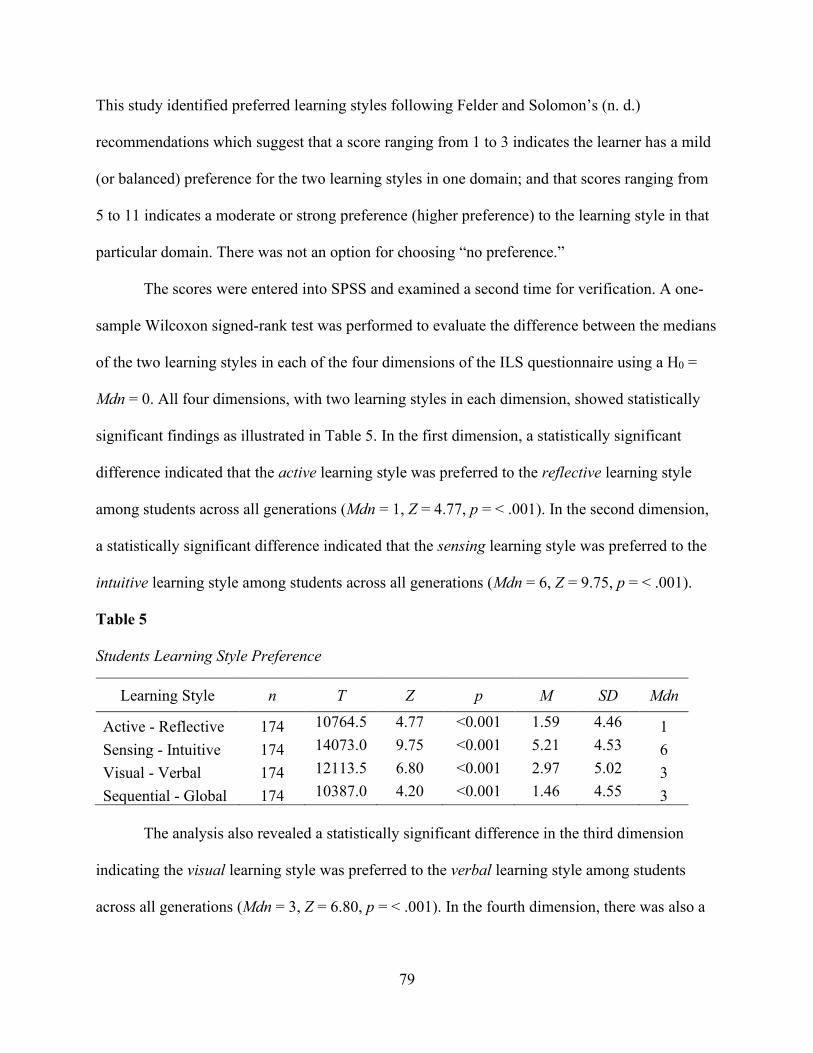
79
This study identified preferred learning styles following Felder and Solomon’s (n. d.)
recommendations which suggest that a score ranging from 1 to 3 indicates the learner has a mild
(or balanced) preference for the two learning styles in one domain; and that scores ranging from
5 to 11 indicates a moderate or strong preference (higher preference) to the learning style in that
particular domain. There was not an option for choosing “no preference.”
The scores were entered into SPSS and examined a second time for verification. A one-
sample Wilcoxon signed-rank test was performed to evaluate the difference between the medians
of the two learning styles in each of the four dimensions of the ILS questionnaire using a H0 =
Mdn = 0. All four dimensions, with two learning styles in each dimension, showed statistically
significant findings as illustrated in Table 5. In the first dimension, a statistically significant
difference indicated that the active learning style was preferred to the reflective learning style
among students across all generations (Mdn = 1, Z = 4.77, p = < .001). In the second dimension,
a statistically significant difference indicated that the sensing learning style was preferred to the
intuitive learning style among students across all generations (Mdn = 6, Z = 9.75, p = < .001).
Table 5
Students Learning Style Preference
Learning Style n T Z p M SD Mdn
Active - Reflective 174 10764.5 4.77 <0.001 1.59 4.46 1
Sensing - Intuitive 174 14073.0 9.75 <0.001 5.21 4.53 6
Visual - Verbal 174 12113.5 6.80 <0.001 2.97 5.02 3
Sequential - Global 174 10387.0 4.20 <0.001 1.46 4.55 3
The analysis also revealed a statistically significant difference in the third dimension
indicating the visual learning style was preferred to the verbal learning style among students
across all generations (Mdn = 3, Z = 6.80, p = < .001). In the fourth dimension, there was also a
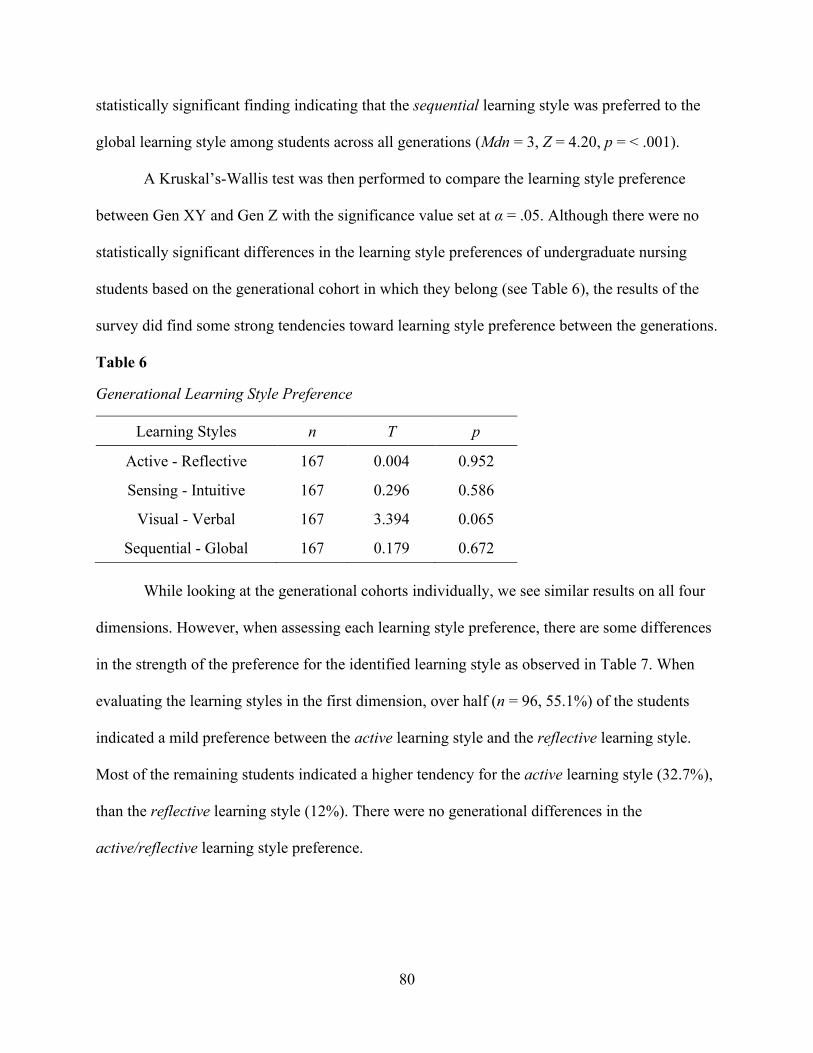
80
statistically significant finding indicating that the sequential learning style was preferred to the
global learning style among students across all generations (Mdn = 3, Z = 4.20, p = < .001).
A Kruskal’s-Wallis test was then performed to compare the learning style preference
between Gen XY and Gen Z with the significance value set at α = .05. Although there were no
statistically significant differences in the learning style preferences of undergraduate nursing
students based on the generational cohort in which they belong (see Table 6), the results of the
survey did find some strong tendencies toward learning style preference between the generations.
Table 6
Generational Learning Style Preference
Learning Styles n T p
Active - Reflective 167 0.004 0.952
Sensing - Intuitive 167 0.296 0.586
Visual - Verbal 167 3.394 0.065
Sequential - Global 167 0.179 0.672
While looking at the generational cohorts individually, we see similar results on all four
dimensions. However, when assessing each learning style preference, there are some differences
in the strength of the preference for the identified learning style as observed in Table 7. When
evaluating the learning styles in the first dimension, over half (n = 96, 55.1%) of the students
indicated a mild preference between the active learning style and the reflective learning style.
Most of the remaining students indicated a higher tendency for the active learning style (32.7%),
than the reflective learning style (12%). There were no generational differences in the
active/reflective learning style preference.
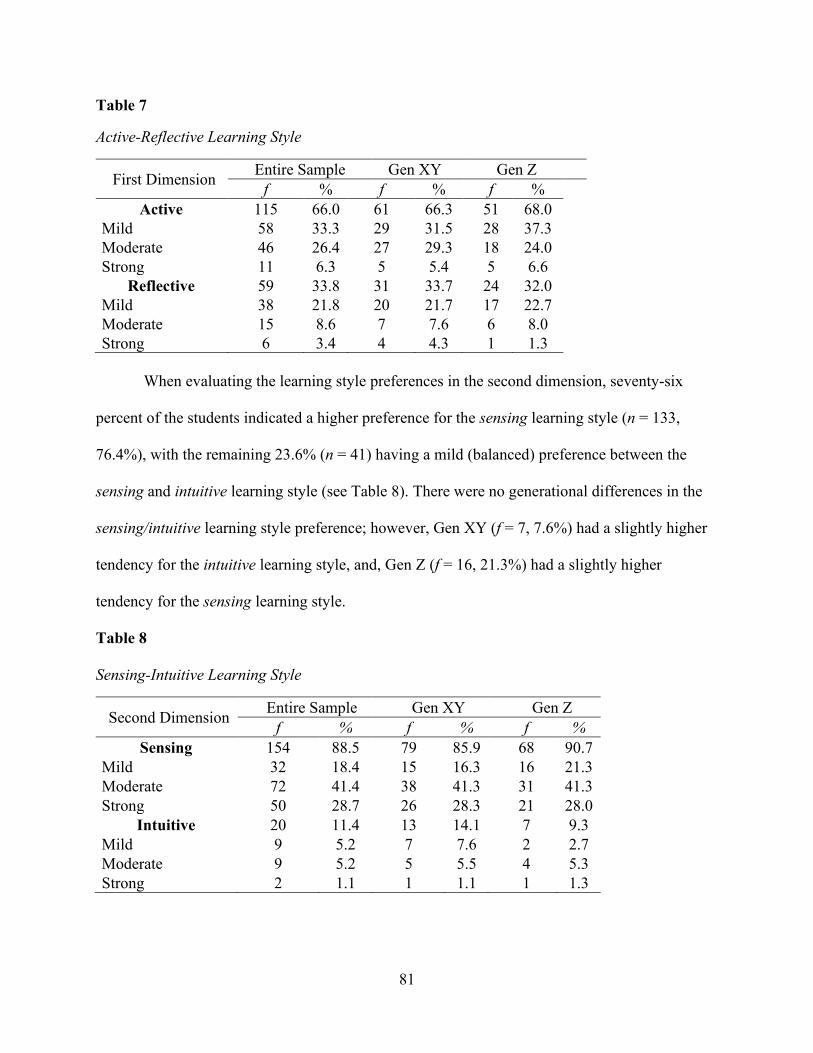
81
Table 7
Active-Reflective Learning Style
First Dimension Entire Sample Gen XY Gen Z
f % f % f %
Active 115 66.0 61 66.3 51 68.0
Mild 58 33.3 29 31.5 28 37.3
Moderate 46 26.4 27 29.3 18 24.0
Strong 11 6.3 5 5.4 5 6.6
Reflective 59 33.8 31 33.7 24 32.0
Mild 38 21.8 20 21.7 17 22.7
Moderate 15 8.6 7 7.6 6 8.0
Strong 6 3.4 4 4.3 1 1.3
When evaluating the learning style preferences in the second dimension, seventy-six
percent of the students indicated a higher preference for the sensing learning style (n = 133,
76.4%), with the remaining 23.6% (n = 41) having a mild (balanced) preference between the
sensing and intuitive learning style (see Table 8). There were no generational differences in the
sensing/intuitive learning style preference; however, Gen XY (f = 7, 7.6%) had a slightly higher
tendency for the intuitive learning style, and, Gen Z (f = 16, 21.3%) had a slightly higher
tendency for the sensing learning style.
Table 8
Sensing-Intuitive Learning Style
Second Dimension Entire Sample Gen XY Gen Z
f % f % f %
Sensing 154 88.5 79 85.9 68 90.7
Mild 32 18.4 15 16.3 16 21.3
Moderate 72 41.4 38 41.3 31 41.3
Strong 50 28.7 26 28.3 21 28.0
Intuitive 20 11.4 13 14.1 7 9.3
Mild 9 5.2 7 7.6 2 2.7
Moderate 9 5.2 5 5.5 4 5.3
Strong 2 1.1 1 1.1 1 1.3
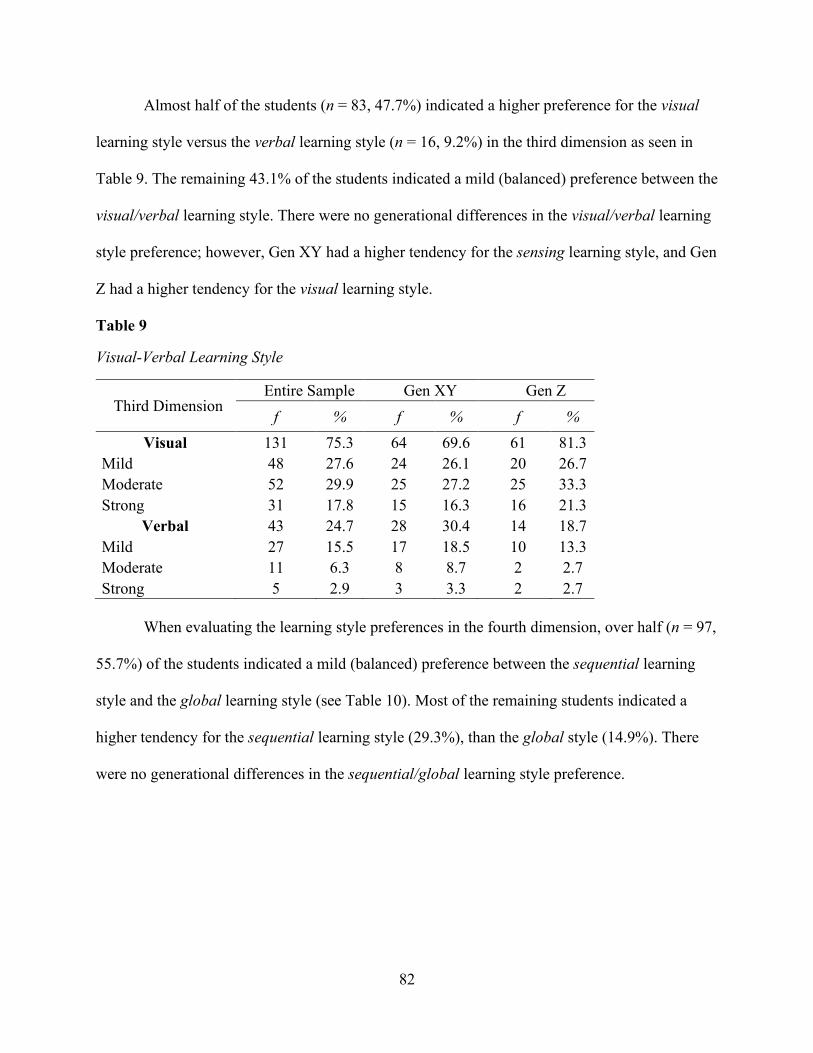
82
Almost half of the students (n = 83, 47.7%) indicated a higher preference for the visual
learning style versus the verbal learning style (n = 16, 9.2%) in the third dimension as seen in
Table 9. The remaining 43.1% of the students indicated a mild (balanced) preference between the
visual/verbal learning style. There were no generational differences in the visual/verbal learning
style preference; however, Gen XY had a higher tendency for the sensing learning style, and Gen
Z had a higher tendency for the visual learning style.
Table 9
Visual-Verbal Learning Style
Third Dimension Entire Sample Gen XY Gen Z
f % f % f %
Visual 131 75.3 64 69.6 61 81.3
Mild 48 27.6 24 26.1 20 26.7
Moderate 52 29.9 25 27.2 25 33.3
Strong 31 17.8 15 16.3 16 21.3
Verbal 43 24.7 28 30.4 14 18.7
Mild 27 15.5 17 18.5 10 13.3
Moderate 11 6.3 8 8.7 2 2.7
Strong 5 2.9 3 3.3 2 2.7
When evaluating the learning style preferences in the fourth dimension, over half (n = 97,
55.7%) of the students indicated a mild (balanced) preference between the sequential learning
style and the global learning style (see Table 10). Most of the remaining students indicated a
higher tendency for the sequential learning style (29.3%), than the global style (14.9%). There
were no generational differences in the sequential/global learning style preference.
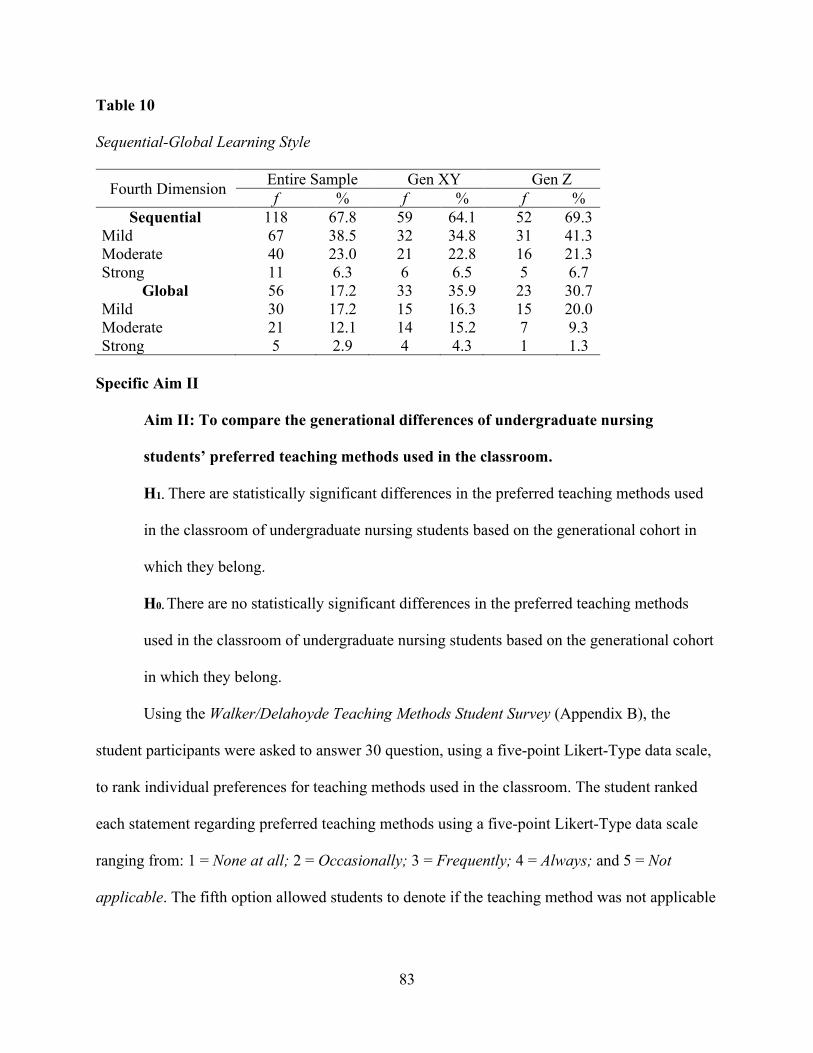
83
Table 10
Sequential-Global Learning Style
Fourth Dimension Entire Sample Gen XY Gen Z
f % f % f %
Sequential 118 67.8 59 64.1 52 69.3
Mild 67 38.5 32 34.8 31 41.3
Moderate 40 23.0 21 22.8 16 21.3
Strong 11 6.3 6 6.5 5 6.7
Global 56 17.2 33 35.9 23 30.7
Mild 30 17.2 15 16.3 15 20.0
Moderate 21 12.1 14 15.2 7 9.3
Strong 5 2.9 4 4.3 1 1.3
Specific Aim II
Aim II: To compare the generational differences of undergraduate nursing
students’ preferred teaching methods used in the classroom.
H1. There are statistically significant differences in the preferred teaching methods used
in the classroom of undergraduate nursing students based on the generational cohort in
which they belong.
H0. There are no statistically significant differences in the preferred teaching methods
used in the classroom of undergraduate nursing students based on the generational cohort
in which they belong.
Using the Walker/Delahoyde Teaching Methods Student Survey (Appendix B), the
student participants were asked to answer 30 question, using a five-point Likert-Type data scale,
to rank individual preferences for teaching methods used in the classroom. The student ranked
each statement regarding preferred teaching methods using a five-point Likert-Type data scale
ranging from: 1 = None at all; 2 = Occasionally; 3 = Frequently; 4 = Always; and 5 = Not
applicable. The fifth option allowed students to denote if the teaching method was not applicable
84
to their classroom experience. If the fifth option was chosen by the students, that option was
coded as “missing data” and was not included in the results.
Student Survey Part 1
Student Survey Results for Questions 1-23
Questions one through 23 on the student survey asked student participants to rank their
preferences for specific teaching methods used by nursing faculty in the classroom. The teaching
methods included: lecture and application of skills; working in groups versus individually; the
use of case studies, visual aids, and drawings; participation in class discussion; web-based or
combination class; the use of storytelling, technology, and games; reading before or after class;
having handouts versus taking own notes; and, interaction with faculty and peers, classroom
structure, and classroom environment.
The Likelihood-ratio Chi-square (LR χ2) test for association was performed to test for
differences in preferred teaching methods among generational cohorts. A LR χ2 test, based on the
ratio of the observed to the expected frequencies, was used to avoid problems with small cell
counts due to low sample population (Polit & Beck, 2012). Table 11 reveals the results from the
LR χ2 test for questions one through 23 on the student survey for teaching method preferences
based on a significance level of α = .05. The “never/occasionally” results were omitted from the
tables for clarity. There were five statistically significant differences identified.

85
Table 11
Student Survey Results Questions 1-23
Teaching Methods n Gen XY Gen Z
χ2 p Freq/Always Freq/Always
Q1- lecture 156 87.2% 81.4% 0.99 .321
Q2- apply skills 156 87.2% 75.7% 3.45 .063
Q3- work in groups 156 18.6% 31.4% 3.43 .064
Q4- case study 153 42.9% 30.4% 2.52 .112
Q5- visual aids 156 84.9% 88.6% 0.46 .500
Q6- work individually 156 77.9% 62.9% 4.25 .039
Q7- listen vs. participate 156 45.3% 62.9% 4.79 .029
Q8- draw concepts 154 69.4% 69.6% <0.001 .984
Q9- web-based course 156 20.9% 20.0% 0.021 .886
Q10- storytelling 156 83.7% 91.4% 2.12 .146
Q11- read prior to class 156 86.0% 80.0% 1.01 .315
Q12- handouts 155 71.8% 72.9% 0.02 .880
Q13- interaction 156 52.3% 37.1% 3.61 .057
Q14- combo web & class 156 48.8% 40.0% 1.22 .269
Q15- read, then listen 154 52.9% 40.6% 2.34 .126
Q16- technology 156 79.1% 62.9% 5.00 .025
Q17- lecture vs. group work 156 66.3% 42.9% 8.63 .003
Q18- active participation 155 58.8% 61.4% 0.11 .742
Q19- games 155 40.7% 53.6% 2.58 .109
Q20- read after class 157 78.2% 94.3% 8.82 .003
Q21- structure 156 48.8% 34.3% 3.37 .066
Q22- own notes 155 48.2% 34.3% 3.09 .079
Q23- variety teaching methods 157 60.9% 64.3% 0.19 .665
Note: Significant results at α=.05 indicated in boldface; df =1; Freq/Always = Frequently/Always
The first statistically significant finding was the student’s preference for working
individually on assignments versus working in a group with peers, LR χ2 (1, n = 156) = 4.25, p =
.0329. The results of the survey found that Gen XY students (77.9%) had a higher preference for
working individually then in a group on assignments, as compared to Gen X students (62.9%).
86
The second statistically significant finding was the student’s preference to listen versus
participate during class discussions, LR χ2 (1, n = 156) = 4.79, p = .029. The result of the survey
found that students in Gen Z (62.9%) indicated a higher preference for listening to lecture versus
participating in class discussion, as compared to students Gen XY (54.7%).
The third statistically significant finding between Gen XY and Gen Z, was participating
in activities that involved the use of technology during class to help learn new concepts, LR χ2
(1, n = 156) = 5.00, p = .025. The results found that students in Gen XY (79.1%) indicated a
higher preference than students in Gen Z (62.9%) for using technology for learning.
The fourth statistically significant finding was the students’ preference for listening to the
faculty lecture rather than working in groups with peers on in-class assignments, LR χ2 (1, n =
156) = 8.64, p = .003. Students in Gen XY (66.3%) revealed a higher preference for lecture over
group work, as compared to the students in Gen Z (57.1%).
The fifth statistically significant finding in preferred teaching methods between students
in Gen XY and Gen Z was the importance of reading the assignment after class versus reading
prior to class, LR χ2 (1, n = 157) = 8.82, p = .003. The students in Gen Z (94.3%) expressed a
higher preference for reading after class than the students in Gen XY (78.2%).
The results of the first 23 questions were further analyzed, and the top five teaching
methods that the student participants indicated that they preferred “frequently/always” to be used
in the classroom is illustrated in Table 12. Non-respondents were counted as never or
occasionally. Storytelling (n = 136, 87.2%) was identified as the preferred teaching method
followed by using visual aids (n = 135, 86.5%); reading after class (n = 134, 85.4%); listening to
lecture (n = 132, 84.6%); and, reading before class (n = 130, 83.3%).

87
Table 12
Students' Preferred Teaching Methods (Q1-23)
Teaching Methods Entire Sample Gen XY Gen Z
n % f % f %
Storytelling 136 87.2 72 83.7 64 91.4
Visual Aids 135 86.5 73 84.9 62 88.6
Read after Class 134 85.4 68 78.2 66 94.3
Lecture 132 84.6 75 87.2 57 81.4
Read prior to Class 130 83.3 74 86.0 56 80.0
When comparing generational cohorts, table 13 reveals the top five teaching methods
from students in Gen XY: the application of skills in the classroom and lecture at 87.2%; reading
before to class (86.0%); the use of visual aids (84.9%); and, storytelling (83.7%).
Table 13
Gen XY’s Preferred Teaching Methods (Q1-23)
Gen XY f %
Application of Skills in Classroom 75 87.20%
Lecture 75 87.20%
Read prior to class 74 86.00%
Visual Aids 73 84.90%
Storytelling 72 83.70%
The top five preferred teaching methods indicated by students in Gen Z was slightly
different then students in Gen XY as seen in Table 14. Reading after class (94.3%) was identified
as Gen Z students’ preferred teaching method to be used in the classroom, followed by
storytelling (91.4%); the use of visual aids (88.6%); listening to lecture (81.4%); and, reading
prior to class (80.0%).
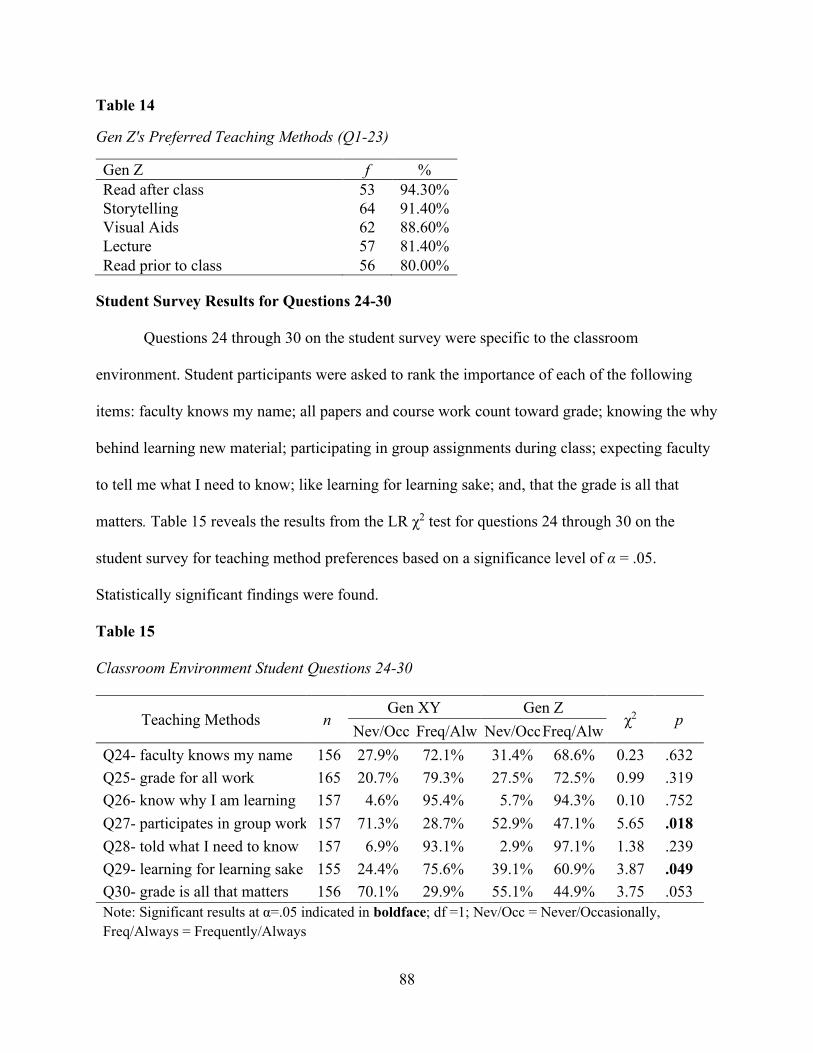
88
Table 14
Gen Z's Preferred Teaching Methods (Q1-23)
Gen Z f %
Read after class 53 94.30%
Storytelling 64 91.40%
Visual Aids 62 88.60%
Lecture 57 81.40%
Read prior to class 56 80.00%
Student Survey Results for Questions 24-30
Questions 24 through 30 on the student survey were specific to the classroom
environment. Student participants were asked to rank the importance of each of the following
items: faculty knows my name; all papers and course work count toward grade; knowing the why
behind learning new material; participating in group assignments during class; expecting faculty
to tell me what I need to know; like learning for learning sake; and, that the grade is all that
matters. Table 15 reveals the results from the LR χ2 test for questions 24 through 30 on the
student survey for teaching method preferences based on a significance level of α = .05.
Statistically significant findings were found.
Table 15
Classroom Environment Student Questions 24-30
Teaching Methods n Gen XY Gen Z
χ2 p Nev/Occ Freq/Alw Nev/Occ Freq/Alw
Q24- faculty knows my name 156 27.9% 72.1% 31.4% 68.6% 0.23 .632
Q25- grade for all work 165 20.7% 79.3% 27.5% 72.5% 0.99 .319
Q26- know why I am learning 157 4.6% 95.4% 5.7% 94.3% 0.10 .752
Q27- participates in group work 157 71.3% 28.7% 52.9% 47.1% 5.65 .018
Q28- told what I need to know 157 6.9% 93.1% 2.9% 97.1% 1.38 .239
Q29- learning for learning sake 155 24.4% 75.6% 39.1% 60.9% 3.87 .049
Q30- grade is all that matters 156 70.1% 29.9% 55.1% 44.9% 3.75 .053
Note: Significant results at α=.05 indicated in boldface; df =1; Nev/Occ = Never/Occasionally,
Freq/Always = Frequently/Always
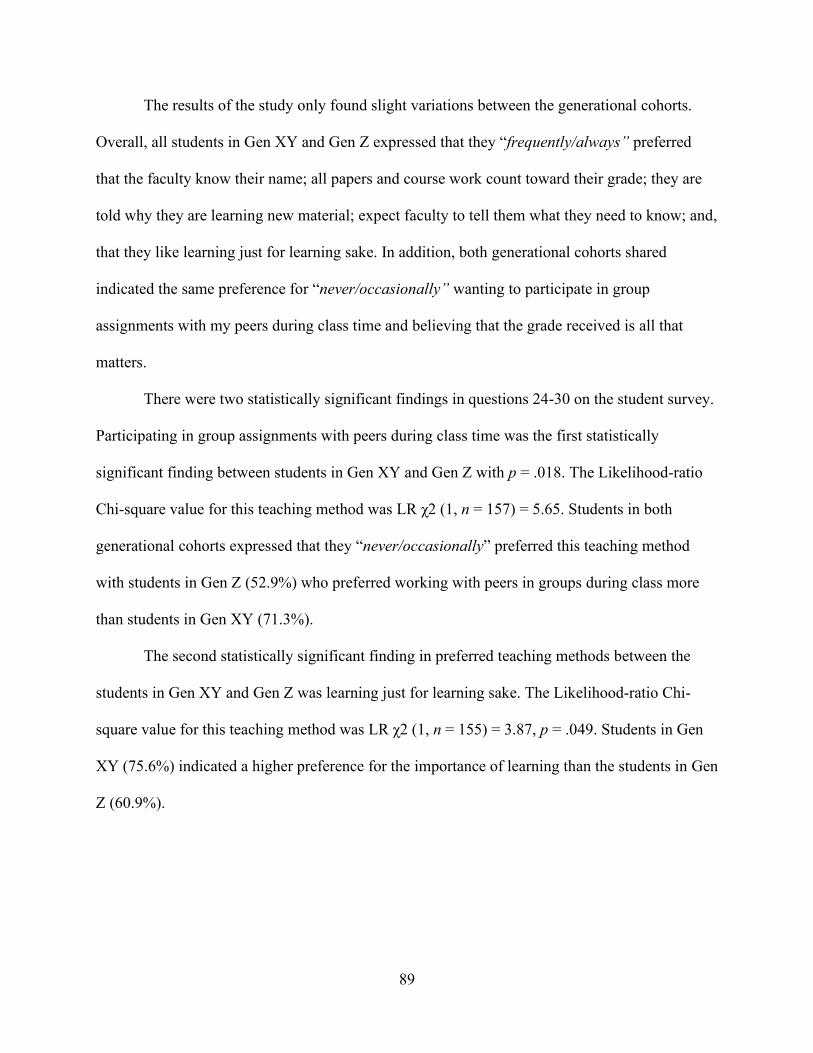
89
The results of the study only found slight variations between the generational cohorts.
Overall, all students in Gen XY and Gen Z expressed that they “frequently/always” preferred
that the faculty know their name; all papers and course work count toward their grade; they are
told why they are learning new material; expect faculty to tell them what they need to know; and,
that they like learning just for learning sake. In addition, both generational cohorts shared
indicated the same preference for “never/occasionally” wanting to participate in group
assignments with my peers during class time and believing that the grade received is all that
matters.
There were two statistically significant findings in questions 24-30 on the student survey.
Participating in group assignments with peers during class time was the first statistically
significant finding between students in Gen XY and Gen Z with p = .018. The Likelihood-ratio
Chi-square value for this teaching method was LR χ2 (1, n = 157) = 5.65. Students in both
generational cohorts expressed that they “never/occasionally” preferred this teaching method
with students in Gen Z (52.9%) who preferred working with peers in groups during class more
than students in Gen XY (71.3%).
The second statistically significant finding in preferred teaching methods between the
students in Gen XY and Gen Z was learning just for learning sake. The Likelihood-ratio Chi-
square value for this teaching method was LR χ2 (1, n = 155) = 3.87, p = .049. Students in Gen
XY (75.6%) indicated a higher preference for the importance of learning than the students in Gen
Z (60.9%).
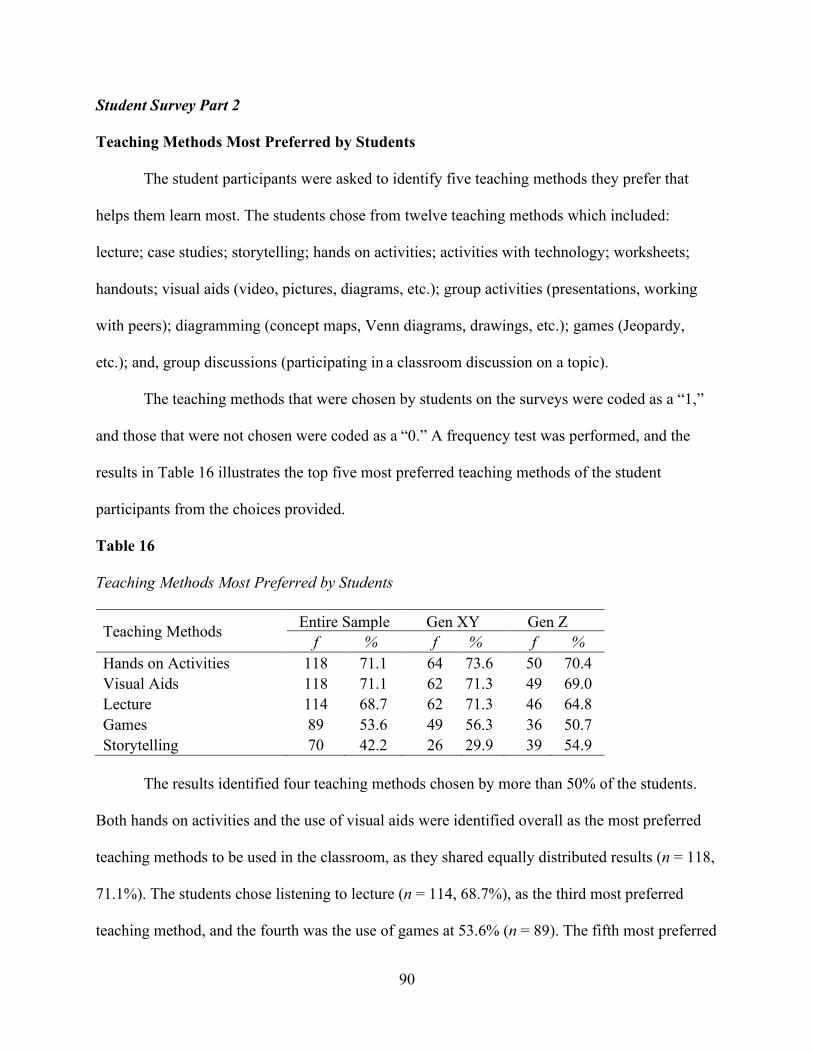
90
Student Survey Part 2
Teaching Methods Most Preferred by Students
The student participants were asked to identify five teaching methods they prefer that
helps them learn most. The students chose from twelve teaching methods which included:
lecture; case studies; storytelling; hands on activities; activities with technology; worksheets;
handouts; visual aids (video, pictures, diagrams, etc.); group activities (presentations, working
with peers); diagramming (concept maps, Venn diagrams, drawings, etc.); games (Jeopardy,
etc.); and, group discussions (participating in a classroom discussion on a topic).
The teaching methods that were chosen by students on the surveys were coded as a “1,”
and those that were not chosen were coded as a “0.” A frequency test was performed, and the
results in Table 16 illustrates the top five most preferred teaching methods of the student
participants from the choices provided.
Table 16
Teaching Methods Most Preferred by Students
Teaching Methods Entire Sample Gen XY Gen Z
f % f % f %
Hands on Activities 118 71.1 64 73.6 50 70.4
Visual Aids 118 71.1 62 71.3 49 69.0
Lecture 114 68.7 62 71.3 46 64.8
Games 89 53.6 49 56.3 36 50.7
Storytelling 70 42.2 26 29.9 39 54.9
The results identified four teaching methods chosen by more than 50% of the students.
Both hands on activities and the use of visual aids were identified overall as the most preferred
teaching methods to be used in the classroom, as they shared equally distributed results (n = 118,
71.1%). The students chose listening to lecture (n = 114, 68.7%), as the third most preferred
teaching method, and the fourth was the use of games at 53.6% (n = 89). The fifth most preferred
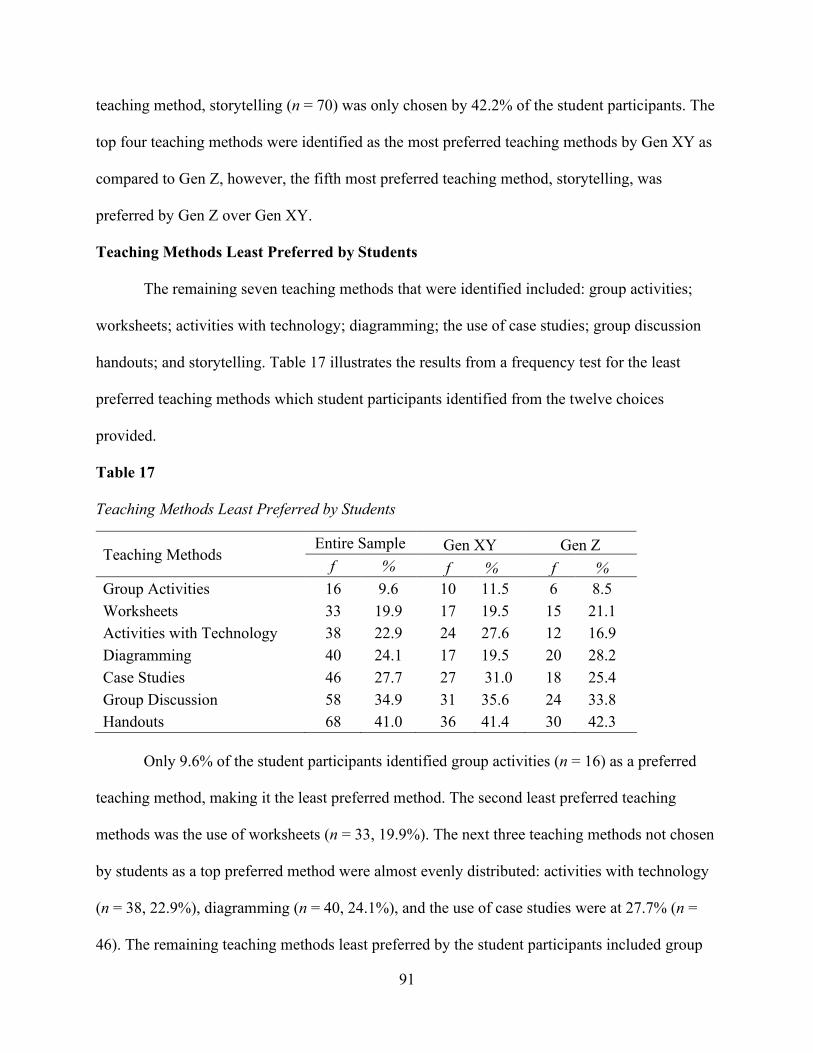
91
teaching method, storytelling (n = 70) was only chosen by 42.2% of the student participants. The
top four teaching methods were identified as the most preferred teaching methods by Gen XY as
compared to Gen Z, however, the fifth most preferred teaching method, storytelling, was
preferred by Gen Z over Gen XY.
Teaching Methods Least Preferred by Students
The remaining seven teaching methods that were identified included: group activities;
worksheets; activities with technology; diagramming; the use of case studies; group discussion
handouts; and storytelling. Table 17 illustrates the results from a frequency test for the least
preferred teaching methods which student participants identified from the twelve choices
provided.
Table 17
Teaching Methods Least Preferred by Students
Teaching Methods Entire Sample Gen XY Gen Z
f % f % f %
Group Activities 16 9.6 10 11.5 6 8.5
Worksheets 33 19.9 17 19.5 15 21.1
Activities with Technology 38 22.9 24 27.6 12 16.9
Diagramming 40 24.1 17 19.5 20 28.2
Case Studies 46 27.7 27 31.0 18 25.4
Group Discussion 58 34.9 31 35.6 24 33.8
Handouts 68 41.0 36 41.4 30 42.3
Only 9.6% of the student participants identified group activities (n = 16) as a preferred
teaching method, making it the least preferred method. The second least preferred teaching
methods was the use of worksheets (n = 33, 19.9%). The next three teaching methods not chosen
by students as a top preferred method were almost evenly distributed: activities with technology
(n = 38, 22.9%), diagramming (n = 40, 24.1%), and the use of case studies were at 27.7% (n =
46). The remaining teaching methods least preferred by the student participants included group
92
discussion (n = 58, 34.9%), handouts (n = 68, 41%), and storytelling (n = 70, 42.2%). Overall
Gen XY identified group activities, activities with technology, case studies, and group discussion
as their least preferred teaching methods. Whereas Gen Z, identified the use of worksheets,
diagramming, handouts, and storytelling as their least preferred teaching methods.
Upon completion of the survey, the student participants were given the opportunity to
write in any “other” teaching methods they preferred that were not included in the list of teaching
methods provided. A total of twelve out of 184 students chose the “other” option and submitted
the following teaching methods: applying concepts in clinical (n = 1); hearing experiences from
professors (n = 1); learning objectives for note taking and outlining in my own (n = 1); medical
models, how what we are studying applies to the body (n = 1); practice quizzes (n = 1); practice
tests (n = 1); reading chapters (n = 1); reading textbook/Power Points (n = 1); reading and
listening to the text (n = 1); simulation (n = 1); and, tactile application (n = 1).
Walker’s Teaching Methods Student Survey Results
The students were also asked to answer 30 questions, using a five-point Likert-Type data
scale, to rank faculty teaching method preferences and classroom expectations (Appendix C).
The findings from this tool was used to contribute to the validation of the WDTMS survey
instrument and provide internal consistency. The student ranked each statement regarding
preferred teaching methods using a five-point Likert-Type data scale ranging from: 1 = None at
all; 2 = Occasionally; 3 = Frequently; 4 = Always; and 5 = Not applicable. The fifth option
allowed students to denote if the teaching method was not applicable to their classroom
experience. If the fifth option was chosen by the students, that option was coded as “missing
data” and was not included in the results.
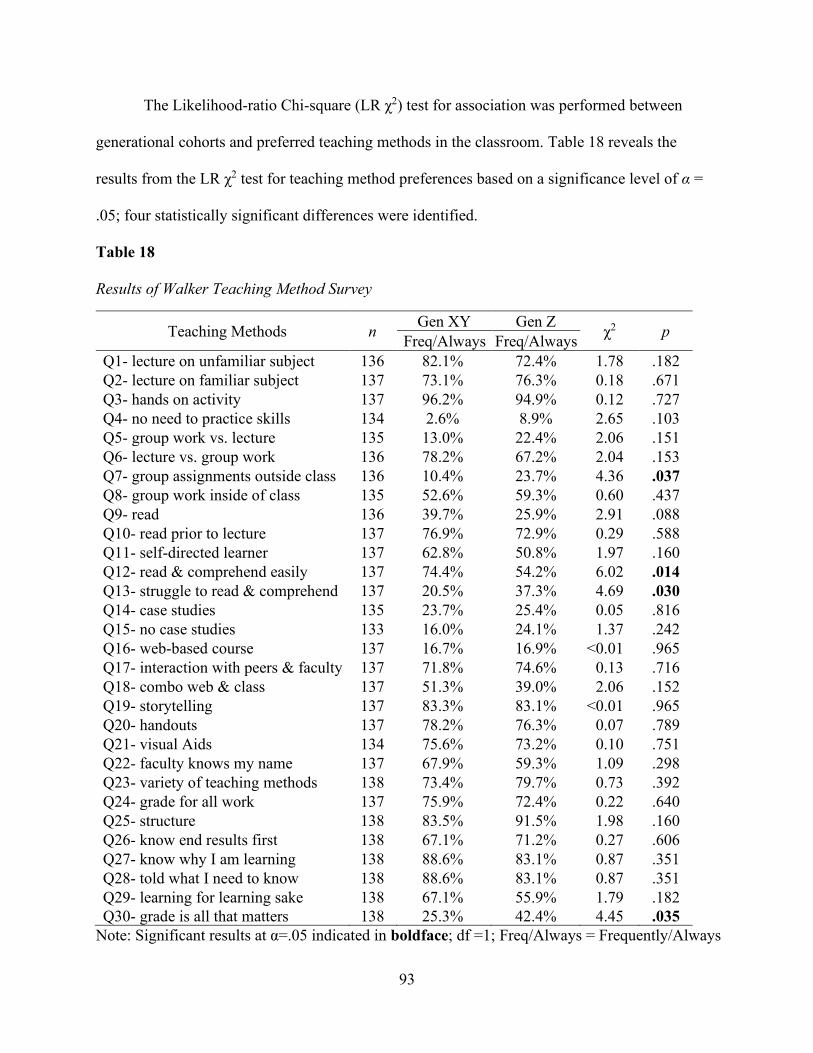
93
The Likelihood-ratio Chi-square (LR χ2) test for association was performed between
generational cohorts and preferred teaching methods in the classroom. Table 18 reveals the
results from the LR χ2 test for teaching method preferences based on a significance level of α =
.05; four statistically significant differences were identified.
Table 18
Results of Walker Teaching Method Survey
Teaching Methods n Gen XY Gen Z
χ2 p Freq/Always Freq/Always
Q1- lecture on unfamiliar subject 136 82.1% 72.4% 1.78 .182
Q2- lecture on familiar subject 137 73.1% 76.3% 0.18 .671
Q3- hands on activity 137 96.2% 94.9% 0.12 .727
Q4- no need to practice skills 134 2.6% 8.9% 2.65 .103
Q5- group work vs. lecture 135 13.0% 22.4% 2.06 .151
Q6- lecture vs. group work 136 78.2% 67.2% 2.04 .153
Q7- group assignments outside class 136 10.4% 23.7% 4.36 .037
Q8- group work inside of class 135 52.6% 59.3% 0.60 .437
Q9- read 136 39.7% 25.9% 2.91 .088
Q10- read prior to lecture 137 76.9% 72.9% 0.29 .588
Q11- self-directed learner 137 62.8% 50.8% 1.97 .160
Q12- read & comprehend easily 137 74.4% 54.2% 6.02 .014
Q13- struggle to read & comprehend 137 20.5% 37.3% 4.69 .030
Q14- case studies 135 23.7% 25.4% 0.05 .816
Q15- no case studies 133 16.0% 24.1% 1.37 .242
Q16- web-based course 137 16.7% 16.9% <0.01 .965
Q17- interaction with peers & faculty 137 71.8% 74.6% 0.13 .716
Q18- combo web & class 137 51.3% 39.0% 2.06 .152
Q19- storytelling 137 83.3% 83.1% <0.01 .965
Q20- handouts 137 78.2% 76.3% 0.07 .789
Q21- visual Aids 134 75.6% 73.2% 0.10 .751
Q22- faculty knows my name 137 67.9% 59.3% 1.09 .298
Q23- variety of teaching methods 138 73.4% 79.7% 0.73 .392
Q24- grade for all work 137 75.9% 72.4% 0.22 .640
Q25- structure 138 83.5% 91.5% 1.98 .160
Q26- know end results first 138 67.1% 71.2% 0.27 .606
Q27- know why I am learning 138 88.6% 83.1% 0.87 .351
Q28- told what I need to know 138 88.6% 83.1% 0.87 .351
Q29- learning for learning sake 138 67.1% 55.9% 1.79 .182
Q30- grade is all that matters 138 25.3% 42.4% 4.45 .035
Note: Significant results at α=.05 indicated in boldface; df =1; Freq/Always = Frequently/Always
94
The first statistically significant finding was the student’s preference for working on
group assignments outside of class, LR χ2 (1, n = 136) = 4.36, p = .037. Students in both Gen XY
and Gen Z indicated they “never/occasionally” preferred to work on groups assignments outside
of class. However, students in Gen Z (23.7%) had a higher preference for working on group
assignments outside of class compared to students in Gen XY (10.4%).
The second statistically significant finding was the student’s ability to read well and
comprehend the material easily, LR χ2 (1, n = 137) = 6.02, p = .014. Students in Gen XY
(74.4%) indicated they “frequently/always” was able to read well and comprehend the material
easily as compared to only 54.2% of the students in Gen Z. The third statistically significant
finding revealed students in Gen Z (37.3%) struggled to read and comprehend material more
than the students in Gen XY (20.5%), LR χ2 (1, n = 137) = 4.69, p = .030. The results found that
students in Gen XY (79.1%) indicated a higher preference than students in Gen Z (62.9%) for
using technology for learning. The fourth statistically significant finding confirmed that students
in both Gen XY (74.7%) and Gen Z (57.6%) believe that grades are not all that matters, LR χ2
(1, n = 138) = 4.45, p = .035.
In summary, the results of the data analysis found that students from Gen XY preferred a
variety of teaching methods. The analysis from the WDTMS found seven statistically significant
differences between the students in Gen XY and Gen Z students’ preferred teaching methods
used by faculty in the classroom. These include: working individually on an assignment versus in
a group with peers; listening versus participating during class discussion; using activities that
involve technology during class to learn new concepts; listening to the faculty lecture rather than
work in groups with peers on an in-class assignment; reading the assignment after class versus
prior to class; participating in group assignments with peers during class time; and, learning just
95
for learning sake. Although reading was not one of the twelve options for teaching method
preferences that students could choose from, participants were given the opportunity to write in
“other” teaching methods. There were three students who chose to add reading as their “other”
teaching method option.
Specific Aim III
Aim III: To compare the generational differences of teaching methods nursing
faculty use most frequently in undergraduate nursing programs.
Hypothesis III: Nursing faculty will have a difference in the teaching methods most
frequently used in undergraduate nursing programs based on the generational cohort in
which they belong.
H1. There are statistically significant differences in the teaching methods that nursing
faculty use most frequently in the classroom based on the generational cohort in which
they belong.
H0. There are no statistically significant differences in the teaching methods that nursing
faculty use most frequently in the classroom based on the generational cohort in which
they belong.
The questions on the Delahoyde Teaching Methods Faculty Survey (Appendix D) were
the same as the student survey, but the focus was changed from the students’ preferred teaching
methods to the actual teaching methods faculty were using in the classroom. The same five-point
Likert-Type data scale used on the student survey was also used on the faculty survey: 1 = None
at all; 2 = Occasionally; 3 = Frequently; 4 = Always; and 5 = Not applicable. If the fifth option
was chosen by faculty, the answer to that question was coded as “missing data” and was not
96
included in the results. However, one notable result was that 17% of the faculty chose “not
applicable” for teaching a web- based course.
Faculty Survey Part 1
Faculty Survey Results for Questions 1-23
Questions one through 23 on the faculty survey asked faculty participants to rank the
specific teaching methods they use in the classroom. These teaching methods included: lecture
and the application of skills; working in groups versus individually; the use of case studies,
visual aids, and drawings; class discussion; teaching a web- based or combination of web and
traditional on-ground classes; the use of storytelling, technology, and games; having students
read before versus after class; providing handouts instead of students taking their own notes;
encouraging interaction with faculty and peers; providing classroom structure, while maintaining
an optimal learning environment.
The Likelihood-ratio Chi-square (LR χ2) test was used to test the null hypothesis that
faculty in different generational cohorts use different teaching methods in the classroom. Table
19 shows the results from the LR χ2 test for questions one through 23 on the faculty survey for
the specific teaching methods used in the classroom based on a significance level of α = .05. The
percentages of the faculty’s choices were also analyzed. Although there was only one statistically
significant difference was identified, there were several strong tendencies toward a specific
teaching method. The percentages of the faculty’s choices were also analyzed.
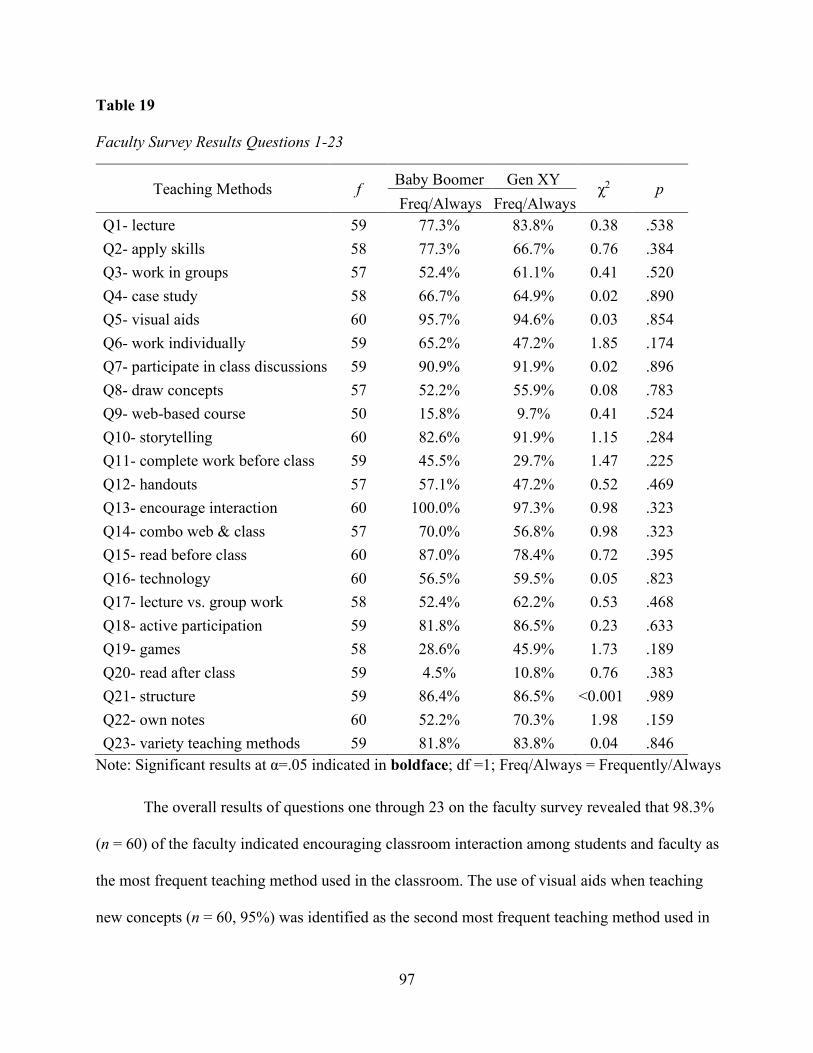
97
Table 19
Faculty Survey Results Questions 1-23
Teaching Methods f Baby Boomer Gen XY
χ2 p Freq/Always Freq/Always
Q1- lecture 59 77.3% 83.8% 0.38 .538
Q2- apply skills 58 77.3% 66.7% 0.76 .384
Q3- work in groups 57 52.4% 61.1% 0.41 .520
Q4- case study 58 66.7% 64.9% 0.02 .890
Q5- visual aids 60 95.7% 94.6% 0.03 .854
Q6- work individually 59 65.2% 47.2% 1.85 .174
Q7- participate in class discussions 59 90.9% 91.9% 0.02 .896
Q8- draw concepts 57 52.2% 55.9% 0.08 .783
Q9- web-based course 50 15.8% 9.7% 0.41 .524
Q10- storytelling 60 82.6% 91.9% 1.15 .284
Q11- complete work before class 59 45.5% 29.7% 1.47 .225
Q12- handouts 57 57.1% 47.2% 0.52 .469
Q13- encourage interaction 60 100.0% 97.3% 0.98 .323
Q14- combo web & class 57 70.0% 56.8% 0.98 .323
Q15- read before class 60 87.0% 78.4% 0.72 .395
Q16- technology 60 56.5% 59.5% 0.05 .823
Q17- lecture vs. group work 58 52.4% 62.2% 0.53 .468
Q18- active participation 59 81.8% 86.5% 0.23 .633
Q19- games 58 28.6% 45.9% 1.73 .189
Q20- read after class 59 4.5% 10.8% 0.76 .383
Q21- structure 59 86.4% 86.5% <0.001 .989
Q22- own notes 60 52.2% 70.3% 1.98 .159
Q23- variety teaching methods 59 81.8% 83.8% 0.04 .846
Note: Significant results at α=.05 indicated in boldface; df =1; Freq/Always = Frequently/Always
The overall results of questions one through 23 on the faculty survey revealed that 98.3%
(n = 60) of the faculty indicated encouraging classroom interaction among students and faculty as
the most frequent teaching method used in the classroom. The use of visual aids when teaching
new concepts (n = 60, 95%) was identified as the second most frequent teaching method used in
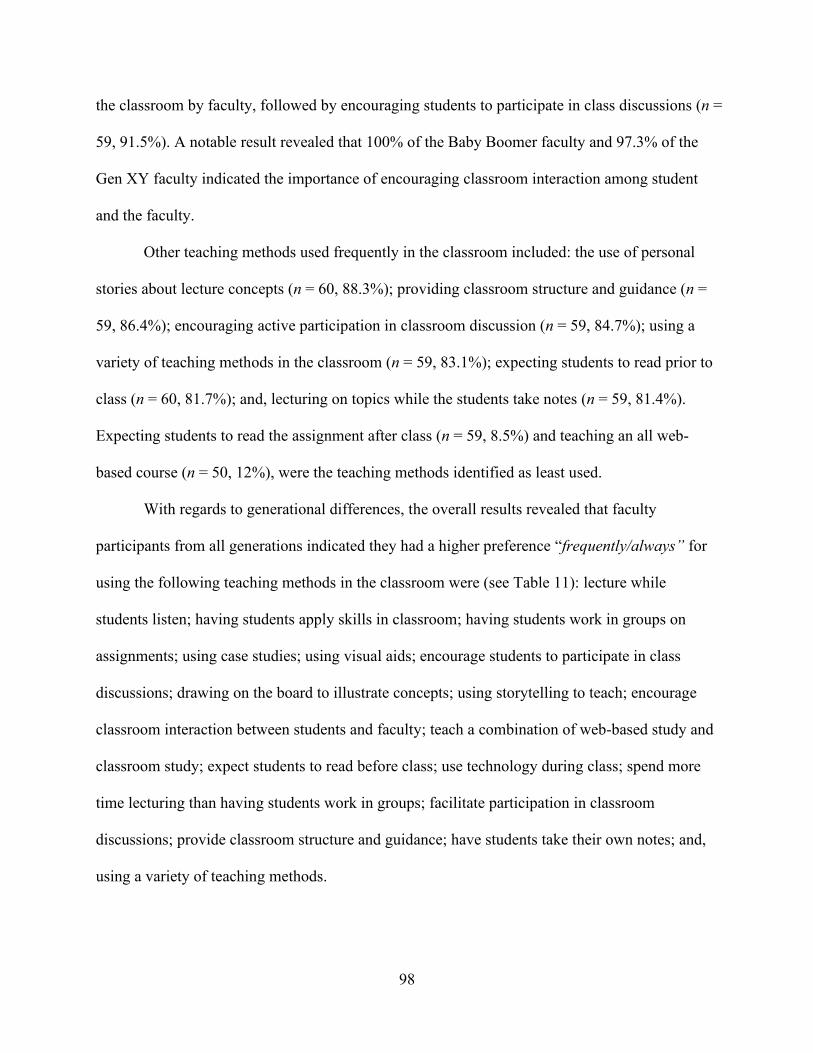
98
the classroom by faculty, followed by encouraging students to participate in class discussions (n =
59, 91.5%). A notable result revealed that 100% of the Baby Boomer faculty and 97.3% of the
Gen XY faculty indicated the importance of encouraging classroom interaction among student
and the faculty.
Other teaching methods used frequently in the classroom included: the use of personal
stories about lecture concepts (n = 60, 88.3%); providing classroom structure and guidance (n =
59, 86.4%); encouraging active participation in classroom discussion (n = 59, 84.7%); using a
variety of teaching methods in the classroom (n = 59, 83.1%); expecting students to read prior to
class (n = 60, 81.7%); and, lecturing on topics while the students take notes (n = 59, 81.4%).
Expecting students to read the assignment after class (n = 59, 8.5%) and teaching an all web-
based course (n = 50, 12%), were the teaching methods identified as least used.
With regards to generational differences, the overall results revealed that faculty
participants from all generations indicated they had a higher preference “frequently/always” for
using the following teaching methods in the classroom were (see Table 11): lecture while
students listen; having students apply skills in classroom; having students work in groups on
assignments; using case studies; using visual aids; encourage students to participate in class
discussions; drawing on the board to illustrate concepts; using storytelling to teach; encourage
classroom interaction between students and faculty; teach a combination of web-based study and
classroom study; expect students to read before class; use technology during class; spend more
time lecturing than having students work in groups; facilitate participation in classroom
discussions; provide classroom structure and guidance; have students take their own notes; and,
using a variety of teaching methods.
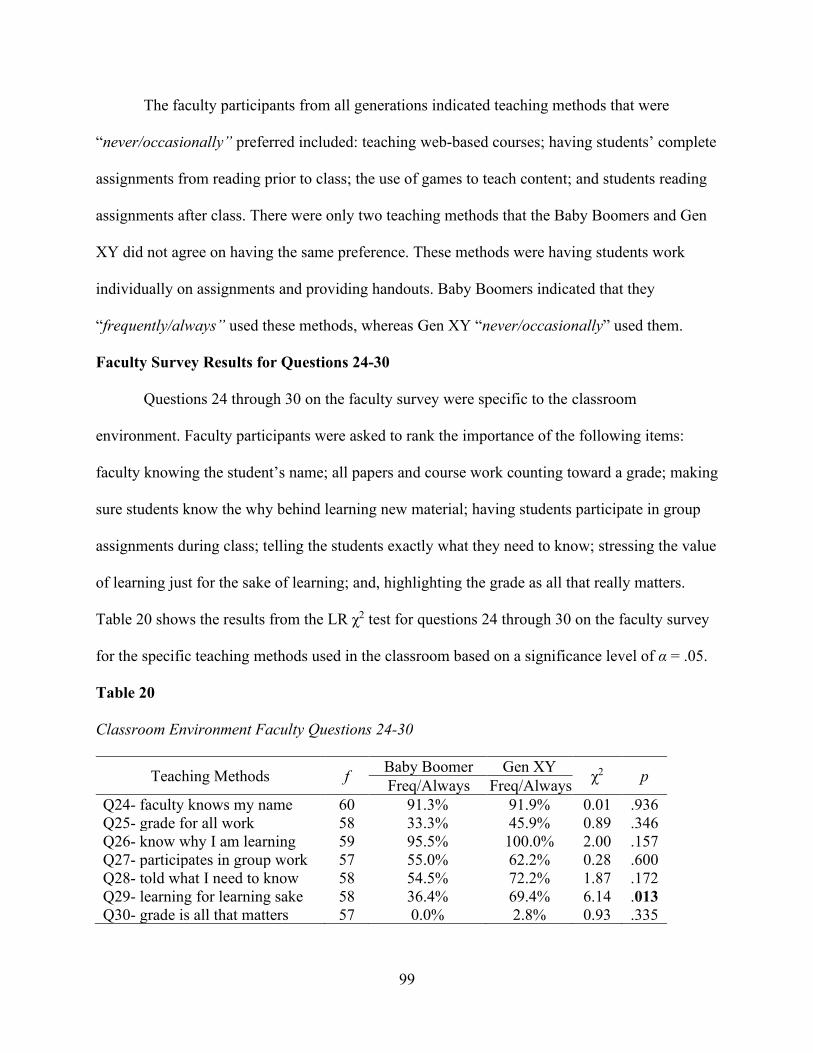
99
The faculty participants from all generations indicated teaching methods that were
“never/occasionally” preferred included: teaching web-based courses; having students’ complete
assignments from reading prior to class; the use of games to teach content; and students reading
assignments after class. There were only two teaching methods that the Baby Boomers and Gen
XY did not agree on having the same preference. These methods were having students work
individually on assignments and providing handouts. Baby Boomers indicated that they
“frequently/always” used these methods, whereas Gen XY “never/occasionally” used them.
Faculty Survey Results for Questions 24-30
Questions 24 through 30 on the faculty survey were specific to the classroom
environment. Faculty participants were asked to rank the importance of the following items:
faculty knowing the student’s name; all papers and course work counting toward a grade; making
sure students know the why behind learning new material; having students participate in group
assignments during class; telling the students exactly what they need to know; stressing the value
of learning just for the sake of learning; and, highlighting the grade as all that really matters.
Table 20 shows the results from the LR χ2 test for questions 24 through 30 on the faculty survey
for the specific teaching methods used in the classroom based on a significance level of α = .05.
Table 20
Classroom Environment Faculty Questions 24-30
Teaching Methods f Baby Boomer Gen XY
χ2 p Freq/Always Freq/Always
Q24- faculty knows my name 60 91.3% 91.9% 0.01 .936
Q25- grade for all work 58 33.3% 45.9% 0.89 .346
Q26- know why I am learning 59 95.5% 100.0% 2.00 .157
Q27- participates in group work 57 55.0% 62.2% 0.28 .600
Q28- told what I need to know 58 54.5% 72.2% 1.87 .172
Q29- learning for learning sake 58 36.4% 69.4% 6.14 .013
Q30- grade is all that matters 57 0.0% 2.8% 0.93 .335
100
The overall results of questions 24 through 30 on the faculty survey revealed that faculty
felt that it was important to share with students the importance of learning new concepts (n = 59,
98.3%) and to know each student by their name (n = 60, 91.7%). Emphasizing that the grade
each student received is all that really matters (n 57, 1.8%) was identified as least important for
the faculty to use. Placing an emphasis of learning just for learning sake was the only statistically
significant finding, LR χ2 (1, n = 58) = 6.14, p = .013.
In addition, the percentages of the faculty’s choices were also analyzed. The results show
that faculty across all generations indicated that they “frequently/always” preferred to know each
student’s name; telling students what they need to know; having students participate in group
assignments with peers; and, discussing why students need to learn new concepts. In contrast,
faculty from all generations indicated never/occasionally,” that all papers and course work
should count toward a grade, and the grade is all that really matters. However, when emphasizing
learning just for learning sake, while Gen XY indicated “frequently/always,” whereas, the Baby
Boomers chose “never/occasionally.” Although not statistically significant, Baby Boomer
(100%) and Gen XY (97.2%) faculty, like students, do not believe that grades are all that
matters.
Faculty Survey Part 2
Teaching Methods Most Used by Faculty
Similarly, with students, the faculty participants were asked to identify five teaching
methods they use the most frequently in the classroom. The faculty chose from the following
teaching methods: lecture; case studies; storytelling; hands on activities; activities with
technology; worksheets; handouts; visual aids (video, pictures, diagrams, etc.); group activities
(presentations, working with peers); diagramming (concept maps, Venn diagrams, drawings,

101
etc.); games (Jeopardy, etc.); and, group discussions (participating in a classroom discussion on a
topic).
The teaching methods that faculty chose on the survey were coded as a “1,” and those
that were not chosen, were coded as a “0”. A frequency test was performed, and the results in
Table 21 illustrates the percentages for the top five teaching methods used most often in the
classroom.
Table 21
Teaching Methods Most Used by Faculty
Teaching Methods Entire Sample Baby Boomer Gen XY
f % f % f %
Case Studies 49 75.4 18 78.3 27 73.0
Lecture 49 75.4 17 73.9 30 81.1
Visual Aids 41 63.1 14 60.9 26 70.3
Group Activities 32 49.2 12 52.2 16 43.2
Group Discussion 32 49.2 10 43.5 19 51.4
The results identified three teaching methods chosen by 49% or more of the faculty. Case
studies (n = 49, 75.4%) and lecture (n = 49, 75.4%) tied as the teaching method identified as the
teaching methods most often used in the classroom. The use of visual aids (n = 41, 63.1%) was
the next most frequently used teaching method in the classroom, followed by using group
activates (49.2%) and group discussion (49.2%). With regards to generational tendencies, the
Baby Boomer faculty indicated they use case studies, and group activities more than the Gen XY
faculty; whereas the Gen XY faculty use lecture, visual aids, and group discussion more than the
Baby Boomer faculty.
Teaching Methods Least Used by Faculty
The results of the remaining seven teaching method choices illustrated in Table 22, were
identified by less than 40% of the nursing faculty as the least preferred teaching methods used in
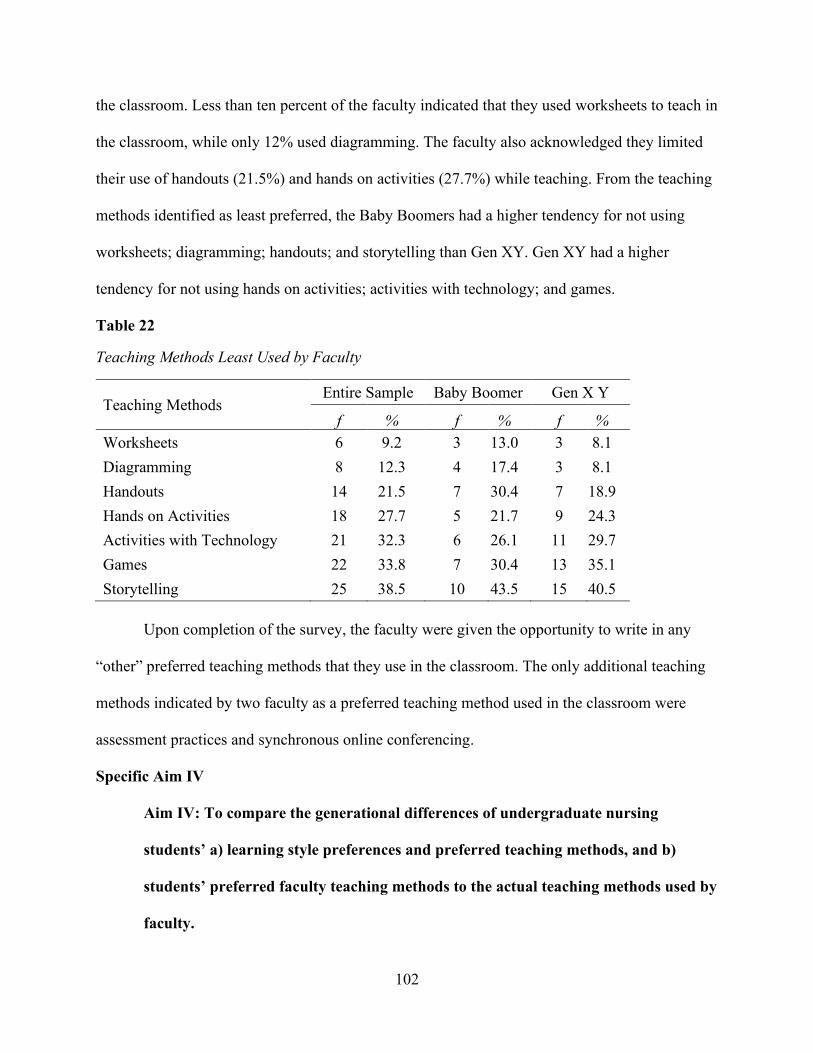
102
the classroom. Less than ten percent of the faculty indicated that they used worksheets to teach in
the classroom, while only 12% used diagramming. The faculty also acknowledged they limited
their use of handouts (21.5%) and hands on activities (27.7%) while teaching. From the teaching
methods identified as least preferred, the Baby Boomers had a higher tendency for not using
worksheets; diagramming; handouts; and storytelling than Gen XY. Gen XY had a higher
tendency for not using hands on activities; activities with technology; and games.
Table 22
Teaching Methods Least Used by Faculty
Teaching Methods Entire Sample Baby Boomer Gen X Y
f % f % f %
Worksheets 6 9.2 3 13.0 3 8.1
Diagramming 8 12.3 4 17.4 3 8.1
Handouts 14 21.5 7 30.4 7 18.9
Hands on Activities 18 27.7 5 21.7 9 24.3
Activities with Technology 21 32.3 6 26.1 11 29.7
Games 22 33.8 7 30.4 13 35.1
Storytelling 25 38.5 10 43.5 15 40.5
Upon completion of the survey, the faculty were given the opportunity to write in any
“other” preferred teaching methods that they use in the classroom. The only additional teaching
methods indicated by two faculty as a preferred teaching method used in the classroom were
assessment practices and synchronous online conferencing.
Specific Aim IV
Aim IV: To compare the generational differences of undergraduate nursing
students’ a) learning style preferences and preferred teaching methods, and b)
students’ preferred faculty teaching methods to the actual teaching methods used by
faculty.

103
H1. There are statistically significant differences in the a) learning style preferences and
preferred teaching methods, and b) students’ preferred faculty teaching methods to the
actual teaching methods used by faculty.
H0. There are no statistically significant differences in the a) learning style preferences
and preferred teaching methods, and b) students’ preferred faculty teaching methods to
the actual teaching methods used by faculty.
The Index of Learning Styles® survey (Appendix A) was used to determine the student
participants learning style preference. The students were asked to answer a 44-question survey
designed to assess 11 items in four dimensions of preferred learning styles: active-reflective,
sensing-intuitive, visual-verbal, and sequential-global. Once the students answered the questions
for each dimension, the numbers corresponding from each learning style were tabulated and the
difference was calculated ranging from 11 to -11. The value was then used to determine if the
student had a mild (or balanced) preference between the two learning styles in the dimension; a
moderate preference; or, a strong preference for an identified learning style.
To determine the correlation between the students learning style preference and the
preferred faculty teaching methods, a Pearson-r correlation was performed. The correlation
results for the generational differences of learning styles are presented in Table 23. Statistically
significant findings were found, some positive and some negative, at α = .05.
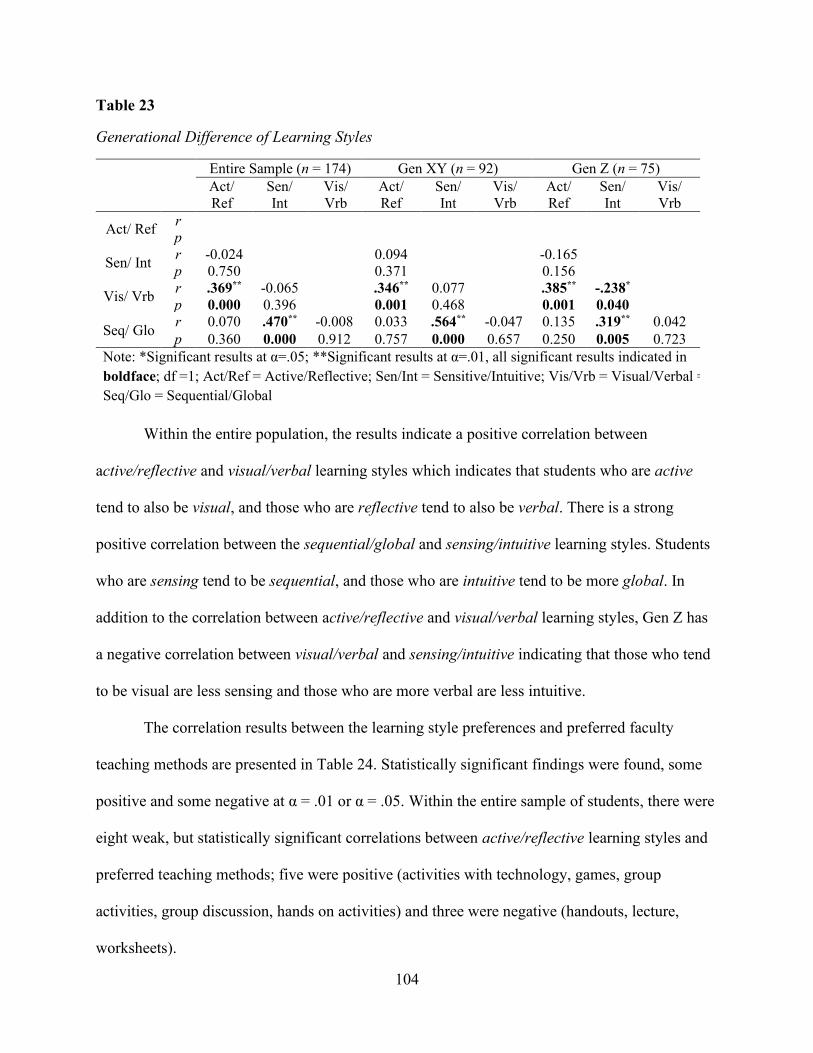
104
Table 23
Generational Difference of Learning Styles
Entire Sample (n = 174) Gen XY (n = 92) Gen Z (n = 75)
Act/
Ref
Sen/
Int
Vis/
Vrb
Act/
Ref
Sen/
Int
Vis/
Vrb
Act/
Ref
Sen/
Int
Vis/
Vrb
Act/ Ref r
p
Sen/ Int r -0.024 0.094 -0.165
p 0.750 0.371 0.156
Vis/ Vrb r .369** -0.065 .346** 0.077 .385** -.238*
p 0.000 0.396 0.001 0.468 0.001 0.040
Seq/ Glo r 0.070 .470** -0.008 0.033 .564** -0.047 0.135 .319** 0.042
p 0.360 0.000 0.912 0.757 0.000 0.657 0.250 0.005 0.723
Note: *Significant results at α=.05; **Significant results at α=.01, all significant results indicated in
boldface; df =1; Act/Ref = Active/Reflective; Sen/Int = Sensitive/Intuitive; Vis/Vrb = Visual/Verbal =;
Seq/Glo = Sequential/Global
Within the entire population, the results indicate a positive correlation between
active/reflective and visual/verbal learning styles which indicates that students who are active
tend to also be visual, and those who are reflective tend to also be verbal. There is a strong
positive correlation between the sequential/global and sensing/intuitive learning styles. Students
who are sensing tend to be sequential, and those who are intuitive tend to be more global. In
addition to the correlation between active/reflective and visual/verbal learning styles, Gen Z has
a negative correlation between visual/verbal and sensing/intuitive indicating that those who tend
to be visual are less sensing and those who are more verbal are less intuitive.
The correlation results between the learning style preferences and preferred faculty
teaching methods are presented in Table 24. Statistically significant findings were found, some
positive and some negative at α = .01 or α = .05. Within the entire sample of students, there were
eight weak, but statistically significant correlations between active/reflective learning styles and
preferred teaching methods; five were positive (activities with technology, games, group
activities, group discussion, hands on activities) and three were negative (handouts, lecture,
worksheets).
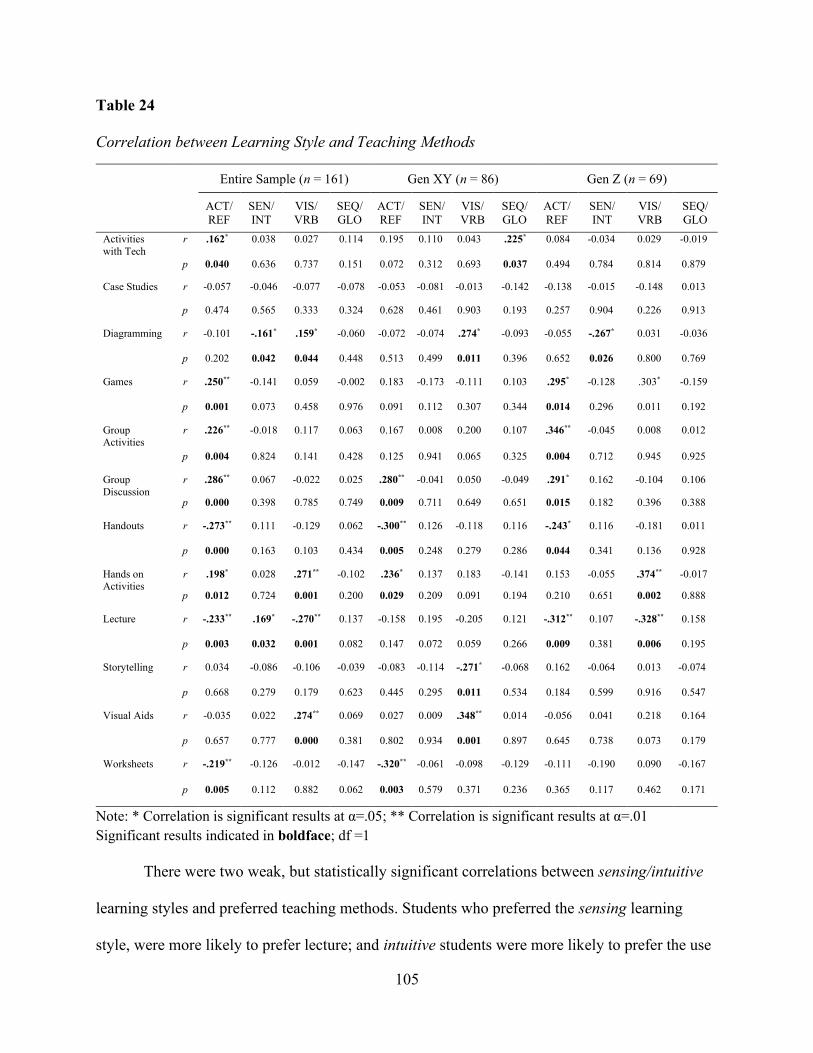
105
Table 24
Correlation between Learning Style and Teaching Methods
Entire Sample (n = 161) Gen XY (n = 86) Gen Z (n = 69)
ACT/
REF
SEN/
INT
VIS/
VRB
SEQ/
GLO
ACT/
REF
SEN/
INT
VIS/
VRB
SEQ/
GLO
ACT/
REF
SEN/
INT
VIS/
VRB
SEQ/
GLO
Activities
with Tech
r .162* 0.038 0.027 0.114 0.195 0.110 0.043 .225* 0.084 -0.034 0.029 -0.019
p 0.040 0.636 0.737 0.151 0.072 0.312 0.693 0.037 0.494 0.784 0.814 0.879
Case Studies r -0.057 -0.046 -0.077 -0.078 -0.053 -0.081 -0.013 -0.142 -0.138 -0.015 -0.148 0.013
p 0.474 0.565 0.333 0.324 0.628 0.461 0.903 0.193 0.257 0.904 0.226 0.913
Diagramming r -0.101 -.161* .159* -0.060 -0.072 -0.074 .274* -0.093 -0.055 -.267* 0.031 -0.036
p 0.202 0.042 0.044 0.448 0.513 0.499 0.011 0.396 0.652 0.026 0.800 0.769
Games r .250** -0.141 0.059 -0.002 0.183 -0.173 -0.111 0.103 .295* -0.128 .303* -0.159
p 0.001 0.073 0.458 0.976 0.091 0.112 0.307 0.344 0.014 0.296 0.011 0.192
Group Activities
r .226** -0.018 0.117 0.063 0.167 0.008 0.200 0.107 .346** -0.045 0.008 0.012
p 0.004 0.824 0.141 0.428 0.125 0.941 0.065 0.325 0.004 0.712 0.945 0.925
Group
Discussion
r .286** 0.067 -0.022 0.025 .280** -0.041 0.050 -0.049 .291* 0.162 -0.104 0.106
p 0.000 0.398 0.785 0.749 0.009 0.711 0.649 0.651 0.015 0.182 0.396 0.388
Handouts r -.273** 0.111 -0.129 0.062 -.300** 0.126 -0.118 0.116 -.243* 0.116 -0.181 0.011
p 0.000 0.163 0.103 0.434 0.005 0.248 0.279 0.286 0.044 0.341 0.136 0.928
Hands on Activities
r .198* 0.028 .271** -0.102 .236* 0.137 0.183 -0.141 0.153 -0.055 .374** -0.017
p 0.012 0.724 0.001 0.200 0.029 0.209 0.091 0.194 0.210 0.651 0.002 0.888
Lecture r -.233** .169* -.270** 0.137 -0.158 0.195 -0.205 0.121 -.312** 0.107 -.328** 0.158
p 0.003 0.032 0.001 0.082 0.147 0.072 0.059 0.266 0.009 0.381 0.006 0.195
Storytelling r 0.034 -0.086 -0.106 -0.039 -0.083 -0.114 -.271* -0.068 0.162 -0.064 0.013 -0.074
p 0.668 0.279 0.179 0.623 0.445 0.295 0.011 0.534 0.184 0.599 0.916 0.547
Visual Aids r -0.035 0.022 .274** 0.069 0.027 0.009 .348** 0.014 -0.056 0.041 0.218 0.164
p 0.657 0.777 0.000 0.381 0.802 0.934 0.001 0.897 0.645 0.738 0.073 0.179
Worksheets r -.219** -0.126 -0.012 -0.147 -.320** -0.061 -0.098 -0.129 -0.111 -0.190 0.090 -0.167
p 0.005 0.112 0.882 0.062 0.003 0.579 0.371 0.236 0.365 0.117 0.462 0.171
Note: * Correlation is significant results at α=.05; ** Correlation is significant results at α=.01
Significant results indicated in boldface; df =1
There were two weak, but statistically significant correlations between sensing/intuitive
learning styles and preferred teaching methods. Students who preferred the sensing learning
style, were more likely to prefer lecture; and intuitive students were more likely to prefer the use
106
of diagramming to learn. There were four weak, but statistically significant correlations were
found between the visual/verbal learning styles and preferred teaching methods. Diagramming,
hands on activities, and the use of visual aids all had a positive relationship with the visual
learning style; while lecture resulted in a negative relationship indicating students who preferred
the verbal learning style preferred the lecture teaching method more than students with a visual
learning style. There were no significant findings with the sequential/global learning styles and
preferred teaching methods.
With regards to generational differences, there were eight statistically significant
correlations between the learning style preferences and Gen XY students’ preferred faculty
teaching methods. There were four statistically significant correlations between active/reflective
learning styles and preferred teaching methods; two (group discussions, hands on activities) were
positive, and two (handouts, worksheets) had a strong negative relationship. No significant
findings were identified between the sensing/intuitive learning styles and preferred teaching
methods. Three statistically significant correlations between visual/verbal learning styles and
preferred teaching methods were found. Two correlations (diagramming, visual aids) were
positive, and one, storytelling had a negative correlation. One weak, but statistically significant
correlation was identified between the sequential/global learning styles and activities with
technology.
A total of eight statistically significant correlations were identified between the learning
style preferences and preferred faculty teaching methods from the Gen Z students. There were
five statistically significant correlations between active/reflective learning styles and preferred
teaching methods; three (games, group activities, group discussions) had a positive relationship;
and two (handouts, lecture) had a negative relationship. There was one weak, statistically
107
significant finding between the sensing/intuitive learning styles and preferred teaching methods,
that had a negative relationship; and that was diagramming. Students who were intuitive, were
more likely to prefer the use of diagramming to learn. Two statistically significant correlations
between visual/verbal learning styles and preferred teaching methods were revealed. The use of
hands on activities was strongly positive, whereas the use of lecture was strong negative. There
were no significant findings with the sequential/global learning styles and preferred teaching
methods.
To determine preferred teaching methods, student participants identified the top five
teaching methods they prefer faculty to use in the classroom; and the faculty participants
identified the top five teaching methods they used most frequently in the classroom. Both student
and faculty participants identify their top five preferred teaching methods from the following list:
lecture; case studies; storytelling; hands on activities; activities with technology; worksheets;
handouts; visual aids; group activities; diagramming; games; and group discussions. There were
only two teaching methods that both the students and the faculty chose as being one of their top
five preferred teaching methods was lecture and the use of visual aids.
A frequency test was performed, and the results in Table 25 depicts the top five teaching
methods most preferred to be used in the classroom by the students. Sharing the highest
percentage and being equally distributed at 71.1% (f = 118), hands on activities and the use of
visual aids, were identified as the students most preferred teaching methods to be used in the
classroom. Lecture (f = 114, 68.7%) was chosen as the third most preferred teaching method
used in the classroom, with the use of games (f = 89, 53.6%), and storytelling (f = 70, 42.2%)
being the fourth and fifth choices.
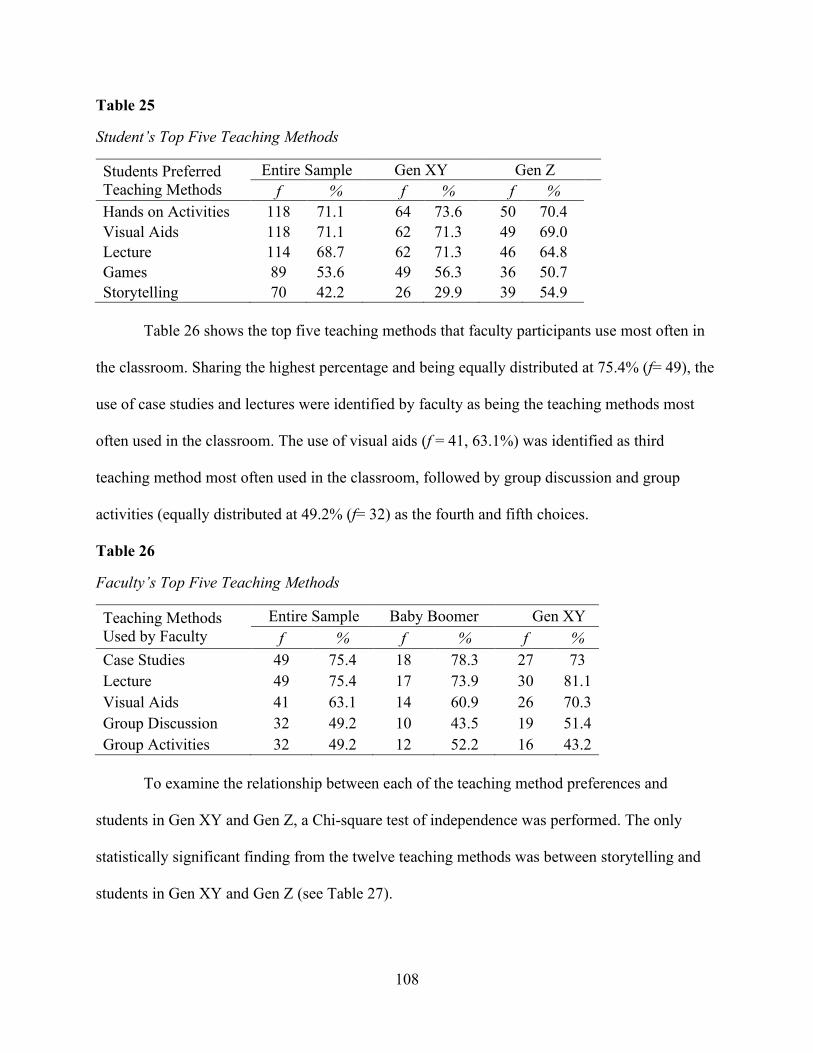
108
Table 25
Student’s Top Five Teaching Methods
Students Preferred
Teaching Methods
Entire Sample Gen XY Gen Z
f % f % f %
Hands on Activities 118 71.1 64 73.6 50 70.4
Visual Aids 118 71.1 62 71.3 49 69.0
Lecture 114 68.7 62 71.3 46 64.8
Games 89 53.6 49 56.3 36 50.7
Storytelling 70 42.2 26 29.9 39 54.9
Table 26 shows the top five teaching methods that faculty participants use most often in
the classroom. Sharing the highest percentage and being equally distributed at 75.4% (f= 49), the
use of case studies and lectures were identified by faculty as being the teaching methods most
often used in the classroom. The use of visual aids (f = 41, 63.1%) was identified as third
teaching method most often used in the classroom, followed by group discussion and group
activities (equally distributed at 49.2% (f= 32) as the fourth and fifth choices.
Table 26
Faculty’s Top Five Teaching Methods
Teaching Methods
Used by Faculty
Entire Sample Baby Boomer Gen XY
f % f % f %
Case Studies 49 75.4 18 78.3 27 73
Lecture 49 75.4 17 73.9 30 81.1
Visual Aids 41 63.1 14 60.9 26 70.3
Group Discussion 32 49.2 10 43.5 19 51.4
Group Activities 32 49.2 12 52.2 16 43.2
To examine the relationship between each of the teaching method preferences and
students in Gen XY and Gen Z, a Chi-square test of independence was performed. The only
statistically significant finding from the twelve teaching methods was between storytelling and
students in Gen XY and Gen Z (see Table 27).

109
Table 27
Rank of all 12 Teaching Methods
Teaching Methods
Entire
Sample Gen XY Gen Z
χ2 p
f % f % f %
Hands on Activities 114 72.2 64 73.6 50 70.4 0.19 .661
Visual Aids 111 70.3 62 71.3 49 69.0 0.10 .758
Lecture 108 68.4 62 71.3 46 64.8 0.76 .384
Games 85 53.8 49 56.3 36 50.7 0.50 .481
Handouts 66 41.8 36 41.4 30 42.3 0.01 .912
Storytelling 65 41.1 26 29.9 39 54.9 10.13 <0.001
Group Discussion 55 34.8 31 35.6 24 33.8 0.06 .810
Case Studies 45 28.5 27 31.0 18 25.4 0.62 .431
Diagramming 37 23.4 17 19.5 20 28.2 1.62 .203
Activities with Technology 36 22.8 24 27.6 12 16.9 2.54 .111
Worksheets 32 20.3 17 19.5 15 21.1 0.06 .805
Group Activities 16 10.1 10 11.5 6 8.5 0.40 .528
Note: Significant results at α=.05 indicated in boldface; df =1
The relationship between these variables was strongly significant, χ2 (1, f = 65) = 10.13, p < .001
with Gen Z preferring the storytelling (f = 39, 54.9%) teaching method almost twice as much as
Gen XY (f = 26, 29.9%). Gen XY preferred eight of the twelve teaching methods more than Gen
Z with one teaching method, activities with technology, preferred almost twice as much. A
Kendall's tau-b (τb) correlation was performed to determine the relationship between the twelve
preferred faculty teaching methods for students in Gen XY and students in Gen Z. Results found
a significant positive correlation (τb = 0.769, p < .001), therefore, the null hypothesis was
rejected. Using the Kendall’s tau-b there is no significant differences overall in the rankings
between Gen XY and Gen Z; even though, there are individual differences, the general patterns
are the same (τb = .769, p < .001). Both Gen XY and Gen Z ranked storytelling as the sixth most
preferred faculty teaching method to be used in the classroom.
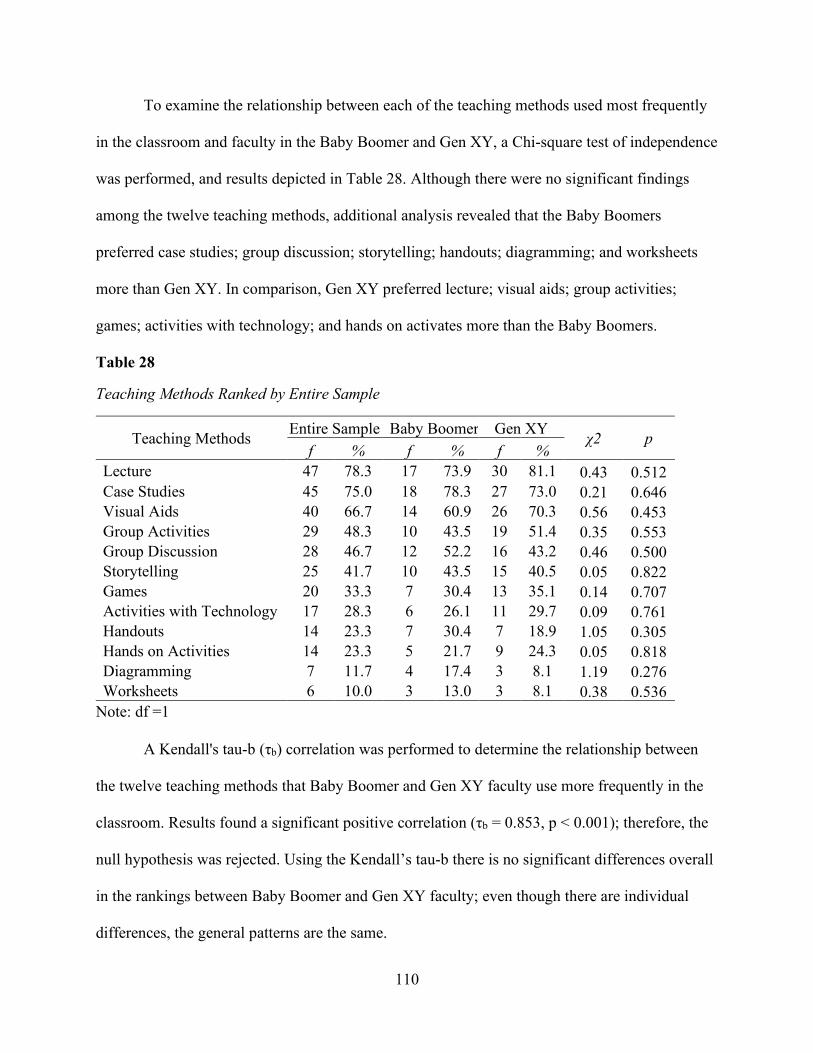
110
To examine the relationship between each of the teaching methods used most frequently
in the classroom and faculty in the Baby Boomer and Gen XY, a Chi-square test of independence
was performed, and results depicted in Table 28. Although there were no significant findings
among the twelve teaching methods, additional analysis revealed that the Baby Boomers
preferred case studies; group discussion; storytelling; handouts; diagramming; and worksheets
more than Gen XY. In comparison, Gen XY preferred lecture; visual aids; group activities;
games; activities with technology; and hands on activates more than the Baby Boomers.
Table 28
Teaching Methods Ranked by Entire Sample
Teaching Methods Entire Sample Baby Boomer Gen XY
χ2 p f % f % f %
Lecture 47 78.3 17 73.9 30 81.1 0.43 0.512
Case Studies 45 75.0 18 78.3 27 73.0 0.21 0.646
Visual Aids 40 66.7 14 60.9 26 70.3 0.56 0.453
Group Activities 29 48.3 10 43.5 19 51.4 0.35 0.553
Group Discussion 28 46.7 12 52.2 16 43.2 0.46 0.500
Storytelling 25 41.7 10 43.5 15 40.5 0.05 0.822
Games 20 33.3 7 30.4 13 35.1 0.14 0.707
Activities with Technology 17 28.3 6 26.1 11 29.7 0.09 0.761
Handouts 14 23.3 7 30.4 7 18.9 1.05 0.305
Hands on Activities 14 23.3 5 21.7 9 24.3 0.05 0.818
Diagramming 7 11.7 4 17.4 3 8.1 1.19 0.276
Worksheets 6 10.0 3 13.0 3 8.1 0.38 0.536
Note: df =1
A Kendall's tau-b (τb) correlation was performed to determine the relationship between
the twelve teaching methods that Baby Boomer and Gen XY faculty use more frequently in the
classroom. Results found a significant positive correlation (τb = 0.853, p < 0.001); therefore, the
null hypothesis was rejected. Using the Kendall’s tau-b there is no significant differences overall
in the rankings between Baby Boomer and Gen XY faculty; even though there are individual
differences, the general patterns are the same.
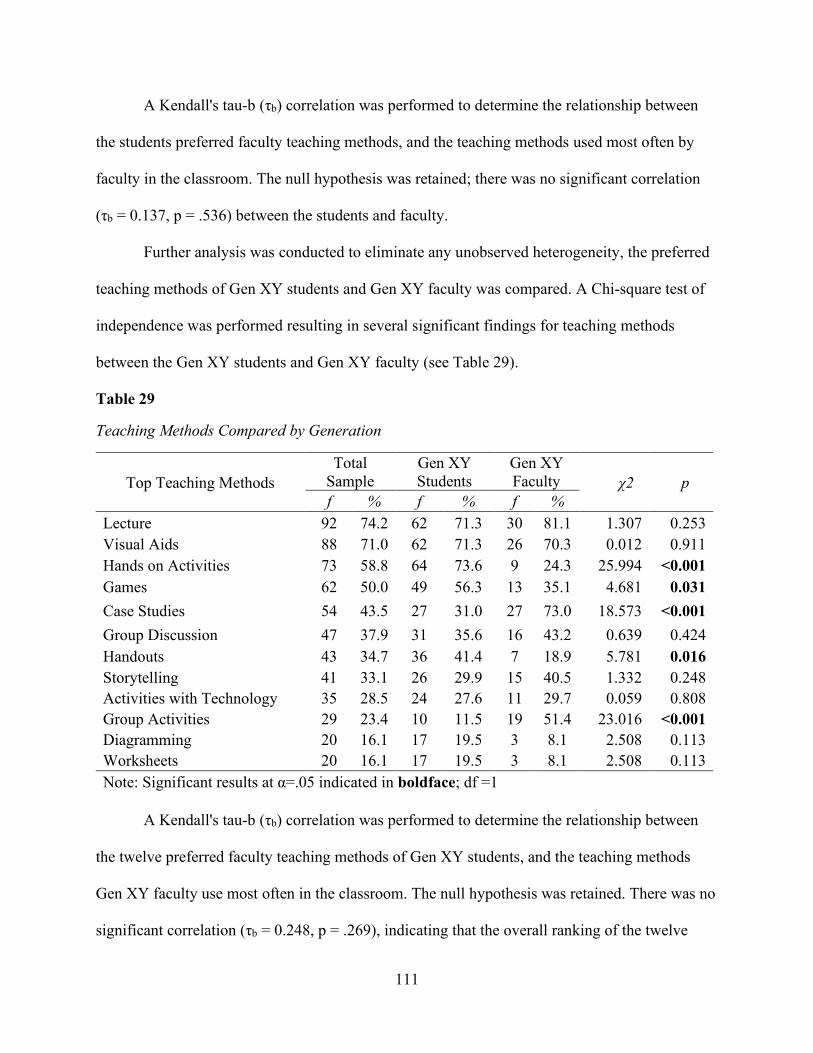
111
A Kendall's tau-b (τb) correlation was performed to determine the relationship between
the students preferred faculty teaching methods, and the teaching methods used most often by
faculty in the classroom. The null hypothesis was retained; there was no significant correlation
(τb = 0.137, p = .536) between the students and faculty.
Further analysis was conducted to eliminate any unobserved heterogeneity, the preferred
teaching methods of Gen XY students and Gen XY faculty was compared. A Chi-square test of
independence was performed resulting in several significant findings for teaching methods
between the Gen XY students and Gen XY faculty (see Table 29).
Table 29
Teaching Methods Compared by Generation
Top Teaching Methods
Total
Sample
Gen XY
Students
Gen XY
Faculty χ2 p
f % f % f %
Lecture 92 74.2 62 71.3 30 81.1 1.307 0.253
Visual Aids 88 71.0 62 71.3 26 70.3 0.012 0.911
Hands on Activities 73 58.8 64 73.6 9 24.3 25.994 <0.001
Games 62 50.0 49 56.3 13 35.1 4.681 0.031
Case Studies 54 43.5 27 31.0 27 73.0 18.573 <0.001
Group Discussion 47 37.9 31 35.6 16 43.2 0.639 0.424
Handouts 43 34.7 36 41.4 7 18.9 5.781 0.016
Storytelling 41 33.1 26 29.9 15 40.5 1.332 0.248
Activities with Technology 35 28.5 24 27.6 11 29.7 0.059 0.808
Group Activities 29 23.4 10 11.5 19 51.4 23.016 <0.001
Diagramming 20 16.1 17 19.5 3 8.1 2.508 0.113
Worksheets 20 16.1 17 19.5 3 8.1 2.508 0.113
Note: Significant results at α=.05 indicated in boldface; df =1
A Kendall's tau-b (τb) correlation was performed to determine the relationship between
the twelve preferred faculty teaching methods of Gen XY students, and the teaching methods
Gen XY faculty use most often in the classroom. The null hypothesis was retained. There was no
significant correlation (τb = 0.248, p = .269), indicating that the overall ranking of the twelve
112
teaching method preferences is different between the two groups. There were no significant
differences overall in the rankings between Gen XY and Gen Z even though there are individual
differences, the general patterns are the same. However, the students and faculty both ranked
visual aids as the third most preferred teaching method to be used in the classroom.
Broadly speaking, both groups rank lecture highly, visual aids were ranked number three
in both groups, hands on activities for the students was ranked number one, but faculty ranked it
ninth. Handouts were ranked number five for students and number ten for faculty. Diagramming
and worksheets not preferred by either group. Students have group activities last and for faculty
they ranked fourth. Case studies number seven for students and number two for faculty. While
there are some areas of agreement, there are notable areas of disagreement. The ones the two
groups agree on are lecture surprisingly, visual aids, activities with technology,
In summary, the results of the data analysis found that out of twelve teaching method
preferences, both students and faculty indicated a preference for lecture, and the use of visual
aids, to be used more frequently in the classroom. Therefore, hypothesis number four; stating
there is a teaching method used more frequently than others in the classroom, was supported by
the research data. Lecture and group discussion were both found in the data analysis as being
used in the classroom by faculty more frequently than other teaching methods. However, the
results of the data analysis also indicated the utilization of a variety of teaching methods in the
classroom by nursing faculty.
113
Chapter 5. Discussion
Nursing education continues to face the ongoing challenge of creating innovative
learning environments that are inclusive of students across four generations. The combination of
Baby Boomers, Gen X, Gen Y, and Gen Z undergraduate nursing students have created a multi-
generational classroom, where each generation has a “unique set of characteristics shaped by
values, trends, behaviors, and events in society; creating vast opportunities to learn, but also
unique challenges” (Delahoyde, 2009, p. 170). This chapter explores: the results from Chapter 4;
providing a summary and discussion of each of the three specific aims; correlating the results to
the literature review and theoretical context; as well as, providing limitations of the study;
implications for nursing education; and, recommendations for further research.
Summary of Results
The purpose of this study was to compare the generational differences of undergraduate
nursing students' learning preferences; the students' preferred faculty teaching methods, to the
teaching methods nursing faculty use most often in the classroom. This study used a non-
experimental survey design to collect data from undergraduate nursing students and their
faculty from non-traditional undergraduate nursing programs in the Southeastern United States.
Four separate instruments were used in this study. Frist, the Index of Learning Styles®
questionnaire was used to assess the students’ learning style preferences. Second, the
Walker/Delahoyde Teaching Method Survey was used to measure the generational differences
of the students’ preferred faculty teaching methods. Third, the Walker Teaching Method Survey
was used to provide additional support for the internal consistency of the WDTMS. Fourth, the
Delahoyde’s Teaching Method Faculty Survey was used to determine the teaching methods
faculty use most often in the classroom.
114
This research study was comprised of 251 participants: 184 nursing students and 67
nursing faculty from colleges and universities across ten Southeastern states. The students’
generational cohorts consisted of one Baby Boomer, 17 Gen X students, 77 Gen Y students, and
79 students from Gen Z. There were slightly more undergraduate nursing students from Gen Z;
with more than half of the students enrolled in an ADN program. This finding is consistent with
findings in the literature. Since there was only one student from the Baby Boomer generation,
this generational cohort was not included in the analysis. Due to low numbers of Gen X and
Gen Y undergraduate students, they were combined into the group, Gen XY, prior to data
analysis.
Faculty generational differences were comprised of 24 Baby Boomers, 28 Gen X, and
ten from Gen Y. More than half of the faculty taught from an ADN program. The years of
faculty teaching experience ranged from one year to thirty-five years, with a mean of 11.11
years. These findings were almost identical to the findings in Delahoyde’s (2009) study where
the faculty’s experience ranged from one to thirty-eight years with a mean of 11.14 (p. 171). As
anticipated, there were no faculty from Gen Z. Additionally, due to the low numbers of Gen X
and Gen Y faculty, they were also combined into one group, Gen XY, prior to data analysis.
The specific statistical tests used include the following: descriptive analysis and
frequencies; Chi-Square (χ2); One-sample Wilcoxon signed-rank test; Likelihood-ratio Chi-
square (LR χ2) test; Kruskal-Wallis; Kendall’s tau-b; and, the Pearson-r correlation. A summary
of the results of the data analysis are offered in relation to each specific aim.
Specific Aim I
Specific Aim I was to compare the generational differences of undergraduate nursing
students’ learning style preferences. H1. There are statistically significant differences in the
115
learning style preferences of undergraduate nursing students based on the generational cohort in
which they belong. H0. There are no statistically significant differences in the learning style
preferences of undergraduate nursing students based on the generational cohort in which they
belong. There were no significant differences between the generational cohorts, therefore, the
null hypothesis was retained.
The majority of the student participants were balanced across the active/reflective and
sequential/global learning style dimension. From the remaining two dimensions, the findings
found sensing and visual as the two most preferred learning styles among the student
participants. There was only a small proportion of students who preferred the reflective, intuitive,
verbal, or global learning style. However, with regards to generational differences, both Gen XY
and Gen Z, preferred the active learning style more than the reflective; the sensing more than the
intuitive; visual over verbal; and, the sequential over the global learning style.
This study found most of the students to be balanced across the active/reflective and
sequential/global learning style dimension. Although existing literature found one study with
similar results; the population was registered nurses, not nursing students. McCrow et al. (2014)
examined the preferred learning styles of acute care nurses with hopes of identifying ways to
decrease barriers to continuing education, “develop and strengthen professional hospital-based
educational programs” (p. 170). McCrow et al. (2014) found the nurse participants were
balanced across the active/reflective (n = 77, 54%), and sequential/global (n = 96, 68%) learning
style dimensions.
This study found that the two most preferred learning styles was sensing and visual is
consistent with several studies. For example, Zang and Lambert’s (2008) international study
found that undergraduate BSN students in China preferred sensing (86%) and visual (76%)
116
learning. Gonzales et al. (2017), investigating the learning styles of graduate nursing students
upon entry into the nursing programs, found the predominate learning styles to be sensing
(82.7%) and visual (78.7%). Although the focus of McCrow et al. (2014) was registered nurses
as opposed to nursing students, the results of their study, identical to this study, indicated a
preference for the sensing (n = 97, 68%) and visual (n = 76, 53%) learning style. Another study,
Brannan et al. (2016), found sensing and sequential learning as most preferred learning style
while examining the impact of learning styles on confidence and knowledge in traditional and
high-fidelity simulation with nursing students.
While the results of the study found significant differences in the learning style
preferences among undergraduate nursing students collectively, no significant differences were
found between the students in Gen XY and Gen Z. Furthermore, the results show distinct
differences and similarities among the learning styles between the generations with sensing,
identified as the most preferred learning style. This study suggests that undergraduate nursing
students in the Southeastern U.S. are concrete thinkers who prefer facts, are attentive to details,
and likes to problem solve using practical and real-world applications.
Specific Aim II
Specific Aim II was to compare the generational differences of undergraduate nursing
students’ preferred teaching methods used in the classroom. H1. There are statistically significant
differences in the preferred teaching methods used in the classroom of undergraduate nursing
students based on the generational cohort in which they belong. H0. There are no statistically
significant differences in the preferred teaching methods used in the classroom of undergraduate
nursing students based on the generational cohort in which they belong. The significant findings
117
support the hypothesis that there are generational differences, as well as similarities among the
undergraduate nursing students preferred teaching methods.
The results of the survey found similarities and statistically significant differences
between Gen XY and Gen Z students and their preferred teaching methods. Two similar studies
were conducted comparing generational differences among nursing students and their preferred
teaching methods. Using BSN students as the sample, Delahoyde (2009) found six statistically
significant findings: “lecture; lecture versus group work; active participation in group discussion;
and the importance of participating in group discussion” (p 174). Another used study by Kitko
(2011), used ADN students for the sample and found eight statistically significant differences:
“lecture, self-directed learners and requires a little motivation to study, preference for a totally
web-based course of study without class meeting; importance for faculty to learn my name;
preference to have a highly structured classroom structure and guidance from faculty; the
importance to know why I am learning material; learning just for the sake of learning; and,
importance of grade received is all that really matters” (p. 149).
The seven statistically differences between the generations and their preferred teaching
preferences included: work individually; listen vs. participate in discussions; technology; lecture
vs. group work; reading after class; participating in group work; and learning for learning sake.
Work Individually
The first statistically significant finding between Gen XY and Gen Z was the preference
for working individually on assignments versus in a group with peers (p = .0329). The results
found that students from Gen XY (77.9%) had a higher preference for working individually then
in a group on assignments compared to students in Gen X (62.9%). These results are consistent
with the generational characteristics noted in the literature for Gen X who prefer working
118
independently (Cook, 2016; Johnson & Romanello, 2005). This is also supported with the
statistically significant finding from the Walker Teaching Methods Student survey regarding the
student’s preference for working on group assignments outside of class, LR χ2 (1, n = 136) =
4.36, p = .037. Students in both Gen XY and Gen Z indicated they “never/occasionally”
preferred to work on groups assignments outside of class.
Listen vs. Participate
The second statistically significant finding between Gen XY and Gen Z was the
preference to listen versus participate during class discussions (p = .029). The results found that
students in Gen Z (62.9%) had a higher preference for listening to lecture versus participating in
class discussion compared to the students in Gen XY (45.3%). These results contradict the
current literature which suggests that Gen Z prefers more of a hands-on approach to learning,
rather than listening to PowerPoint® presentations (Loveland, 2017). Further research regarding
generational characteristics for Gen Z is needed.
Technology
The third statistically significant finding between Gen XY and Gen Z was using
technology during class to help learn new concepts (p = .025). The results found that students in
Gen XY (79.1%) indicated a higher preference than students in Gen Z (62.9%) for using
technology for learning. Although the literature recognizes Gen Z as having been exposed to a
lifelong immersion of technology, identified as being the most technologically savvy of all
generations, these results indicate otherwise.
Lecture vs. Group Work
The fourth statistically significant finding between Gen XY and Gen Z was listening to
the faculty lecture, rather than working in groups with peers on in-class assignments (p = .003).
119
The results found that the students in Gen XY (66.3%) had a higher preference for lecture over
group work, while students in Gen Z (42.9).
The results of this variable are similar to Delahoyde (2009), who found statistically
significant findings between Gen X and Gen Y where they indicated a preference for listening to
the professor lecture versus working in groups with their peers (p = .021). Additionally, the
results revealed that this teaching method was preferred more by Gen X students with a mean of
2.92 (SD = .838), compared to Gen Y students with a mean of 2.60 (SD = .904).
The results of this study and Delahoyde (2009) differ from the results of Walker et al.
(2006), who found no difference between Gen X and Gen Y and their preference for lecture
versus group work. The results of Walker et al. (2006), found that the majority of both
generations did not prefer any type of group work inside or outside of class.
Reading after Class
The fifth statistically significant finding between Gen XY and Gen Z was the importance
of reading the assignment after class versus reading prior to class (p = .003). The students in Gen
Z (94.3%) expressed a higher preference for reading after class than the students in Gen XY
(78.2%). Perhaps the students prefer to hear new information presented in class prior to reading
to determine if it is worthwhile for them to invest the time with reading. The literature shows that
Gen X students value time and have little regard for wasted time or non-relevant information
(Delahoyde, 2009; Johnson & Romanello, 2005).
Participating in Group Work
The sixth statistically significant finding between Gen XY and Gen Z was participating in
group assignments with peers during class time (p = .018). The students in Gen XY (71.3%) and
Gen Z (52.9%) expressed that they did not prefer to work with peers in groups during class.
120
Perhaps these findings confirm what the literature states about students thinking they learn more
from lecture, when in actuality, they scored higher on tests following active learning sessions.
(Deslauriers et al., 2019)
Learning for Learning Sake
The seventh statistically significant finding between Gen XY and Gen Z was learning just
for learning sake (p = .049). The students in Gen XY (75.6%) indicated a higher preference for
the importance of learning than the students in Gen Z (60.9%). The results of this variable are
similar to Kitko (2011), who found statistically significant findings between Gen X (M = 2.91,
SD= 0.668) and Gen Y (M = 2.72, SD= 0.899), with their preference for learning just for the
sake of learning. Similarly, Delahoyde (2009) found that the students from Gen X students also
ranked learning just for learning sake higher than the students from Gen Y. These results support
the literature’s discussion of adult learners’ desire for lifelong learning and to know why they are
learning what they are learning (Knowles, 1984).
Specific Aim III
Specific Aim III was to compare the generational differences of teaching methods
nursing faculty use most frequently in undergraduate nursing programs. H1. There are
statistically significant differences in the teaching methods that nursing faculty use most
frequently in the classroom based on the generational cohort in which they belong. H0. There are
no statistically significant differences in the teaching methods that nursing faculty use most
frequently in the classroom based on the generational cohort in which they belong. There was
one significant finding in the teaching methods used most often in the classroom, therefore, the
null hypothesis was rejected.
121
Although the results of the study only found one significant difference, the data found
specific teaching methods used more often than others by faculty in the classroom. The results of
the first 23 questions on the survey revealed that encouraging classroom interaction among
students and faculty, was the teaching method used most often in the classroom; followed by the
use of visual aids when teaching new concepts; and encouraging students to participate in class
discussions. The faculty teaching methods used least often in the classroom were: teaching a
web-based course and encouraging students to wait until after class to read the assignment. The
results of the last seven questions regarding classroom environment indicated the importance of
communicating to the students the value of learning new concepts, as well as knowing each
student by their name.
The second part of the faculty survey allowed the nursing faculty to rank the top five
teaching methods that they use most often in the classroom. The findings identified the exact
same result for the use of case studies and lecture as the teaching method used most often in the
classroom. The Baby Boomer faculty indicated a higher preference for the use of case studies,
whereas the Gen XY faculty expressed a higher preference for the use of lectures in the
classroom. These results add to the current literature which identified lecture as being the faculty
teaching method used most often in the classroom (Delahoyde, 2009; Felder & Silverman, 1988;
Kitko, 2011). Bradshaw and Lowenstein (2014) also support these results of lecture being one of
the faculty teaching methods used most often in the nursing classroom.
Specific Aim IV
Specific Aim IV was to compare the relationship of undergraduate nursing students in
different generational cohorts learning style preferences and preferred teaching methods used in
the classroom to the actual teaching methods used by faculty. H1. There are statistically
122
significant differences in the a) learning style preferences and preferred teaching methods, and b)
students’ preferred faculty teaching methods to the actual teaching methods used by faculty. H0.
There are no statistically significant differences in the a) learning style preferences and preferred
teaching methods, and b) students’ preferred faculty teaching methods to the actual teaching
methods used by faculty. There were significant findings in the students’ learning style
preferences and teaching methods; and with the students’ preferred faculty teaching methods to
the actual teaching methods used by faculty; therefore, the null hypothesis was rejected.
There is ongoing debate whether faculty should use teaching methods in the classroom
that match the students’ preferences and their learning style. Based on the results from the
learning style survey, the student and faculty teaching methods survey were compared to analyze
the data for this specific aim.
Initially, the learning styles preferences of the students were examined. The correlation
results between the learning style preferences and preferred faculty teaching methods found
statistically significant findings at p < .05 for the student participants as a whole. There were
eight weak, but significant correlations between the active/reflective learning styles and preferred
teaching methods. The active learner indicated a preference for activities with technology;
games; group activities; group discussion; and hands on activities as teaching method
preferences. Whereas, the reflective learner indicated a preference for handouts, lecture, and
worksheets. The sensing learner indicated a preference for lecture, and the intuitive learner was
more likely to prefer the use of diagramming to learn. For the visual/verbal learners,
diagramming, hands on activities, and the use of visual aids were preferred by the visual learners,
while the verbal learner preferred lecture. There were no significant findings with the
sequential/global learner and preferred teaching methods.
123
With regards to generational differences, statistically significant correlations were found
for the Gen XY students learning style preferences and their preferred faculty teaching methods.
The Gen XY active learner indicated a preference for group discussions and hands on activities
for teaching methods in the classroom, whereas the reflective students showed a preference for
using handouts and worksheets. There were no significant findings identified between the
sensing/intuitive learning styles and preferred teaching methods. The Gen XY visual learner
expressed a desire to use diagramming and visual aids as preferred teaching methods, while the
Gen XY verbal learners preferred storytelling. For Gen XY sequential/global learners, the only
significant finding was for Gen XY sequential learners who identified their preferred teaching
style as activities with technology.
Gen Z had some similar results as Gen XY. For Gen Z, there were eight statistically
significant correlations identified between the learning style preferences and preferred faculty
teaching methods. The Gen Z active learner indicated a preference for using games, group
activities, and group discussions for classroom learning, while Gen Z reflective learners preferred
the use of handouts and lecture. For the sensing/intuitive Gen Z learners, the only significant
finding was for the Gen Z intuitive learners who preferred the faculty diagramming while
teaching. For the Gen Z visual/verbal learners, Gen Z visual learners preferred the use of hands
on activities, while Gen Z verbal learners preferred lecture. There were no significant findings
with the sequential/global learning styles and preferred teaching methods.
Although there were significant findings in Gen XY and in Gen Z, there were two
teaching method preferences that were significant for both Gen XY and Gen Z, and that was the
teaching methods of group discussions and the use of handouts.

124
Next, the relationship between the student and faculty participants teaching method
preferences in the classroom were compared. Students indicated a preference for teaching
methods they believe helped them learn, and the faculty chose the teaching methods they used
most frequently in the classroom. The students’ result revealed the following five teaching
methods: hands on activities; the use of visual aids; lecture; games; and storytelling. The faculty
results indicated the use of case studies; lectures; visual aids; group discussions; and group
activities as the teaching methods they used most often in the classroom. From the students’ top
five preferred teaching methods, and the top five teaching methods used by faculty in the
classroom, there was an agreement on the use of lecture and visual aids.
The Chi-square for independence test was used to look at the individual teaching method
variables that were identified by both the student and faculty participants. One statistically
significant finding was found from the preferred teaching methods for students in both Gen XY
and Gen Z, and that was storytelling, χ2 (1, n = 65) = 10.13, p < .001; with Gen Z preferring the
storytelling (54.9%) almost twice as much as Gen XY (29.9%). There were no significant
findings for Baby Boomer and Gen XY faculty individual teaching method variables. Several
significant findings were found for teaching methods between the Gen XY students and Gen XY
faculty; these include hands on activities; games; case studies; handouts; and group activities.
Further analysis was conducted to eliminate any unobserved heterogeneity between the
preferred teaching methods of Gen XY students and Gen XY faculty. Although there were
several significant findings for teaching methods between the Gen XY students and Gen XY
faculty, none were statistically significant. Additionally, both students and faculty ranked the use
of visual aids as their third preferred teaching method to be used in the classroom.
125
Broadly speaking, both groups highly ranked lecture highly; visual aids were ranked
number three in both groups; hands on activities for the students were ranked number one,
although faculty ranked it ninth. Handouts were ranked number five for students and number ten
for faculty. Diagramming and worksheets were not preferred by either group. Students ranked
group activities last, while faculty ranked them fourth. Students ranked the use of case studies
number seven, while faculty ranked them number two. While there are some areas of agreement,
there are notable areas of disagreement.
Limitations of the Study
There were several limitations of this study. Frist, recruitment of survey participants was
challenging during the COVID-19 global pandemic. Not only did the pandemic delay
distribution of the online survey, but it also reduced the number of survey participants. The
survey was distributed at the end of the academic year when students were taking final exams, or
who were already on summer recess. The pandemic also shifted participation recruitment from a
national, to a regional sample of undergraduate Diploma, ADN, and BSN nursing students and
nursing faculty.
Second, a contributing factor to the low sample size resulted from having to rely on
almost 500 different individuals to distribute the online survey to nursing students in their
respective programs; which could have also contributed to the extremely small number of
participants, especially with the male participants (n = 17). Third, due to the time restraint of the
study, a test-retest was not completed. Regardless, the ability to utilize the same participants for
the retest would have been extremely difficult to accomplish for this research study design.
Fourth, the students had 116 items on three separate tools to complete. Although the
average time to complete the entire survey was less than 13 minutes; 26% of the students in Gen

126
Z exited the survey after completing the second tool, as compared to 16% of the students in Gen
XY. Finally, the study was potentially limited by the wording of the questions related to
preferred teaching methods. The terminology used to describe the teaching methods on the
survey tool are outdated. For example, the term web-based course does not specify if it is an
asynchronous, synchronous or hybrid delivery method. Another example would be the vagueness
of the use of storytelling.
Implications for Nursing Education
Although there were few statistically significant findings, the results of this research
study provide several implications for nursing education. First, the findings from this study
adds new knowledge to the increasing body of nursing education literature especially regarding
information on Gen Z. The results afford nursing faculty the opportunity to expand their
knowledge regarding the generational differences of undergraduate nursing students learning
styles, in addition to the teaching methods that they indicate help them learn best.
Second, the results of the study offer support for Knowle’s theory of andragogy that
purports adult learners tend to be more self-direct, internally motivated, and are ready to learn.
The results of this study identified hands on activities and the use of visual aids to be the most
preferred teaching methods for undergraduate nursing students; as well as 95% of the students
wanting to know the “why” behind what they were learning, These results support the
assumptions of Knowles’s theory. Understanding the learning preferences of nursing students
can help guide nursing faculty to engage students in practical, reality-based educational
activities that will help bridge the gap between theory and practice.
Third, this study provides a strong support for nursing faculty to incorporate the NLN’s
eight core competencies into curriculum design. To ensure the individual learning styles of
127
nursing students across generations are incorporated into the effective, and innovative learning
environments; nursing faculty are encouraged to use a variety of evidenced-based teaching
modalities in the classroom.
Recommendations for Future Research
There were several recommendations for future research. First, since this study focused
on survey participants from the Southeast Region, further research is needed for each educational
pathway across all regions on a national, as well as international level. Second, another
recommendation would be to repeat the study using either qualitative and/or a mixed-method
design to gain a better understanding of why students affirm their preference for specific
teaching methods. Third, future research should expound on the effectiveness of teaching
methods, not merely the teaching method preference or the teaching methods most frequently
used in the classroom. Fourth, when exploring generational differences in undergraduate nursing
students, future research should include the micro-generations, since few studies have
investigated these generational cohorts.
Summary
Today’s nursing faculty are responsible for creating learning environments that are
inclusive of students from four, diverse generational cohorts, spanning six decades who are
enrolled in multiple nursing educational pathways. Being one of the first studies to explore the
preferred teaching method preferences of undergraduate nursing students from Gen Z, these
results provide new information for nursing educators to utilize in various academic settings;
which can help bridge the gap in literature between theory and practice.
128
References
Anderson, N. (1981). The historical development of American nursing education. Journal of
Nursing Education, 20(1), 18-36.
Appleman, K. L. (2016). Differences in preferred teaching strategies: A quantitative study of
nursing student perspectives (Order No. 10240555) [Doctoral dissertation, Capella
University]. ProQuest Dissertations & Theses Global.
Benner, P., Sutphen, M., Leonard, V., & Day, L. (2010). Educating nurses: A call for radical
transformation. Jossey-Bass.
Bradshaw, M. J., & Lowenstein, A. J. (Eds.). (2010). Innovative teaching strategies in nursing
and related health professions (5th ed.). Jones & Bartlett Learning.
Brannan, J., White, A., & Long, J. (2016). Learning styles: Impact on knowledge and confidence
in nursing students in simulation and classroom. International Journal of Nursing
Education Scholarship, 13(1), 63–73. https://doi.org/10.1515/ijnes-2015-0052
Brownfield, K. M. (1993). The relationship between the Myers Briggs personality types and
learning styles. ERIC. https://login.iris.etsu.edu:3443/login?url=https://search.proquest.
com/docview/62693626?accountid=10771
Bureau of Labor Statistics. (2018, April 13). Quick facts: Registered Nurses.
https://www.bls.gov/ooh/healthcare/registered-nurses.htm
Campbell, S. M., Twenge, J. M., & Campbell, W. K. (2017). Fuzzy but useful constructs:
Making sense of the differences between generations. Work, Aging, and Retirement, 3(2),
130-139. https://doi.org/10.1093/workar/wax001
Cannon, S., & Boswell, C. (2012). Evidenced-based teaching in nursing: A foundation for
educators. Jones & Bartlett Learning.
129
Carper, B. A. (1978). Fundamental patterns of knowing in nursing. Advances in Nursing Science,
1(1), 13-24.
Cassidy, S. (2004). Learning Styles: An overview of theories, models, and measures.
Educational Psychology, 24(4), 419-444. https://doi.org/10.1080/0144341042000228834
Clark, K. R. (2017). Managing multiple generations in the workplace. Radiologic
Technology, 88(4), 379-398.
Coffield, F., Moseley, D., Hall, E., & Ecclestone, K. (2004). Learning styles and pedagogy in
post-16 learning: a systematic and critical review. Learning and Skills Research Centre.
Cohen, J. (1992). Statistical Power Analysis. Current Directions in Psychological Science, 1(3),
98-101. http://www.jstor.org/stable/20182143
Cohen, J. J. (2008). Learning styles of Myers-Briggs type indicators (Order No. 1452656)
[Master’s thesis, Indiana State University). ProQuest Dissertations & Theses Global.
Cook, D. (2005). Reliability and validity of scores from the index of learning styles. Academic
Medicine, 80(10), S97-S101.
http://ovidsp.ovid.com/ovidweb.cgi?T=JS&PAGE=reference&D=ovfth&NEWS=N&AN
=00001888-200510001-00026.
Cook, D., & Smith, A. (2006). Validity of index of learning styles scores: multitrait−
multimethod comparison with three cognitive/learning style instruments. Medical
Education, 40(9), 900–907. https://doi.org/10.1111/j.1365-2929.2006.02542.x
Cook, V. S. (2016). Gen-Z friendly classrooms.
https://sites.google.com/a/uis.edu/colrs_cook/home/gen-z-friendly-classrooms

130
Cosejo, D. (2012, August 28). Nursing education: An application of andragogy of learning.
http://rnspeak.com/fundamentals-of-nursing/nursing-education-an-application-of-
andragogy-of-learning/
Cross-Bystrum, A. (2010, August 20). What you need to know about Generation Z. iMedia
Connection. http://www.imediaconnection.com/content/27425.asp#multiview
D'Amore, A., Santhamma, J. & Mitchell, E. (2012). Learning styles of first-year undergraduate
nursing and midwifery students: a cross-sectional survey utilizing the Kolb Learning
Style Inventory. Nurse Education, 32(5), 506-15.
https://doi.org/10.1016/j.nedt.2011.08.001
Delahoyde, T. (2009). Generational differences of baccalaureate nursing students' preferred
teaching methods and faculty use of teaching methods (Order No. 3360175) [Doctoral
dissertation, College of Saint Mary]. ProQuest Dissertations & Theses Global.
Deslauriers, L., McCarty, L., Miller, K., Callaghan, K., & Kestin, G. (2019). Measuring actual
learning versus feeling of learning in response to being actively engaged in the
classroom. Proceedings of the National Academy of Sciences - PNAS, 116(39), 19251–
19257. https://doi.org/10.1073/pnas.1821936116
DiBartola, L. M. (2006). The learning style inventory challenge: Teaching about teaching by
learning about learning. Journal of Allied Health, 35(4), 238−245.
Dimock, M. (2019, January 17). Defining generations: Where millennials end and generation Z
begins. Pew Research Center. https://www.pewresearch.org/fact-tank/2019/01/17/where-
millennials-end-and-generation-z-begins/s
Dunn, R. (1984). Learning style: State of the science. Theory into practice, 23, 10-19.
https://doi.org/10.1080/00405848409543084
131
Dunn, R. (1990). Understanding the Dunn and Dunn learning styles model and the need for
individual diagnosis and prescription. Journal of Reading, Writing, and Learning
Disabilities International, 6, 223–247. https://doi.org/10.1080/0748763900060303
Dunn, R., & Burke, K. (2006). Learning style: The clue to you: Research and implementation
manual.
http://webs.um.es/rhervas/miwiki/lib/exe/fetch.php?id=docencia&cache=cache&media=l
scy_rimanual_v1.pdf
Dunn, R., & Dunn, K. (1979). Learning styles/teaching styles: Should they, can they, be
matched? Educational Leadership, 36, 238–244.
Dunn, R., Dunn, K., & Price, G. (1996). Productivity Environmental Preference Survey. In
Billings, D., & Halstead, J. (2005). Teaching in nursing: a guide for faculty (2nd ed.).
Saunders.
Earle, V., & Myrick, F. (2009). Nursing pedagogy and the intergenerational discourse. Journal of
Nursing Education, 48(11), 624-630. https://doi.org/10.3928/01484834-20090716-08
Felder, R. M. (1998). Learning styles and teaching styles. [Paper presentation]. 1998 Annual
Conference of the American Society for Engineering Education, Seattle, WA, United
States. https://www.engr.ncsu.edu/wp-
content/uploads/drive/1vRjpenyeO5BbV6VLWBx4ebL8u2C_wUry/1998-ASEE-LS.pdf
Felder, R. M. (1993). Reaching the second tier: Learning and teaching styles in college science
education. Journal of College Science Teaching, 23(5), 286–290. https://www-jstor-
org.iris.etsu.edu:3443/stable/pdf/42985814.pdf
Felder, R., & Brent, R. (2005). Understanding Student Differences. Journal of Engineering
Education, 94, 57-72. https://doi.org/10.1002/j.2168-9830.2005.tb00829.x
132
Felder, R. M., & Silverman, L. K. (1988). Learning and teaching styles in engineering education.
Engineering Education, 78(7), 674–681.
Felder, R., & Solomon, B. (1994). Index of learning styles. https://educationdesignsinc.com/
index-of-learning-styles/
Felder, R. M., & Spurlin, J. (2005). Applications, reliability, and validity of the index of learning
styles. International Journal of Engineering Education, 21(1), 103- 112.
https://www.ijee.ie/articles/Vol21-1/IJEE1553.pdf
Felkel, B., & Gosky, R. M. (2012). A study of reliability and validity of the Felder-Soloman
index of learning styles for business students. [Paper presentation]. Twenty-fourth Annual
International Conference on Technology in College Mathematics, Orlando, FL, United
States. http://archives.math.utk.edu/ICTCM/i/24/C004.html
Forrest, S. (2004). Learning and teaching: The reciprocal link. The Journal of Continuing
Education in Nursing, 35(2), 74-9.
Galbraith, D. D., & Fouch, S. E. (2007). Principles of adult learning: Application to safety
training. Professional Safety, 35-40. https://www.vista-training.com/assets/pdf/principles-
adult-learning.pdf
Gallo, A. M. (2011). Beyond the classroom: Using technology to meet the educational needs of
multigenerational perinatal nurses. The Journal of Perinatal & Neonatal Nursing,
25(2), 195–199. https://doi.org/10.1097/JPN.0b013e3182163993
Gonzales, L., Glaser, D., Howland, L., Clark, M., Hutchins, S., Macauley, K., Close, J., Leveque,
N., Failla, K., Brooks, R., & Ward, J. (2017). Assessing learning styles of graduate entry
nursing students as a classroom research activity: A quantitative research study. Nurse
Education Today, 48, 55–61. https://doi.org/10.1016/j.nedt.2016.09.016
133
Hallin, K. (2014). Nursing students at a university - A study about learning style preferences.
Nurse Education Today, 34, 1443-1449. https://doi.org/10.1016/j.nedt.2014.04.001
Hallin, K., Häggström, M., Bäckström, B., & Kristiansen, L. (2016). Correlations between
Clinical Judgement and Learning Style Preferences of Nursing Students in the Simulation
Room. Global Journal of Health Science, 8, 1–13. https://doi.org/10.5539/gjhs.v8n6p1
Hallowell, E., & Ratey, J. (2011). Driven to distraction: Recognizing and coping with attention
deficit disorder. Anchor Books. In Shatto, B., & Erwin, K. (2016). Moving on from
millennials: Preparing for generation Z. The Journal of Continuing Education in
Nursing, 47(6), 253-254. http://dx.doi.org.iris.etsu.edu:2048/10.3928/00220124-
20160518-05
Halstead, J. A. (Ed.). (2007). Nurse educator competencies: Creating an evidenced-based
practice for nurse educators. National League for Nursing.
Health Resources and Services Administration. (2007). The registered nurse population:
Findings from the March 2004 National Sample Survey of Registered Nurses.
Washington, DC: U.S. Department of Health and Human Services.
https://data.hrsa.gov/DataDownload/NSSRN/GeneralPUF04/rnsurvey2004.pdf
Henry, D. (2018). Rediscovering the art of nursing to enhance nursing practice. Nursing Science
Quarterly, 31(1), 47-54.
Horovitz, B. (2012, May 4). After Gen X, Millennials, what should next generation be? USA
Today Money. Retrieved from Johnson, M., & Johnson, L. (2010). Generations, Inc.:
From boomers to linkster- Managing the friction between generations at work.
AMACOM.
134
Hosford, C., & Siders, W. (2010). Felder-Soloman’s index of learning styles: Internal
consistency, temporal stability, and factor structure. Teaching and Learning in
Medicine, 22(4), 298–303. https://doi.org/10.1080/10401334.2010.512832
Institute of Medicine. (2011). The future of nursing: Leading change, advancing health. The
National Academies Press.
Johnson, S. A., & Romanello, M. L. (2005). Generational diversity: Teaching and learning
approaches. Nurse Educator, 30(5). 212-216.
Kaiser Family Foundation, (2010). Generation M2: media in the lives of 8- to 18-year-olds.
http://files.eric.ed.gov/fulltext/ED527859.pdf
Keefe, E. (2014). Exploration of the learning styles of the multigenerational nursing workforce
(Order No. 3640036) [Doctoral dissertation, Walden University]. ProQuest Dissertations
& Theses Global Database.
Kitko, J. V. (2011). Generational diversity in associate degree nursing students: Teaching styles
and preferences in Pennsylvania (Order No. 3453597) [Doctoral dissertation, Indiana
University of Pennsylvania]. ProQuest Dissertations & Theses Global Database.
Kolb, D. A. (1984). Experiential learning: Experience as the source of learning and
development. Prentice-Hall.
Kolb, A., & Kolb, D. (2005). Learning Styles and Learning Spaces: Enhancing Experiential
Learning in Higher Education. Academy of Management Learning & Education, 42(2),
193–212. https://doi.org/10.5465/AMLE.2005.17268566
Kolb, A. Y., & Kolb, D. A. (2017). Experiential Learning Theory as a Guide for Experiential
Educators in Higher Education. ELTHE: A Journal for Engaged Educators, 1(1), 7-44.

135
Kolb, D. A., Boyatzis, R. E., & Mainemelis, C. (2001). Experiential learning theory: Previous
research and new directions. In L. Zhang (Ed.), Perspectives on thinking, learning, and
cognitive styles (pp. 227-247). Lawrence Erlbaum Associates.
Knight, M. H. (2016). Generational learning style preferences based on computer-based
healthcare training (Order No. 10108947) [Doctoral dissertation, Chapman University].
ProQuest Dissertations & Theses Global.
Knowles, M. S. (1968, April). Andragogy, not pedagogy. Adult Leadership, 16(10), 350-352. In
Somers, R. L. (1988). Working with the adult learner: Applied andragogy for
developmental programs. Research in Developmental Education, 5(5). 1-5.
https://files.eric.ed.gov/fulltext/ED299404.pdf
Knowles, M. (1973). The adult learner. A neglected species. Gulf Publishing.
Knowles, M. S. (1980). The modern practice of adult education: From pedagogy to andragogy.
Follett.
Knowles, M. S. (1984). The adult learner: A neglected species (3rd ed.). Gulf Publishing
Company.
Knowles, M. (1990). The adult learner. A neglected species (4th ed.). Gulf Publishing.
Knowles, M., Holton, E. F., & Swanson, R. A. (2015). The adult learner: The definitive classic
in adult education and human resource development (8th ed.). Routledge.
Lancaster, L. C., & D. Stillman. (2002). When generations collide: Who they are, why they clash,
how to solve the generational puzzle at work. Harper Collins. In Reilly, P. (2012).
Understanding and teaching generation Y. English Teaching Forum, (1). 2-11.
https://files.eric.ed.gov/fulltext/EJ971235.pdf
136
Lance, C. E., Noble, C. L., & Scullen, S. E. (2002). A critique of the correlated trait-correlated
method (CTCM) and correlated uniqueness (CU) models for multitrait–multimethod
(MTMM) data. Psychological Methods, 7, 228-244.
Larocco, S. (2010). Undergraduate nursing education in the United States. Journal of Medical
Colleges of PLA, 25(1), 44-49.
Leady, S. (2008). Curriculum development. In Moyer, B. A., & Whittmann-Price, R. A. (2008).
Nursing education. F.A. Davis.
Lieb, S. (1991). Principles of adult learning. VISION.
https://petsalliance.org/sites/petsalliance.org/files/Lieb%201991%20Adult%20Learning
%20Principles.pdf
Litzinger, T., Lee, S., Wise, J., & Felder, R. (2005). A study of the reliability and validity of the
Felder-Soloman index of learning styles [Paper presentation]. 2005 Annual Conference
of the American Society for Engineering Education, Portland, OR United States.
https://peer.asee.org/15321
Litzinger, T., Lee, S., Wise, J., & Felder, R. (2007). A psychometric study of the index of
learning styles. Journal of Engineering Education, 96(4), 309–319.
https://doi.org/10.1002/j.2168-9830.2007.tb00941.x
Loehr, A. (2017, December 6). Generation Z and the U.S. workforce: 5 things you should know.
Huffington Post. http://www.huffingtonpost.com/anne-loehr/gen-z-and-the-us-
workforc_b_8234358.html
Loveland, E. (2017, Winter). Instant generation. Journal of College Admission, 34-38.
Madu, O. T., Ogbonnaya, N. P., Chikeme, P. C., & Omotola, N. J. (2019). A study to assess the
learning style preference of undergraduate nursing students in southeast, Nigeria. Asian

137
Journal of Nursing Education and Research, 9(2), 177-184.
https://www.researchgate.net/publication/333603090_Accepted_on_3112
Mahaffey, E. H. (2002). The relevance of associate degree nursing education: Past, present,
future. The Online Journal of Issues in Nursing, 7(2).
http://ojin.nursingworld.org/MainMenuCategories/ANAMarketplace/ANAPeriodicals/OJ
IN/TableofContents/Volume72002/No2May2002/RelevanceofAssociateDegree.html
Mangold, K. (2007). Educating a new generation: Teaching baby boomer faculty about
millennial students. Nurse Educator, 32(1), 21-23.
Marek, G. (2013). Impact of learning style assessment on self-reported skills of students in an
associate degree nursing program. Teaching and Learning in Nursing, 8, 43–49.
https://doi.org/10.1016/j.teln.2012.11.001
Mayfield, L. R. (2012). Nursing students' awareness and intentional maximization of their
learning styles. Learning Assistance Review, 17(1), 27-44.
https://login.iris.etsu.edu:3443/login?url=https://search.proquest.com/docview/10379088
77?accountid=10771
McCaulley, M. H. (2000). Myers-Briggs Type Indicator: A bridge between counseling and
consulting. Consulting Psychology Journal: Practice and Research, 52(2), 117–132.
https://doi.org/10.1037/1061-4087.52.2.117
McCrindle, M. (2006). New generations at work: Attracting, recruiting, retraining, and training
Generation Y. McCrindle Research.
https://www.researchgate.net/publication/335159432_New_Generations_at_Work_Attrac
ting_Recruiting_Training_and_Retaining_by_Mark_McCrindle
138
McCrindle, M. (2014). The ABC of XYZ: Understanding the global generations. McCrindle
Research.
McCrow, J., Yevchak, A., & Lewis, P. (2014). A prospective cohort study examining the
preferred learning styles of acute care registered nurses. Nurse Education in
Practice, 14(2), 170–175. https://doi.org/10.1016/j.nepr.2013.08.019
McLeod, S. A. (2017, October 24). Kolb - learning styles. Simply psychology.
https://www.simplypsychology.org/learning-kolb.html
Miers, M. E., Rickaby, C. E., & Pollard, K. C. (2007). Career choices in health care: Is nursing a
special case? International Journal of Nursing Studies, 44(7), 1196-1209.
Molsbee, C. (2011). Identifying learning styles in nursing students (Order No. 3450518)
[Doctoral dissertation, Walden University). ProQuest Dissertations & Theses Global.
Mukhalalati, B. A., & Taylor, A. (2019). Adult Learning Theories in Context: A Quick Guide for
Healthcare Professional Educators. Journal of Medical Education and Curricular
Development, 6, 1-10. https://doi.org/10.1177/2382120519840332
National League for Nursing. (2003). Innovation in nursing education: A call to reform.
http://www.nln.org/newsroom/nln-position-documents/archived-position-statements
National League for Nursing. (2005, May). Transforming nursing education.
http://www.nln.org/aboutnln/PositionStatements/index.htm
National League for Nursing. (2013). Nurse educator core competencies.
http://www.nln.org/professional-development-programs/competencies-for-nursing-
education/nurse-educator-core-competency
National League for Nursing. (n.d.-a). History of NLN. Retrieved July 30, 2019, from
http://www.nln.org/about/history-of-nln
139
National League for Nursing. (n.d.-b). NLN Biennial survey of schools of nursing academic year
2017-2018: Executive summary. http://www.nln.org/newsroom/nursing-education-
statistics
Nisen, M. (2013). How to know if you’re too old to call yourself a millennial.
http://www.businessinsider.com/definition-of-generational-cohorts-2013-5
Organization for Associate Degree Nursing. (2015). OADN and ANA joint position statement on
academic progression. https://oadn.org/images/ pdf/Position_Statements/15062_
OADN_ANA_PositionStatement_Academic%20Progression_2015%20(2).pdf
Parker, M. E., & Schoenhofer, S. O. (2008). Foundations for nursing knowledge. In Moyer, B.
A. & Whittmann-Price, R. A. (Eds.), Nursing education. (pp. 2-13). F.A. Davis.
Perks, J. M. (2017). The use of story theory based unfolding case study and learning styles on
knowledge integration of Baccalaureate Nursing Students (Order No. 10618807)
[Doctoral dissertation, Widener University]. ProQuest Dissertations & Theses Global.
Pew Research Center. (2014). Millennials in adulthood: Detached from institutions, networked
with friends. http:// www.pewsocialtrends.org/2014/03/07/ millennials-in-adulthood/
Platsidou, M. & Metallidou, P. (2008). Validity and reliability issues of two learning style
inventories in a Greek sample: Kolb’s learning style inventory and Felder & Soloman’s
index of learning styles. International Journal on Teaching and Learning in Higher
Education, 20(3). 324-335.
https://login.iris.etsu.edu:3443/login?url=https://www.proquest.com/docview/61812836?
accountid=10771
Polit, D., & Beck, C. (2012). Nursing research: Generating and assessing evidence for nursing
practice (9th Ed). Lippincott, Williams & Wilkins.
140
Puyleart, B. L. (2006). Learning styles of baccalaureate nursing students using the Myers Briggs
type indicator (Order No. 1434782) [Master’s thesis, Marian College]. ProQuest
Dissertations & Theses Global.
Raines, C. F., & Taglaireni, M. E. (2008). Career pathways in nursing: Entry points and
academic progression. The Online Journal of Issues in Nursing, 13(3).
http://ojin.nursingworld.org/MainMenuCategories/ANAMarketplace/ANAPeriodicals/OJ
IN/TableofContents/vol132008/No3Sept08/CareerEntryPoints.html
Rakoczy, M., & Money, S. (1995). Learning styles of nursing students: A 3-year cohort
longitudinal study. Journal of Professional Nursing, 11, 170–174.
https://doi.org/10.1016/S8755-7223(95)80116-2
Reid, G. (2005). Learning styles and inclusion. SAGE Publications Ltd.
http://doi.org/10.4135/9781446212523
Renfro, A. (2012, December 5). Meet Generation Z. http://gettingsmart.com/2012/12/meet-
generation-z/
Robb, M. (2013). Effective classroom teaching methods: A critical incident technique from
millennial nursing students’ perspective. International Journal of Nursing Education
Scholarship, 10(1): 301–306. https://doi.org/10.1515/ijnes-2013-0024
Robinson, J., Scollan-Koliopoulos, M., Kamienski, M., & Burke, K. (2012). Generational
differences and learning style preferences in nurses from a large metropolitan medical
center. Journal for Nurses in Staff Development, 28, 166–172.
https://doi.org/10.1097/NND.0b013e31825dfae5
Seemiller, C., & Grace, M. (2016). Generation Z goes to college. Jossey-Bass.

141
Select Statistical Services. (n.d). Comparing two proportions – Sample size. https://select-
statistics.co.uk/calculators/sample-size-calculator-two-proportions/.
Shatto, B., & Erwin, K. (2016). Moving on from millennials: Preparing for generation Z. The
Journal of Continuing Education in Nursing, 47(6), 253-254.
http://dx.doi.org.iris.etsu.edu:2048/10.3928/00220124-20160518-05
Shatto, B., & Erwin, K. (2017). Teaching millennials and generation Z: Bridging the
generational divide. Creative Nursing, 23(1), 24-28. http://dx.doi.org/10.1891/1078-
4535.23.1.24
Shepherd, J. (2017). A causal-comparative study of generational differences in learning style
preferences among adult learners in the united states (Order No. 10267988) [Doctoral
dissertation, University of La Verne]. ProQuest Dissertations & Theses Global.
Smith, M. K. (2002). Malcolm Knowles, informal adult education, self-direction, and andragogy.
The Encyclopedia of Informal Education. https://infed.org/malcolm-knowles-informal-
adult-education-self-direction-and-andragogy/
Smith-Trudeau, P. (2016). Generation Z nurses have arrived. Are you ready? New Hampshire
Nursing News, 40(2), 13-14.
http://www.nursingald.com/uploads/publication/pdf/1329/New_Hampshire_4_16_WEB.
Stanley, M. C., & Dougherty, J. P. (2010). A paradigm shift in nursing education: A new model.
Nursing Education Model, 31(6), 378-380.
Statista. (2019, July 1). Population distribution in the United States in 2019, by generation.
https://www.statista.com/statistics/296974/us-population-share-by-generation/
142
Stephens, G. F. (2015). Learning styles of millennial law enforcement officers (Order No.
3703456) [Doctoral dissertation, Grand Canyon University]. ProQuest Dissertations &
Theses Global.
Stillman, D., & Stillman, J. (2017). Gen Z @ work: How the next generation is transforming the
workplace. Harper Collins.
Strauss, W., & Howe, N. (1991). The cycle of generations. American Demographics, 13(4), 24.
https://login.iris.etsu.edu:3443/login?url=https://search.proquest.com/docview/20060074
9?accountid=10771
Swanzen, R. (2018). Facing the generation chasm: The parenting and teaching of Generations Y
and Z. International Journal of Child, Youth & Family Studies, 9(2), 125-150.
https://search.ebscohost.com/login.aspx?direct=true&db=edb&AN=129900585&site=eds
-live&scope=site
Tanner, C.A. (2002). Keep a story in your heart: A message to the class of 2002. Journal of
Nursing Education, 41, 239-240.
Taylor, M. (2018). Xennials: a microgeneration in the workplace. Industrial and Commercial
Training, 50(3), 136–147. https://doi.org/10.1108/ict-08-2017-0065
Taylor, D., & Hamdy, H. (2013). Adult learning theories: Implications for learning and teaching
in medical education: AMEE Guide No. 83. Medical Teacher, 35, p. e1561–e1572.
https://doi.org/10.3109/0142159X.2013.828153
The Myers & Briggs Foundation. (2019a). MBTI® basics. http://www.myersbriggs.org/my-mbti-
personality-type/mbti-basics/
The Myers & Briggs Foundation. (2019b). Type use for everyday life.
https://www.myersbriggs.org/type-use-for-everyday-life/

143
Tuckman, B. W. (1999). Conducting Educational Research, 5th ed. In Felder, R. M., & Spurlin,
J. (2005). Applications, reliability, and validity of the index of learning styles.
International Journal of Engineering Education, 21(1), 103- 112.
https://www.ijee.ie/articles/Vol21-1/IJEE1553.pdf
Twenge, J. M. (2017). Why today’s super-connected kids are growing up less rebellious, more
tolerant, less happy-and completely unprepared for adulthood. ATRIA.
Valiga, T. M. (2012). The teaching experience in nursing. In S. Cannon & C. Boswell (eds.),
Evidenced-based teaching in nursing: A foundation for educators (pp. 59-84). Jones &
Bartlett Learning.
Walker, J. T., Martin, T., White, J., Elliott, R., Norwood, A., Mangum, C., & Haynie, L. (2006).
Generational (age) differences in nursing students' preferences for teaching methods.
Journal of Nursing Education, 45(9), 371-4.
https://login.iris.etsu.edu:3443/login?url=http://search.proquest.com.iris.etsu.edu:2048/do
cview/203932597?accountid=10771
Walker, J., Martin, T., Haynie, L., Norwood, A., White, J., & Grant, L. (2007). Preferences for
teaching methods in a Baccalaureate nursing program: how second-degree and traditional
students differ. Nursing Education Perspectives, 28(5), 246-250.
Wang, H., & Chow, S-C. (2007). Sample size calculation for comparing proportions.
https://doi.org/10.1002/9780471462422.eoct005
Wiedmer, T. (2015). Generations do differ: Best practices in leading traditionalists, boomers, and
generations X, Y, and Z. The Delta Kappa Gamma Bulletin: International Journal for
Professional Educators, 51-58.
144
Williams, C. A. (2018). Nurse educators meet your new students: Generation Z. Nurse Educator,
44(2)., 59-60.
https://www.nursingcenter.com/journalarticle?Article_ID=4915067&Journal_ID=54026
&Issue_ID=4915066
Wills, E., & McEwen, M. (2011). Learning theories (pp. 348-371). In E. M. Wills & M.
McEwen (Eds.). Theoretical basis for nursing (3rd ed.). Lippincott.
World Health Organization. (2016). Nurse educator core competencies.
https://www.who.int/hrh/nursing_midwifery/nurse_educator050416.pdf
Yockey, K. (2015). Simulation anxiety and learning styles (Order No. 3728959) [Doctoral
dissertation, University of Northern Colorado]. ProQuest Dissertations & Theses Global
Database.
Zander, P. R. (2007). Ways of Knowing in Nursing: The historical evolution of a
concept. Journal of Theory Construction & Testing, 11(1), 7-11.
Zhang, H., & Lambert, V. (2008). Critical thinking dispositions and learning styles of
baccalaureate nursing students from China. Nursing and Health Sciences, 10(3), 175–
181. https://doi.org/10.1111/j.1442-2018.2008.00393.x
Zywno, M. S. (2003). A contribution to validation of score meaning for Felder Soloman’s index
of learning styles [Paper presentation]. 2003 Annual Conference of the American Society
for Engineering Education, Nashville, TN, United States. https://peer.asee.org/a-
contribution-to-validation-of-score-meaning-for-felder-soloman-s-index-of-learning-
styles
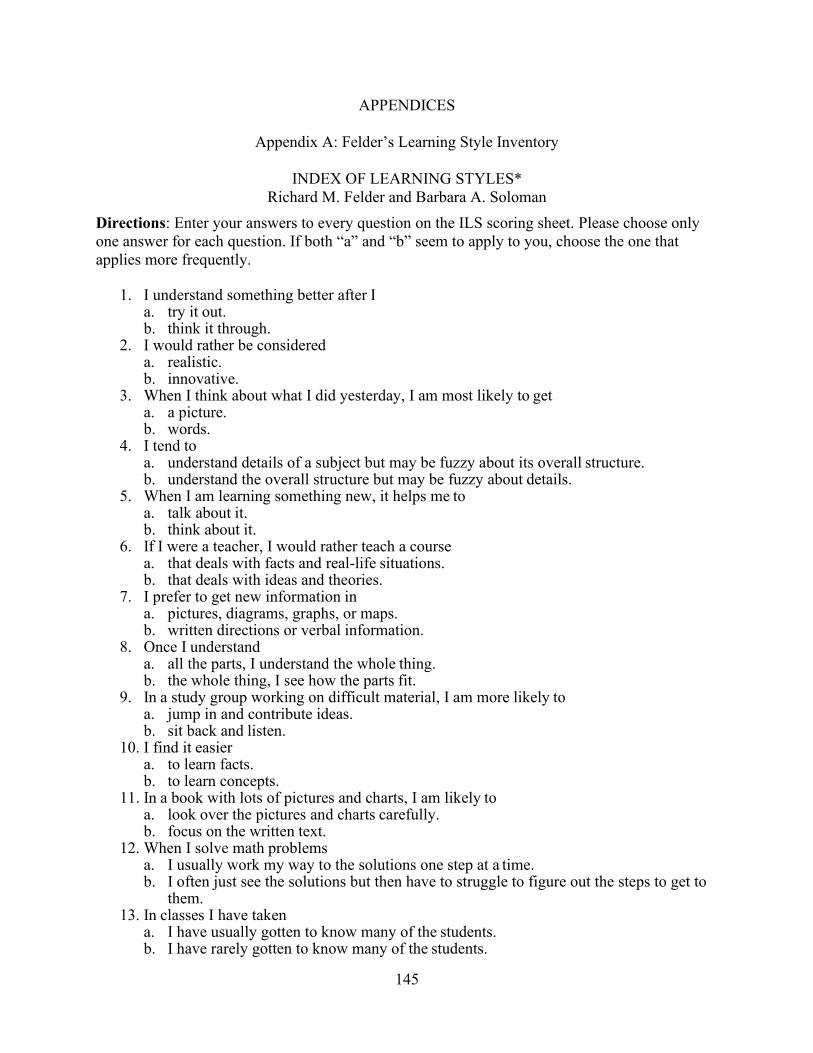
145
APPENDICES
Appendix A: Felder’s Learning Style Inventory
INDEX OF LEARNING STYLES*
Richard M. Felder and Barbara A. Soloman
Directions: Enter your answers to every question on the ILS scoring sheet. Please choose only
one answer for each question. If both “a” and “b” seem to apply to you, choose the one that
applies more frequently.
1. I understand something better after I
a. try it out. b. think it through.
2. I would rather be considered a. realistic. b. innovative.
3. When I think about what I did yesterday, I am most likely to get a. a picture. b. words.
4. I tend to a. understand details of a subject but may be fuzzy about its overall structure. b. understand the overall structure but may be fuzzy about details.
5. When I am learning something new, it helps me to a. talk about it. b. think about it.
6. If I were a teacher, I would rather teach a course a. that deals with facts and real-life situations. b. that deals with ideas and theories.
7. I prefer to get new information in a. pictures, diagrams, graphs, or maps. b. written directions or verbal information.
8. Once I understand a. all the parts, I understand the whole thing. b. the whole thing, I see how the parts fit.
9. In a study group working on difficult material, I am more likely to a. jump in and contribute ideas. b. sit back and listen.
10. I find it easier a. to learn facts. b. to learn concepts.
11. In a book with lots of pictures and charts, I am likely to a. look over the pictures and charts carefully. b. focus on the written text.
12. When I solve math problems a. I usually work my way to the solutions one step at a time. b. I often just see the solutions but then have to struggle to figure out the steps to get to
them. 13. In classes I have taken
a. I have usually gotten to know many of the students. b. I have rarely gotten to know many of the students.
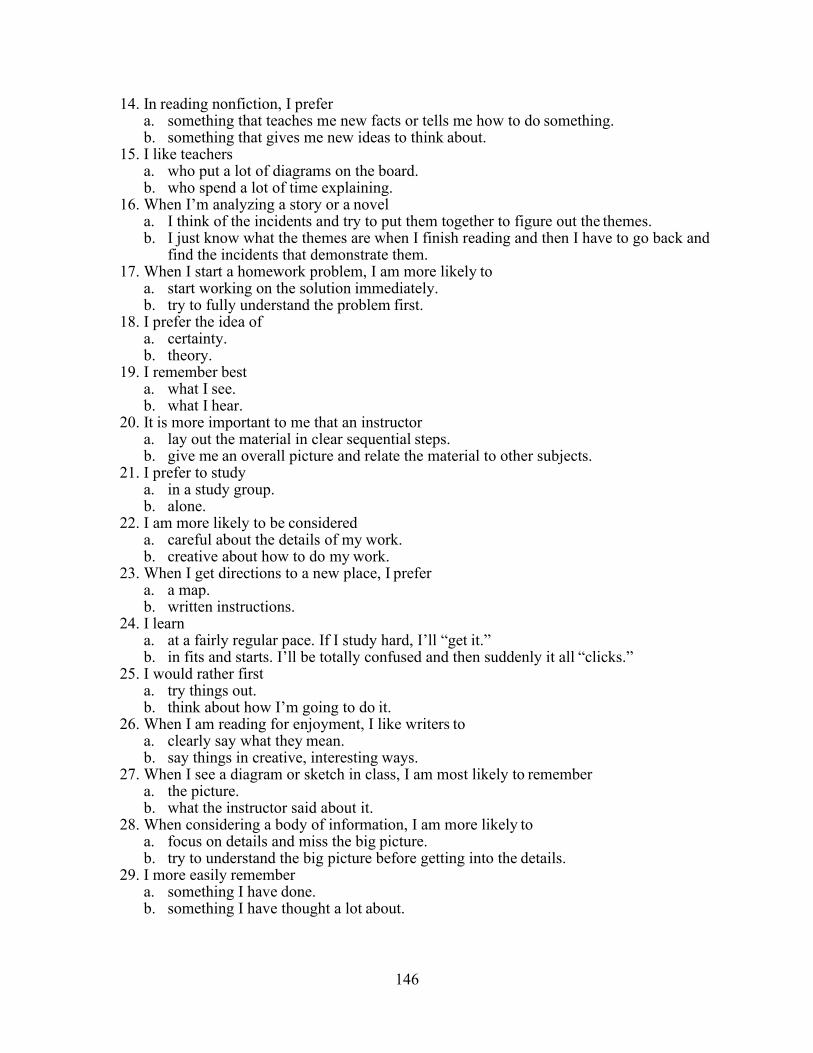
146
14. In reading nonfiction, I prefer a. something that teaches me new facts or tells me how to do something. b. something that gives me new ideas to think about.
15. I like teachers a. who put a lot of diagrams on the board. b. who spend a lot of time explaining.
16. When I’m analyzing a story or a novel a. I think of the incidents and try to put them together to figure out the themes. b. I just know what the themes are when I finish reading and then I have to go back and
find the incidents that demonstrate them. 17. When I start a homework problem, I am more likely to
a. start working on the solution immediately. b. try to fully understand the problem first.
18. I prefer the idea of a. certainty. b. theory.
19. I remember best a. what I see. b. what I hear.
20. It is more important to me that an instructor a. lay out the material in clear sequential steps. b. give me an overall picture and relate the material to other subjects.
21. I prefer to study a. in a study group. b. alone.
22. I am more likely to be considered a. careful about the details of my work. b. creative about how to do my work.
23. When I get directions to a new place, I prefer a. a map. b. written instructions.
24. I learn a. at a fairly regular pace. If I study hard, I’ll “get it.” b. in fits and starts. I’ll be totally confused and then suddenly it all “clicks.”
25. I would rather first a. try things out. b. think about how I’m going to do it.
26. When I am reading for enjoyment, I like writers to a. clearly say what they mean. b. say things in creative, interesting ways.
27. When I see a diagram or sketch in class, I am most likely to remember a. the picture. b. what the instructor said about it.
28. When considering a body of information, I am more likely to a. focus on details and miss the big picture. b. try to understand the big picture before getting into the details.
29. I more easily remember a. something I have done. b. something I have thought a lot about.

147
30. When I have to perform a task, I prefer to a. master one way of doing it. b. come up with new ways of doing it.
31. When someone is showing me data, I prefer a. charts or graphs. b. text summarizing the results.
32. When writing a paper, I am more likely to a. work on (think about or write) the beginning of the paper and progress forward. b. work on (think about or write) different parts of the paper and then order them.
33. When I have to work on a group project, I first want to a. have “group brainstorming” where everyone contributes ideas. b. brainstorm individually and then come together as a group to compare ideas.
34. I consider it higher praise to call someone a. sensible. b. imaginative.
35. When I meet people at a party, I am more likely to remember a. what they looked like. b. what they said about themselves.
36. When I am learning a new subject, I prefer to a. stay focused on that subject, learning as much about it as I can. b. try to make connections between that subject and related subjects.
37. I am more likely to be considered a. outgoing. b. reserved.
38. I prefer courses that emphasize a. concrete material (facts, data). b. abstract material (concepts, theories).
39. For entertainment, I would rather a. watch television. b. read a book.
40. Some teachers start their lectures with an outline of what they will cover. Such outlines are a. somewhat helpful to me. b. very helpful to me.
41. The idea of doing homework in groups, with one grade for the entire group, a. appeals to me. b. does not appeal to me.
42. When I am doing long calculations, a. I tend to repeat all my steps and check my work carefully. b. I find checking my work tiresome and have to force myself to do it.
43. I tend to picture places I have been a. easily and fairly accurately. b. with difficulty and without much detail.
44. When solving problems in a group, I would be more likely to a. think of the steps in the solution process. b. think of possible consequences or applications of the solution in a wide range of
areas.
Copyright © 1991, 1994 by Education Designs, Inc., Chapel Hill, NC. For information about the history of the ILS,
the theory behind it, appropriate uses of it, and studies of its reliability and validity, see
<http://educationdesignsinc.com/index-of-learning-styles/>.

148
Appendix B: Walker/Delahoyde Teaching Methods Survey
An adaptation of the Walker Teaching Methods Survey (WTMS), 2004, this survey is designed
to determine student preferences for teaching methodologies in the classroom.
Please answer the following questions by choosing the most appropriate response.
1. I prefer to listen to my professor lecture (speak) on a topic.
1 2 3 4 5
Not at all Occasionally Frequently Always Not applicable
2. I prefer to apply skills in the classroom that were covered in the reading assignment.
1 2 3 4 5
Not at all Occasionally Frequently Always Not applicable
3. I prefer to work in groups with my peers versus individually on an assignment.
1 2 3 4 5
Not at all Occasionally Frequently Always Not applicable
4. I prefer a case study in order to apply new concepts learned.
1 2 3 4 5
Not at all Occasionally Frequently Always Not applicable
5. I prefer visual aids when learning new concepts (video, pictures, diagrams, etc.).
1 2 3 4 5
Not at all Occasionally Frequently Always Not applicable
6. I prefer to work individually on an assignment versus in a group with my peers.
1 2 3 4 5
Not at all Occasionally Frequently Always Not applicable
7. I prefer to listen versus participate during class discussions.
1 2 3 4 5
Not at all Occasionally Frequently Always Not applicable
8. I prefer to have the professor draw out new concepts on the board so I can visualize them.
1 2 3 4 5
Not at all Occasionally Frequently Always Not applicable
9. I prefer a web-based course of study without class meetings.
1 2 3 4 5
Not at all Occasionally Frequently Always Not applicable
10. I prefer to hear stories of actual events and experiences from my professor.
1 2 3 4 5
Not at all Occasionally Frequently Always Not applicable

149
11. I prefer to read the assignment prior to class.
1 2 3 4 5
Not at all Occasionally Frequently Always Not applicable
12. I prefer handouts to follow along while I listen to my professor lecture (speak).
1 2 3 4 5
Not at all Occasionally Frequently Always Not applicable
13. I prefer to have classroom interaction with my peers and my professors.
1 2 3 4 5
Not at all Occasionally Frequently Always Not applicable
14. I prefer to have a combination of web-based study and classroom study.
1 2 3 4 5
Not at all Occasionally Frequently Always Not applicable
15. I read the assignment prior to class and then hear the professor discuss key points and
share his/her experience on the topic.
1 2 3 4 5
Not at all Occasionally Frequently Always Not applicable
16. I prefer activities that involve technology during class to learn new concepts.
1 2 3 4 5
Not at all Occasionally Frequently Always Not applicable
17. I prefer to listen to my professor lecture rather than work in groups with my peers on an
in-class assignment.
1 2 3 4 5
Not at all Occasionally Frequently Always Not applicable
18. I prefer to actively participate in class discussion with my professor and peers.
1 2 3 4 5
Not at all Occasionally Frequently Always Not applicable
19. I prefer to play games to learn new material (Jeopardy, etc.).
1 2 3 4 5
Not at all Occasionally Frequently Always Not applicable
20. I prefer to read the assignment after class versus prior to class.
1 2 3 4 5
Not at all Occasionally Frequently Always Not applicable
21. I prefer to have a lot of classroom structure and guidance from my professor.
1 2 3 4 5
Not at all Occasionally Frequently Always Not applicable

150
22. I prefer to take my own notes during class versus having handouts from the professor.
1 2 3 4 5
Not at all Occasionally Frequently Always Not applicable
23. I prefer to learn with a variety of teaching methods, such as lecture, group work, case
studies, diagramming, etc.
1 2 3 4 5
Not at all Occasionally Frequently Always Not applicable
24. It is important for my professor to know my name.
1 2 3 4 5
Not at all Occasionally Frequently Always Not applicable
25. It is important to have all papers and course work count toward a grade.
1 2 3 4 5
Not at all Occasionally Frequently Always Not applicable
26. It is important to know why I am learning new material.
1 2 3 4 5
Not at all Occasionally Frequently Always Not applicable
27. It is important to me to participate in group assignments with my peers during class time.
1 2 3 4 5
Not at all Occasionally Frequently Always Not applicable
28. I expect my professor to tell me what I need to know.
1 2 3 4 5
Not at all Occasionally Frequently Always Not applicable
29. I like learning just for learning sake.
1 2 3 4 5
Not at all Occasionally Frequently Always Not applicable
30. The grade I receive is all that really matters.
1 2 3 4 5
Not at all Occasionally Frequently Always Not applicable
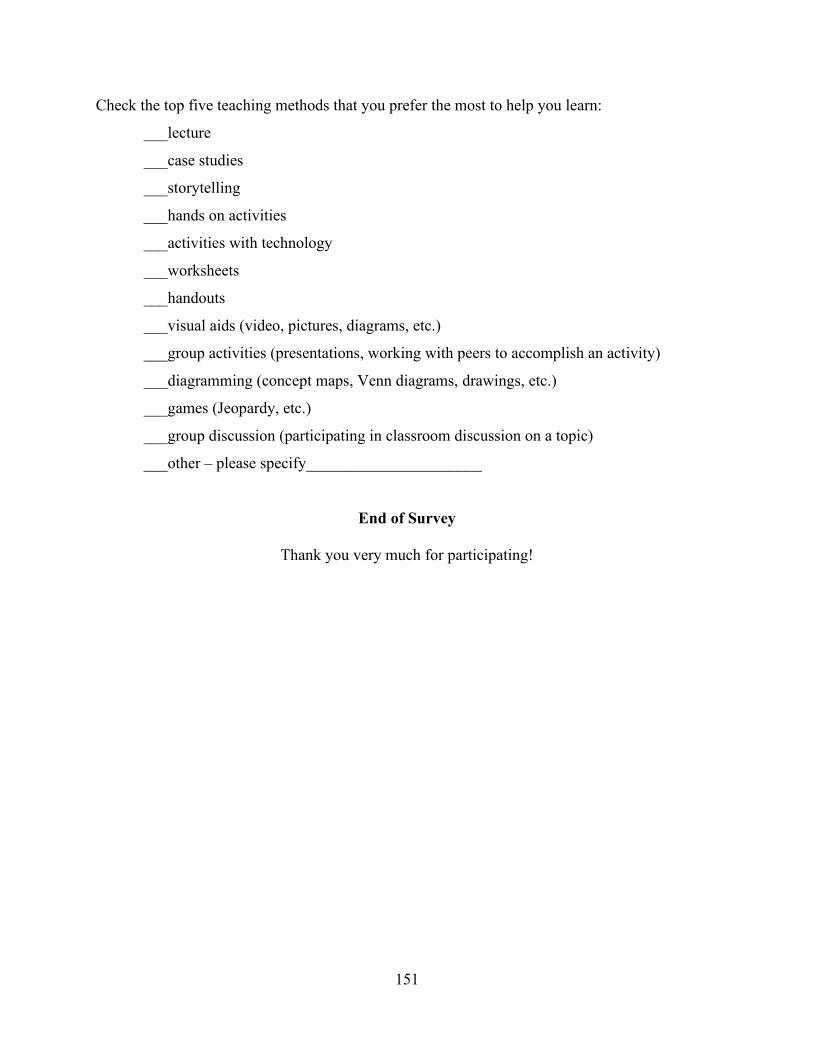
151
Check the top five teaching methods that you prefer the most to help you learn:
___lecture
___case studies
___storytelling
___hands on activities
___activities with technology
___worksheets
___handouts
___visual aids (video, pictures, diagrams, etc.)
___group activities (presentations, working with peers to accomplish an activity)
___diagramming (concept maps, Venn diagrams, drawings, etc.)
___games (Jeopardy, etc.)
___group discussion (participating in classroom discussion on a topic)
___other – please specify______________________
End of Survey
Thank you very much for participating!
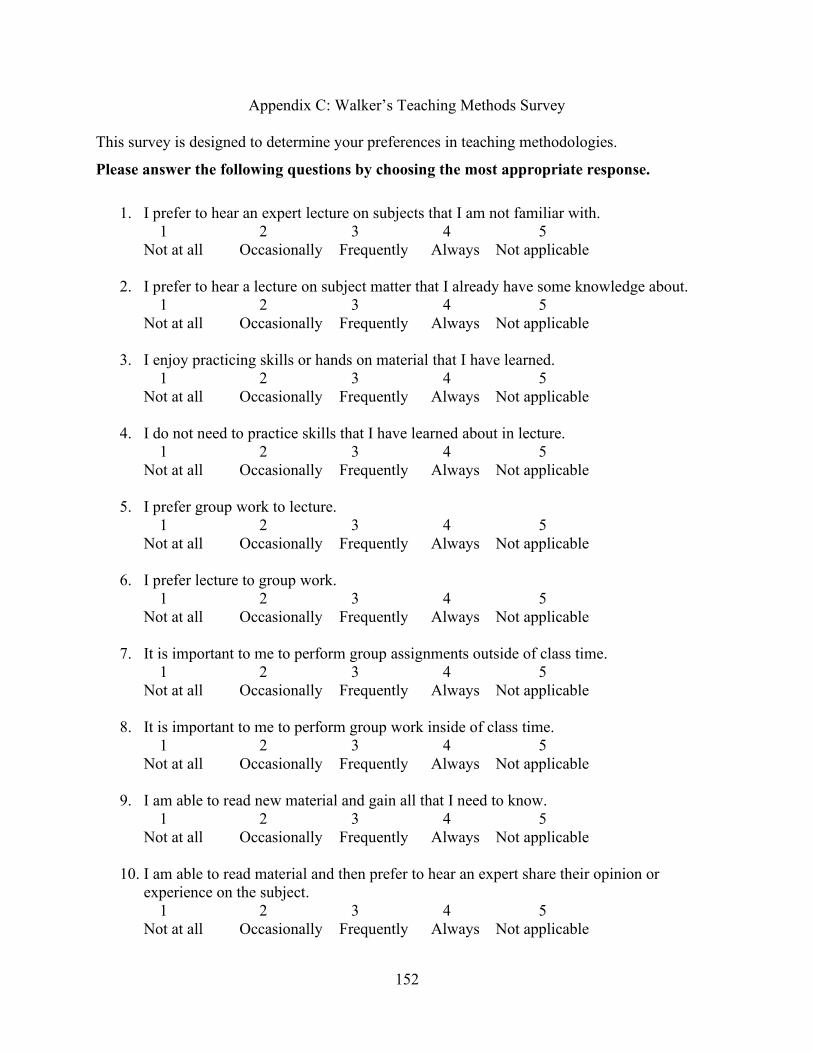
152
Appendix C: Walker’s Teaching Methods Survey
This survey is designed to determine your preferences in teaching methodologies.
Please answer the following questions by choosing the most appropriate response.
1. I prefer to hear an expert lecture on subjects that I am not familiar with.
1 2 3 4 5
Not at all Occasionally Frequently Always Not applicable
2. I prefer to hear a lecture on subject matter that I already have some knowledge about.
1 2 3 4 5
Not at all Occasionally Frequently Always Not applicable
3. I enjoy practicing skills or hands on material that I have learned.
1 2 3 4 5
Not at all Occasionally Frequently Always Not applicable
4. I do not need to practice skills that I have learned about in lecture.
1 2 3 4 5
Not at all Occasionally Frequently Always Not applicable
5. I prefer group work to lecture.
1 2 3 4 5
Not at all Occasionally Frequently Always Not applicable
6. I prefer lecture to group work.
1 2 3 4 5
Not at all Occasionally Frequently Always Not applicable
7. It is important to me to perform group assignments outside of class time.
1 2 3 4 5
Not at all Occasionally Frequently Always Not applicable
8. It is important to me to perform group work inside of class time.
1 2 3 4 5
Not at all Occasionally Frequently Always Not applicable
9. I am able to read new material and gain all that I need to know.
1 2 3 4 5
Not at all Occasionally Frequently Always Not applicable
10. I am able to read material and then prefer to hear an expert share their opinion or
experience on the subject.
1 2 3 4 5
Not at all Occasionally Frequently Always Not applicable

153
11. I am a self-directed learner and require little motivation to study.
1 2 3 4 5
Not at all Occasionally Frequently Always Not applicable
12. I read well and comprehend material easily.
1 2 3 4 5
Not at all Occasionally Frequently Always Not applicable
13. I struggle to read and comprehend material.
1 2 3 4 5
Not at all Occasionally Frequently Always Not applicable
14. I prefer a case study in order to learn.
1 2 3 4 5
Not at all Occasionally Frequently Always Not applicable
15. I do not learn from case studies.
1 2 3 4 5
Not at all Occasionally Frequently Always Not applicable
16. I prefer a totally web-based course of study without class meetings.
1 2 3 4 5
Not at all Occasionally Frequently Always Not applicable
17. I need to have classroom interaction with peers and faculty.
1 2 3 4 5
Not at all Occasionally Frequently Always Not applicable
18. I prefer a combination of web-based study along with classroom study.
1 2 3 4 5
Not at all Occasionally Frequently Always Not applicable
19. I learn from hearing stories of actual events from faculty.
1 2 3 4 5
Not at all Occasionally Frequently Always Not applicable
20. In the classroom, I prefer handouts to follow along with the lecture.
1 2 3 4 5
Not at all Occasionally Frequently Always Not applicable
21. In the classroom, I prefer faculty lecture from the outline posted on the overhead or visual
screen.
1 2 3 4 5
Not at all Occasionally Frequently Always Not applicable

154
22. It is important for faculty to learn my name.
1 2 3 4 5
Not at all Occasionally Frequently Always Not applicable
23. If material is difficult to understand, I prefer to have lecture along with other teaching
strategies, such as group work, or case study.
1 2 3 4 5
Not at all Occasionally Frequently Always Not applicable
24. It is important to have a grade attached to papers, case studies, and other outside work.
1 2 3 4 5
Not at all Occasionally Frequently Always Not applicable
25. I prefer to have a great deal of classroom structure and guidance from faculty.
1 2 3 4 5
Not at all Occasionally Frequently Always Not applicable
26. It is important to know the bottom-line or end-result before I learn.
1 2 3 4 5
Not at all Occasionally Frequently Always Not applicable
27. It is important to know why I am learning material.
1 2 3 4 5
Not at all Occasionally Frequently Always Not applicable
28. I trust faculty to tell me what I need to know.
1 2 3 4 5
Not at all Occasionally Frequently Always Not applicable
29. I like learning just for learning sake.
1 2 3 4 5
Not at all Occasionally Frequently Always Not applicable
30. The grade I receive is all that really matters.
1 2 3 4 5
Not at all Occasionally Frequently Always Not applicable
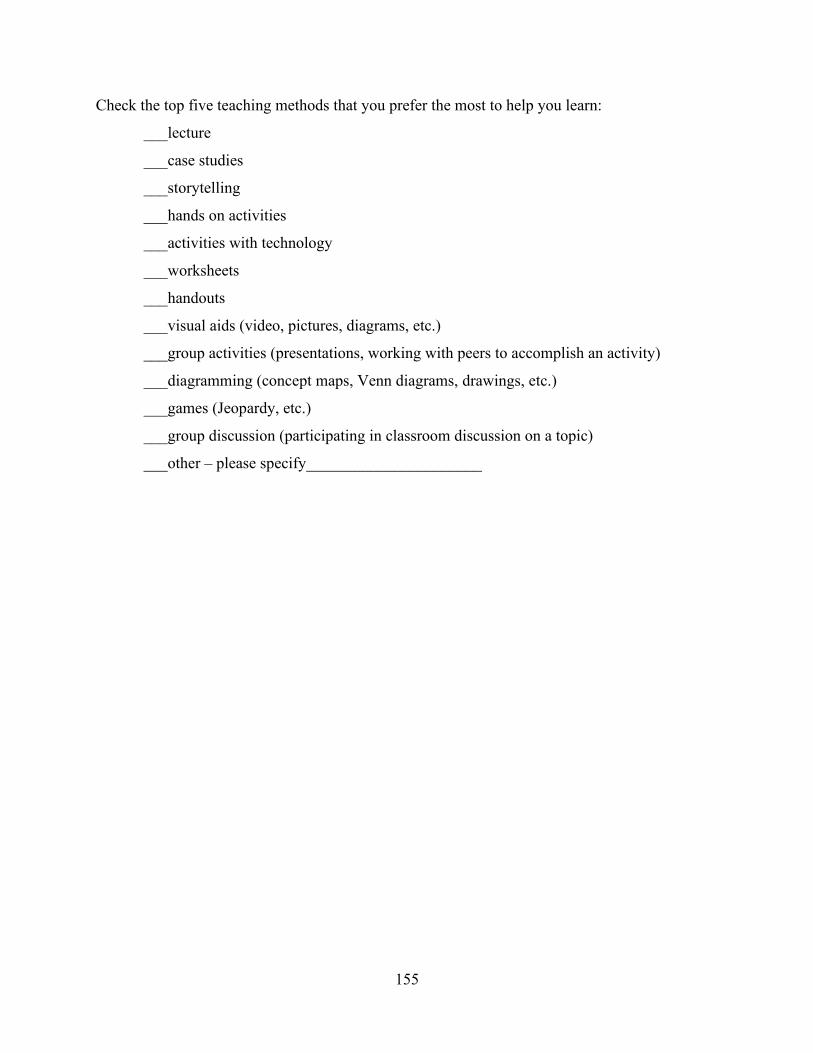
155
Check the top five teaching methods that you prefer the most to help you learn:
___lecture
___case studies
___storytelling
___hands on activities
___activities with technology
___worksheets
___handouts
___visual aids (video, pictures, diagrams, etc.)
___group activities (presentations, working with peers to accomplish an activity)
___diagramming (concept maps, Venn diagrams, drawings, etc.)
___games (Jeopardy, etc.)
___group discussion (participating in classroom discussion on a topic)
___other – please specify______________________

156
Appendix D: Delahoyde Teaching Methods Faculty Survey
Questions adapted from the Walker/Delahoyde Teaching Methods Survey (2008) and the Walker
Teaching Methods Survey (2004), this survey is designed to determine faculty preferences for
teaching methodologies in the classroom.
Please answer the following questions by choosing the most appropriate response.
1. I lecture (speak) on topics while my students listen, take notes, and answer questions.
1 2 3 4 5
Not at all Occasionally Frequently Always Not applicable
2. I have students apply skills in the classroom that were covered in the reading assignment.
1 2 3 4 5
Not at all Occasionally Frequently Always Not applicable
3. I have students work in groups with peers on an assignment.
1 2 3 4 5
Not at all Occasionally Frequently Always Not applicable
4. I use case studies to help students apply new concepts learned.
1 2 3 4 5
Not at all Occasionally Frequently Always Not applicable
5. I use visual aids when teaching new concepts (video, pictures, diagrams, etc.).
1 2 3 4 5
Not at all Occasionally Frequently Always Not applicable
6. I have students work individually on an assignment.
1 2 3 4 5
Not at all Occasionally Frequently Always Not applicable
7. I encourage all students to participate in class discussions.
1 2 3 4 5
Not at all Occasionally Frequently Always Not applicable
8. I draw on the board to help students visualize new concepts.
1 2 3 4 5
Not at all Occasionally Frequently Always Not applicable
9. I teach a web-based course of study without class meetings.
1 2 3 4 5
Not at all Occasionally Frequently Always Not applicable

157
10. I tell personal stories of my experience on the topic I am teaching.
1 2 3 4 5
Not at all Occasionally Frequently Always Not applicable
11. I have students complete an assignment over the reading prior to class.
1 2 3 4 5
Not at all Occasionally Frequently Always Not applicable
12. I provide handouts for students to take notes on while listening to me lecture (speak).
1 2 3 4 5
Not at all Occasionally Frequently Always Not applicable
13. I encourage classroom interaction among students and myself as the professor.
1 2 3 4 5
Not at all Occasionally Frequently Always Not applicable
14. I use a combination of web-based study and classroom study.
1 2 3 4 5
Not at all Occasionally Frequently Always Not applicable
15. I expect students to read the assignment prior to coming to class where I discuss key
points and share my experience on a topic.
1 2 3 4 5
Not at all Occasionally Frequently Always Not applicable
16. I provide activities that involve the use of technology during class to teach new concepts.
1 2 3 4 5
Not at all Occasionally Frequently Always Not applicable
17. I spend more time lecturing than having students work in groups with their peers.
1 2 3 4 5
Not at all Occasionally Frequently Always Not applicable
18. I facilitate active participation of all students in classroom discussion.
1 2 3 4 5
Not at all Occasionally Frequently Always Not applicable
19. I use games to teach and/or review new material (Jeopardy, etc.).
1 2 3 4 5
Not at all Occasionally Frequently Always Not applicable
20. I expect students to wait and read the assignment until after class has been held.
1 2 3 4 5
Not at all Occasionally Frequently Always Not applicable
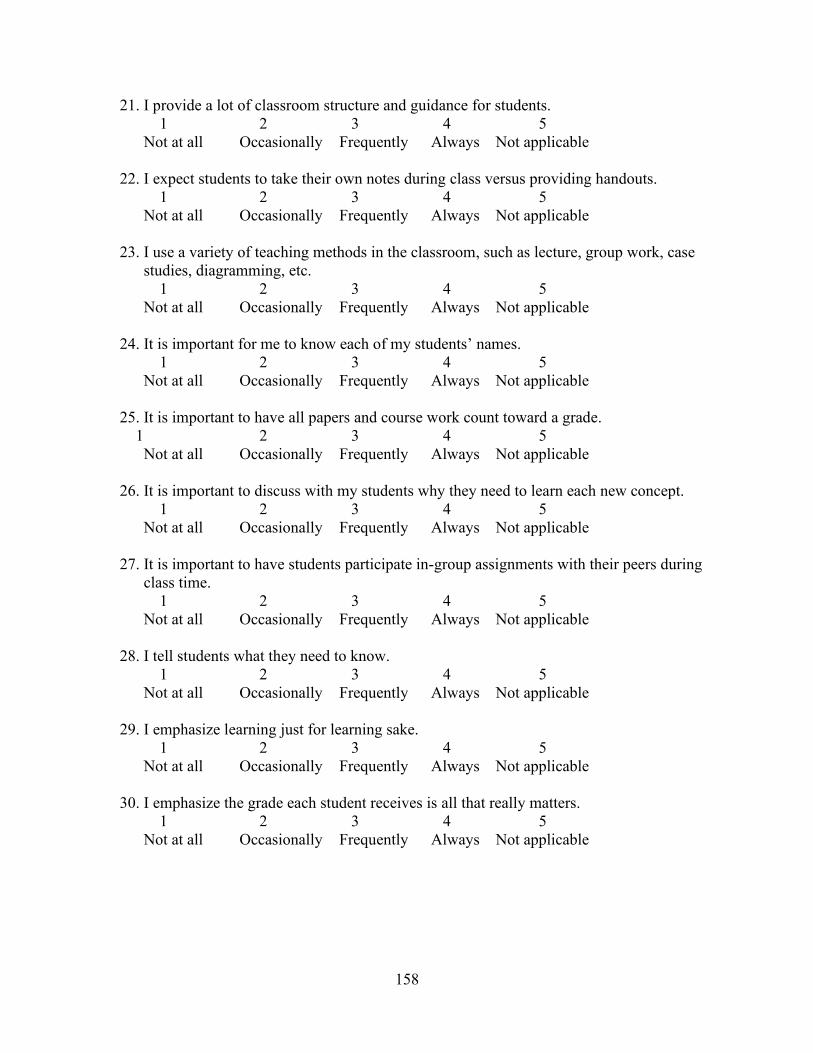
158
21. I provide a lot of classroom structure and guidance for students.
1 2 3 4 5
Not at all Occasionally Frequently Always Not applicable
22. I expect students to take their own notes during class versus providing handouts.
1 2 3 4 5
Not at all Occasionally Frequently Always Not applicable
23. I use a variety of teaching methods in the classroom, such as lecture, group work, case
studies, diagramming, etc.
1 2 3 4 5
Not at all Occasionally Frequently Always Not applicable
24. It is important for me to know each of my students’ names.
1 2 3 4 5
Not at all Occasionally Frequently Always Not applicable
25. It is important to have all papers and course work count toward a grade.
1 2 3 4 5
Not at all Occasionally Frequently Always Not applicable
26. It is important to discuss with my students why they need to learn each new concept.
1 2 3 4 5
Not at all Occasionally Frequently Always Not applicable
27. It is important to have students participate in-group assignments with their peers during
class time.
1 2 3 4 5
Not at all Occasionally Frequently Always Not applicable
28. I tell students what they need to know.
1 2 3 4 5
Not at all Occasionally Frequently Always Not applicable
29. I emphasize learning just for learning sake.
1 2 3 4 5
Not at all Occasionally Frequently Always Not applicable
30. I emphasize the grade each student receives is all that really matters.
1 2 3 4 5
Not at all Occasionally Frequently Always Not applicable

159
Check the five teaching methods you utilize the most often in your classroom:
___lecture
___case studies
___storytelling
___hands on activities
___activities with technology
___worksheets
___handouts
___visual aids (video, pictures, diagrams, etc.)
___group activities (presentations, working with peers to accomplish an activity)
___diagramming (concept maps, Venn diagrams, drawing, etc.)
___games (Jeopardy, etc.)
___group discussion (participating in classroom discussion on a topic)
___other – please specify ______________________
End of survey
Thank you very much for participating!
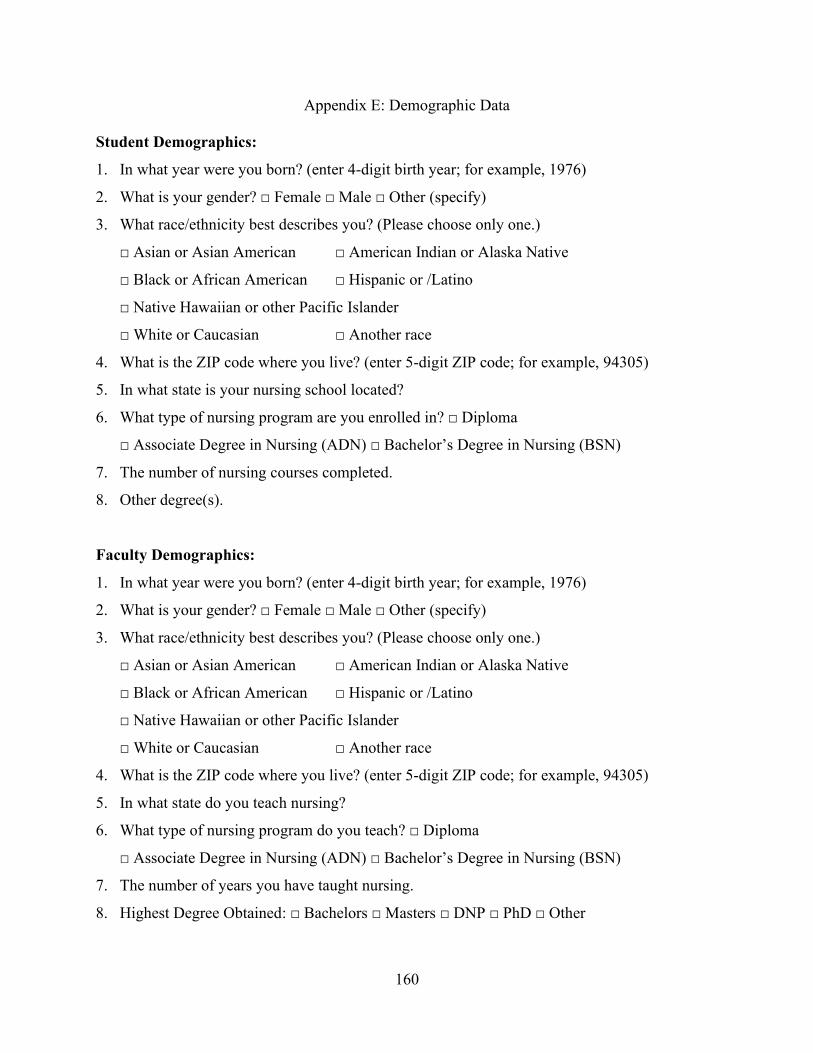
160
Appendix E: Demographic Data
Student Demographics:
1. In what year were you born? (enter 4-digit birth year; for example, 1976)
2. What is your gender? □ Female □ Male □ Other (specify)
3. What race/ethnicity best describes you? (Please choose only one.)
□ Asian or Asian American □ American Indian or Alaska Native
□ Black or African American □ Hispanic or /Latino
□ Native Hawaiian or other Pacific Islander
□ White or Caucasian □ Another race
4. What is the ZIP code where you live? (enter 5-digit ZIP code; for example, 94305)
5. In what state is your nursing school located?
6. What type of nursing program are you enrolled in? □ Diploma
□ Associate Degree in Nursing (ADN) □ Bachelor’s Degree in Nursing (BSN)
7. The number of nursing courses completed.
8. Other degree(s).
Faculty Demographics:
1. In what year were you born? (enter 4-digit birth year; for example, 1976)
2. What is your gender? □ Female □ Male □ Other (specify)
3. What race/ethnicity best describes you? (Please choose only one.)
□ Asian or Asian American □ American Indian or Alaska Native
□ Black or African American □ Hispanic or /Latino
□ Native Hawaiian or other Pacific Islander
□ White or Caucasian □ Another race
4. What is the ZIP code where you live? (enter 5-digit ZIP code; for example, 94305)
5. In what state do you teach nursing?
6. What type of nursing program do you teach? □ Diploma
□ Associate Degree in Nursing (ADN) □ Bachelor’s Degree in Nursing (BSN)
7. The number of years you have taught nursing.
8. Highest Degree Obtained: □ Bachelors □ Masters □ DNP □ PhD □ Other
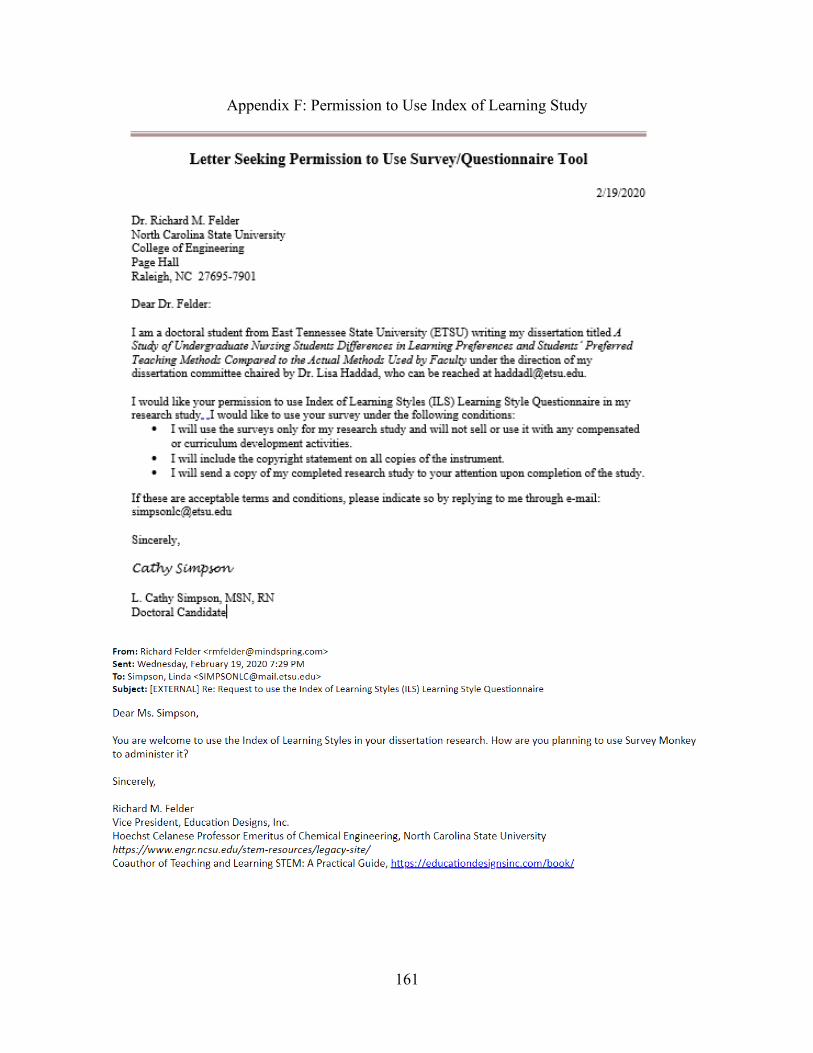
161
Appendix F: Permission to Use Index of Learning Study
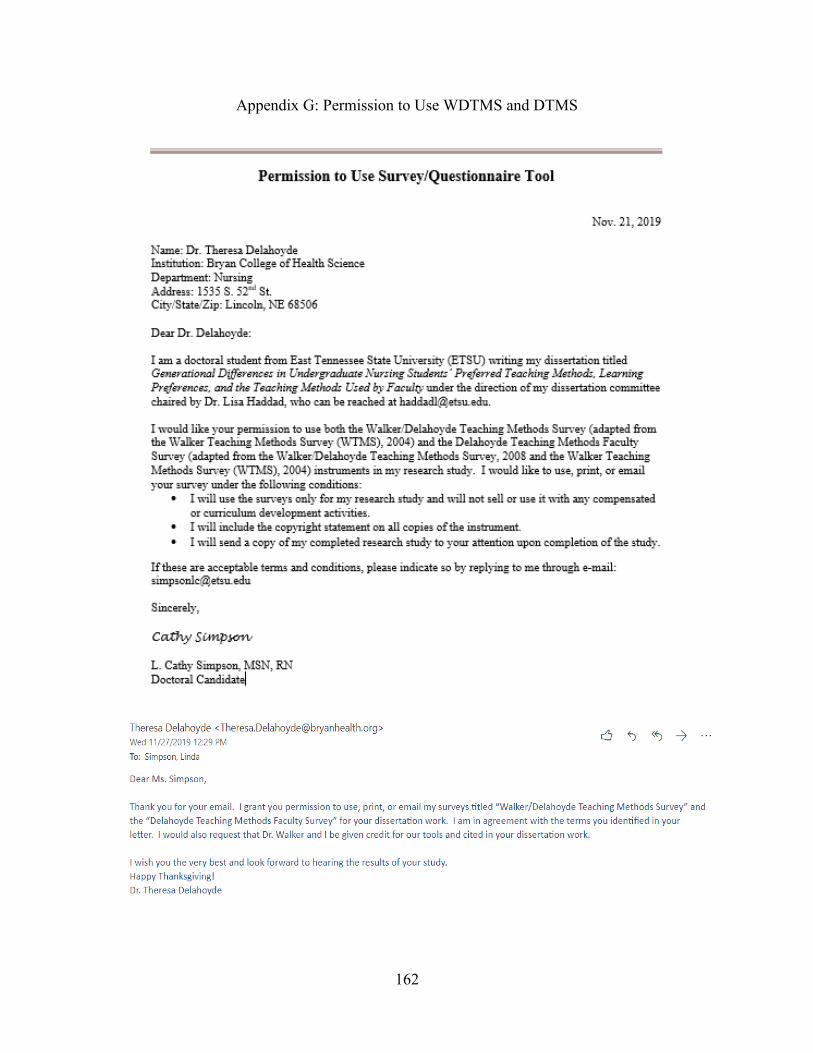
162
Appendix G: Permission to Use WDTMS and DTMS

163
Appendix H: Permission to Use WTMS
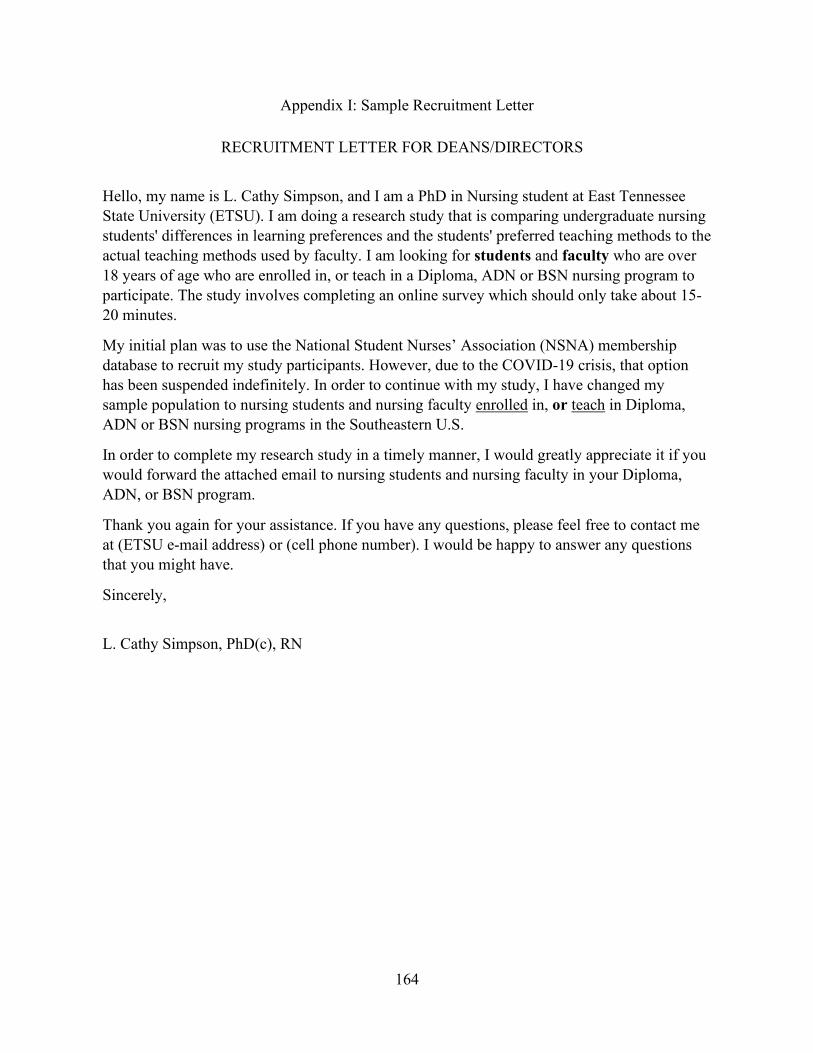
164
Appendix I: Sample Recruitment Letter
RECRUITMENT LETTER FOR DEANS/DIRECTORS
Hello, my name is L. Cathy Simpson, and I am a PhD in Nursing student at East Tennessee
State University (ETSU). I am doing a research study that is comparing undergraduate nursing
students' differences in learning preferences and the students' preferred teaching methods to the
actual teaching methods used by faculty. I am looking for students and faculty who are over
18 years of age who are enrolled in, or teach in a Diploma, ADN or BSN nursing program to
participate. The study involves completing an online survey which should only take about 15-
20 minutes.
My initial plan was to use the National Student Nurses’ Association (NSNA) membership
database to recruit my study participants. However, due to the COVID-19 crisis, that option
has been suspended indefinitely. In order to continue with my study, I have changed my
sample population to nursing students and nursing faculty enrolled in, or teach in Diploma,
ADN or BSN nursing programs in the Southeastern U.S.
In order to complete my research study in a timely manner, I would greatly appreciate it if you
would forward the attached email to nursing students and nursing faculty in your Diploma,
ADN, or BSN program.
Thank you again for your assistance. If you have any questions, please feel free to contact me
at (ETSU e-mail address) or (cell phone number). I would be happy to answer any questions
that you might have.
Sincerely,
L. Cathy Simpson, PhD(c), RN
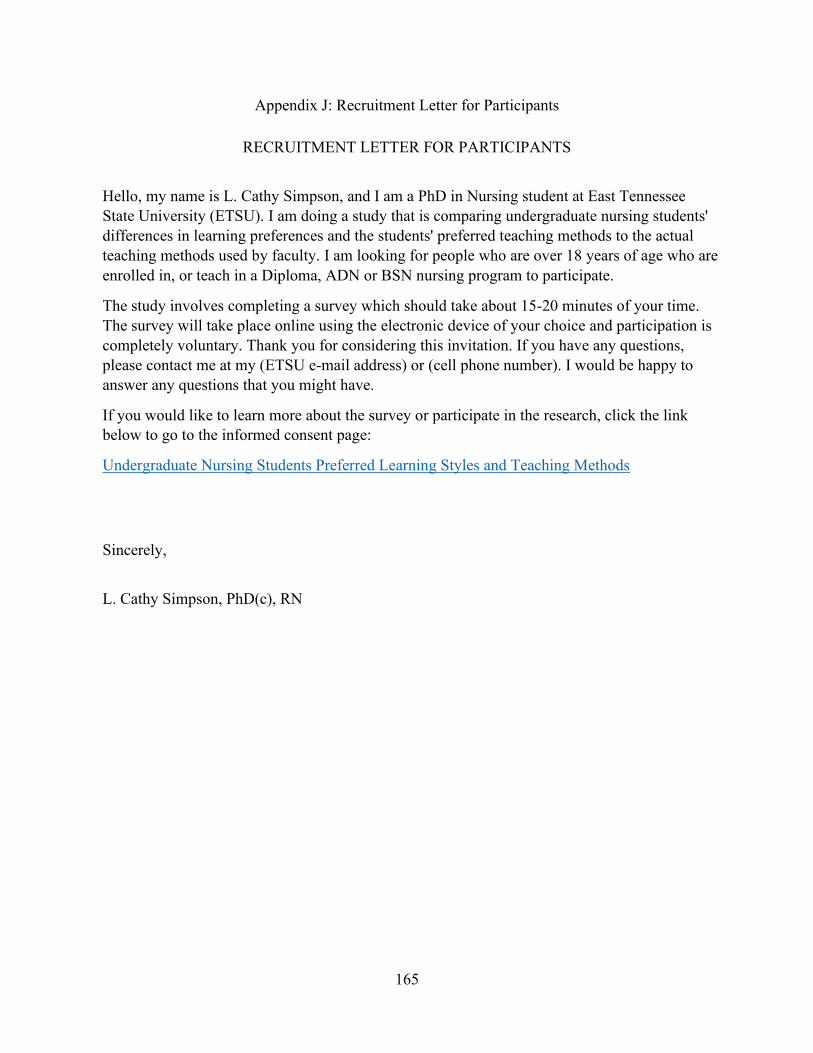
165
Appendix J: Recruitment Letter for Participants
RECRUITMENT LETTER FOR PARTICIPANTS
Hello, my name is L. Cathy Simpson, and I am a PhD in Nursing student at East Tennessee
State University (ETSU). I am doing a study that is comparing undergraduate nursing students'
differences in learning preferences and the students' preferred teaching methods to the actual
teaching methods used by faculty. I am looking for people who are over 18 years of age who are
enrolled in, or teach in a Diploma, ADN or BSN nursing program to participate.
The study involves completing a survey which should take about 15-20 minutes of your time.
The survey will take place online using the electronic device of your choice and participation is
completely voluntary. Thank you for considering this invitation. If you have any questions,
please contact me at my (ETSU e-mail address) or (cell phone number). I would be happy to
answer any questions that you might have.
If you would like to learn more about the survey or participate in the research, click the link
below to go to the informed consent page:
Undergraduate Nursing Students Preferred Learning Styles and Teaching Methods
Sincerely,
L. Cathy Simpson, PhD(c), RN
166
VITA
L. CATHY SIMPSON
Education: Ph. D. Nursing, East Tennessee State University,
Johnson City, Tennessee, 2020
M. S. Nursing, Indiana Wesleyan University,
Marion, Indiana, 2001
B. S. Nursing, University of Alabama at Birmingham,
Birmingham, Alabama, 1990
B. A. Christian Education, Asbury College,
Wilmore, Kentucky, 1987
Professional Experience: Nursing Instructor, Calhoun Community College,
Tanner, Alabama, 2018 – present
Associate Professor of Nursing, Motlow State Community
College, Smyrna, Tennessee, 2008-2018
Registered Nurse, Case Manager, StoneCrest Medical Center,
Smyrna, Tennessee, 2005-2012
Perinatal Nurse Manager, Nashville General Hospital,
Nashville, Tennessee, 2004-2005
Instructor of Nursing, Cumberland University,
Lebanon, Tennessee, 2002–2004
Registered Nurse, 1990-2001
Honors and Awards: National Institute for Staff and Organizational Development
(NISOD) Excellence Award, 2013
Faculty Excellence Award, Motlow State Community College, 2012