Embed Size (px)
Citation preview

Unconventional Oil and Gas Spills: Risks, Mitigation Priorities, and State
Reporting Requirements
Lauren A. Patterson1*
, Katherine E. Konschnik2, Hannah Wiseman
3, Joseph Fargione
4, Kelly O.
Maloney5, Joseph Kiesecker
6, Jean-Philippe Nicot
7, Sharon Baruch-Mordo
6, Sally Entrekin
8,
Anne Trainor9, James E. Saiers
10
1* Corresponding Author: Nicholas Institute for Environmental Policy Solutions at Duke
University, 2111 Campus Drive, Durham NC 27708, [email protected], 919-613-
3653 2 Environmental Policy Initiative, Harvard Law School, #4123 Wasserstein Hall, Cambridge,
MA 02138 3 Florida State University College of Law, 424 W. Jefferson Street, Tallahassee, FL 32306
4 The Nature Conservancy, 1101 West River Parkway, Suite 200, Minneapolis, MN 55415
5 U.S. Geological Survey, Leetown Science Center, Kearnevsville, WV 25430
6 The Nature Conservancy, Global Lands Team, 117 E. Mountain Avenue, Suite 201, Fort
Collins, CO 80524 7
Bureau of Economic Geology, Jackson School of Geosciences, the University of Texas at
Austin, 10100 Burnet Road, Building 130, Austin, Texas 78758 8 Department of Biology, University of Central Arkansas, 201 Donaghey Avenue, Conway, AR
72035 9 The Nature Conservancy, African Program, University of Cincinnati, Department of Biological
Sciences, 820G Rieveschl Hall, Cincinnati, OH 45221 10
School of Forestry and Environmental Studies, Yale University, 195 Prospect St., New Haven,
CT 06511
Supporting Information
20 pages
Table of Contents
Table S1: Number of new UOG wells drilled each year
Table S2: Cumulative number of UOG wells
Table S3: Pathways and causes assessed in this analysis
Table S4: Number of spills reported each year
Table S5: Number of expected versus observed spills
Table S6: Annual spill rates
Table S7: Number of spills by life-year of the well
Table S8: Spill rate by life-year
Table S9: Volume of reported spills
Table S10: Spill rates and volumes associated with tanks
Table S11: Spill rates and volumes associated with flowlines by causal mechanism

Figure S1: Number of new wells drilled and cumulative number of wells over time.
Figure S2: Timeline of changes in reporting volumes, methods, and content.
Figure S3: Boxplot showing the volume spilled by life-year of the well
Figure S4: Boxplot showing the volume spilled by pathway

S1
A. Federal laws requiring unconventional oil and gas spills to be reported
The Clean Water Act requires reporting of oil discharges (including oil mixed with other wastes)
into “waters of the United States”, or discharges that cause a sheen, discoloration, sludge, or a
violation of water quality standards (33 U.S.C. § 1321(b)(3), (5); 40 C.F.R. § 110.3). The federal
“Superfund” law – the Comprehensive Environmental Response, Compensation, and Liability
Act (CERCLA) - requires reporting of “releases” (42 U.S.C. §9601(22); 40 C.F.R. §300.5) of
hazardous substances above threshold quantities (42 U.S.C. §9602; 40 C.F.R. §302.4), but
exempts oil and gas exploration and production wastes, as well as oil, from these requirements
(42 U.S.C. §9601(14)). (Despite the oil and gas reporting exemption under CERCLA, spills of
fracturing fluid chemicals, some of which are hazardous, might trigger Superfund reporting
requirements.) Federal transportation rules require reporting if a hazardous material being
transported “in commerce” (across state lines) causes death or hospitalization, a public
evacuation or the closing of a major transportation artery or facility for at least an hour, or if
there is an unintentional release of a hazardous material or discharge of hazardous waste of any
size (49 C.F.R. §171.15, 16).
B. Data
Here we describe data sources and how unconventional oil and gas (UOG) wells were selected.
As stated in the paper, the distinctions between conventional and UOG wells were not always
clear and we were conservative to ensure the spills we assessed were linked to UOG activity.
Colorado
Colorado provides oil and gas, as well as spills, data through its Oil & Gas Conservation
Commission (COGCC) housed in the Department of Natural Resources
(http://cogcc.state.co.us/#/home). However, the well data did not provide sufficient information
to discern which wells were unconventional; therefore, we relied on the IHS Enerdeq database
(https://www.ihs.com/Info/en/a/unconventional/e-p-data.html) for UOG wells. We included only
those wells that had a horizontal orientation or reported more than 3,785 m3 (1 Mgal) of water
used for completion. Many of Colorado’s wells have been re-drilled and re-fractured between
1995 and 2014. We assessed the data based on the first date of completion. There were 9,436
new UOG wells with a spud date between1995 and 2014 in Colorado (Figure S1; Table S1).
S2
New Mexico
We obtained data pertaining to New Mexico oil and gas wells from the State of New Mexico’s
Oil Conservation Division (OCD; http://www.emnrd.state.nm.us/OCD/ocdgis.html). The dataset
included over 114,781 wells. We included only those wells with a horizontal orientation as UOG
wells. Not including vertical wells will omit some UOG wells, but ensured that we avoided
including non-fractured wells. The dataset had several missing values (n=3,239) for well
direction (vertical, horizontal, or deviated). Well API’s were entered into the online OCD
permitting database to obtain well direction. If well direction was still missing but the well name
contained an “H” at the end, it was given a horizontal direction. There were 3,624 horizontal
wells with a spud date between 2005 and 2014, with the number of new wells annually
continuing to increase (Figure S1; Table S1). New Mexico spill data were scraped from the
NMOCD website on spills
(https://wwwapps.emnrd.state.nm.us/ocd/ocdpermitting/Data/Incidents/Spills.aspx). We matched
the spill API to the horizontal well API’s and kept only those spill records that matched to an
UOG well.
North Dakota
We obtained a shapefile of North Dakota oil and gas wells from the North Dakota Industrial
Commission, Department of Mineral Resources, Oil and Gas Division
(https://www.dmr.nd.gov/oilgas/). The dataset included 28,155 wells. We included only those oil
and gas wells with a spud date between 1995 and 2014 that had a horizontal orientation as
indicated by the well name (include “H”, “HR”, “HZ”, or “HOR”) to ensure the wells were
unconventional. There were 11,860 wells identified as oil and gas and 10,068 wells that were
also labeled as having a horizontal orientation (Figure S1; Table S1). Spill data in North Dakota
were obtained from the oilfield environmental incident summary reports held on the North
Dakota Department of Health – Environmental health website
(https://www.ndhealth.gov/EHS/Spills/).
Pennsylvania
The Pennsylvania Department of Environmental Protection (PADEP) Oil and Gas reporting
website provides production data for unconventional oil and gas wells
S3
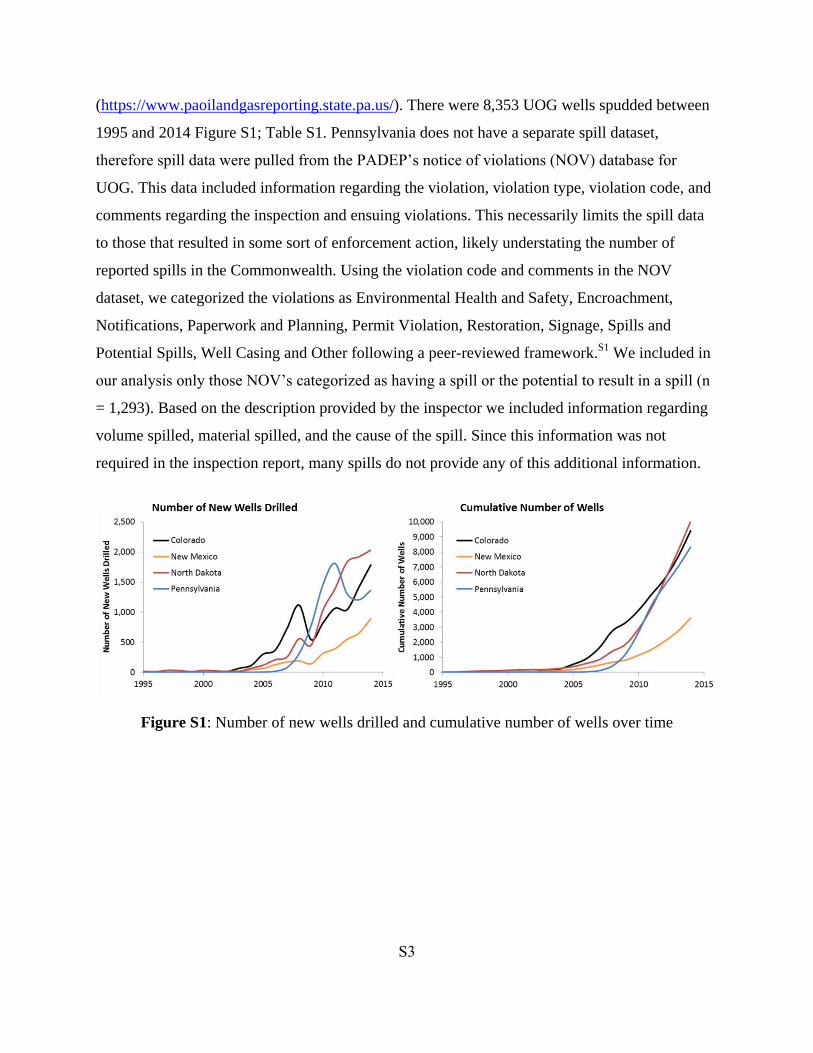
(https://www.paoilandgasreporting.state.pa.us/). There were 8,353 UOG wells spudded between
1995 and 2014 Figure S1; Table S1. Pennsylvania does not have a separate spill dataset,
therefore spill data were pulled from the PADEP’s notice of violations (NOV) database for
UOG. This data included information regarding the violation, violation type, violation code, and
comments regarding the inspection and ensuing violations. This necessarily limits the spill data
to those that resulted in some sort of enforcement action, likely understating the number of
reported spills in the Commonwealth. Using the violation code and comments in the NOV
dataset, we categorized the violations as Environmental Health and Safety, Encroachment,
Notifications, Paperwork and Planning, Permit Violation, Restoration, Signage, Spills and
Potential Spills, Well Casing and Other following a peer-reviewed framework.S1
We included in
our analysis only those NOV’s categorized as having a spill or the potential to result in a spill (n
= 1,293). Based on the description provided by the inspector we included information regarding
volume spilled, material spilled, and the cause of the spill. Since this information was not
required in the inspection report, many spills do not provide any of this additional information.
Figure S1: Number of new wells drilled and cumulative number of wells over time
S4
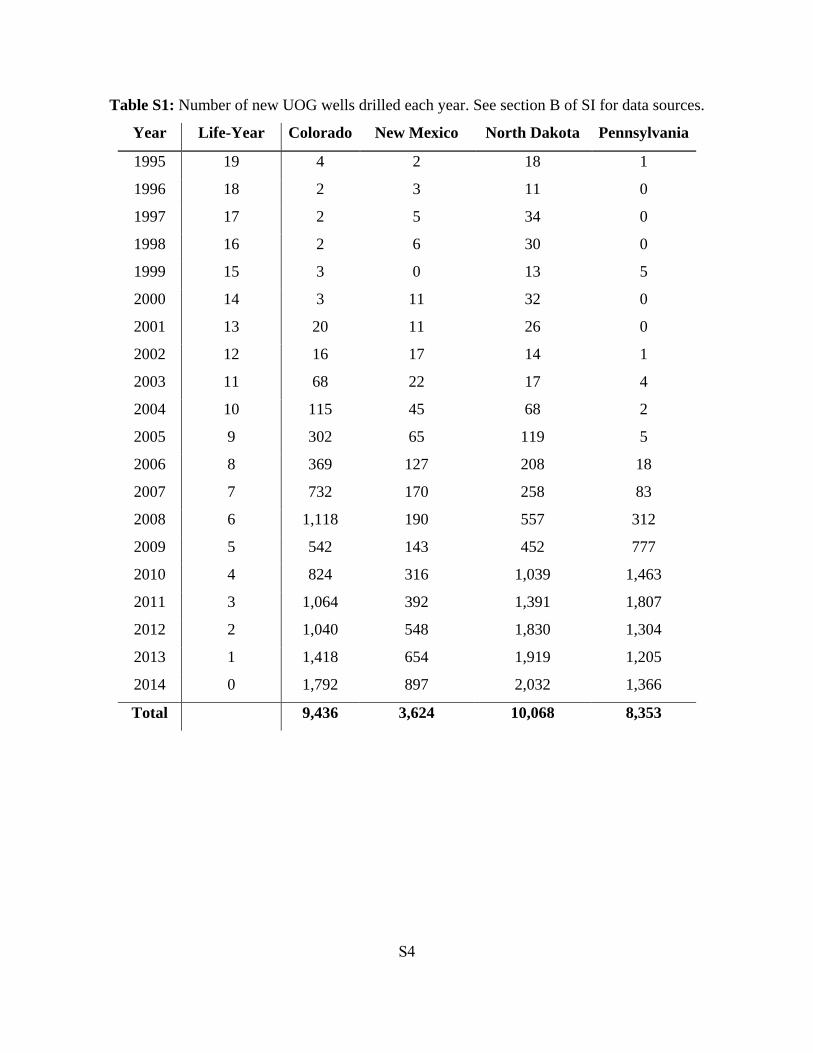
Table S1: Number of new UOG wells drilled each year. See section B of SI for data sources.
Year Life-Year Colorado New Mexico North Dakota Pennsylvania
1995 19 4 2 18 1
1996 18 2 3 11 0
1997 17 2 5 34 0
1998 16 2 6 30 0
1999 15 3 0 13 5
2000 14 3 11 32 0
2001 13 20 11 26 0
2002 12 16 17 14 1
2003 11 68 22 17 4
2004 10 115 45 68 2
2005 9 302 65 119 5
2006 8 369 127 208 18
2007 7 732 170 258 83
2008 6 1,118 190 557 312
2009 5 542 143 452 777
2010 4 824 316 1,039 1,463
2011 3 1,064 392 1,391 1,807
2012 2 1,040 548 1,830 1,304
2013 1 1,418 654 1,919 1,205
2014 0 1,792 897 2,032 1,366
Total 9,436 3,624 10,068 8,353

S5
Table S2: Cumulative number of UOG wells. See section B of SI for data sources.
Year Colorado New Mexico North Dakota Pennsylvania
1995 4 2 18 1
1996 6 5 29 1
1997 8 10 63 1
1998 10 16 93 1
1999 13 16 106 6
2000 16 27 138 6
2001 36 38 164 6
2002 52 55 178 7
2003 120 77 195 11
2004 235 122 263 13
2005 537 187 382 18
2006 906 314 590 36
2007 1,638 484 848 119
2008 2,756 674 1,405 431
2009 3,298 817 1,857 1,208
2010 4,122 1,133 2,896 2,671
2011 5,186 1,525 4,287 4,478
2012 6,226 2,073 6,117 5,782
2013 7,644 2,727 8,036 6,987
2014 9,436 3,624 10,068 8,353
*Well Years 41,749 13,558 36,486 30,083
*Only the cumulative sum of wells between 2005 and 2014 (when spills data were available)
were used in the calculation of well years. Spills may have occurred prior to 2005; however, we
do not have that information and don’t want to include those well years in the denominator.
S6
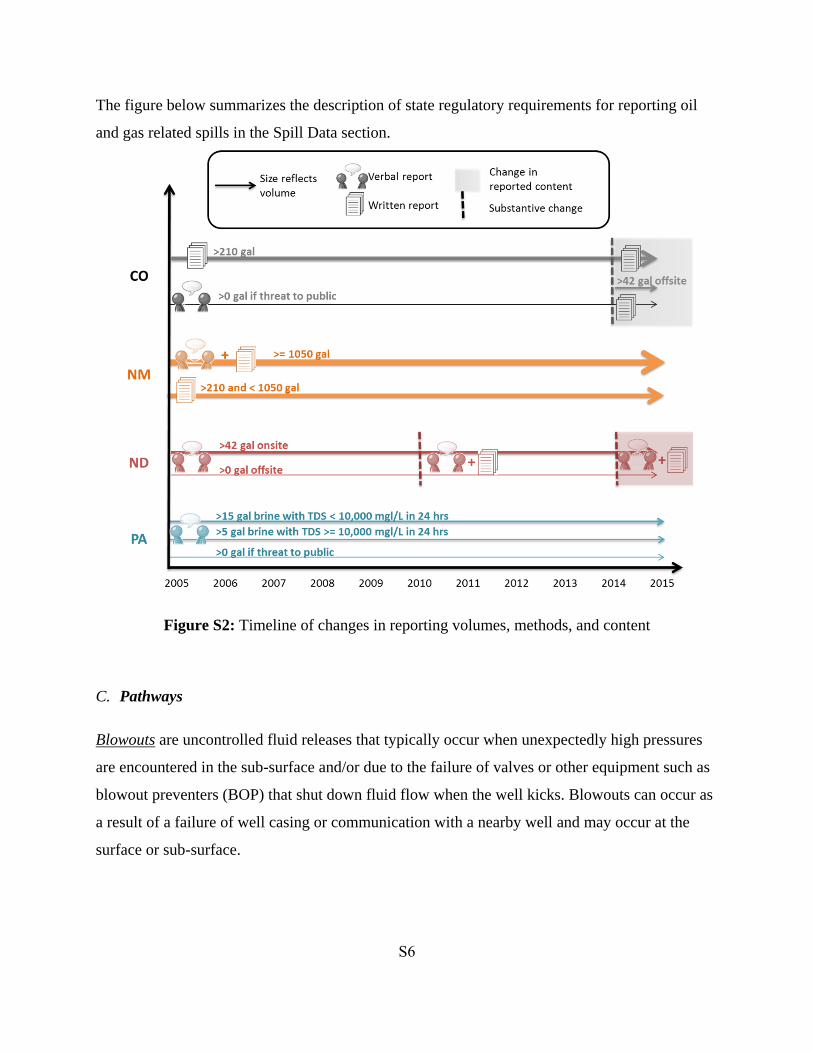
The figure below summarizes the description of state regulatory requirements for reporting oil
and gas related spills in the Spill Data section.
Figure S2: Timeline of changes in reporting volumes, methods, and content
C. Pathways
Blowouts are uncontrolled fluid releases that typically occur when unexpectedly high pressures
are encountered in the sub-surface and/or due to the failure of valves or other equipment such as
blowout preventers (BOP) that shut down fluid flow when the well kicks. Blowouts can occur as
a result of a failure of well casing or communication with a nearby well and may occur at the
surface or sub-surface.
S7
Drilling Equipment is required for well drilling and well casing. Leaks and spills tied to drill rigs,
shakers, and active mud systems were all classified under this category. This pathway does not
include spills of drilling materials that occurred at pits, flowlines, or via transportation.
Completion Equipment includes blenders, flowback equipment, chemical totes, and storage
containers for chemicals. This pathway is only for those spills clearly related to completion
equipment. Spills related to tanks, pits, transportation, or pumps are categorized under those
pathways as there often was not consistently reported to differentiate between completion and
production related spills. Few spills were tied directly to completion equipment; however spills
of completion materials have the potential for high toxicity and impact to the environment.
Tanks are used to temporarily store wastewater and crude oil. Tank batteries are a group of tanks
used for storing produced water and crude oil during various stages of separation. In Colorado,
buried produced water vaults were included under the tank category. Tanks are a primary
location for spills to occur as overflows may happen at a tank due to problems with the heater
treater, pump, separator, or other equipment failures further down the line. However, since the
spill occurred at the tank, the tank is the primary pathway with equipment failure being the
causal mechanism.
Pits are dug into the ground and are used to temporarily store drill cuttings, wastewater, and
crude oil. Regulations related to pits include requirements for pit liners to avoid leaks and
freeboard space to avoid overflows.
Flowlines carry fluids from the wellhead to and between equipment such as tanks, blenders, pits,
and injection wells. Flowlines can be constructed with different levels of permanence, located
above or underground, and composed of materials such as steel or fiberglass. Spills reports
appeared to use terms interchangeably such as: pipeline, injection line, production line, gathering
line, dump lines, and water lines. Due to the lack of consistency in the spill data, we included all
of these together under the pathway of flowlines since the spill occurred in the process of
transferring materials between vessels.
Transportation refers to the loading and unloading of materials between trucks and a tank or pit.
This category was sub-divided into spills that occurred during the loading and unloading process,
S8
illegal dumping of materials, and spills that occurred while the vehicle was in transit between
locations.
Pumps are used to move fluid or gas by pressure or suction. Spills can occur at the pump location
or away from the pump. For example, a tank may overflow due to a pump failure. In this case the
pathway would be linked to the tank since that is where the spill occurred, with the underlying
cause being equipment failure. As a result, the number of spills related to pumps is conservative.
Heater Treater is a vessel that uses heat to break oil-water emulsions to prepare oil for
transportation.
Stuffing Box is a device that prevents leakage at the wellhead if a polish rod is used to lift fluids
out of the well, as well as leaks from valves, pistons, etc.
Wellhead is the point where oil is extracted from the ground. Some spills are linked to a valve at
the wellhead while other spills are linked to specific types of equipment around the wellhead
such as the blowout preventer, free water knockout, and separator.
S9
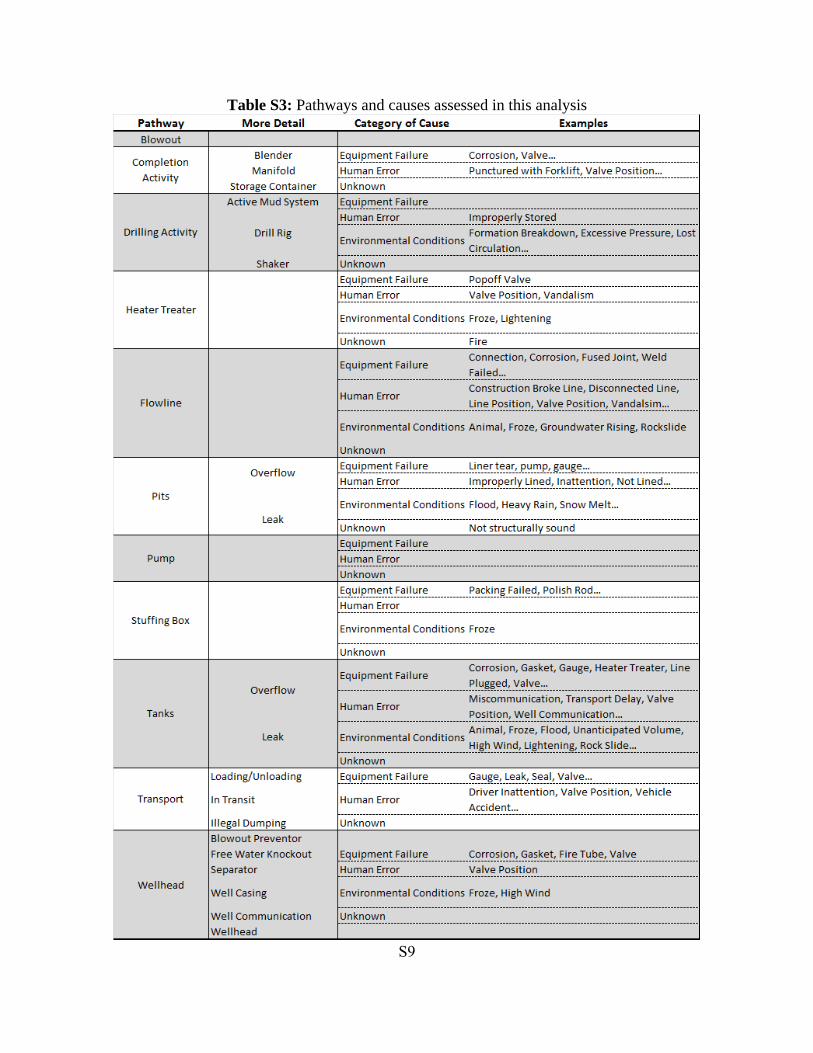
Table S3: Pathways and causes assessed in this analysis
S10
D. Results
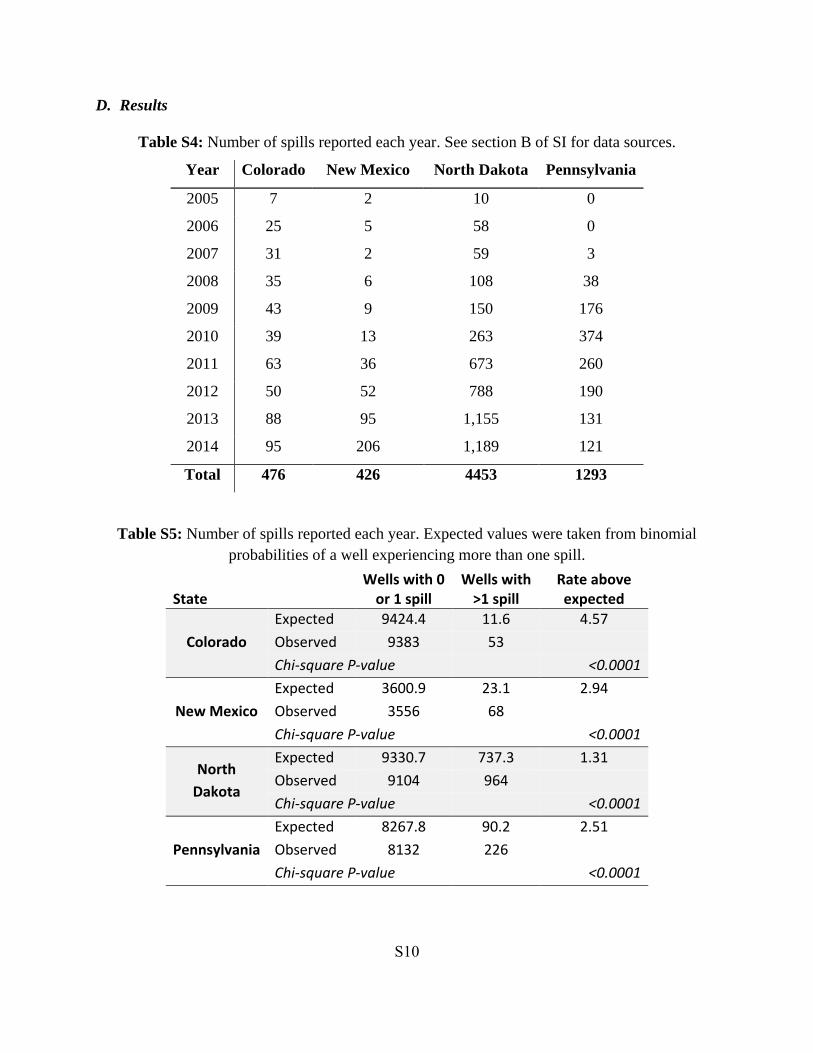
Table S4: Number of spills reported each year. See section B of SI for data sources.
Year Colorado New Mexico North Dakota Pennsylvania
2005 7 2 10 0
2006 25 5 58 0
2007 31 2 59 3
2008 35 6 108 38
2009 43 9 150 176
2010 39 13 263 374
2011 63 36 673 260
2012 50 52 788 190
2013 88 95 1,155 131
2014 95 206 1,189 121
Total 476 426 4453 1293
Table S5: Number of spills reported each year. Expected values were taken from binomial
probabilities of a well experiencing more than one spill.
State Wells with 0
or 1 spill Wells with
>1 spill Rate above expected
Colorado
Expected 9424.4 11.6 4.57
Observed 9383 53
Chi-square P-value
<0.0001
New Mexico
Expected 3600.9 23.1 2.94
Observed 3556 68
Chi-square P-value
<0.0001
North
Dakota
Expected 9330.7 737.3 1.31
Observed 9104 964
Chi-square P-value
<0.0001
Pennsylvania
Expected 8267.8 90.2 2.51
Observed 8132 226
Chi-square P-value <0.0001
S11
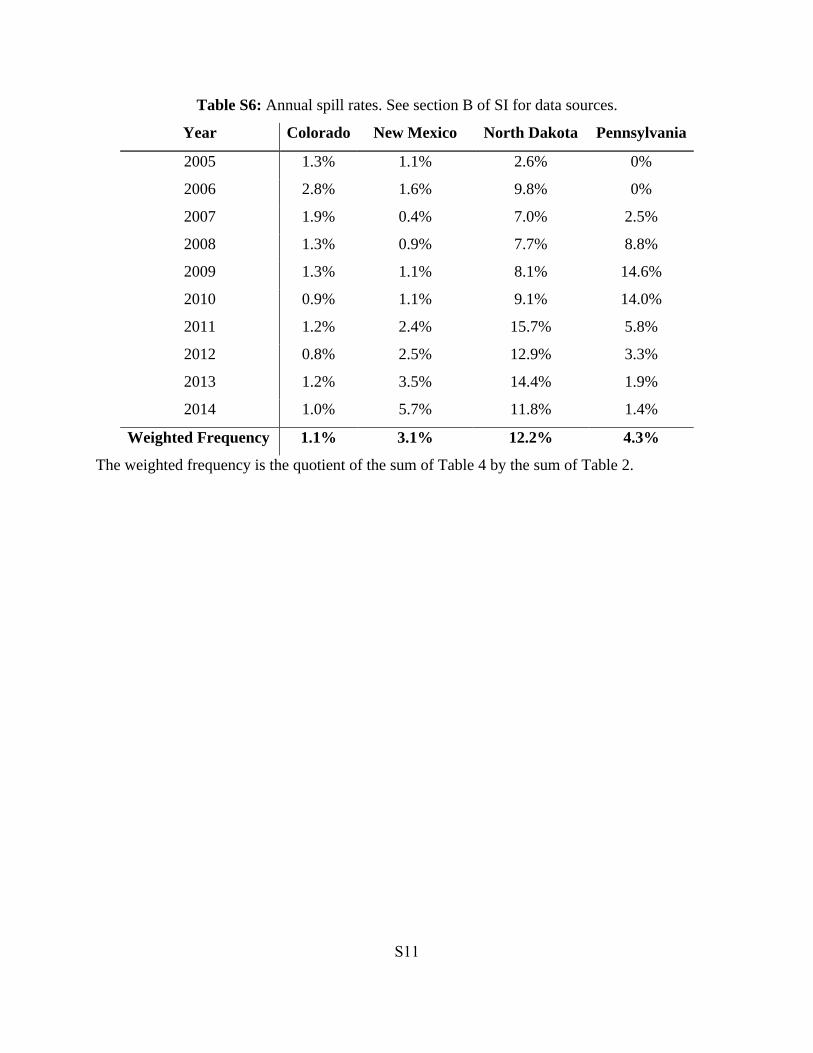
Table S6: Annual spill rates. See section B of SI for data sources.
Year Colorado New Mexico North Dakota Pennsylvania
2005 1.3% 1.1% 2.6% 0%
2006 2.8% 1.6% 9.8% 0%
2007 1.9% 0.4% 7.0% 2.5%
2008 1.3% 0.9% 7.7% 8.8%
2009 1.3% 1.1% 8.1% 14.6%
2010 0.9% 1.1% 9.1% 14.0%
2011 1.2% 2.4% 15.7% 5.8%
2012 0.8% 2.5% 12.9% 3.3%
2013 1.2% 3.5% 14.4% 1.9%
2014 1.0% 5.7% 11.8% 1.4%
Weighted Frequency 1.1% 3.1% 12.2% 4.3%
The weighted frequency is the quotient of the sum of Table 4 by the sum of Table 2.

S12
Table S7: Number of spills by life-year of the well. See section B of SI for data sources.
Life-Year Colorado New Mexico North Dakota Pennsylvania
0 244 125 1,452 689
1 103 114 1,226 452
2 44 80 666 117
3 23 61 405 39
4 19 22 240 19
5 18 10 141 13
6 10 5 117 5
7 4 3 57 1
8 6 2 39 0
9 3 2 24 1
10 1 1 20 0
11 0 0 15 1
12 0 0 16 0
13 0 0 15 0
14 0 0 5 0
15 0 0 4 0
16 0 1 8 0
17 0 0 2 0
18 0 0 1 0
19 0 0 0 0
S13
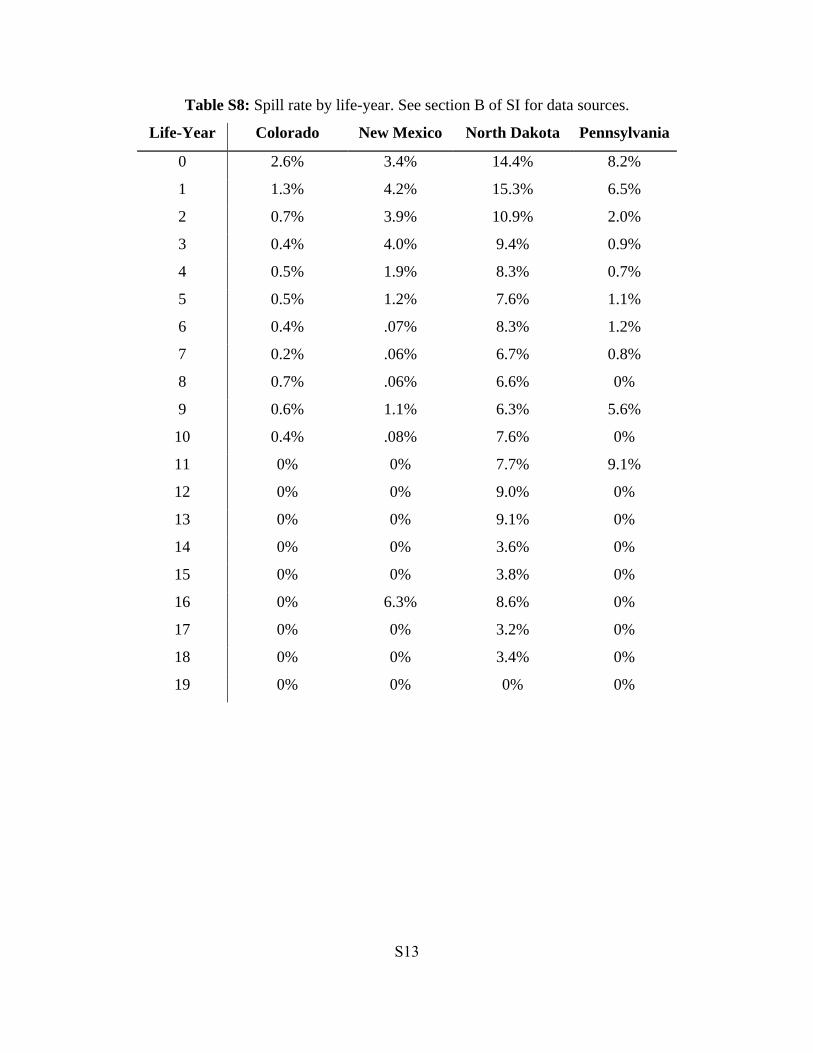
Table S8: Spill rate by life-year. See section B of SI for data sources.
Life-Year Colorado New Mexico North Dakota Pennsylvania
0 2.6% 3.4% 14.4% 8.2%
1 1.3% 4.2% 15.3% 6.5%
2 0.7% 3.9% 10.9% 2.0%
3 0.4% 4.0% 9.4% 0.9%
4 0.5% 1.9% 8.3% 0.7%
5 0.5% 1.2% 7.6% 1.1%
6 0.4% .07% 8.3% 1.2%
7 0.2% .06% 6.7% 0.8%
8 0.7% .06% 6.6% 0%
9 0.6% 1.1% 6.3% 5.6%
10 0.4% .08% 7.6% 0%
11 0% 0% 7.7% 9.1%
12 0% 0% 9.0% 0%
13 0% 0% 9.1% 0%
14 0% 0% 3.6% 0%
15 0% 0% 3.8% 0%
16 0% 6.3% 8.6% 0%
17 0% 0% 3.2% 0%
18 0% 0% 3.4% 0%
19 0% 0% 0% 0%
S14
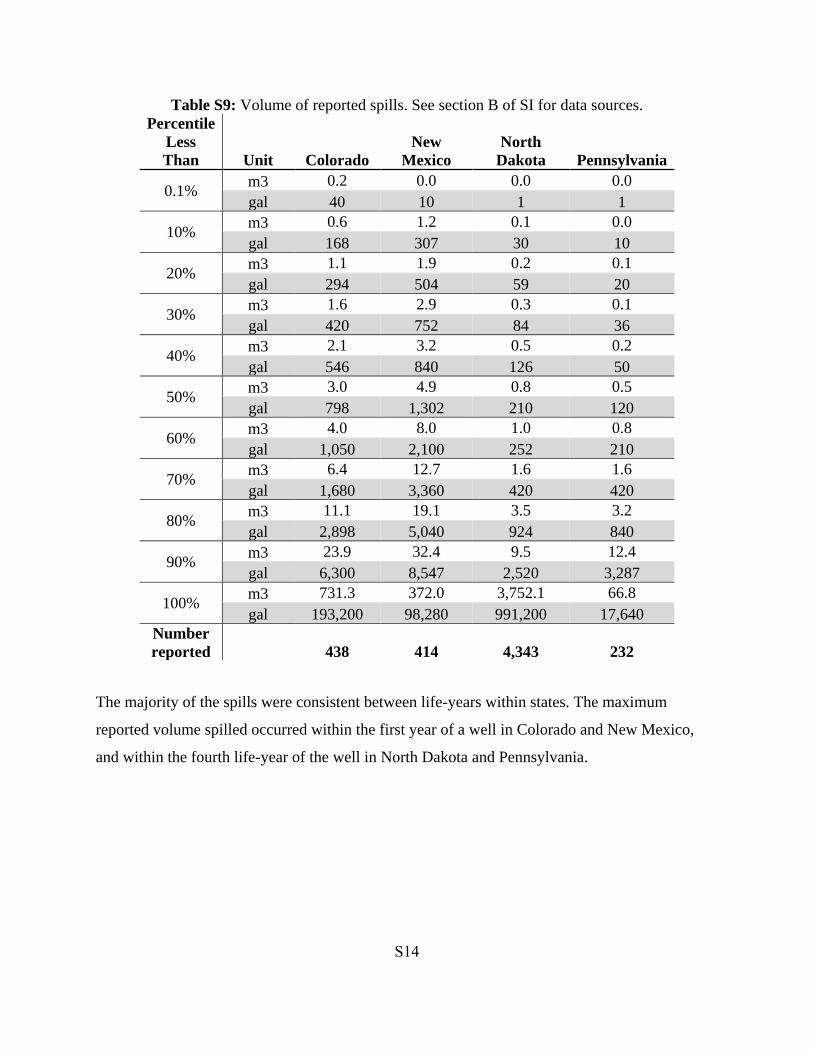
Table S9: Volume of reported spills. See section B of SI for data sources.
Percentile
Less
Than Unit Colorado
New
Mexico
North
Dakota Pennsylvania
0.1% m3 0.2 0.0 0.0 0.0
gal 40 10 1 1
10% m3 0.6 1.2 0.1 0.0
gal 168 307 30 10
20% m3 1.1 1.9 0.2 0.1
gal 294 504 59 20
30% m3 1.6 2.9 0.3 0.1
gal 420 752 84 36
40% m3 2.1 3.2 0.5 0.2
gal 546 840 126 50
50% m3 3.0 4.9 0.8 0.5
gal 798 1,302 210 120
60% m3 4.0 8.0 1.0 0.8
gal 1,050 2,100 252 210
70% m3 6.4 12.7 1.6 1.6
gal 1,680 3,360 420 420
80% m3 11.1 19.1 3.5 3.2
gal 2,898 5,040 924 840
90% m3 23.9 32.4 9.5 12.4
gal 6,300 8,547 2,520 3,287
100% m3 731.3 372.0 3,752.1 66.8
gal 193,200 98,280 991,200 17,640
Number
reported
438 414 4,343 232
The majority of the spills were consistent between life-years within states. The maximum
reported volume spilled occurred within the first year of a well in Colorado and New Mexico,
and within the fourth life-year of the well in North Dakota and Pennsylvania.
S15
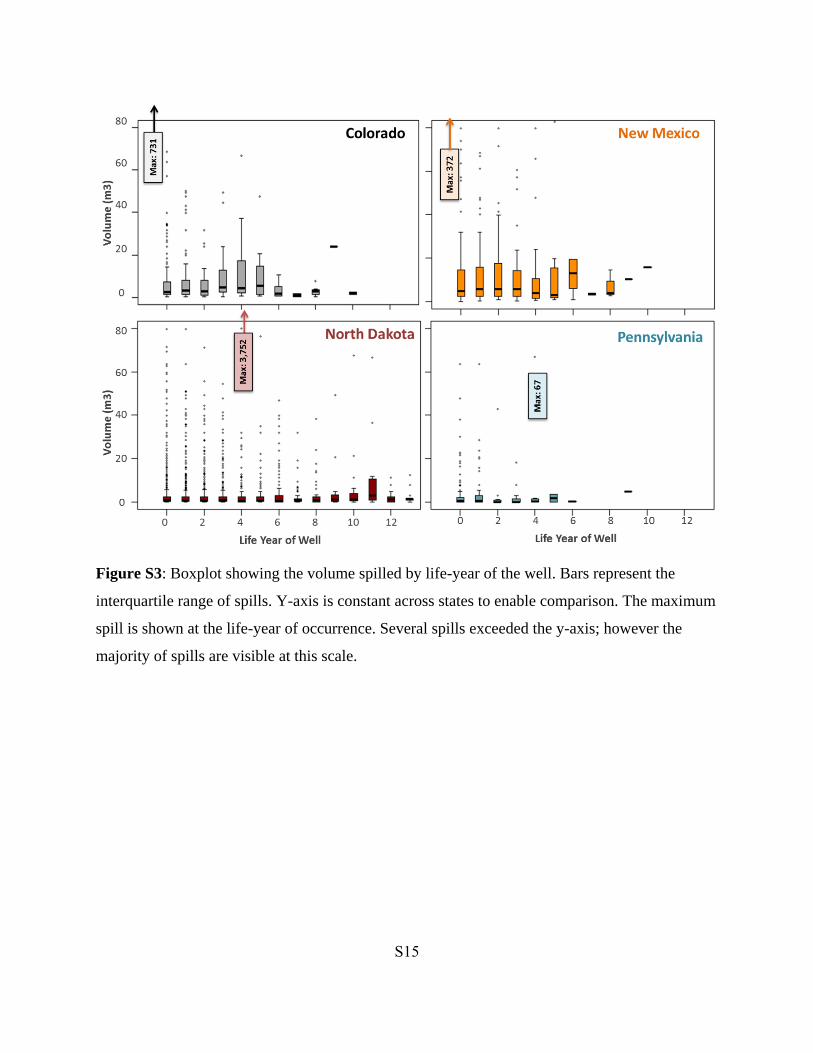
Figure S3: Boxplot showing the volume spilled by life-year of the well. Bars represent the
interquartile range of spills. Y-axis is constant across states to enable comparison. The maximum
spill is shown at the life-year of occurrence. Several spills exceeded the y-axis; however the
majority of spills are visible at this scale.
S16
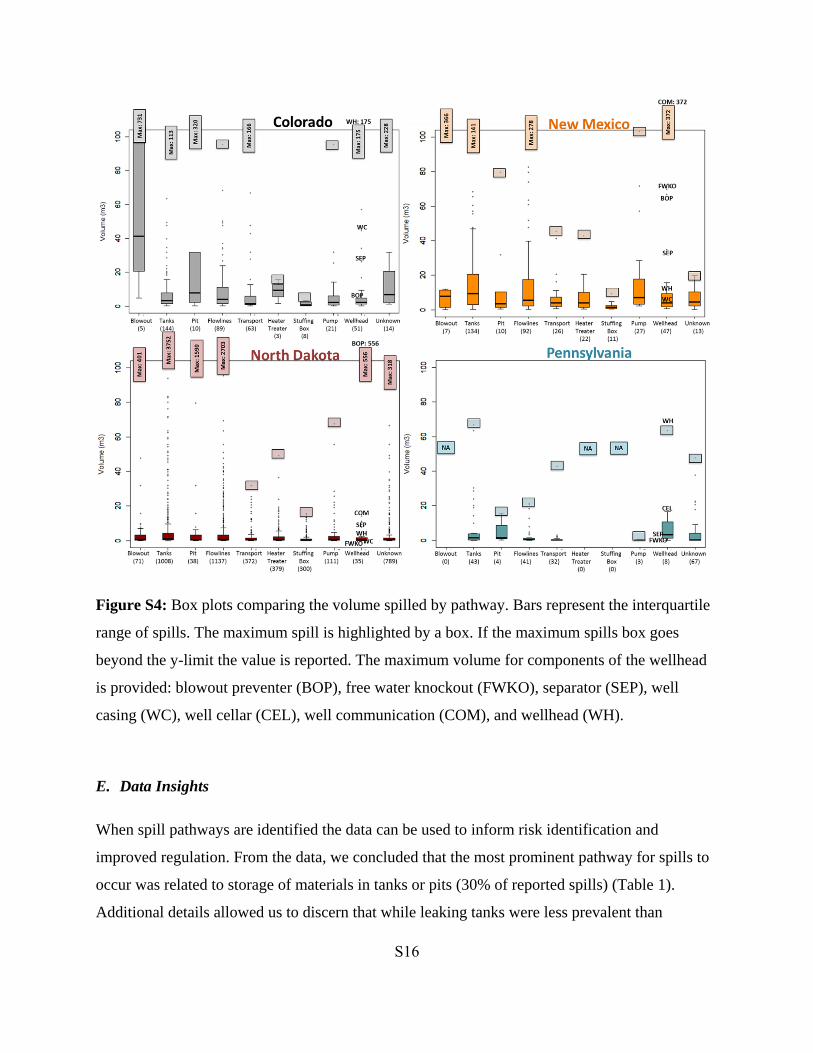
Figure S4: Box plots comparing the volume spilled by pathway. Bars represent the interquartile
range of spills. The maximum spill is highlighted by a box. If the maximum spills box goes
beyond the y-limit the value is reported. The maximum volume for components of the wellhead
is provided: blowout preventer (BOP), free water knockout (FWKO), separator (SEP), well
casing (WC), well cellar (CEL), well communication (COM), and wellhead (WH).
E. Data Insights
When spill pathways are identified the data can be used to inform risk identification and
improved regulation. From the data, we concluded that the most prominent pathway for spills to
occur was related to storage of materials in tanks or pits (30% of reported spills) (Table 1).
Additional details allowed us to discern that while leaking tanks were less prevalent than

S17
overflowing tanks, the spills from leaks tended to be larger (Table S10). In Colorado, 72% of
leaks were due to equipment failure (31% corrosion) while 51% of overflow events were caused
by human errors. In New Mexico, equipment failure was the prominent cause for both leaks
(54%) and overflows (44%), while all spills related to environmental conditions, such as
lightning strikes and flooding, released nearly twice the volume of material (~22.4 m3). Neither
North Dakota nor Pennsylvania provided sufficient information to determine causal mechanisms
(90% and 80% unknown), respectively.
Table S10: Spill rates and volumes associated with tanks
Tanks Colorado New Mexico North Dakota Pennsylvania
Percent of
Spills
Leak 13 25.5 27.4 37.3
Overflow 43.2 52.6 70.7 32.7
Unknown 43.8 21.9 2 30
Median
Volume
(m3)
Leak 3.4 15.5 1.6 1.7
Overflow 4 6.4 1 1.2
Unknown 3.2 9.5 1.6 1
Pits, similar to tanks, had greater volumes released through leaks than overflows. The majority of
pit leaks were due to liner issues: either a tear in the liner (equipment failure) or the pit was
improperly lined (human error). Pits were also more susceptible to spills resulting from
environmental conditions such as flooding, heavy rain, and snow melt. For example, in 2011
North Dakota reported 18 pits overflowed due to snow melt.
Tanks and pits were particularly susceptible to large volume spills during the initial stages of
completion when large volumes of flowback and produced water are coming to the surface.
Several wells in Colorado mentioned overflows due to unanticipated volumes.
One caveat regarding why tanks and pits may appear as the most prominent pathway is due to
how spills were reported, at least with respect to overflows due to equipment failure or unknown
reasons, and our definition of pathway. For example, the spill was released to the ground at a
tank due to the tank overflowing. However, in the description of the spill the root cause may be
due to equipment failure at the heater treater. We defined this spill as a tank overflow due to
equipment failure. However, others might have defined the pathway not as the location at which
S18
the spill occurred, but the reason behind the spill (i.e. the pathway would have been directly
linked to the heater treater).
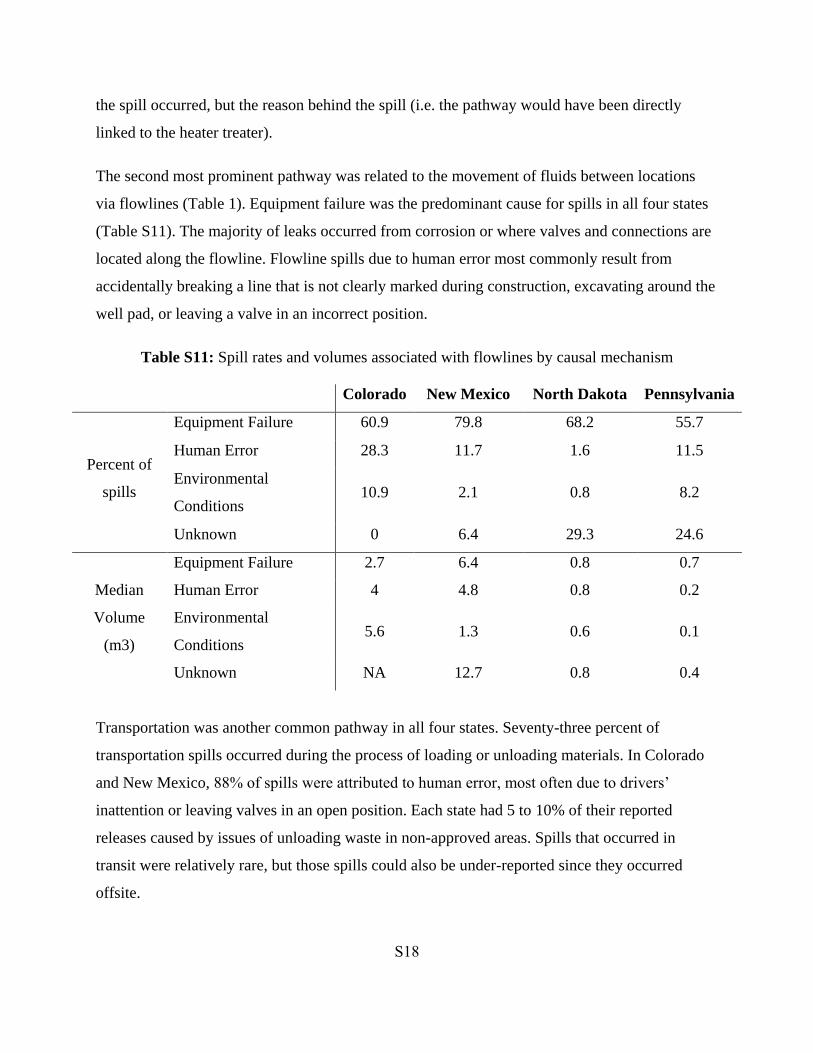
The second most prominent pathway was related to the movement of fluids between locations
via flowlines (Table 1). Equipment failure was the predominant cause for spills in all four states
(Table S11). The majority of leaks occurred from corrosion or where valves and connections are
located along the flowline. Flowline spills due to human error most commonly result from
accidentally breaking a line that is not clearly marked during construction, excavating around the
well pad, or leaving a valve in an incorrect position.
Table S11: Spill rates and volumes associated with flowlines by causal mechanism
Colorado New Mexico North Dakota Pennsylvania
Percent of
spills
Equipment Failure 60.9 79.8 68.2 55.7
Human Error 28.3 11.7 1.6 11.5
Environmental
Conditions 10.9 2.1 0.8 8.2
Unknown 0 6.4 29.3 24.6
Median
Volume
(m3)
Equipment Failure 2.7 6.4 0.8 0.7
Human Error 4 4.8 0.8 0.2
Environmental
Conditions 5.6 1.3 0.6 0.1
Unknown NA 12.7 0.8 0.4
Transportation was another common pathway in all four states. Seventy-three percent of
transportation spills occurred during the process of loading or unloading materials. In Colorado
and New Mexico, 88% of spills were attributed to human error, most often due to drivers’
inattention or leaving valves in an open position. Each state had 5 to 10% of their reported
releases caused by issues of unloading waste in non-approved areas. Spills that occurred in
transit were relatively rare, but those spills could also be under-reported since they occurred
offsite.

S19
F. Links to spill forms used by states
Colorado: http://cogcc.state.co.us/forms/PDF_Forms/form19.pdf
New Mexico: http://www.emnrd.state.nm.us/OCD/documents/C-14120110808.pdf
North Dakota: https://www.dmr.nd.gov/oilgas/mvc/wincident/Incident/Create
Pennsylvania: No forms are used
PADEP recently updated its regulations. Once they go into effect, the new rules will require a
written report if the release is more than 42 gallons (1 barrel) that pollute or threaten to pollute
Pennsylvania watersS2
. The new written report requires information about the “nature of the
contaminant”, the location of the incident, and the effect (not the cause) of the spill.
G. Limitations
The lack of consistency in how spills are reported within a state will lead to inconsistent findings
between studies because different analysts interpret descriptions of events differently. For
example, using the same database in Pennsylvania, four studies found four different rates of well
leakage: 5%S3
, 3.4%S4
, 6.2%S5
, and 2.6%S6
. These variations resulted from different
interpretations of events and whether violation codes matched the description provided. While
the results are similar, they should ideally be identical given they all use the same dataset.
However, data curations of descriptive narratives will likely lead to different conclusions.
The spill data reported here do not cover the entire life cycle of the well; it focuses only on those
spills that occur on or near the well pad. Additional spills may occur during the transportation of
sand and chemicals to a well pad, as well as the transportation of wastewater for disposal by
truck or injection lines. This data additionally does not take into account spills that occur as oil
and natural gas are transported to refineries. Capturing the rate and volume of spills is
challenging due to the lack of data collected: “Data limitations also preclude a quantitative
analysis of the likelihood or magnitude of chemical spills or impacts. Spills that occur off-site,
such as those during transportation of chemicals or storage of chemicals in staging areas, are out
of scope.”S7
S20
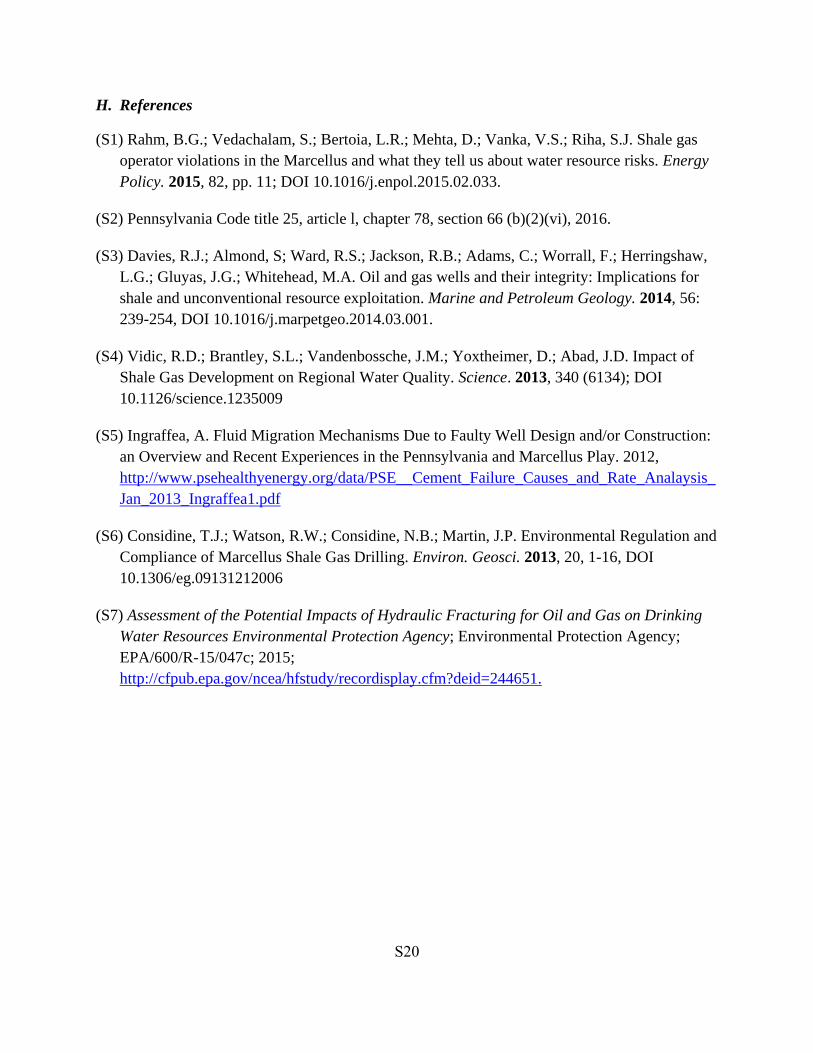
H. References
(S1) Rahm, B.G.; Vedachalam, S.; Bertoia, L.R.; Mehta, D.; Vanka, V.S.; Riha, S.J. Shale gas
operator violations in the Marcellus and what they tell us about water resource risks. Energy
Policy. 2015, 82, pp. 11; DOI 10.1016/j.enpol.2015.02.033.
(S2) Pennsylvania Code title 25, article l, chapter 78, section 66 (b)(2)(vi), 2016.
(S3) Davies, R.J.; Almond, S; Ward, R.S.; Jackson, R.B.; Adams, C.; Worrall, F.; Herringshaw,
L.G.; Gluyas, J.G.; Whitehead, M.A. Oil and gas wells and their integrity: Implications for
shale and unconventional resource exploitation. Marine and Petroleum Geology. 2014, 56:
239-254, DOI 10.1016/j.marpetgeo.2014.03.001.
(S4) Vidic, R.D.; Brantley, S.L.; Vandenbossche, J.M.; Yoxtheimer, D.; Abad, J.D. Impact of
Shale Gas Development on Regional Water Quality. Science. 2013, 340 (6134); DOI
10.1126/science.1235009
(S5) Ingraffea, A. Fluid Migration Mechanisms Due to Faulty Well Design and/or Construction:
an Overview and Recent Experiences in the Pennsylvania and Marcellus Play. 2012,
http://www.psehealthyenergy.org/data/PSE__Cement_Failure_Causes_and_Rate_Analaysis_
Jan_2013_Ingraffea1.pdf
(S6) Considine, T.J.; Watson, R.W.; Considine, N.B.; Martin, J.P. Environmental Regulation and
Compliance of Marcellus Shale Gas Drilling. Environ. Geosci. 2013, 20, 1-16, DOI
10.1306/eg.09131212006
(S7) Assessment of the Potential Impacts of Hydraulic Fracturing for Oil and Gas on Drinking
Water Resources Environmental Protection Agency; Environmental Protection Agency;
EPA/600/R-15/047c; 2015;
http://cfpub.epa.gov/ncea/hfstudy/recordisplay.cfm?deid=244651.