Embed Size (px)
Citation preview

1 January 101.03 Significant Figures, Precisions and Accuracy
1.03 Accuracy, Precision and Significant Figures
Story: Taxi driver (13 years experience) points to a pyramid "...this here pyramid is exactly 4511 years old". After a quick calculation, the tourist asked, how can you be so certain that this particular pyramid was built in 2498 BC ?
Uncertainty in numbers
–I had a friend who when to tour Egypt in 2011. Once at Egypt, there was a taxi driver with 11 year experience, wjp offered to drive him around and take him on a personal tour for a nominal fee. My friend took up the taxi driver on his offer. Toward the end of their tour the cab driver pointed to a set of pyramid and said that the age of the pyramid were exactly 4511 years old. My friend was fascinated because he did not realize that the cab driver was very knowledgeable on the exact date of the grand opening ceremony. After quizzing the cab driver further, my friend discovered that the cab driver had been working with the cab company for six years and six years ago, he was told by the company that this particular pyramid were 4500 years old. 2013
20000 AD
2498 4511

2 January 101.03 Significant Figures, Precisions and Accuracy
II Accuracy, Precision & Significant Figures
It is important to realize that any measurement will always contain some degree of uncertainty.
The uncertainty of the measurement is determine by the scale of the measuring device.
Uncertainty in Measurements

3 January 101.03 Significant Figures, Precisions and Accuracy
II Accuracy, Precision & Significant Figures
Precision: Indication of how close individual measurements agree with each other.
Accuracy: How close individual measurements agree with the true value.In general, experimental measurements are taken
numerous times to improve precision;
In generalmore precise e more accurate.
….. but not necessarily true.
Precision vs. Accuracy

4 January 101.03 Significant Figures, Precisions and Accuracy
II Accuracy, Precision & Significant Figures
Accuracy and precision. Each dot represents one
attempt at measuring a person’s height. a) shows
high precision and great accuracy; the dots are
tightly clustered by the true value. b) Shows
high precision (tightly clustered dots) but poor
accuracy (large error); perhaps the meter stick
was not made correctly. c) Shows poor precision
(dots are not tightly clustered) but, by accident,
high accuracy; the average of the measurements
would be close to the true value. d) Here there is
neither precision and nor accuracya) Precise Accurate
(laudable) -Promote the
analyst
b) Precise Inaccurate
(avoidable) -Repair the instrument
c) Imprecise Accurate (by
accident) -Train the analyst
d) Imprecise Inaccurate
(lamentable) -Hire a new
analyst
Measurements in the lab
5 January 101.03 Significant Figures, Precisions and Accuracy
II Accuracy, Precision & Significant Figures
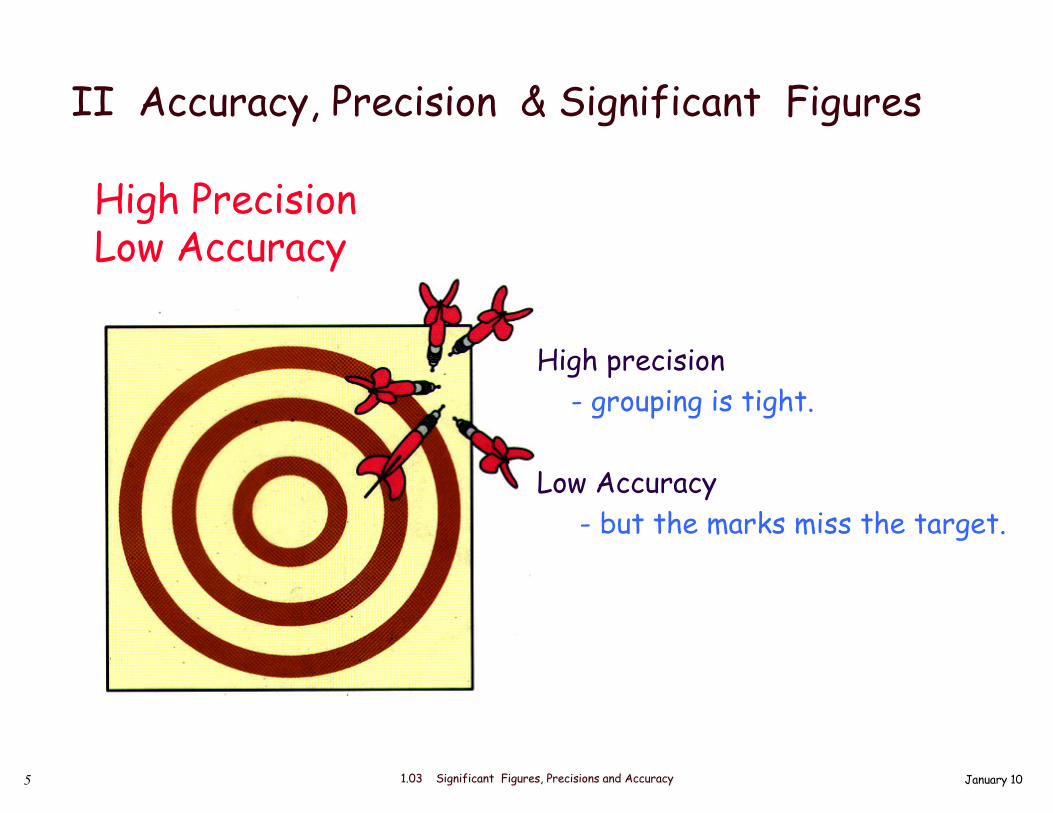
High precision - grouping is tight.
Low Accuracy - but the marks miss the target.
High PrecisionLow Accuracy
6 January 101.03 Significant Figures, Precisions and Accuracy
II Accuracy, Precision & Significant Figures
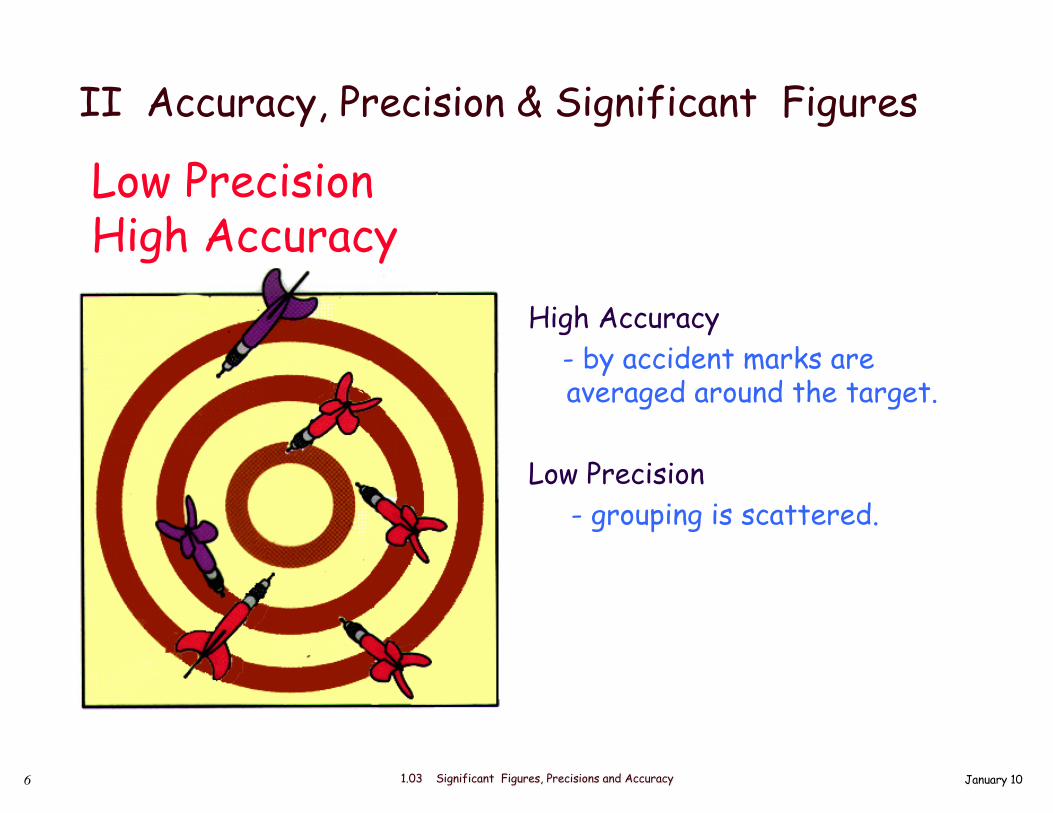
High Accuracy - by accident marks are averaged around the target.
Low Precision - grouping is scattered.
Low PrecisionHigh Accuracy

7 January 101.03 Significant Figures, Precisions and Accuracy
II Accuracy, Precision & Significant Figures
Low Precision - grouping is scattered.
Low Accuracy - marks miss the target.
Low Precision Low Accuracy

8 January 101.03 Significant Figures, Precisions and Accuracy
II Accuracy, Precision & Significant Figures
High Accuracy - marks are averaged around the target.
High precision - grouping is tight.
High PrecisionHigh Accuracy

9 January 101.03 Significant Figures, Precisions and Accuracy
II Accuracy, Precision & Significant Figures
In general, the uncertainty of a measurement is determined by the precision of the measuring device. A 10-mL pipet with a graduation of 0.1mL with give an uncertainty of + 0.01 i.e., 1.7x +0.01 In this example the volume is calibrated to the tenth of a place and the measurement is uncertain to + 0.01 mL. In other words, if a measurement is recorded at 1.75 ml, then the actual volume might be assumed to be 1.74mL or 1.76 mL in which the 4 or 6 is the uncertain digit. The +0.01 mL is arrived at by placing a 1 in the position of the last certain digit (the tenth place) and dividing by 10 (0.1 mL / 10 = 0.01 mL).
A 100-mL graduated cylinder with 1-mL graduation will have an uncertainty of + 0.1mL. That is a measurement of 53.4 mL using this graduated cylinder could be read 53.3 or 53.4mL.
For calibration of a 50-mL graduated cylinder with calibration of 0.2 mL, the uncertainty is +0.05mL.
Devices that measure the volume of liquids. Several devices are used to measure the volume of liquids. Considerations include ease of use as well as accuracy and precision. From left to right; the blue liquid is in a 10-mL graduated pipet that can disperse liquids with an accuracy of +0.06 mL; the reddish liquid is in a volumetric flask that will contain 100.00+0.08 mL when filled to the mark; the yellow liquid is in a 100mL graduated cylinder that measures volumes to +0.4 mL; the green liquid is in a 10-mL graduated cylinder that measures volumes to +0.06mL; the red liquid at the right is in a 10-mL transfer pipet that delivers the liquid with an accuracy of +0.04 mL
Making a measurement

10 January 101.03 Significant Figures, Precisions and Accuracy
II Accuracy, Precision & Significant Figures
32.33°C 32.3°C
–Reading a temperature measurement The number of significant figures in a measurement depends on the measuring device. Two thermometers measuring the temperature of the same object are shown with expanded views. The thermometer on the right is graduated in 1°C and reads 32.3°C; the one on the left is graduated to 0.1°C and reads 32.33°C. Therefore, a reading with more precision (more certainty) and therefore with more significant figures can be made with the thermometer on the left which is the more precise thermometer

11 January 101.03 Significant Figures, Precisions and Accuracy
II Accuracy, Precision & Significant Figures
The more accurate the measurement the smaller the errorAccurate number e small errors
The more precise the measurement, the lower the uncertainty. Precise number e small uncertainty
0 1 2 3 4 5 6 7 8
0 1 2 3 4 5 6 7 8
D = 1cm error is tenth 1/104.4 cm + .1
When reading a measurement of length, remember that in general-

12 January 101.03 Significant Figures, Precisions and Accuracy
II Accuracy, Precision & Significant Figures
The more accurate the measurement the smaller the errorAccurate number e small errors
The more precise the measurement, the lower the uncertainty. Precise number e small uncertainty
0 1 2 3 4 5 6 7 8
0 1 2 3 4 5 6 7 8
D = 1cm error is tenth 1/104.4 cm + .1
D = 0.1cm error is tenth 1/104.42 cm + .01More precise measurement
When reading a measurement of length remember that in general
13 January 101.03 Significant Figures, Precisions and Accuracy
II Accuracy, Precision & Significant Figures
SF is an alternative method of measuring uncertainty.
Scientist have found that it is useful to tell the degree of
certainty of a measured number using SF.
Merely writing down all the digits that are certain and not writing
down any that are not certain expresses the error in the
measurement.
So why are significant figures (SF) so important?

14 January 101.03 Significant Figures, Precisions and Accuracy
Significant Figures vs. Precision
Rules of Significant Figures:Nonzero integers - always count as significant figures.Zeros –
Leading zeros - are zeros that precede all of the nonzero digits. They never count as significant figures.
Captive zeros - are zeros that fall between nonzero digits. They all count as significant figures.
Trailing zeros - are zeros at the right end of the number. They are significant only if the number contains a decimal point.
Exact numbers - such as tallies or conversion factors have unlimited number of significant figures.
–How many significant figures do these numbers contain ?
–2?12.000 0.1005 .0005020 2500
–Significant
–5–Figures –4–3 ???
–Chp1: Measurements

15 January 101.03 Significant Figures, Precisions and Accuracy
•To determine the number of Significant FiguresPacific-Atlantic Rule
Decimal Present vs. Decimal AbsentPlace the number in the center of the map.
Depending if the number has a decimal point or no decimal point determines if the analysis starts at the Pacific or the Atlantic part of US.
Decimal Present
For numbers with a
decimal point present,
draw a line starting from
the Pacific to the first
non-zero number, all digits
shown including the non-
zero number are
significant. i.e., 0.040050
Decimal Absent
For numbers with a decimal
point absent, draw a line
starting from the Atlantic
(right) to the first non-zero
number, all digits shown
including the non-zero
number are significant.
i.e., 30500
– Place Number here
0.040050 30500
–5 Significant Figures –3 Significant Figures–Chp1: Measurements
P A
AP
305000.040050P – Place Number here
AP
0.04005030500

16 January 101.03 Significant Figures, Precisions and Accuracy
Significant Figures example-
12.000 five significant figures
0.1005 four significant figures
.0005020 four significant figures
2500 two significant figures
Now determine the number of significant figures for the examples we had earlier.
2?12.000 0.1005 .0005020 2500
Significant
5Figures 43 ???
Chp1: Measurements

17 January 101.03 Significant Figures, Precisions and Accuracy
II Accuracy, Precision & Significant FiguresMore on significant digits and the
different type of uncertainties
i12.000
i0.1005
i0.0005020
i2500
Number of significant figures
5 4 4 2
Implied uncertainty
+ 0.001 + 0.000 1 + 0.000 0001 + 100
Relative uncertainty
+ 0.00112.000
+ 0.000 10.1005
+ 0.000 000 10.000 502 0
+ 125
% relative uncertainty
+ 0.008 % + 0. 100 %
+ 0.020 % + 4.0 %

18 January 101.03 Significant Figures, Precisions and Accuracy
II Accuracy, Precision & Significant Figures
Manipulation of Significant Figures:
(add and subtract)
Wrong Answer20.4 + 1.32 + 83 + 0.6 = 105.32

19 January 101.03 Significant Figures, Precisions and Accuracy
Math operation: Addition-subtractionExample - keep exponent the same in addition and subtraction operation and round off answer to least precise of the data.
Consider the following example: Three individual who each gave their loose change to the Salvation Army collection pan. The first had two dollar bills a quarter and two pennies. The second donated three dollar bills and five nickels and one penny. The third gave two quarters
and a few pennies. What is the total amount that was collected?
$2.52 + $3.26 + ~ $0.80 =

20 January 101.03 Significant Figures, Precisions and Accuracy
II Accuracy, Precision & Significant Figures
What is the difference between significant figures and precision. For
example in the example shown, which number has the fewest
significant figures and which is the least precise ?
. Fewest Significant figures Least precisea) 123 vs 1.2
b) 1.23 vs 1.200
c) 0.123 vs 0.00012
d) 30 vs 3600
The number with the fewest significant figures is the number which contains the lower amount of digits (significant digits). The least precise number, on the other hand, is the number with the largest uncertainty. For example 0.1 (or 1/10) has more uncertainty than 0.01 (or 1/100).
Difference between Significant figures Precision
1.2 123
1.23 1.230.1230.00012
360030
21 January 101.03 Significant Figures, Precisions and Accuracy
II Accuracy, Precision & Significant Figures
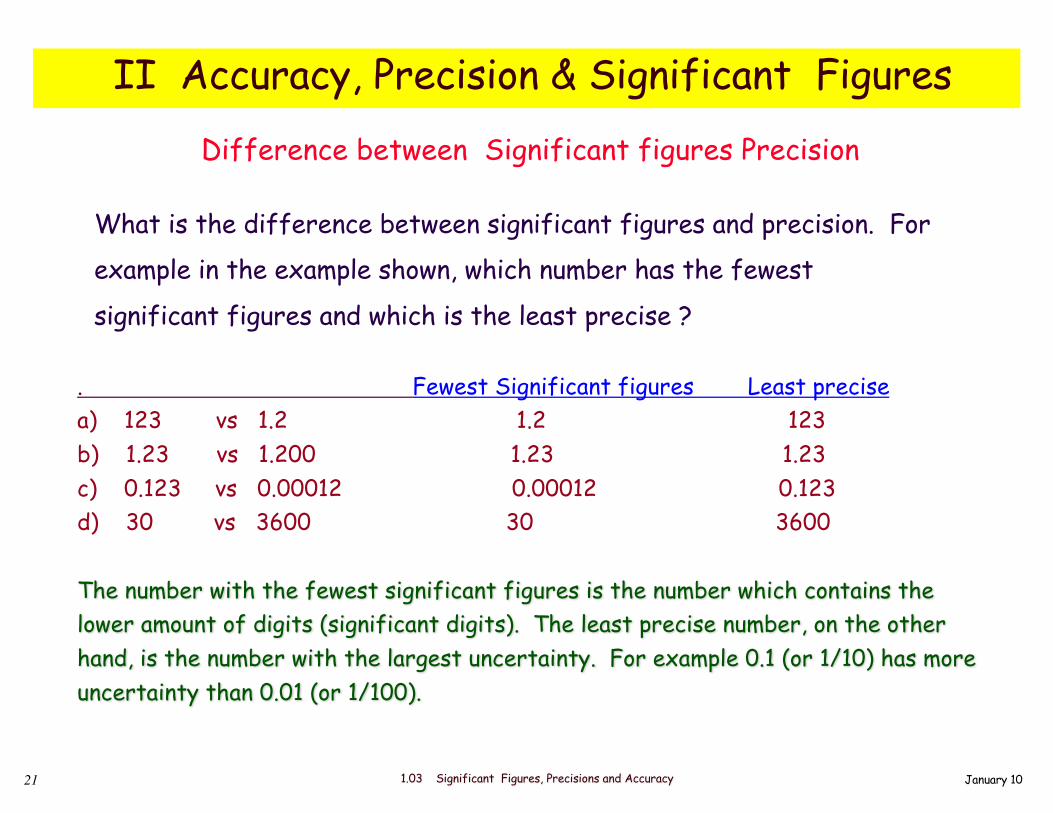
What is the difference between significant figures and precision. For
example in the example shown, which number has the fewest
significant figures and which is the least precise ?
. Fewest Significant figures Least precisea) 123 vs 1.2 1.2 123b) 1.23 vs 1.200 1.23 1.23c) 0.123 vs 0.00012 0.00012 0.123d) 30 vs 3600 30 3600
The number with the fewest significant figures is the number which contains the lower amount of digits (significant digits). The least precise number, on the other hand, is the number with the largest uncertainty. For example 0.1 (or 1/10) has more uncertainty than 0.01 (or 1/100).
Difference between Significant figures Precision

22 January 101.03 Significant Figures, Precisions and Accuracy
II Accuracy, Precision & Significant Figures
Addition and Subtraction:Uncertainty of answer (Significant
figures of answer) is limited to the
value with the least precise value
(number with fewest digit after
decimal place - the number 83 in
our example).
Least precise
Manipulation of Significant Figures:
(add and subtract)
Correct Answer

23 January 101.03 Significant Figures, Precisions and Accuracy
II Accuracy, Precision & Significant Figures
Try this at your desk:
Correct Answer (c)
1056.30 - 23 + 456.500 + 30.2 =
1056.30- 23+ 456.500+ 30.21520.
a) 1520.000b) 1520.00c) 1520.d) 1520e) No right answer

24 January 101.03 Significant Figures, Precisions and Accuracy
Fewest number of significant figures
II Accuracy, Precision & Significant Figures
Multiplication and division:Uncertainty of answer (Significant.
Figure) is limited to the value with
the fewest significant figures. In
our example, 0.17 limits the value.
7 . 548
4 4 . 40 . 1 7
3 S. F. 2 S. F.
2 S. F.
7 .5Answer with 2 s.f.
Manipulation of Significant Figures:(mult and divide)

25 January 101.03 Significant Figures, Precisions and Accuracy
II Accuracy, Precision & Significant Figures
Try this at your desk:
Correct Answer (d)
(1056.30 * 23) / (456.500 * 30.2) =
(1056.30 * 23)(456.500 *30.2)
a) 1.76225b) 1.76c) 2d) 1.8e) No right answer =

26 January 101.03 Significant Figures, Precisions and Accuracy
€
0.0742 × 6.01512( ) + 0.9258 × 0.190100( ) =
.446 .01760 = 0.622
Arithmetic Examples:Combinations using addition-subtraction / multiplication - division
Carry out addition / subtraction operation first before the multiplication or division operation.
€
48.3335.2 - 29.0( )
= 7.7952 = 7.81*
2*
3
€
48.35 - 35.18( ) ∗ 0.12
33.792 - 31.426( ) =
Workingit out
Lower layer
0.742 ∗ 6.01512( ) + 9.9258 ∗ 0.0090( ) =
4.464.46321904
0.0890.0893322
= 4.554.5493322
4*

27 January 101.03 Significant Figures, Precisions and Accuracy
0.742 ∗ 6.01512( ) + 9.9258 ∗ 0.0090( ) =
4.464.46321904
0.0890.0893322
= 4.55 4.5493322
Arithmetic Examples:Combinations using addition / subtractionand multiplication / division
Carry out addition / subtraction operation first before the multiplication or division operation.
€
48.35 - 35.18( ) ∗ 0.12
33.792 - 31.426( ) = 0.668 = 0.67
€
48.3335.2 - 29.0( )
= 7.7952 = 7.81
2
4
= 4.55

28 January 101.03 Significant Figures, Precisions and Accuracy
• Number of Tallies, i.e., 5 fingers, 176 students.
• *Definition of numbers -
i.e., Exactly 1 m = 100 cm, or 1 in = 2.54 cm
• Power of 10 in exponential notation
i.e., 106 but practical to express numbers as 10 6.4 (exponential calc)
*Define conversion versus measured conversion.
II Accuracy, Precision & Significant Figures
These type of numbers contain unlimited significant figures (do not influence the number of significant figures in the final answer).
Exception to significant figure rules:

29 January 101.03 Significant Figures, Precisions and Accuracy
One last important note:
Conversion factor comes in two forms, the first are conversion factors from definitions. 60 min = 1 hr, 100cm = 1m, 5280 ft = 1 mile, 1 gal = 3.785 L, 100 pennies = $1.00.
Other conversion factors are based on measured values. 65 mph (65 mi = 1 hr) , $10/hr (10 $ = 1 hr), 0.76Euro/$ (0.76 euro = 1.00$)
Measured conversion factors do have significant figures unlike defined conversion factors that have infinite number of significant figures.
Thus in the problem; If a runner for 139.9 minutes at 11 mph, how far will the runner travel in miles? The answer is rounded to two significant figures.
Conversion factors: Measured versus defined
€
139.9 min ⊗ 1 hr60 min
⊗ 11 mi1 hr
= 25.6483 mi = 26 mi

30 January 101.03 Significant Figures, Precisions and Accuracy
II Summary: Significant FiguresWritten digits of results must have right number of significant figures.
Can determine number of significant figures for any number using U.S. map analogy.
• Addition/SubtractionLeast precise number in the data determines number of significant figures in the final answer.
• Multiplication/Divisiondata with fewest significant figures determines number of significant figures in the answer.
* Remember the exception to the rules for significant figures.


![[scale=0.08]kfug1.jpg [6mm] Advanced Microeconomics [3mm](https://img.dokumen.tips/doc/110x75/616ad51f54ac0a454370e13e/scale008kfug1jpg-6mm-advanced-microeconomics-3mm-.jpg)