Embed Size (px)
DESCRIPTION
Variation in forecast and actual demand at Boston-Logan Airport. Price of coffe forecast and historical variation, monte carlo simulation brownian method.
Citation preview

Francisco Furtado – Raul Pires 2009-03-09
Uncertainty Assignment
Part 1 Possible causes for differences between forecasts and actual results (Boston-Logan, 1999 and 2004):
• 9/11 Terrorist attack had a big impact on Air-line industry and airport movement, Boston Logan was severely affected (23% in domestic commercial service). Besides Logan was the departure airport for two of the planes used in the attacks (American Airlines Flight 11, United Airlines Flight 175). The attack provoked a decline in demand and a change to more severe security regulations that increased delays and reduced Air Mode competitive advantages to other modes. Sources: Deep Decline in Air Traffic Still Being Felt, LA Times, By Caitlin Liu December 19, 2002; Passenger Traffic at Boston's Logan Airport Fell by 42.5 Percent Last Month, Tribune Business News October 25, 2001. (Political, Regulatory and Others)
• Delays, Boston Logan is one of the Airports that experiences bigger delays times, this
is result of combination of stricter safety regulations, unfavourable winds, roadways configuration and inadequate terminals. Sources: Airside Improvements Planning Project Logan International Airport , Boston, Massachusetts, August 2, 2002. (Technical, Regulatory)
• Increase in Smaller Jets use might also help explain an increase in delays, and a
decrease in passengers traffic, besides that these planes can foster the use of smaller, cheaper Airports. Source: www.usatoday.com/money/biztravel/2006-09-05-small-jets-usat_x.htm; www.highbeam.com/doc/1G1-118317342.html; www.nytimes.com/2009/02/15/nyregion/15commuter.html. (Technical, Industrial)
• Increase in Regional Airports Traffic/Low Cost revolution, low cost airlines have an increasing share of the market and prefer smaller inexpensive airports, than larger, iconic and expensive airports. Sources: www.di.net/news/archive/flexible_airport_design_essential.
We didn’t focused any financial/economic contextual change that might have been a source of uncertainty that disrupted the presented forecasts. Although both the Great Depression II and the fuel prices, will certainly be major sources of uncertainty to take in account in future forecasts (specially the Depression), for the covered period (1999-2004) economical/financial issues weren’t the most significant sources of disrupted forecasts.
Francisco Furtado – Raul Pires 2009-03-09
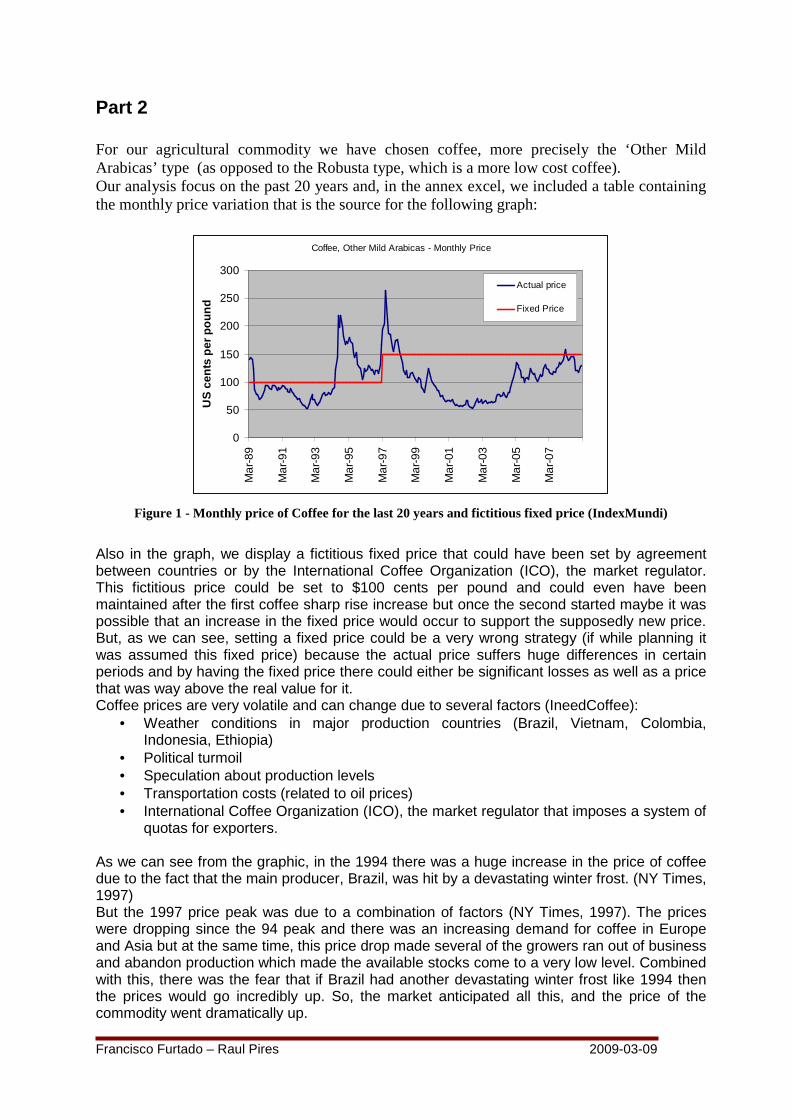
Part 2 For our agricultural commodity we have chosen coffee, more precisely the ‘Other Mild Arabicas’ type (as opposed to the Robusta type, which is a more low cost coffee). Our analysis focus on the past 20 years and, in the annex excel, we included a table containing the monthly price variation that is the source for the following graph:
Coffee, Other Mild Arabicas - Monthly Price
0
50
100
150
200
250
300
Mar
-89
Mar
-91
Mar
-93
Mar
-95
Mar
-97
Mar
-99
Mar
-01
Mar
-03
Mar
-05
Mar
-07
US
cen
ts p
er p
ou
nd
Actual price
Fixed Price
Figure 1 - Monthly price of Coffee for the last 20 years and fictitious fixed price (IndexMundi)
Also in the graph, we display a fictitious fixed price that could have been set by agreement between countries or by the International Coffee Organization (ICO), the market regulator. This fictitious price could be set to $100 cents per pound and could even have been maintained after the first coffee sharp rise increase but once the second started maybe it was possible that an increase in the fixed price would occur to support the supposedly new price. But, as we can see, setting a fixed price could be a very wrong strategy (if while planning it was assumed this fixed price) because the actual price suffers huge differences in certain periods and by having the fixed price there could either be significant losses as well as a price that was way above the real value for it. Coffee prices are very volatile and can change due to several factors (IneedCoffee):
• Weather conditions in major production countries (Brazil, Vietnam, Colombia, Indonesia, Ethiopia)
• Political turmoil • Speculation about production levels • Transportation costs (related to oil prices) • International Coffee Organization (ICO), the market regulator that imposes a system of
quotas for exporters. As we can see from the graphic, in the 1994 there was a huge increase in the price of coffee due to the fact that the main producer, Brazil, was hit by a devastating winter frost. (NY Times, 1997) But the 1997 price peak was due to a combination of factors (NY Times, 1997). The prices were dropping since the 94 peak and there was an increasing demand for coffee in Europe and Asia but at the same time, this price drop made several of the growers ran out of business and abandon production which made the available stocks come to a very low level. Combined with this, there was the fear that if Brazil had another devastating winter frost like 1994 then the prices would go incredibly up. So, the market anticipated all this, and the price of the commodity went dramatically up.

Francisco Furtado – Raul Pires 2009-03-09
Around 2001, the prices were at a very low level, a historically low price for coffee (International Coffee Organization) and have been slowly increasing ever since with some occasional fluctuations. This historically low was explained by an excess of production of coffee, where supply was much higher than demand. As to the future, although the trend for the past 8 years indicates that the price of coffee will steadily continue to go up, it is clear that coffee is a high volatile commodity. We think that the price can be affected by several factors:
• Global warming and weather consequences can affect the future production in some countries
• Oil crisis can deeply affect transportation costs of coffee • The fact that retail price of coffee continues to increase but coffee price paid to
producers is still at low levels can influence production, as producers can abandon this way of live and move to other more profitable ways of living
• The actual financial crisis can have an impact on world demand for coffee, which is not a primary need.
• The fact that China and India populations have had increasing levels of life can mean that this huge markets are potential future consumers, that if coffee is adopted the demand can have a sharp rise.
• New rules for market quota determined by ICO To analyse what can be the future price value for coffee we did a forecast analysis based on the Geometric Brownian Motion method. We obtained a 36.59% volatility rate and although not realistic (due to the ups and downs of coffee) an average growth of 0.05% per month. We tried the simulation several time and the following graphs show possible evolutions of price for the next 10 years. As we can see, we can have very different outcomes of price and it is very difficult to predict what the price will be in the future. We calculated an average price of $658.1356 between the four graphs, with a maximum of $6184.642 and a minimum of $39.9728. These values can give some insight (or not) to what will be the future behaviour but there the main dominant factor is the huge uncertainty.
Forecasts (US Cents per pound)
$0.00
$50.00
$100.00
$150.00
$200.00
$250.00
$300.00
$350.00
$400.00
$450.00
Feb-09
Feb-10
Feb-11
Feb-12
Feb-13
Feb-14
Feb-15
Feb-16
Feb-17
Feb-18
Feb-19
Price(US Cents perpound)
Forecasts (US Cents per pound)
$0.00
$200.00
$400.00
$600.00
$800.00
$1,000.00
$1,200.00
Feb
-09
Feb
-10
Feb
-11
Feb
-12
Feb
-13
Feb
-14
Feb
-15
Feb
-16
Feb
-17
Feb
-18
Feb
-19
Price(US Cents perpound)
Forecasts (US Cents per pound)
$0.00
$200.00
$400.00
$600.00
$800.00
$1,000.00
$1,200.00
$1,400.00
$1,600.00
$1,800.00
Feb
-09
Feb
-10
Feb
-11
Feb
-12
Feb
-13
Feb
-14
Feb
-15
Feb
-16
Feb
-17
Feb
-18
Feb
-19
Price(US Cents perpound)
Forecasts (US Cents per pound)
$0.00
$1,000.00
$2,000.00
$3,000.00
$4,000.00
$5,000.00
$6,000.00
$7,000.00
Feb
-09
Feb
-10
Feb
-11
Feb
-12
Feb
-13
Feb
-14
Feb
-15
Feb
-16
Feb
-17
Feb
-18
Feb
-19
Price(US Cents perpound)

Francisco Furtado – Raul Pires 2009-03-09
References IneedCoffee, http://www.ineedcoffee.com/07/coffeeprice/ International Coffee Organization, http://dev.ico.org/documents/ed1922e.pdf IndexMundi, http://indexmundi.com/commodities/?commodity=other-mild-arabicas-coffee&months=180 NyTimes, 1997, http://query.nytimes.com/gst/fullpage.html?res=9F0CE3DE1E39F930A25756C0A961958260&sec=&spon=&pagewanted=all