Embed Size (px)
Citation preview

BriefingSeptember 2017
Uncertain Potential: Managing Tanzania’s Gas Revenues
Thomas Scurfield and David Mihalyi
SUMMARY
Tanzanians hope that the country’s offshore gas sector will become a driver of future economic growth and human development. However, the recent downturn in oil and gas markets has plunged potential investments into uncertainty, decreasing the likelihood that gas will have a major impact on Tanzanians’ well-being. The revised outlook also impacts important policy decisions that the government must make about the management of public finances.
In this brief we analyze the possible outcomes for the planned liquefied natural gas (LNG) project and its potential impact on public financial management. In doing so, we hope to inform the government’s decision-making on public finances, both in terms of the optimality of the Oil and Gas Revenues Management Act and its approach to the wider public finances.
Findings
Investment in the LNG project. Investment is still very uncertain. We estimate the minimum long-term LNG price at which companies would be willing to go ahead with the project to be USD 14 per one million British Thermal Units (mmBtu). Comparing this price with forecasts of long-term LNG prices in East Asia of $8 and the average real price over the past 15 years of approximately $11, our estimate suggests that under current conditions and expectations the project is not likely to go ahead. This outcome applies to most of the scenarios we examine.
Potential government revenues. If the project does go ahead, the government revenues it generates are unlikely to be transformative. Given the inherent unpredictability of prices, we use the average price over the past 15 years as a reference point. At this price, we estimate that government revenue would average approximately $2.3 billion a year (in real terms) over the period of gas production, equivalent to only $20 (or TZS 43,000) per person or 1.2 percent of GDP a year.
Impact of Revenues Management Act on use of gas revenues. Given that gas revenues are likely to be modest even if investment goes ahead, we do not expect the act’s fiscal rules to have a significant impact on their allocation. Revenues are not expected to reach the 3 percent of GDP threshold at which they are required to be deposited into the Oil and Gas Fund’s Revenue Saving Account, and therefore will only finance the government’s budget. This does not necessarily mean that the rules are inappropriate. Nevertheless, the rules do suffer from a number of shortcomings.
ABOUT THE SERIES
This brief is one of a series analyzing the Tanzanian government’s approach to managing the coun-try’s offshore natural gas sector. Other briefs in the series include “Negotiat-ing Tanzania’s Gas Future” and “Localizing Tanzania’s Gas Sector.”
CONTENTS
Summary .............................1
Introduction .......................3
Tanzania’s natural gas sector ....................................4
Estimates of gas revenues and impact on public finances ................................6
Policy recommendations......... 22
Conclusion ....................... 31
Appendix ........................... 33
References ....................... 42

2
Uncertain Potential: Managing Tanzania’s Gas Revenues
A key weakness is their pro-cyclicality, which is a result of them being anchored to GDP. The financing mechanism for the Tanzania Petroleum Development Corporation (TPDC, the national oil company) is also anchored to GDP, which means it is unlikely to be sufficiently responsive to the company’s needs or spending capacity. Finally, rules earmarking the spending of gas revenues are not situated within a broader spending strategy, which means there is no guarantee that expenditure in targeted areas will actually increase.
Implications for public finances. Since gas revenues are unlikely to be large enough to trigger the Revenues Management Act’s fiscal deficit limit, the binding deficit limit is likely to be the East Africa Monetary Union (EAMU)’s ceiling, which mandates that the country’s overall deficit cannot exceed 3 percent of GDP by fiscal year 2020/21. Tanzania appears to be on the path toward meeting the EAMU’s target and maintaining benign debt levels. Indeed, given the current deficit level, there appears to be space to increase spending in the short term. If the LNG project goes ahead, a modest increase in spending in the longer term (once gas revenues start flowing) is also likely to be possible. However, if primary expenditure was to grow faster than non-gas GDP for a sustained period, we would expect the deficit to rapidly increase.
Recommendations for the government
Avoid basing public finance plans on the expectation of a gas revenue windfall. To this end, it would be advisable to:
a. Adhere to the fiscal deficit limit of the East African Monetary Union. This
still allows for modest increases in spending and borrowing but also ensures that
Tanzania avoids a scenario where expectations of future resource revenues lead
to a build-up of excessive debt.
b. Direct additional spending toward the development budget. Spending
should be directed toward the development budget to the extent that projects
that yield economic returns exceeding borrowing rates can be identified.
This is in line with the government’s recent commitments and the recurrent
expenditure growth limit.
c. Increase transparency efforts in budget management. This could include
tasking an independent body with overseeing improved disclosure of budgetary
information (particularly on borrowing) and assessing compliance with both
regional and national fiscal rules.
d. Manage the public’s expectations about the likely impact of gas revenues. This would reduce the likelihood of unrealistic expectations derailing
government policies.
Revise the Oil and Gas Revenues Management Act. It would be advisable to:
a. Use a different rule to limit recurrent expenditure growth. This rule
should not be anchored to annual GDP. Other options for rules limiting
recurrent expenditure growth include an absolute limit and anchoring the limit
to a less volatile GDP measure.
b. Revise the financing mechanism for TPDC. The mechanism should be
improved so that it is more likely to provide TPDC with financing that is
appropriate to its objectives and spending capacity.

3
Uncertain Potential: Managing Tanzania’s Gas Revenues
c. Revise the rule earmarking gas revenues for strategic development spending. This could include defining concrete priorities based on national
development objectives and ensuring that overall spending on them actually
increases.
d. Make preparations for a consultative review on the rules for saving gas revenues. Though it may be too early to determine an optimal framework, the
government should consider a review in the next few years that aims to address
the current framework’s weaknesses.
Introduction
The discovery of large deposits of natural gas off the coast of Tanzania has led to expectations that the sector could transform the economy and drive human development, providing hope for 12 million Tanzanians living in poverty.1 The most important benefit is likely to be the generation of significant government revenue via the export of liquefied natural gas (LNG), which can be used to finance a larger national development program. The government also envisages the sector playing a key role in improving the country’s power generation capacity through some of the gas being supplied to the domestic market. It is also in the process of developing an ambitious local content strategy, which it hopes will result both in the country capturing a greater share of the sector’s returns and reaping spillover benefits for the rest of the economy via the transfer of skills and technology.
This brief discusses the sector’s revenue potential and its implications for the recently legislated revenue management framework and wider public finances. The Oil and Gas Revenues Management Act was passed in July 2015.2 This act sets out a comprehensive revenue management framework, including the establishment of an oil and gas fund and a number of fiscal rules related to both oil and gas revenues and overall public finances.
The natural gas market has changed considerably since the revenue management framework was developed. The LNG price in Asian markets (Tanzania’s likeliest export destination) has fallen significantly and is expected to remain low for the foreseeable future. This will not only affect the timing and magnitude of government revenues, but may also affect the level of investment in the sector. A decision on whether to go ahead with the game-changing LNG project is uncertain. This decision was expected in 2016, and then pushed back to 2020, and now may not be made until 2022.3 The prospects for securing investment will be at least partly determined in the next couple of years as its regulatory framework is negotiated and finalized. The government and companies have reportedly initiated negotiations for the Host Government Agreement (HGA), with the intention of finalizing it by the end of 2018.4 The HGA will govern the proposed LNG plant and the complex arrangements coordinating the overall project.
1 World Bank, Tanzania Mainland Poverty Assessment: Executive Summary (2015), 12.2 For brevity’s sake, this will henceforth be referred to as the Revenues Management Act.3 Katherine Houreld, “Final Investment Decision On Tanzania LNG Plant Still 5 Yrs Away – Statoil,”
Reuters, 16 November 2016, accessed 15 May 2017, http://www.reuters.com/article/tanzania-gas-idUSL4N1DH4D6.
4 Fumbuka Ng’wanakilala, “Tanzania hopes for LNG plant agreement with oil majors by 2018,” Reuters, 24 January 2017, accessed 15 May 2017, http://www.reuters.com/article/us-tanzania-gas-idUSKBN1581F4.

4
Uncertain Potential: Managing Tanzania’s Gas Revenues
Tanzania’s gas sector is therefore at a crucial juncture. Given the expectations of a large gas revenue windfall, it is also an important time for the country’s public finances. A number of other countries have seen their economies deteriorate only a few years after major resource discoveries as misguided expectations led to bad policy decisions. By analyzing the prospects for investment and reassessing the sector’s revenue potential, we hope to not only inform the government’s approach to negotiating the HGA but also inform decision-making on public finances.
TANZANIA’S NATURAL GAS SECTOR
Tanzania’s gas sector is comprised of numerous projects that are of various scales and stages of development, and are subject to different regulatory frameworks. Figure 1 depicts the main existing and potential projects. Below, we provide brief profiles of these projects.
LAKEMANYARA
500
m
1,00
0 m
1,50
0 m
2,
000
m
2,50
0 m
3,00
0 m
3,50
0 m
4,00
0 m
0 200 300100 KM
DAR ES SALAAM
NGORONGORO
PANGANI BASIN
KILOSA
Mnazi Bay
Songo SongoKiliwani North 2 2
1
KILWA MASOKO
MOMBASA
MOZAMBIQUE
TANZANIA
KENYA
Possible pipeline to regional markets (could transport gas
to Kenya if constructed)
Existing pipeline to domestic markets
(charges tariffs to users)
LNG plant (will be regulated by HGA under negotiation)
Offshore pipelines (will be regulated by PSAs or HGA)
Other offshore blocks could feed the LNG plant at a later stage
Proposed offshore LNG project (will be treated as either one, two or three taxable entities)
Offshore blocks (regulated by existing PSAs)
LINDI
ZANZIBAR CITY
MTWARA
Onshore blocks
Offshore blocks
Existing pipeline
Planned/possible pipeline
12
11
10
9
3
5
8
7
6
4
Figure 1. Map of natural gas projects in TanzaniaSource: Government of Tanzania exploration activity map; Natural Resource Governance Institute.

5
Uncertain Potential: Managing Tanzania’s Gas Revenues
LNG project
This project comprises three offshore blocks, a network of offshore pipelines and a LNG plant.5 The offshore blocks (numbered 1, 2 and 4) hold the great majority of Tanzania’s discovered natural gas. Cumulatively, the blocks are estimated to contain proved and probable reserves of 27 trillion cubic feet (tcf).6 The gas from these blocks will be piped through a network of three offshore pipelines to an onshore terminal. At this point, most of the gas will flow to the LNG plant for processing and onward to export to Japan, China and the rest of the Asian market, while the remainder will flow through the existing onshore pipeline network to the Tanzanian market. Two companies, Statoil and Shell, hold the exploration and production rights to the three offshore blocks (with ExxonMobil, Ophir Energy and Pavilion Energy holding minority interests). These companies have formed a consortium that will also partially own—alongside the government via the Tanzania Petroleum Development Corporation (TPDC)—the offshore pipelines and LNG plant.
Company representatives indicate that the offshore blocks will only be developed if the LNG plant is constructed, as there is insufficient demand from other sources for the offshore to be economically viable without it. At the same time, given that onshore reserves are insufficient to serve a LNG plant, the LNG plant will only go ahead if the offshore blocks are developed. Therefore, for investment to go ahead in each of these components, the project as a whole needs to be commercially viable.
Each offshore block is regulated by an existing production sharing agreement (PSA) that contains the fiscal regime and other regulatory terms (such as the domestic market obligation, DMO). The government and companies have not disclosed the PSAs, so we have a limited understanding of their content.7 Our only understanding comes from a leaked addendum to the Block 2 PSA, government statements in 2014 and an assumption that these terms approximate the model PSAs the government has developed for the sector.8 The possibility of these PSAs being renegotiated has increased with the recent passage of the Natural Wealth and Resources Contracts (Review and Renegotiation of Unconscionable Terms) Act 2017.9 An HGA that is currently being negotiated will govern the proposed LNG plant and regulate the complex arrangements that will coordinate the overall LNG project.10
5 The LNG plant will also have a facility for converting the “wet gas” from the offshore blocks into a form that is suitable for processing into LNG.
6 Wood Mackenzie. Tanzania Upstream Summary September 2016 (2016), 17. Though company representatives have indicated that this estimate may be a little high given that some of the proved and probable reserves have since been ruled out.
7 The Tanzania Extractive Industries Transparency Act of 2015 requires that all new concessions, contracts and licenses should be made public, but it is unclear whether this requirement applies to contracts signed prior to 2015. From: Don Hubert and Rob Pitman. Past the Tipping Point? Contract disclosure within EITI (Natural Resource Governance Institute, 2017), 16.
8 See, for example: David Manley and Thomas Lassourd. Tanzania and Statoil: What Does the Leaked Agreement Mean for Citizens? (Natural Resource Governance Institute, 2014), 8.
9 This new law allows the government to renegotiate existing extractives agreements if they are deemed to contain “unconscionable terms.” The criteria for defining a term “unconscionable” is quite broad, leaving significant scope for the government to renegotiate the PSAs on this basis. See: Section 6(2) of the Natural Wealth and Resources Contracts Act 2017.
10 The HGA will set out, among other terms, the segmentation of the project value chain, the pricing of any transactions between project entities, and the local content requirements and fiscal regime for the LNG plant.

6
Uncertain Potential: Managing Tanzania’s Gas Revenues
Other projects
Aside from the LNG project, there are four other parts to Tanzania’s gas sector which may or may not have a significant impact on its revenue potential.
Other offshore blocks. Economically viable discoveries may be made in other offshore blocks. The Ministry of Energy and Minerals estimates that a potential 57 tcf of gas have been discovered to date, and two-thirds of the available area is yet to be explored.11 Further discoveries could result in additional companies using the LNG plant or becoming joint owners of the LNG plant itself.
Onshore blocks. Companies are currently extracting gas from three onshore and shallow basin fields and supplying it to the domestic market. These reserves are negligible compared to the offshore discoveries,12 yet more fields may be discovered.
Domestic pipeline network. The onshore blocks supply the domestic market through a network of onshore pipelines. The primary part of this network is the Mtwara-to-Dar es Salaam pipeline, in which the government holds a majority share. The government plans to use this network for any offshore gas supplied to the domestic market and for any gas exported via pipeline to regional markets.
International pipeline. The government is considering building at least one pipeline to export onshore or offshore gas to Tanzania’s neighbors.13 However, we do not consider this export option in this brief. As the government’s Natural Gas Utilisation Master Plan indicates, the viability of this project is yet to be properly assessed.14 Moreover, Tanzania’s current resource base will struggle to cover the competing demands of the domestic market and LNG exports. The government would have to significantly reconsider how much gas it would allocate for domestic and export uses before it could consider supplying the region as well.
ESTIMATES OF GAS REVENUES AND IMPACT ON PUBLIC FINANCES
Previous revenue estimates and changing prices
The large offshore discoveries that began in 2010 gave rise to significant expectations and resulted in various estimates of government revenues that could be generated by the LNG project. In 2014, the International Monetary Fund (IMF) suggested that annual revenues between $3 billion and $6 billion at peak production were possible.15 A report by the African Development Bank (AfDB) and the Bill and Melinda Gates Foundation (BMGF) published in early 2015 suggests that annual revenue could average between $1 billion and $2.2 billion in the first 10 years of production, beginning in 2021.16
Potential revenue from Tanzania’s gas sector is highly sensitive to prices. As Figure 2 shows, the price for LNG imports in Tanzania’s likely export market has fallen significantly since these estimates were made—and with it, forecasts of future
11 Ministry of Energy and Minerals, Energy Sector Quarterly Review, Ed. No. 4 (2016), 17-18.12 Cumulatively, the three blocks are estimated to have remaining proved and probable reserves of
around 0.9 tcf. From: Wood Mackenzie, Tanzania Upstream Summary, 17.13 The government has suggested it is seeking funding for a pipeline to Uganda. From: Fumbuka
Ng’wanakilala, “Tanzania Plans Gas Pipeline to Uganda,” Reuters, 4 May 2016, accessed 15 May 2017, http://af.reuters.com/article/africaTech/idAFL5N1816VF. Other analysts have looked at the possibility of a pipeline to Kenya. See, for example: Jonathan Demierre et al.. Potential for Regional Use of East Africa’s Natural Gas (Sustainable Development Solutions Network, 2014).
14 United Republic of Tanzania, Natural Gas Utilisation Master Plan, 32.15 IMF, IMF Country Report No. 14/121 (2014), 8.16 African Development Bank and Bill and Melinda Gates Foundation, Timing and Magnitude of New
Natural Resource Revenues in Africa (2015), 25.

7
Uncertain Potential: Managing Tanzania’s Gas Revenues
prices. In April 2015, the IMF forecast that the price of LNG in Asian markets would be $16 per mmBtu in 2020. By October of the following year, the IMF forecast prices to be only $7 per mmBtu—over 50 percent lower.17
-
2
4
6
8
10
12
14
16
18
20
2011 2012 2013 2014 2015 2016 2017 2018 2019 2020 2021 2022
USD
per
mm
Btu
of L
NG
12 April 2017 4 October 2016 12 April 2016 6 October 2015 14 April 2015
7 October 2014 8 April 2014 8 October 2013 Actual
LNG prices in Asia are generally indexed to the oil price and therefore much of the price decrease since 2014 can be attributed to the lower oil price, as well as to short-term fluctuations in demand and supply. However, these prices are also seen as the early signs of an expected reconfiguration of the global LNG market resulting from increasing global supply and the need to find buyers for it. As Figure 3 shows, planned supply currently exceeds projected demand by a significant margin. This is expected to reduce existing fragmentation among markets, and in the long term to lead a degree of convergence between the higher prices in the Asian market and lower prices in the U.S. and European markets.18 Several Asian buyers have already begun basing their contracts on U.S. prices.19
0
200
400
600
800
1000
1200
Current supply
IEA 2019 BG 2025 BP 2030 Wood Mackenzie
2030
Exxon Mobil2040
MTP
A
Operational Construction Planned Selected Global Demand Predictions
17 “World Economic Outlook Database,” IMF, last modified April 2017, http://www.imf.org/external/pubs/ft/weo/2017/01/weodata/index.aspx.
18 Currently, global gas markets are relatively unintegrated due to limited gas production and difficulties in transport. Gas prices can therefore differ significantly among markets. Unlike Asian prices (which are indexed to oil prices), US and European prices are determined in the spot market on the basis of gas-on-gas competition and have been lower in recent years.
19 International Gas Union. IGU World LNG Report 2016 (2016), 15.20 Standard Bank. Mozambique LNG: Macroeconomic Study (2014), iv.
Figure 2. Changing LNG price forecasts (Japanese imports from Indonesia)Source: IMF World Economic Outlook
Figure 3. Current and planned global LNG supply against projected global demandSource: Standard Bank study on Mozambique LNG20
8
Uncertain Potential: Managing Tanzania’s Gas Revenues
Given the dynamics noted above, many analysts do not expect prices in Asia to recover for some time. Long-term forecasts are also colored by expected global responses to climate change and an anticipated transition to alternative energy sources.21 The World Bank is currently forecasting a (real) price of approximately $7.5 per mmBtu in 2030.22 If these forecasts hold and prices stay low, there will be a significant impact on the decision to invest in the LNG project and on the revenues it could generate for the government.
However, commodity prices are inherently unpredictable, and the post-2014 downturn is just the latest example of volatility that few predicted. LNG price forecasts have changed considerably over just two years, and may easily change again in the near future. This points to a consideration that Tanzanians must take as they make decisions about their economy. The current price forecasts from reputable sources provide a necessary starting point for project and revenue forecasts, and it is time for Tanzanian decision-makers to revise their estimates in light of the current pessimism. But the inevitability of volatility also necessitates modeling a variety of scenarios—such modeling enables citizens to understand the policy implications under both optimistic and pessimistic projections, and enables the government to take appropriate precautions.
Analytical approach and baseline assumptions
We use an Excel-based model to assess the revenue potential of the sector and the implications for public finances. We first establish a baseline comprised of assumptions on the LNG project’s structure, production levels and costs, the allocation of the gas produced, various outstanding regulatory decisions and companies’ hurdle rates. We then examine the viability of the project under a variety of price scenarios before estimating the effect of changes to our assumptions of project size, costs and regulatory decisions.
To analyze the viability of the LNG project, we estimate its after-tax internal rate of return (IRR). The estimated after-tax IRR is the expected return over the assumed life of the project. IRR calculations are the basis of a common decision rule used by investors. For investment to take place, this rate must be higher than the investor’s hurdle rate. Other factors are usually included in their final decisions, but passing the hurdle rate is an important qualification. The higher the risks associated with a project, and the larger the potential return from alternative investments, the more investors will need to expect to earn from the project to choose to finance it. We assume a real hurdle rate of 13 percent for Tanzania’s LNG project based on the most common response to the latest Wood Mackenzie survey of hurdle rates for LNG projects across the globe.23 However, as Figure 4 shows, it is possible that potential investors in this project will have a higher or lower hurdle rate depending on the perceived riskiness of the project and alternative investment opportunities.
21 James Cust, David Manley and Giorgia Cecchinato, “Unburnable Wealth of Nations,” Finance and Development, 54(1) (2017), accessed 15 May 2017, http://www.imf.org/external/pubs/ft/fandd/2017/03/pdf/cust.pdf.
22 The World Bank provides a projection of the nominal price. To estimate this price in 2016 US dollars, we deflate the nominal price based on an annual inflation rate of 2 percent. From: World Bank, World Bank Commodities Price Forecast (2017).
23 Wood Mackenzie. 1st ‘State of the Upstream Industry’ survey (2017), 7.

9
Uncertain Potential: Managing Tanzania’s Gas Revenues
0%
5%
10%
15%
20%
25%
30%
6% 8% 10% 13% 18% >18%
Prec
enta
ge o
f res
pond
ents
Hurdle rate (in real terms)
Having established the likelihood of the LNG project going ahead, we then estimate potential government revenues from the sector across the range of scenarios. Finally, we analyze their potential impact on public finances based on the current set of fiscal rules.
We have based our assumptions on discussions with government and company officials and our own desk research. However, significant uncertainty remains about various factors. This makes very confident estimates of investor returns and government revenue flows difficult. The main assumptions for the LNG project are presented in tables 1 and 2. Our main assumptions for the economy and public finances are presented in Table 3. We provide further assumptions and detail on our modelling (including for the onshore blocks) in the appendix.
Element Assumption
Real hurdle rate 13 percent
Final investment decision 2022
Commencement of operations 2026
LNG plant trains24
Number of trains 3
Capacity of each train 5 million metric tons per annum
Domestic market allocation 10 percent
Value chain segmentation Partially segmented
Upstream-LNG plant arrangement Tolling
LNG plant tolling fee/rate of return ceiling 8 percent
Exploration capital expenditure $2,700 million
Development capital expenditure25
Upstream (blocks and pipelines) $19,800 million
Midstream (LNG plant) $15,000 million
Operating expenditure
Upstream (blocks and pipelines) $0.59/mmBtu
Midstream (LNG plant) $1.19/mmBtu
Domestic pipeline tariff $0.40/mmBtu
LNG shipment cost $2/mmBtu
Domestic market price $4/mmBtu
LNG export price Variable
Fiscal regimes See Table 2
24 A “train” is the term given to the unit in which the liquefaction process takes place. Each train can produce a specific volume of LNG a year.
25 It is not only the amount of capital expenditure that is important for cash flow estimates but also the timing. As discussed in the annex, we use the expenditure profile assumed by the IMF. From: IMF, IMF Country Report No. 16/254 (2016), 59.
Figure 4. Hurdle rates for LNG projects across the globe as reported by companiesSource: Wood Mackenzie
Note: We assume the hurdle rates quoted by Wood Mackenzie are in nominal terms. The rates set out in this figure have been adjusted to real terms using our assumed long-term global inflation rate of 2 percent.
Table 1. Baseline assumptions for Tanzania’s LNG project (in 2016 USD)

10
Uncertain Potential: Managing Tanzania’s Gas Revenues
Fiscal term Upstream (blocks and pipelines) Midstream (LNG)
Royalty 5 percent
Cost gas limit 70 percent
Government share of profit gas 30-50 percent
Royalty paid from govt. profit gas? Yes
Income tax 30 percent 30 percent
Royalty deductible from taxable income?
Yes
Depreciation of development capital
Straight-line for 5 years Straight-line for 5 years; expires after ten years of production
Loss carry forward Unlimited Maximum 70 percent taxable income to be offset per year; no expiration
Additional profit tax No No
Dividend withholding tax 10 percent 10 percent
Interest withholding tax 10 percent 10 percent
Debt:equity ratio 70:30 70:30
TPDC equity share
Share 10 percent 12 percent
Type Carried: repaid through TPDC’s production share
Fully paid
Carried interest rate 6.5 percent
Element Assumption
GDP in 2015/16 $45.1 billion
Annual non-gas GDP growth 5.5 percent
Govt. own revenue in 2015/16 $6.5 billion
Annual non-gas revenue growth 5.5 percent
Grants received in 2015/16 $0.2 billion
End of grants Upper middle income status
Govt. primary expenditure in 2015/16 $7.5 billion
Annual primary expenditure growth 5.5 percent
Govt. debt in 2015/16 $16.9 billion
Govt. real interest rate for debt ≤ 40% of GDP 1.0 percent
Govt. real interest rate for debt > 40% of GDP 4.5 percent
Table 2. Baseline fiscal regimes for the LNG project’s upstream and midstream
Table 3. Baseline assumptions about the economy and public finances (in 2016 USD)
11
Uncertain Potential: Managing Tanzania’s Gas Revenues
Baseline findings: uncertain investment and modest revenues
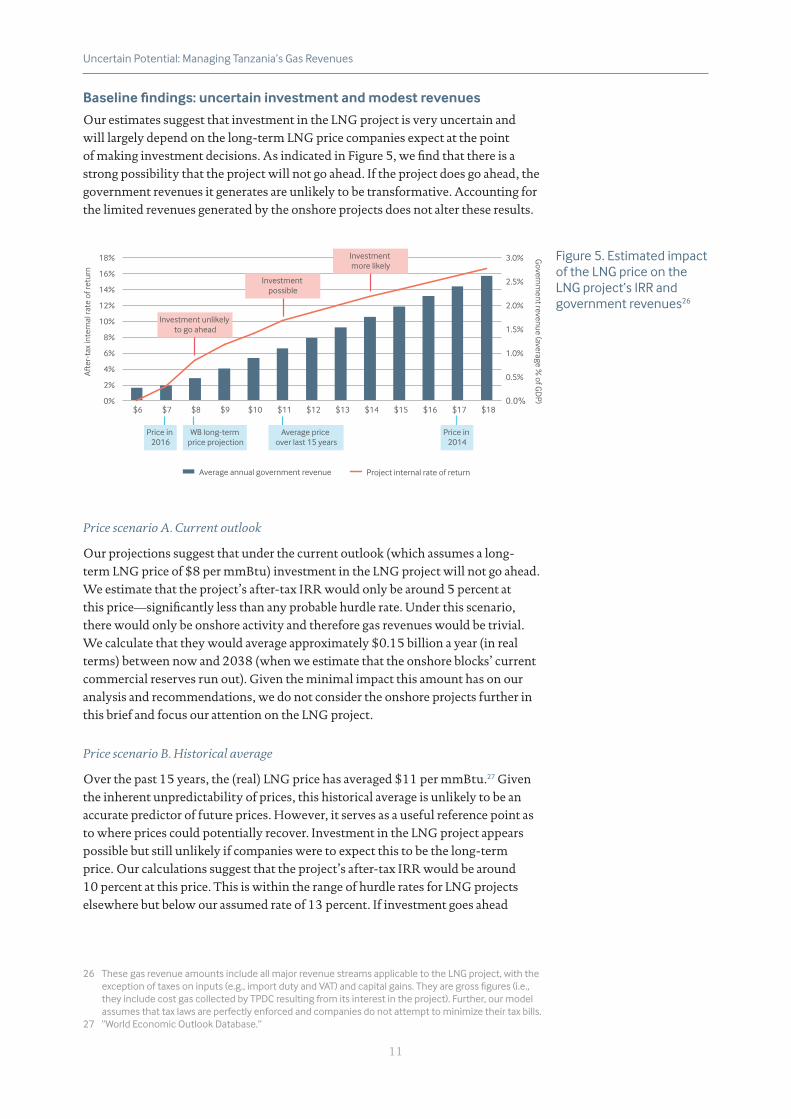
Our estimates suggest that investment in the LNG project is very uncertain and will largely depend on the long-term LNG price companies expect at the point of making investment decisions. As indicated in Figure 5, we find that there is a strong possibility that the project will not go ahead. If the project does go ahead, the government revenues it generates are unlikely to be transformative. Accounting for the limited revenues generated by the onshore projects does not alter these results.
0.0%
0.5%
1.0%
1.5%
2.0%
2.5%
3.0%
0%
2%
4%
6%
8%
10%
12%
14%
16%
18%
$6 $7 $8 $9 $10 $11 $12 $13 $14 $15 $16 $17 $18
Governm
ent revenue (average % of G
DP)
Aft
er-t
ax in
tern
al ra
te o
f ret
urn
Average annual government revenue Project internal rate of return
Investment unlikely to go ahead
Investment possible
WB long-term price projection
Price in 2016
Price in 2014
Average price over last 15 years
Investment more likely
Price scenario A. Current outlook
Our projections suggest that under the current outlook (which assumes a long-term LNG price of $8 per mmBtu) investment in the LNG project will not go ahead. We estimate that the project’s after-tax IRR would only be around 5 percent at this price—significantly less than any probable hurdle rate. Under this scenario, there would only be onshore activity and therefore gas revenues would be trivial. We calculate that they would average approximately $0.15 billion a year (in real terms) between now and 2038 (when we estimate that the onshore blocks’ current commercial reserves run out). Given the minimal impact this amount has on our analysis and recommendations, we do not consider the onshore projects further in this brief and focus our attention on the LNG project.
Price scenario B. Historical average
Over the past 15 years, the (real) LNG price has averaged $11 per mmBtu.27 Given the inherent unpredictability of prices, this historical average is unlikely to be an accurate predictor of future prices. However, it serves as a useful reference point as to where prices could potentially recover. Investment in the LNG project appears possible but still unlikely if companies were to expect this to be the long-term price. Our calculations suggest that the project’s after-tax IRR would be around 10 percent at this price. This is within the range of hurdle rates for LNG projects elsewhere but below our assumed rate of 13 percent. If investment goes ahead
26 These gas revenue amounts include all major revenue streams applicable to the LNG project, with the exception of taxes on inputs (e.g., import duty and VAT) and capital gains. They are gross figures (i.e., they include cost gas collected by TPDC resulting from its interest in the project). Further, our model assumes that tax laws are perfectly enforced and companies do not attempt to minimize their tax bills.
27 “World Economic Outlook Database.”
Figure 5. Estimated impact of the LNG price on the LNG project’s IRR and government revenues26

12
Uncertain Potential: Managing Tanzania’s Gas Revenues
under this “historical price scenario,” we estimate that government revenue from the project would average approximately $2.3 billion a year (in real terms) over the period of gas production, peaking at $3.2 billion from around 2045 onward.
Price scenario C. Estimated break-even
We estimate that companies will need to expect a long-term LNG price of approximately $14 for investment to be more likely. At this price, we estimate that the after-tax IRR would be approximately 13 percent. We calculate that government revenue would average approximately $3.8 billion a year, peaking at $4.8 billion.
A. Current outlook of $8
B. Historical average price of $11
C. Estimated break-even price of $14
After-tax IRR 5 percent 10 percent 13 percent
Total annual revenue - $2,300 million $3,800 million
Annual revenue per person
- $20 $32
Annual revenue as % of GDP
- 1.2 percent 2.0 percent
While our revenue estimates are relatively large at a price of $14, they are quite small at the historical average of $11. Annual revenue of approximately $2.3 billion a year is equivalent to only approximately $44 or TZS 94,000 per person a year for the current population, and even less—$20 or TZS 43,000 per person a year—once population growth over the period is accounted for.28
Annual revenue of $2.3 billion from the LNG project would represent a significant contribution to the Tanzanian economy today—36.0 percent of total revenue and 5.2 percent of GDP in 2015/16. However, GDP and non-gas revenue are likely to have increased significantly by 2026. We assume non-gas revenue and non-gas GDP both grow at 5.5 percent in the long run. Therefore, even if the LNG price recovers sufficiently for investment to go ahead, revenues from the LNG project are likely to account for a relatively small share of the economy—approximately 7.7 percent of total revenue and 1.2 percent of GDP a year on average, and 11.9 percent of total revenue and 2.0 percent of GDP at their peak. Even with a more conservative estimate of economic growth of 4.5 percent a year, gas revenues would only average approximately 1.5 percent of GDP.
28 Revenue in Tanzanian shillings is based on an exchange rate of $1 = TZS 2,156 as set out in the latest IMF country report for 2015/16. Population projections are taken from the UN. From: “World Population Prospects,” United Nations, accessed 15 May 2017, https://esa.un.org/unpd/wpp/Download/Standard/Population/.
Table 4. LNG project IRR and government revenue estimates across three price scenarios

13
Uncertain Potential: Managing Tanzania’s Gas Revenues
0%
2%
4%
6%
8%
10%
12%
14%
16%
18%
2017 2022 2027 2032 2037 2042 2047 2052 2057
Prec
enta
ge o
f GD
P
■ Non-gas tax revenue ■ Grants ■ Gas revenues
Alternatives to the baseline and impacts on investment and revenues
Given that significant uncertainty remains about key variables other than prices, we also consider scenarios that differ from our baseline in relation to project costs, the size of the LNG plant and the regulatory framework.
High-cost scenario
There is significant uncertainty around the investment costs for the LNG project. Our estimates are taken from the IMF,29 but company representatives have indicated that they may be higher. We estimate development costs for the offshore blocks and pipelines to total $19.8 billion, while the companies have suggested that they may be closer to $30.5 billion. However, it is not clear whether this $30.5 billion includes replacement capital, or when this expenditure occurs.30 Assuming it does not include replacement capital expenditure (and using a similar expenditure profile as that in our own baseline) we estimate that these higher costs would mean an after-tax IRR of only 7.4 percent with a LNG price of $11 per mmBtu. To clear the assumed hurdle rate of 13 percent, a long-term price of at least $17 would be needed. The higher costs would also impact government revenue. For example, if investment did go ahead in this scenario at a price of $11, we estimate that revenues would be $0.2 billion less a year than in our baseline, averaging $2.1 billion (or 1.0 percent of GDP).
Higher costs could also result from budget overruns. Large extractive projects are often over (but rarely under) budget, particularly in countries with governance challenges.31 A survey of major oil and gas projects found that two-thirds of projects in Africa face cost overruns, and that on average they result in costs being 51 percent higher.32 This increase would bring our baseline estimate of upstream capital expenditure roughly in line with the amount suggested by the companies. Other costs would also be higher. A cost overrun of this magnitude would therefore likely result in government revenues averaging less than $2.1 billion.
29 We base our estimates on the investment profile set out on p. 59 of the IMF’s report—our estimates are lower than the costs specified in the text on p. 58. From: IMF, IMF Country Report No. 16/254, 59.
30 Replacement capital expenditure is included in our estimate of operating expenditure.31 Tehmina Khan, Trang Nguyen, Franziska Ohnsorge and Richard Schodde. From Commodity Discovery
to Production. World Bank, 2016. 32 82 percent of these projects also face schedule delays, which would impact on the timing and
magnitude of government revenues. From: EY, Spotlight on oil and gas megaprojects (2014), 5.
Figure 6. Projected gas revenues with a LNG price of $11

14
Uncertain Potential: Managing Tanzania’s Gas Revenues
Smaller LNG plant scenario
We follow the IMF in assuming the LNG plant will have three trains, each with a capacity of 5 million metric tons per annum (mmtpa).33 However, both the government (in its Utilisation Master Plan) and companies have indicated the possibility of the plant being smaller, at least initially. A smaller LNG plant means lower development costs, but also that production and therefore project revenues are spread over a longer time period. A smaller plant may therefore deliver lower returns overall. For example, our calculations suggest that at a LNG price of $11, the project with two trains of 5 mmpta would deliver an after-tax IRR of only 8.3 percent. To clear the assumed hurdle rate of 13 percent, we estimate that a long-term price of at least $17 would be needed. Annual government revenues would be generated until 2072 but would be lower. If investment did go ahead at a LNG price of $11, we estimate that government revenue would be $0.7 billion less a year than in our baseline, averaging $1.6 billion, or 0.6 percent of GDP. These results suggest that if the parties do agree on a smaller LNG plant, the trains are likely to have a larger capacity (e.g. 6 rather than 5 mmtpa), which generates cost efficiencies that we do not account for. Alternatively, they may plan for the plant to be expanded to three trains at a later stage once the initial investment has been recovered.
The impact of regulatory terms
The regulatory framework for the LNG project will be a key determinant of investment decisions and the timing and magnitude of government revenues. Negotiation of the HGA recently commenced. There may also be some renegotiation of the PSAs. We now briefly outline how some of the key terms could impact the investment decision and government revenues. We consider them in more detail (including what it means for government decision-making) in our brief on the HGA negotiation.34
Segmentation across the project value chain. The LNG project is likely to have one of the three common commercial structures shown in Figure 7. This grouping of components is important—though they are expected to have common ownership, different segments will operate under different regulatory frameworks, including different fiscal regimes. Defining what is in each group, and what is not, determines which components are subject to what rules and taxes. It also determines whether there are transactions among the different components of the project.
33 IMF, IMF Country Report No. 16/254, 58.34 Thomas Scurfield and David Manley. Negotiating Tanzania’s gas future (Natural Resource Governance
Institute, 2017).

15
Uncertain Potential: Managing Tanzania’s Gas Revenues
In an integrated structure, the three components are treated as a single taxable entity. With three offshore blocks, there would thus be three taxable entities, each comprising one of the blocks, the connecting pipeline to shore, and a proportional share of the LNG plant.
In a partially segmented structure, each offshore block and related pipeline is treated as one taxable entity but the LNG plant is treated as a separate entity. The offshore blocks and pipelines are therefore treated as the “upstream”, and the LNG plant as a “midstream” entity
In a fully segmented structure, the offshore blocks, offshore pipelines and LNG plant operate and are taxed independently from one another. The offshore blocks are therefore treated as the “upstream”, and the offshore pipelines and the LNG plant as “mid-stream” entities.
Offshore block
Offshore pipeline
LNG plant
Offshore block
Offshore pipeline
LNG plant
Offshore block
Offshore pipeline
LNG plant
We think a partially segmented structure with a tolling arrangement between the offshore blocks and the LNG plant is most likely, but both the government and companies have indicated the structure is yet to be decided. We find that the after-tax IRR for the LNG project may be nearly identical under each of the three approaches to segmentation. The difference appears to be slightly larger when considering government revenues—which, unless the project is significantly more profitable than expected, may be higher for an integrated structure than a fully or partially segmented structure. (There appears to be little difference in government revenues between the fully and partially segmented structures.) Specifically, we estimate that at a LNG price of $11, government revenues would be $0.3 billion more a year with an integrated structure than with the partially segmented structure in our baseline, averaging $2.5 billion, or 1.3 percent of GDP.35
Fiscal regime. In a partially segmented structure, we expect the fiscal regimes in the current PSAs to be levied on the upstream, and the LNG plant to be taxed as a normal business entity (i.e., under the standard income tax regime) but with some differences.36 The upstream fiscal regime in our baseline is based on the leaked addendum to the Block 2 PSA, government statements in 2014 and an assumption that these terms approximate the model PSAs the government has developed for the
35 In other large LNG projects globally, companies have tended to prefer integrated structures. This is because they can write off the costs of developing LNG plants against the higher taxes of the upstream fiscal regime rather than against the lower taxes of the midstream fiscal regime. A segmented structure enables companies to reallocate some income from the higher-taxed upstream entities to the lower-taxed midstream entities through the payment of tolling fees. However, these payments are spread out over the project’s lifetime and therefore the tax savings are typically not as great, in present value terms, as the tax savings available in an integrated structure from the writing off of upfront development costs. In Tanzania, upstream revenues are unlikely to be large enough for upfront costs to be written off quickly, reducing the value of the integrated structure’s tax savings. Based solely on this tax analysis, the government would prefer an integrated structure. However, there are other factors at play—such as a segmented structure making it easier for other companies to use the LNG plant in the future.
36 The Finance Act 2016 defines the midstream as a petroleum operation for tax purposes; therefore, the LNG plant is likely to be subject to specific tax rules. We also expect TPDC to acquire a share of the LNG plant.
Figure 7. Three approaches to segmenting the project value chain
16
Uncertain Potential: Managing Tanzania’s Gas Revenues
sector.37 This regime is much less demanding than the generally applicable regime set out in the prevailing model PSA of 2013 (2013 MPSA) and recent legislation (i.e., the Finance Act 2016 and the Written Laws (Miscellaneous Amendments) Act 2017). The government may therefore look to negotiate a stricter fiscal regime. However, with significant uncertainty about whether investment would occur in the project under current conditions, the companies may attempt to get certain terms relaxed.
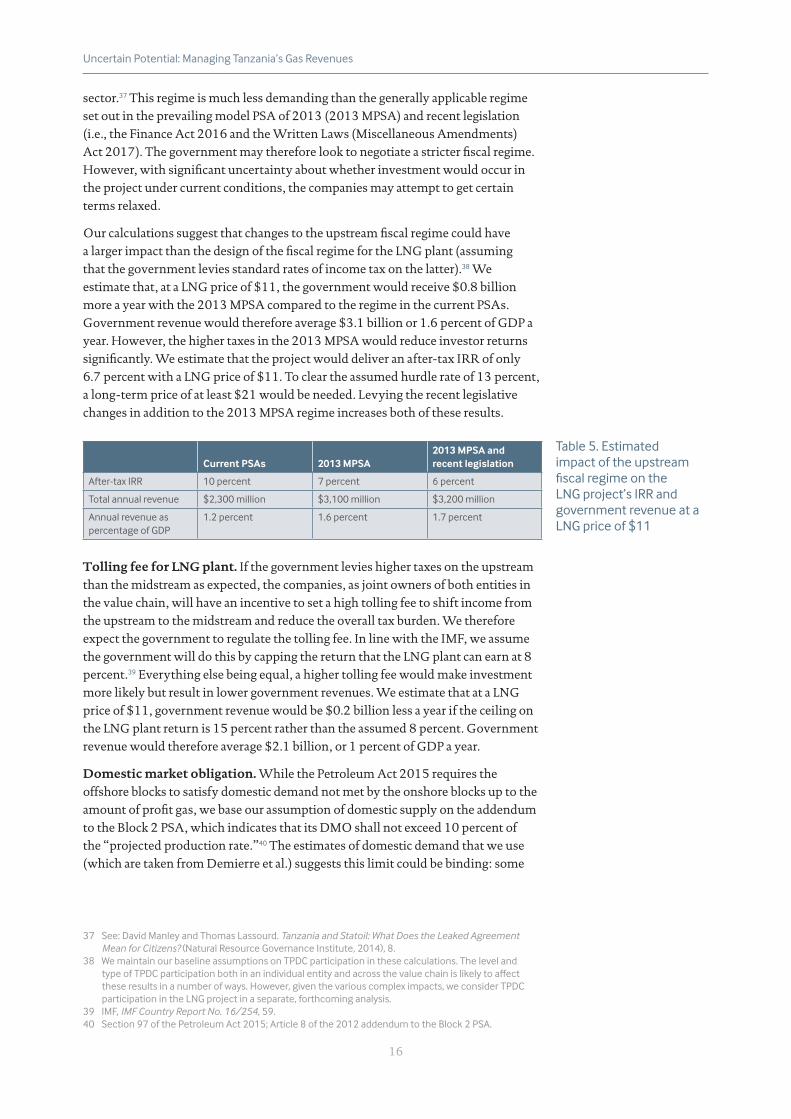
Our calculations suggest that changes to the upstream fiscal regime could have a larger impact than the design of the fiscal regime for the LNG plant (assuming that the government levies standard rates of income tax on the latter).38 We estimate that, at a LNG price of $11, the government would receive $0.8 billion more a year with the 2013 MPSA compared to the regime in the current PSAs. Government revenue would therefore average $3.1 billion or 1.6 percent of GDP a year. However, the higher taxes in the 2013 MPSA would reduce investor returns significantly. We estimate that the project would deliver an after-tax IRR of only 6.7 percent with a LNG price of $11. To clear the assumed hurdle rate of 13 percent, a long-term price of at least $21 would be needed. Levying the recent legislative changes in addition to the 2013 MPSA regime increases both of these results.
Current PSAs 2013 MPSA2013 MPSA and recent legislation
After-tax IRR 10 percent 7 percent 6 percent
Total annual revenue $2,300 million $3,100 million $3,200 million
Annual revenue as percentage of GDP
1.2 percent 1.6 percent 1.7 percent
Tolling fee for LNG plant. If the government levies higher taxes on the upstream than the midstream as expected, the companies, as joint owners of both entities in the value chain, will have an incentive to set a high tolling fee to shift income from the upstream to the midstream and reduce the overall tax burden. We therefore expect the government to regulate the tolling fee. In line with the IMF, we assume the government will do this by capping the return that the LNG plant can earn at 8 percent.39 Everything else being equal, a higher tolling fee would make investment more likely but result in lower government revenues. We estimate that at a LNG price of $11, government revenue would be $0.2 billion less a year if the ceiling on the LNG plant return is 15 percent rather than the assumed 8 percent. Government revenue would therefore average $2.1 billion, or 1 percent of GDP a year.
Domestic market obligation. While the Petroleum Act 2015 requires the offshore blocks to satisfy domestic demand not met by the onshore blocks up to the amount of profit gas, we base our assumption of domestic supply on the addendum to the Block 2 PSA, which indicates that its DMO shall not exceed 10 percent of the “projected production rate.”40 The estimates of domestic demand that we use (which are taken from Demierre et al.) suggests this limit could be binding: some
37 See: David Manley and Thomas Lassourd. Tanzania and Statoil: What Does the Leaked Agreement Mean for Citizens? (Natural Resource Governance Institute, 2014), 8.
38 We maintain our baseline assumptions on TPDC participation in these calculations. The level and type of TPDC participation both in an individual entity and across the value chain is likely to affect these results in a number of ways. However, given the various complex impacts, we consider TPDC participation in the LNG project in a separate, forthcoming analysis.
39 IMF, IMF Country Report No. 16/254, 59.40 Section 97 of the Petroleum Act 2015; Article 8 of the 2012 addendum to the Block 2 PSA.
Table 5. Estimated impact of the upstream fiscal regime on the LNG project’s IRR and government revenue at a LNG price of $11

17
Uncertain Potential: Managing Tanzania’s Gas Revenues
domestic demand may not be satisfied.41 Given this, and that the Petroleum Act 2015 sets out a larger DMO, the government may attempt to negotiate a larger DMO. Supplying more gas to the domestic market, especially at a low price, could have significant benefits for the economy and human development. Nevertheless, if the domestic price is much lower than the LNG price, it could both lower government revenues and have a negative impact on the investment decision. However, given that the domestic market obligation will affect both the revenues and costs of the project, fully understanding its impact requires modeling beyond the scope of this brief.
Summary of our revenue estimates
Our findings highlight the uncertainty of whether the LNG project will go ahead. Lower price forecasts resulting from changes in the global LNG market mean that it is possible that Tanzania’s largest gas deposits will not be developed in the foreseeable future, especially if expected project costs are higher than we estimate or the government attempts to renegotiate a stricter fiscal regime. Even across the scenarios in which we estimate that investment could go ahead, gas revenues are likely to be modest. Only with LNG prices that are significantly higher than expected—at least $16—could potential government revenues be considered transformative.
Current outlook of $8
Historical average price of $11
Estimated break-even price of $14
High price of $16
Price of $11, higher costs
Price of $11, smaller LNG plant
After-tax IRR 5 percent 10 percent 13 percent 15 percent 7 percent 8 percent
Total annual revenue
- $2,300 million
$3,800 million
$4,700 million
$2,100 million
$1,600 million
Annual revenue per person
- $20 $32 $41 $18 $14
Annual revenue as % of GDP
- 1.2 percent 2.0 percent 2.5 percent 1.0 percent 0.6 percent
0%
5%
10%
15%
20%
2017 2022 2027 2032 2037 2042 2047 2052 2057 2062 2067 2072 2077
% o
f GD
P
Gas revenue Non-gas revenue
No offshore investment Historical average price of $11, benchmark costs
Break-even price of $14, benchmark costs High price of $16, benchmark costs
Historical average price of $11, higher costs Historical average price of $11, smaller LNG plant
41 Jonathan Demierre et al., Potential For Regional Use Of East Africa’s Natural Gas, 28. The domestic demand estimates that we use are lower than those set out in the Utilisation Master Plan, given that the latter include demand that would be generated from activities that will involve significant capital expenditure and are not yet certain.
Table 6. LNG project IRR and government revenue estimates across different scenarios
Figure 8. Projected gas revenues across different scenarios

18
Uncertain Potential: Managing Tanzania’s Gas Revenues
Further large discoveries could change the revenue potential for the sector, but the investment decision for the LNG project is likely to impact how much companies are willing to invest in further exploration.42 Given the uncertainty around even this initial investment, we think it prudent to disregard the possibility of other projects in our revenue projections.
What the oil and gas revenues management act means for the use of gas revenues and wider public finances
The Oil and Gas Revenues Management Act provides for the establishment of an oil and gas fund and several fiscal rules related to both oil and gas revenues and wider public finances. This act will determine how gas revenues are used and what impact they have on public finances. The rules for wider public finances mean that it will also be a key determinant of how Tanzania’s public finances are managed, irrespective of the timing or magnitude of gas revenues.
Our model suggests that, under the most probable scenarios, the rules currently included in this act are unlikely to have a significant impact on the use of gas revenues or public spending. To analyze this impact, we primarily use a scenario in which investment goes ahead, but with our baseline assumptions and a LNG price of $11 per mmBtu (the “historical price scenario”). This is not an overwhelmingly likely scenario. Indeed, this price is significantly higher than the figure being used by many analysts today, and it is possible that investment will not take place even if prices are expected to recover to this level. However, without this project proceeding, revenues from the sector would be too trivial to have any discernable effect on public finances. And given that $11 is the average price over the past 15 years, it serves as a useful reference point for where prices could potentially recover (though there is no evidence to suggest that this historical average is likely to be an accurate predictor of future prices).
42 The LNG project will establish the infrastructure and supply chains that future gas projects will most likely rely on (including the LNG plant itself) and therefore reduce operational risks in the future. It will also allow the Tanzanian government to develop the policies, regulation and institutional capacity to manage more gas projects, reducing political and regulatory risks.
19
Uncertain Potential: Managing Tanzania’s Gas Revenues
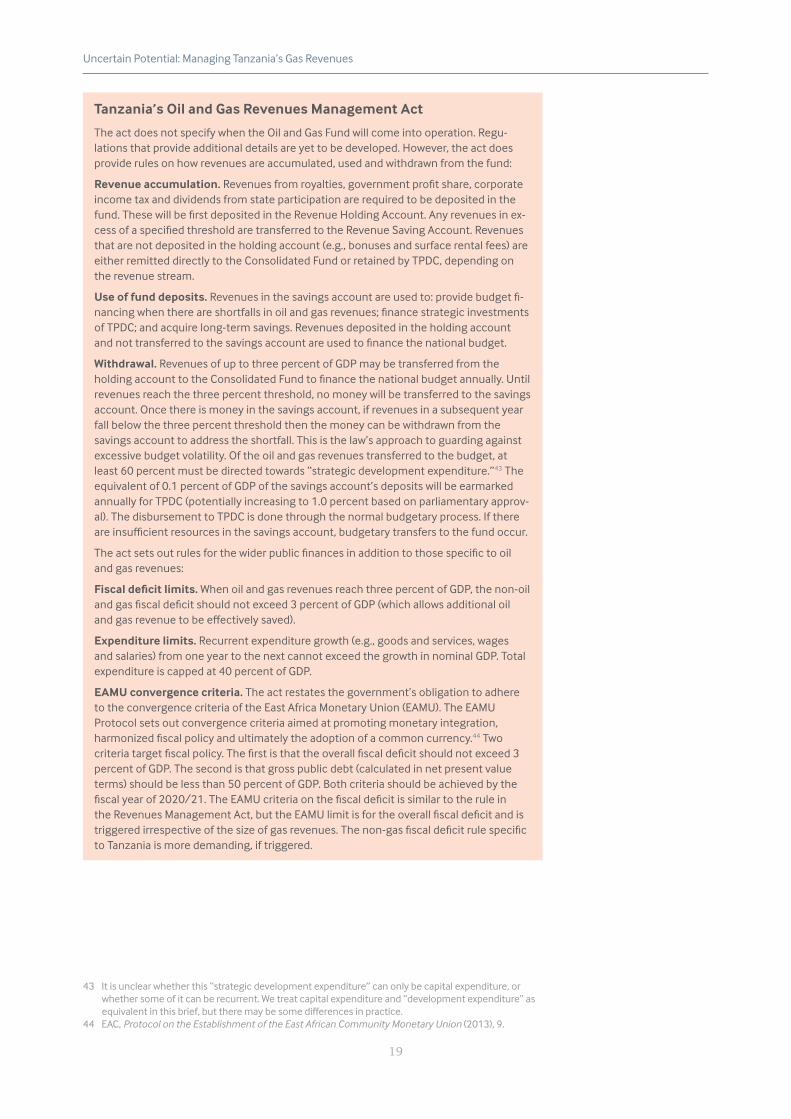
Tanzania’s Oil and Gas Revenues Management Act
The act does not specify when the Oil and Gas Fund will come into operation. Regu-lations that provide additional details are yet to be developed. However, the act does provide rules on how revenues are accumulated, used and withdrawn from the fund:
Revenue accumulation. Revenues from royalties, government profit share, corporate income tax and dividends from state participation are required to be deposited in the fund. These will be first deposited in the Revenue Holding Account. Any revenues in ex-cess of a specified threshold are transferred to the Revenue Saving Account. Revenues that are not deposited in the holding account (e.g., bonuses and surface rental fees) are either remitted directly to the Consolidated Fund or retained by TPDC, depending on the revenue stream.
Use of fund deposits. Revenues in the savings account are used to: provide budget fi-nancing when there are shortfalls in oil and gas revenues; finance strategic investments of TPDC; and acquire long-term savings. Revenues deposited in the holding account and not transferred to the savings account are used to finance the national budget.
Withdrawal. Revenues of up to three percent of GDP may be transferred from the holding account to the Consolidated Fund to finance the national budget annually. Until revenues reach the three percent threshold, no money will be transferred to the savings account. Once there is money in the savings account, if revenues in a subsequent year fall below the three percent threshold then the money can be withdrawn from the savings account to address the shortfall. This is the law’s approach to guarding against excessive budget volatility. Of the oil and gas revenues transferred to the budget, at least 60 percent must be directed towards “strategic development expenditure.”43 The equivalent of 0.1 percent of GDP of the savings account’s deposits will be earmarked annually for TPDC (potentially increasing to 1.0 percent based on parliamentary approv-al). The disbursement to TPDC is done through the normal budgetary process. If there are insufficient resources in the savings account, budgetary transfers to the fund occur.
The act sets out rules for the wider public finances in addition to those specific to oil and gas revenues:
Fiscal deficit limits. When oil and gas revenues reach three percent of GDP, the non-oil and gas fiscal deficit should not exceed 3 percent of GDP (which allows additional oil and gas revenue to be effectively saved).
Expenditure limits. Recurrent expenditure growth (e.g., goods and services, wages and salaries) from one year to the next cannot exceed the growth in nominal GDP. Total expenditure is capped at 40 percent of GDP.
EAMU convergence criteria. The act restates the government’s obligation to adhere to the convergence criteria of the East Africa Monetary Union (EAMU). The EAMU Protocol sets out convergence criteria aimed at promoting monetary integration, harmonized fiscal policy and ultimately the adoption of a common currency.44 Two criteria target fiscal policy. The first is that the overall fiscal deficit should not exceed 3 percent of GDP. The second is that gross public debt (calculated in net present value terms) should be less than 50 percent of GDP. Both criteria should be achieved by the fiscal year of 2020/21. The EAMU criteria on the fiscal deficit is similar to the rule in the Revenues Management Act, but the EAMU limit is for the overall fiscal deficit and is triggered irrespective of the size of gas revenues. The non-gas fiscal deficit rule specific to Tanzania is more demanding, if triggered.
43 It is unclear whether this “strategic development expenditure” can only be capital expenditure, or whether some of it can be recurrent. We treat capital expenditure and “development expenditure” as equivalent in this brief, but there may be some differences in practice.
44 EAC, Protocol on the Establishment of the East African Community Monetary Union (2013), 9.

20
Uncertain Potential: Managing Tanzania’s Gas Revenues
Oil and gas revenue rules
If investment goes ahead in our historical price scenario, with projected gas revenues peaking at $3.2 billion and 1.9 percent of GDP a year, revenues would only finance the government budget. These revenues would not reach the 3 percent of GDP threshold at which revenues are required to be deposited into the Oil and Gas Fund’s Revenue Saving Account and used to serve the three other objectives: financing the national oil company investment; fiscal stabilization; and saving for future generations. No revenues would be saved in any of our scenarios, except in a scenario in which the price reaches at least $16 per mmBtu—close to the peaks of 2012–2014.
In this high-price scenario, some revenue would be deposited in the savings account. However, this amount is still relatively small—approximately $7.5 billion in total. It would be drawn down within about 7 years once revenues fell from their peak and deposits were used to make up for the shortfall in the amount available to finance the budget in later years. Some of this amount would also be ring-fenced for TPDC. Yields are likely to be modest on the nascent resource fund: we assume an annual return of 2 percent in real terms.45 As a result, there would be insufficient time for the funds in the savings account to generate significant returns and build up a sustainable source of income for the government.
0
1,000
2,000
3,000
4,000
5,000
6,000
2017 2022 2027 2032 2037 2042 2047 2052 2057
Am
ount
in s
avin
gs a
ccou
nt ($
mill
ions
)
Historical price of $11 High price of $16
The rules require at least 60 percent of oil and gas revenues entering the budget to be spent on “strategic development expenditure.” This minimum represents gas revenue of $1.4 billion—or 0.7 percent of GDP a year—if investment goes ahead in the historical price scenario. In the high price scenario in which the long term price is $16, gas revenue would contribute at least $2.8 billion—or 1.5 percent a year—to the development budget. Total development expenditure was only 4.5 percent of GDP in 2015/16, and therefore the contribution of gas revenues to the development budget would not be insignificant. However, even if prices are considerably higher than expected, gas revenues alone would not be enough to bring Tanzania’s current development expenditure up to the recent East African Community (EAC) average. (See Figure 10.)46
45 This is based on a nominal return on Ghana’s petroleum fund of 1 percent (or approx. -1 percent in real terms) in its first five years of existence (with a limited amount to invest, and a relatively conservative investment strategy) and an average of 5 percent real return targets for well-established natural resource funds. From: Ghana Ministry of Finance, 2016 Annual Report on the Petroleum Funds (2016), 26. And: Andrew Bauer, Malan Rietveld and Perrine Toledano. Managing the Public Trust: How to Make Natural Resource Funds Work for Citizens (Natural Resource Governance Institute and Columbia Center on Sustainable Investment, 2014), 62.
46 IMF, IMF Country Report No. 16/254, 35.
Figure 9. Projected funds in the Revenue Saving Account across different LNG price scenarios

21
Uncertain Potential: Managing Tanzania’s Gas Revenues
0%
2%
4%
6%
8%
10%
12%
14%
16%
South Afri
ca
Côte d'Iv
oire
Zambia
Malawi
Tanzania
Ghana
Uganda
Kenya
Ethiopia
Senegal
Rwanda
Burundi
Mozambique
Publ
ic in
vest
men
t, pe
rcen
tage
of G
DP
EAC average
Public finance rules
The rule restricting the non-gas fiscal deficit to 3 percent of GDP only comes into force when gas revenues reach 3 percent of GDP, and therefore it would only be triggered in the high price scenario. The less-restrictive target of the EAMU—an overall fiscal deficit of 3 percent of GDP by 2021—would be the applicable limit in all other scenarios. The imposition of limits on total government expenditure and recurrent expenditure growth is not affected by the size of gas revenues. The act implies that these are intended to come into force in 2016/17.
Tanzania’s fiscal deficit was 3.5 percent in 2015/16. Given constrained spending it is estimated to be only 2.9 percent in 2016/17,47 but is likely to return to previous levels in the next few years. Our baseline projections (which take into account expected higher GDP growth of 6.5 percent in the medium term) align with the IMF’s latest debt sustainability analysis. This projects the deficit to be slightly below 3 percent of GDP (and to therefore meet the EAMU requirement) by 2023.48 If investment goes ahead in our historical price scenario, we estimate that the generation of larger (but still modest) gas revenues from 2026 would result in the deficit falling to around 2-2.5 percent of GDP during the period of offshore gas production.
Total expenditure levels (as a percentage of GDP) do not significantly change from 18.3 percent in 2015/16 in our baseline, and therefore the limit on total expenditure of 40 percent of GDP would not be binding at any point during gas production. We assume recurrent expenditure grows in line with nominal GDP until offshore gas production commences as per the limit on recurrent expenditure growth.49 The growth dynamics would change slightly with offshore gas production with more fluctuation in GDP growth rates, but our results suggests the limit would continue to be binding in most years. When recurrent expenditure is limited by this rule, we do not expect the level of total expenditure to be affected. Given Tanzania’s development needs, any fiscal space it has is likely to be utilized; we therefore expect this rule, when binding, to increase the proportion of development expenditure rather than reduce total expenditure.
47 IMF, IMF Country Report No. 17/180 (2017), 20. 48 IMF, IMF Country Report No. 16/253 (2016), 3.49 Recurrent expenditure may actually grow more slowly than the rule allows in the next few years.
The government has committed to increasing development expenditure to 40 percent of total expenditure in the short term. See Ministry of Finance and Planning, Budget Speech 2016 (2016), 10.
Figure 10. Public capital expenditure across Africa 2010–2014 (percentage of GDP)Source: IMF selected issues paper of 2016 on Tanzania
22
Uncertain Potential: Managing Tanzania’s Gas Revenues
Tanzania is at low risk of debt distress according to the IMF’s latest debt sustainability analysis, and our baseline projections align with this assessment. Our results show debt as a percentage of GDP increasing slightly from its level of 37.5 percent in 2015/16 over the medium term, but then falling below this level during offshore gas production. We estimate that interest payments would also fall below their current level of 8.2 percent of total expenditure during this period.
Assuming that primary expenditure grows in line with the non-gas economy on average, Tanzania appears to be on the path toward meeting the EAMU’s deficit target and maintain benign debt levels. Indeed, given the current deficit level, there appears to be space to increase spending in the short term. If the LNG project does go ahead, a modest increase in spending in the longer term (once gas revenues start flowing) is also likely to be possible. However, our results suggest that, even with these gas revenues, the deficit would rapidly increase were primary expenditure to grow faster than non-gas GDP for a sustained period. With long-term primary expenditure growth of 6.0 percent but non-gas GDP growth of only 5.5 percent, the EAMU target would not be met and the deficit would reach 5.0 percent by 2043. In this scenario, we estimate that debt would reach 50 percent of GDP around 2041 and interest payments would account for nearly 12 percent of total expenditure by 2050. This highlights the danger of significantly increasing spending based on hopes of a gas revenue windfall.
POLICY RECOMMENDATIONS
Lessons for fiscal rules
Our findings suggest that the existing legislation on revenue management will have some impact on the management of wider public finances but a limited impact on decisions around the use of gas revenues.
This does not necessarily mean that the revenue management framework is inappropriate. Indeed, the act establishes solid principles for the management of oil and gas revenues and wider public finances. Neverthless, the framework suffers from a number of important shortcomings. A primary weakness is the pro-cyclicality of the fiscal rules as a result of them being anchored (or linked) to GDP. This will exacerbate boom-bust cycles. Another important weakness is the financing mechanism for TPDC—again anchored to GDP—which may not be sufficiently responsive to the company’s needs or spending capacity. Finally, rules earmarking the spending of gas revenues are not situated within a broader spending strategy, which may mean that they do not result in more resources being directed to priority areas.
The act states that amendments should be made only once every five years—so 2020 at the earliest. This is still some years away. But, given the current uncertainty, this may prove a good timeline for reassessing the rules for managing gas revenues and establishing consensus on their modification via consultative review.
However, some rules apply to wider public finances and therefore the government should consider reviewing them now. Similarly, the financing mechanism for TPDC has immediate implications given that the company will need to begin building its capacity to have an active role in future activity. This mechanism would also benefit from an immediate review.

23
Uncertain Potential: Managing Tanzania’s Gas Revenues
Below, we examine the implications of projections of gas revenues for the optimality of both sets of rules. We keep in mind that large revenues are only likely to start flowing in 2026 (at the earliest) and that the state of the public finances and economy might change significantly by then. It is therefore still too early to determine an optimal revenue management framework.
Saving for future generations
The finite nature of gas reserves means that they should be used to accumulate productive assets that can generate current and future income streams as well as maintain growth once the gas has been exhausted. The IMF reports that although health outcomes have been improving in Tanzania, the country suffers from education outcomes that are lower than many of its neighbors’ and also suffers from a significant infrastructure gap.50 Unless Tanzania’s acute development needs are somehow all met in the next decade, investing gas revenues in these areas will likely generate the greatest benefits for both current and future generations rather than explicitly saving them using financial instruments.
There are a number of other reasons why it may be appropriate for Tanzania to save some of its extractive revenues: a lack of absorptive capacity in the economy; risk of Dutch disease; and inefficiencies in government expenditure. It appears that the economy currently has sufficient capacity to absorb further spending given the relatively low level of inflation. However, increases in government spending over the past 20 years have occasionally led to a rise in inflation; thus, large spending increases would still need to be approached with caution.
0%
5%
10%
15%
20%
25%
30%
35%
1997 1999 2001 2003 2005 2007 2009 2011 2013 2015
Annual change in government expenditure Inflation rate
The mining sector arguably caused some Dutch disease effects during the commodity boom of 2004–2014. Growth was driven by services and other non-tradables, which is believed to be at least partly a result of spending financed by income generated from the sector. The exchange rate also appreciated significantly during that period. Nevertheless, the risk of a significant impact appears to still be reasonably low, given that the agriculture and manufacturing sectors continue to perform well.51 This risk is particularly low given that the gas sector is likely to remain small relative to the rest of the economy.
50 IMF, IMF Country Report No. 16/254, 37-44.51 National Bureau of Statistics, National Accounts of Tanzania Mainland 2007-2015 (2016), 27.
Figure 11. Government expenditure and inflation 1997–2016Source: IMF World Economic Outlook

24
Uncertain Potential: Managing Tanzania’s Gas Revenues
However, the low efficiency of government spending is a cause for concern. The Public Expenditure and Financial Accountability Assessment, the Public Investment Management Index, the Open Budget Survey and a recent IMF evaluation of public spending all point to several weaknesses in spending processes.52 Some areas of concern include: gaps in the project appraisal process; government units operating outside the budget; weak internal controls (which can lead to budget slippages and arrear accumulation); and limited budget oversight by audit institutions.
We do not believe gas revenues will be large enough to be deposited into the Oil and Gas Fund’s savings account. However, unless circumstances change significantly, we do not believe this necessitates lowering the savings threshold. Conditions currently appear favorable for greater spending, if this spending is focused on areas that will contribute to Tanzania’s long-term development—including investment in public financial management reform to improve the effectiveness of government spending.
Losing revenues through premature saving
A common policy-making mistake is to save a significant proportion of resource revenues while simultaneously borrowing. A growing number of countries in Africa are setting up sovereign wealth funds into which they place revenues, despite also having large (non-concessional) debts. This could result in losing revenues, such as in the case of Ghana. There, the government is earning around 1 percent interest on the savings in its Heritage Fund, while paying more than 9 percent interest on its latest Eurobond issuances.
Stabilizing the budget
We expect gas revenues to make up a relatively small proportion of total government revenues—around 7.5 percent in our historical price scenario. Tanzania will therefore be some way from being classified as resource dependent, and any volatility in gas revenues is unlikely to have significant repercussions for budget implementation.54,55
However, the use of GDP as an anchor for many of the fiscal rules may mean these rules actually increase rather than decrease budget volatility. Under the current rules, when GDP is higher, government spending can increase; but if the economy is hit by an economic shock, spending would have to be cut back.56 This is likely to exacerbate and reinforce already volatile spending. As Figure 11 shows, sudden spikes in spending in the past 20 years have sometimes involved increases of up to 30 percent.
52 ADE, Public Expenditure and Financial Accountability (PEFA) Assessment – Mainland Tanzania (Central Government) (2013); Era Dabla-Norris et al. Investing in Public Investment: An Index of Public Investment Efficiency (IMF, 2011); International Budget Partnership, Open Budget Index 2015 – Tanzania (2016); IMF, IMF Country Report No. 16/254, 32-46.
53 “Sovereign-wealth funds catch on in Africa,” The Economist, 16 March 2017, accessed 15 May 2017, https://www.economist.com/news/finance-and-economics/21718893-countries-disagree-about-how-use-them-sovereign-wealth-funds-catch.
54 The IMF suggests that an indicative threshold for resource dependency is resource revenue accounting for 20–25 percent of total revenue. From: Thomas Baunsgaard et al. Fiscal Frameworks for Resource Rich Developing Countries (IMF, 2012), 6.
55 Also accounting for mining revenues would not change this assessment. Mining revenues contributed only 8.2 percent of government revenues in 2014/15 (the most recent year for which comprehensive mining revenue data is available). From: BOAS & Associates. Final Report of the Tanzania Extractive Industries Transparency Initiative for the period July 1 2014 to June 30 2015 (2017), 67.
56 Section 17 of the Oil and Gas Revenues Management Act 2015.

25
Uncertain Potential: Managing Tanzania’s Gas Revenues
The rule limiting recurrent expenditure growth to the rate of nominal GDP growth is particularly problematic.57 Nominal GDP growth tends to be more volatile than real GDP growth, as the former captures the combined effect of changes in real GDP and prices. This rule may also exacerbate absorptive capacity problems. If inflation spiked due to demand exceeding supply in the economy, it would allow for larger increases in recurrent spending, leading to even higher demand.
One of the main intentions of the rules was to safeguard against budget volatility caused by gas revenues; but in practice, gas may not be the main source of shocks. Changes in spending in the past 20 years have been much larger than expected gas revenues in any given year, let alone the change in gas revenues between years. Any volatility in gas revenues is therefore unlikely to have significant repercussions for budget implementation. However, there is a risk that these rules will exacerbate pro-cyclical spending, and therefore contribute to boom-bust cycles. Any review of the framework would need to address this potential risk. The government should also consider giving immediate attention to the rule on recurrent expenditure growth given that the act implies that it should come into force immediately.58 Other options for rules limiting recurrent expenditure growth include an absolute limit (for example, a limit of 4 percent growth in recurrent expenditure) and anchoring it to a less volatile GDP measure (such as a multi-year GDP growth average).
While it is unlikely that the rule for saving gas revenues will be binding, we think that changes should also be made that would increase the potential for saved revenues to act as a stabilizing influence on the budget. Currently, savings can be used to ensure that gas revenues equivalent to 3 percent of GDP finance the budget in any given year. However, these savings should be used in years of severe economic shocks rather than as a result of minor fluctuations in gas revenues or GDP.
Financing TPDC investments
It is unlikely that TPDC will be financed from deposits in the savings account, but the Revenues Management Act provides for a budget allocation to make up for any shortfall in the 0.1 percent of GDP earmarked for TPDC. Therefore, in theory, the amount of funding available to TPDC should not be affected by lower gas revenues. However, this financing is provided through the “normal budgetary process” and so is not automatic. Lower revenues from the sector may mean less funding is actually approved. That may be appropriate if the prospects for the sector are modest—potential returns from any investment should be considered against the opportunity cost. For example, with our baseline cost estimates, TPDC will need to invest nearly $0.6 billion to acquire equity of 12 percent in the LNG plant. This amount will lead to less money being used to finance infrastructure or education, and possibly greater borrowing (with more spending being diverted to interest payments). The expected returns from any investment need to exceed these costs for it to be worthwhile.
Irrespective of whether revenues are likely to be sufficient to finance TPDC through the savings account, and regardless of the optimal level of TPDC activity, we think that the government should reconsider this financing mechanism. Tying TPDC’s funding to GDP is unlikely to be an effective mechanism for ensuring it receives financing appropriate to its objectives or spending capacity. In our historical price scenario, the average amount earmarked for TPDC between 2020 and 2040 would
57 Ibid., Section 17(d)(i).58 The overall limit on expenditure is also intended to come into force immediately, but it is unlikely to be
binding at any point over the next few decades.
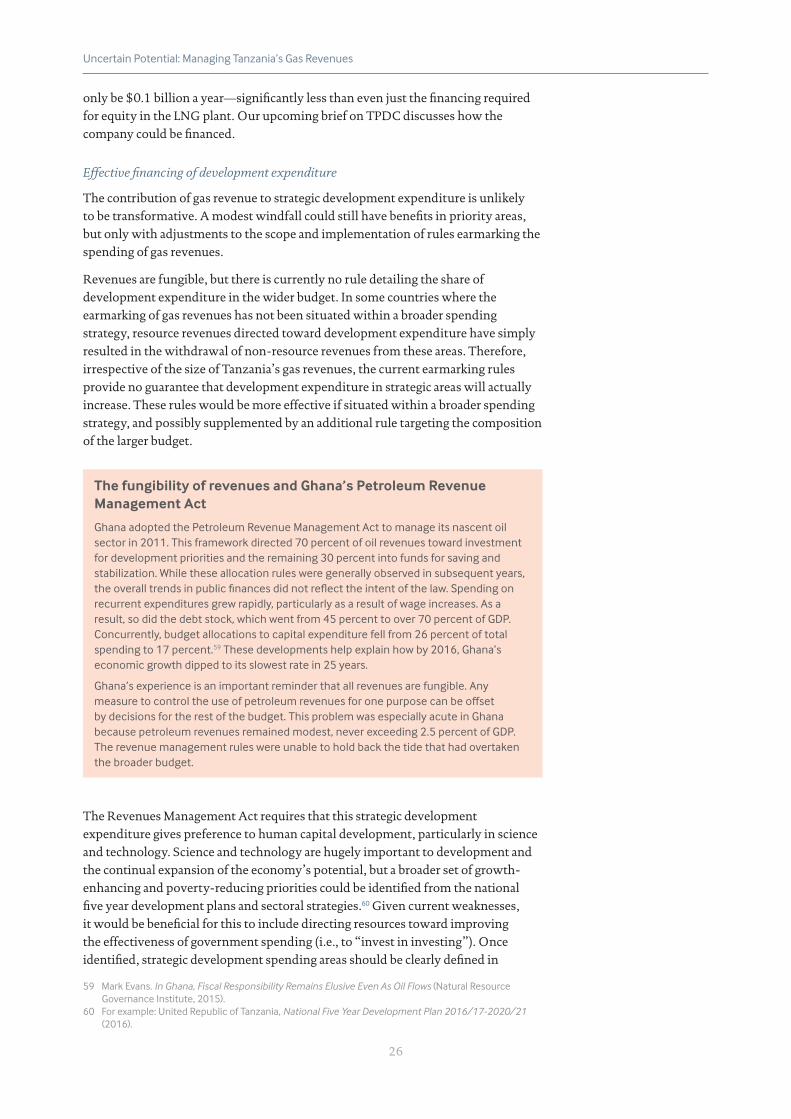
26
Uncertain Potential: Managing Tanzania’s Gas Revenues
only be $0.1 billion a year—significantly less than even just the financing required for equity in the LNG plant. Our upcoming brief on TPDC discusses how the company could be financed.
Effective financing of development expenditure
The contribution of gas revenue to strategic development expenditure is unlikely to be transformative. A modest windfall could still have benefits in priority areas, but only with adjustments to the scope and implementation of rules earmarking the spending of gas revenues.
Revenues are fungible, but there is currently no rule detailing the share of development expenditure in the wider budget. In some countries where the earmarking of gas revenues has not been situated within a broader spending strategy, resource revenues directed toward development expenditure have simply resulted in the withdrawal of non-resource revenues from these areas. Therefore, irrespective of the size of Tanzania’s gas revenues, the current earmarking rules provide no guarantee that development expenditure in strategic areas will actually increase. These rules would be more effective if situated within a broader spending strategy, and possibly supplemented by an additional rule targeting the composition of the larger budget.
The fungibility of revenues and Ghana’s Petroleum Revenue Management Act
Ghana adopted the Petroleum Revenue Management Act to manage its nascent oil sector in 2011. This framework directed 70 percent of oil revenues toward investment for development priorities and the remaining 30 percent into funds for saving and stabilization. While these allocation rules were generally observed in subsequent years, the overall trends in public finances did not reflect the intent of the law. Spending on recurrent expenditures grew rapidly, particularly as a result of wage increases. As a result, so did the debt stock, which went from 45 percent to over 70 percent of GDP. Concurrently, budget allocations to capital expenditure fell from 26 percent of total spending to 17 percent.59 These developments help explain how by 2016, Ghana’s economic growth dipped to its slowest rate in 25 years.
Ghana’s experience is an important reminder that all revenues are fungible. Any measure to control the use of petroleum revenues for one purpose can be offset by decisions for the rest of the budget. This problem was especially acute in Ghana because petroleum revenues remained modest, never exceeding 2.5 percent of GDP. The revenue management rules were unable to hold back the tide that had overtaken the broader budget.
The Revenues Management Act requires that this strategic development expenditure gives preference to human capital development, particularly in science and technology. Science and technology are hugely important to development and the continual expansion of the economy’s potential, but a broader set of growth-enhancing and poverty-reducing priorities could be identified from the national five year development plans and sectoral strategies.60 Given current weaknesses, it would be beneficial for this to include directing resources toward improving the effectiveness of government spending (i.e., to “invest in investing”). Once identified, strategic development spending areas should be clearly defined in
59 Mark Evans. In Ghana, Fiscal Responsibility Remains Elusive Even As Oil Flows (Natural Resource Governance Institute, 2015).
60 For example: United Republic of Tanzania, National Five Year Development Plan 2016/17-2020/21 (2016).

27
Uncertain Potential: Managing Tanzania’s Gas Revenues
regulation and then mapped to programs and projects as part of the budget process. This would allow the level of current spending in these areas to be tracked to ensure they are actually seeing an increased allocation as a result of gas revenues.
Maintaining broader fiscal sustainability
A large build-up of government debt is costly to both current and future generations. The resulting repayments can prevent a government from sustaining spending in the long run, leading to lower growth and a possible reversal of development gains. Rules that restrict the fiscal deficit and/or debt levels are therefore important.
We expect gas revenues to remain lower than 3 percent of GDP, in which case the non-gas fiscal deficit limit of 3 percent of GDP would not be applicable. Instead, the EAMU criteria of an overall deficit of 3 percent of GDP is likely to be the applicable limit. Unless circumstances change significantly, this less-restrictive limit on the overall deficit appears appropriate. Current conditions appear favorable for greater spending and there is a low risk of debt distress. The limit on the non-gas fiscal deficit would be unnecessarily restrictive even if gas revenues were higher than projected.
In our high-price scenario, the stricter deficit limit would be triggered around 2028. To avoid a shock to the economy when this limit is imposed by suddenly making the necessary spending cuts, the government would need to start scaling back spending soon. Even with this more ambitious limit not being imposed for another 11 years, we calculate that primary expenditure growth could only be 5.2 percent a year from this year onward (despite the economy and revenues growing at a faster rate and space for slightly higher expenditure growth).
In light of this, not having the binding constraint of the non-gas deficit limit can be viewed relatively positively, and there appears to be no urgency to impose such a limit (irrespective of the size of gas revenues). However, it does raise the question of what modest gas revenues mean for wider public finances and their management.
Public finances and avoiding the ‘presource curse’
One of the most important policy implications of uncertain and likely modest revenues is that the government should not base its public finance plans—and in particular should be careful not to build up excessive debt—on the expectation of a gas windfall. Doing so would put Tanzania at risk of a common mistake that has plagued many countries that have made large discoveries, a phenomenon we call the “presource curse.”
A number of countries have seen their economies deteriorate only a few years after major resource discoveries. Brazil, Ghana, Mongolia, Mozambique and Sierra Leone provide examples of countries that observers only five years ago believed would become rich as a result of transformative resource projects, but are now facing critical economic sustainability challenges. In contrast to the classic resource curse caused by the economic and social effects of active resource projects, the “presource curse” suggests that expectations of future resource revenues may also lead to economic problems.

28
Uncertain Potential: Managing Tanzania’s Gas Revenues
94
96
98
100
102
104
106
1 2 3 4 5 6
GD
P =
100
in y
ear 1
Years after discovery
GDP growth forecast (IMF) Actual growth
In order to avoid the “presource curse,” it is critical for the Tanzanian government to keep public finances sound by adhering to fiscal rules of the EAMU; prioritizing domestic investment; improving transparency in revenue management; and managing the public’s expectations about uncertain, and likely modest and far-off, gas revenues.
Avoiding the temptation of excessive debt
Resource discoveries create an illusion of instantaneous wealth, when in reality those revenues may be small or distant. This may explain why a number of countries embarked on economically unsustainable policies shortly after making major resource discoveries. In Brazil there was an explosion of private debt, in Ghana and Mozambique it was mainly public debt, and in Mongolia it was both. This debt was used primarily to increase consumption. Since then, Ghana, Mongolia and Mozambique have all turned to the IMF to request financial assistance, while Brazil’s economy plunged into its worst-ever recession in 2014.61 More generally, after large oil and gas discoveries, countries—especially those with governance challenges—tend to increase their borrowing and then watch their growth fall short of anticipated rates.62,63
Tanzania is well placed to avoid the mistakes of these countries, which were tempted to ramp up borrowing and consumption on the back of uncertain revenues. Its current level of debt is low and so is the risk of debt distress. This means that it should have the fiscal space to increase its current, very low level of external commercial borrowing. In doing so, it appears able to finance an increase in spending in the short term, as well as to make a small increase in spending or one-off spending boosts in the longer term, while still meeting the EAMU target and not triggering a significant increase in the debt-to-GPD ratio. But we advise caution. If Tanzania were to embark on a rapid widening of its deficit, its interest payments could increase significantly. Moreover, it is not the stock of debt that matters most but debt dynamics. If debt starts down an unsteady path as a result of permanent increases in government consumption or wages, then debt sustainability can worsen rapidly.64
61 David Mihalyi. Debt Sustainability Challenges in Resource Rich Countries (Natural Resource Governance Institute, 2016).
62 Rabah Arezki, Valerie A. Ramey and Liugang Sheng. New Shocks in Open Economies: Evidence from Giant Oil Discoveries (IMF, 2015).
63 James Cust and David Mihalyi. Presource curse? Oil discoveries, elevated expectations and growth disappointments (World Bank, 2017).
64 Antonio Bassanetti, Carlo Cottarelli and Andrea Presbitero. Lost and Found: Market Access and Public Debt Dynamics (IMF, 2016).
Figure 12. Growth forecasts and actual growth in the five years following large oil discoveries in countries with below-average governance scoresSource: Cust and Mihalyi, 2017
29
Uncertain Potential: Managing Tanzania’s Gas Revenues
Tanzania’s development expenditure has been significantly below the EAC average in recent years. Priority for any additional spending should therefore be given to development expenditure (to the extent that projects can be identified that yield economic returns exceeding borrowing rates). This prioritization is in line with the government’s aim to increase the share of development expenditure in the budget.65
While they provide no guarantees, the rules on the public finances in the Revenues Management Act appear to provide an effective tool for Tanzania to avoid the mistakes of other countries. The EAMU convergence criteria sets a limit to the deficit that appears to be consistent with long-term sustainability under modest gas revenue scenarios. The recurrent expenditure growth limit, if effectively applied, should ensure that any additional spending prioritizes development expenditure (though its anchor to GDP needs to be reconsidered).
Improving transparency
Resource-rich countries tend to have lower overall institutional quality and greater opacity. This lack of transparency poses a threat to fiscal sustainability.
Mozambique provides a cautionary tale. Beginning in 2013, the government borrowed heavily on the back of future gas revenues. A significant proportion of this borrowing was done by a state-owned fishing company, which meant the loans circumvented any reporting requirement and parliamentary approval but were still covered by government guarantee. This lack of transparency led to questions about the government’s reliability and resulted in donors freezing financial support. This in turn aggravated challenges that stemmed from growing debt.
The Tanzania Extractive Industries Transparency and Accountability Act was passed in 2015. However, it is yet to be fully implemented. It also has some weaknesses. For example, it is unclear whether the requirement for contract disclosure applies to con-tracts prior to 2015 and it only requires limited disclosures by state-owned compa-nies.66 The government could address these weaknesses as it develops regulations.
The country also provides limited budget information (it scored 46/100 in the latest Open Budget Index).67 In particular, there is very little information available on the volume, rates and conditions of non-concessional borrowing undertaken so far. Similarly, further information is needed on government guarantees on behalf of state development banks and state-owned companies.
To adhere to the Revenues Management Act and to maintain fiscal sustainability, it will be critical for the government to continue increasing transparency efforts. The significant role for the EAMU criteria makes improved transparency on the public finances even more important—international experience indicates that regional targets can often be weak on political buy-in and accountability. The fact that the convergence criteria are explicitly referenced in the Revenues Management Act is an encouraging first step, but the government could do more to ensure they are met. A concrete step that the government might consider would be to task an (existing or new) independent body—such as the National Audit Office or Parliamentary Budget Office—to oversee improved disclosure of budgetary information and publish its assessment of government compliance with (both regional and national) fiscal rules.
65 Ministry of Finance and Planning, Budget Speech 2016, 10.66 The act includes state-owned companies in its definition of extractives companies, and therefore they
are required to follow the same disclosure requirements. However, given their importance for public finances, state-owned companies should be subject to more comprehensive requirements, such as financial flows to and from the government in addition to tax payments.
67 International Budget Partnership, Open Budget Index 2015 – Tanzania.
30
Uncertain Potential: Managing Tanzania’s Gas Revenues
Managing public expectations
Effective management of gas revenues will require informed citizens as well as an informed government. News of major discoveries spread quickly through Tanzania, but getting the public to understand the discoveries’ future revenue-generating potential will be more difficult.68 The Government of Liberia received a signature bonus of $50 million for prospecting rights for offshore oil by ExxonMobil. Though initial drilling results were mixed, the report of oil bonus payments by a major company fueled citizen expectations instantly. Paul Collier suggests that the signature bonus should have been announced as an amount per capita of only $12; additionally, he suggests that the low chance of further resource revenues based on first drillings should have also been noted.69 This would have helped manage citizens’ expectations.
A survey of Tanzanian citizens in 2015 indicated that around 53 percent believed the large offshore deposits were already producing and 60 percent believed that revenues were already being generated.70 News articles suggested that Tanzania might start exporting its gas as early as 2015.71 When the Revenues Management Act was passed, the only publically available long-term forecasts of the sector suggested revenues as high as $6 billion a year. Gas prices, market conditions and available information have changed substantially since.
Our analysis provides an updated picture of expected revenues and its likely impact on the public finances. As we have shown, gas revenues are unlikely to be transformative, and are likely to fall short of the expectations of many Tanzanians. Government efforts to improve the public’s understanding of the likely impact and uncertainty of gas revenues would help ensure unrealistic expectations do not derail government policies.
68 Paul Collier. Under Pressure (IMF, 2013).69 Paul Collier. “The Institutional and Psychological Foundations of Natural Resource Policies,” The
Journal of Development Studies 53(2) (2017), accessed 15 July 2017, doi.org/10.1080/00220388.2016.1160067.
70 Twaweza. Great Expectations – Citizens’ views about the gas sector (2015), 3.71 E.g., “Gas-rich Tanzania to start power exports in 2015,” Reuters, 25 August 2013, accessed 15 May
2017, http://www.reuters.com/article/tanzania-gas-idUSL6N0GQ0JR20130825.

31
Uncertain Potential: Managing Tanzania’s Gas Revenues
CONCLUSION
In our analysis of Tanzania’s gas sector and its revenue potential, we have emphasized that there is still significant uncertainty regarding the level of investment in the gas sector and how much revenue it will generate. Large gas projects are notoriously difficult to operationalize. A review by Lex Huurdeman found that of 16 major gas discoveries in Africa made between 1955 and 2012, only 9 have been successfully developed thus far.72 Lower price forecasts resulting from changes in the global market for LNG make it even more likely that Tanzania’s LNG project will not go ahead in the foreseeable future.
The government will therefore need to look for ways to increase the chances of the project going ahead while ensuring that Tanzania will still fully benefit if it does. For example, it will need to make difficult strategic decisions about which of its objectives to prioritize. Improvements in the wider business climate—including the establishment of a regulatory framework that is stable and predictable—will also be crucial to reducing both the perception of investor risk and project costs.
Even if the project proceeds, revenues are likely to be modest and only sufficient to finance the government budget. Tanzania’s current public finances appear relatively sound, and if the government adheres to the EAMU convergence criteria while continuing to increase development expenditure, the country should be on a sustainable development trajectory. However, a number of countries have seen their economies deteriorate only a few years after major resource discoveries. In contrast with the classic resource curse caused by the impacts of active resource projects, the “presource curse” suggests that expectations of future resource revenues may also lead to economic problems. This phenomenon and our findings highlight how risky it would be for the government to base its public finance plans on the expectation of a gas revenue windfall from the LNG project. They also point to a need for the government to increase transparency efforts and begin managing the public’s expectations to ensure they do not derail government policies.
Our recommendations for avoiding the “presource curse”:
1 Adhere to the fiscal deficit limit of the East African Monetary Union. This still
allows for modest increases in spending and borrowing but also ensures that
Tanzania avoids a scenario where expectations of future resource revenues lead
to a build up of excessive debt.
2 Direct additional spending toward the development budget. Spending should
be directed toward the development budget to the extent that projects can be
identified that yield economic returns exceeding borrowing rates. This is in line
with the government’s recent commitments and the recurrent expenditure
growth limit.
3 Increase transparency efforts in budget management. This could include tasking
an independent body with overseeing improved disclosure of budgetary
information (particularly on borrowing) and assessing compliance with both
regional and national fiscal rules.
4 Manage public expectations about the likely impact of gas revenues. This would
reduce the likelihood of unrealistic expectations derailing government policies.
72 Lex Huurdeman, “Natural Gas: Fiscal Regime Challenges,” (presentation at the East African Community and International Monetary Fund Workshop on Fiscal Management of Oil and Natural Gas in East Africa, Arusha, Tanzania, 15 January 2014).
32
Uncertain Potential: Managing Tanzania’s Gas Revenues
Our recommendations for revising the Oil and Gas Revenues Management Act:
1 Use a different rule to limit recurrent expenditure growth. This rule should
not be anchored to annual GDP. Other options for rules limiting recurrent
expenditure growth include an absolute limit and anchoring it to a less volatile
GDP measure.
2 Revise the financing mechanism for TPDC. This mechanism should not be
anchored to GDP, as this is unlikely to result in TPDC receiving financing that is
appropriate to its objectives or spending capacity.
3 Revise the rule earmarking gas revenues for strategic development spending. This could include defining concrete priorities based on national development
objectives and ensuring that overall spending on them actually increases.
4 Make preparations for a consultative review on the rules for saving gas revenues. Though it may be too early to determine an optimal framework, the government
should consider a review in the next few years that aims to address the current
framework’s weaknesses.

33
Uncertain Potential: Managing Tanzania’s Gas Revenues
APPENDIX. BASELINE ASSUMPTIONS
The analysis in this brief is informed by an economic model with a 50-year horizon that we have developed to estimate potential government revenues from Tanzania’s natural gas sector and their impact on the public finances. However, like all models, the results depend crucially on the assumptions they are based on. Our specific project and fiscal assumptions are summarized in tables 7, 8 and 9 and discussed further below.
Assumption Source
Reserves (2p) 26.65 tcf Wood Mackenzie
Real hurdle rate 13 percent Wood Mackenzie
Final investment decision 2022 Company comments
Commencement of operations 2026 Authors’ assumption
Supply allocation
Domestic market ≤ 10 percent Block 2 PSA addendum
LNG plant ≥ 90 percent Authors’ assumption
Gas used up in LNG production 11 percent Standard Bank (for Moz.)
LNG plant trains
Number of trains 3 IMF
Capacity of each train 5 mmtpa IMF
Exploration capital expenditure $2,700 million IMF
Development capital expenditure
Offshore blocks $18,700 million IMF
Offshore pipelines $1,100 million IMF
LNG plant $15,000 million IMF
Operating expenditure
Offshore blocks $0.38/mmBtu ICF International (for Moz.)
Offshore pipelines $0.21/mmBtu Demierre et al. cost model
LNG plant $1.19/mmBtu Standard Bank (for Moz.)
Decommissioning cost
Percentage of capital expenditure 10 percent Authors’ assumption
Treatment for tax purposes As operating exp. Petroleum Act
Loan real interest rate 5 percent Authors’ assumption
Domestic pipeline tariff $0.40/mmBtu Company reports for onshore
LNG shipment cost $2/mmBtu World Bank
Gas price to domestic market $4/mmBtu Authors’ assumption
LNG price to overseas market Variable Authors’ assumption
Value chain segmentation Partially segmented Authors’ assumption
Upstream-LNG plant arrangement Tolling IMF
Offshore pipelines tariff (if fully segmented structure)
Real rate of return cap 8 percent IMF
Tariff amount $0.41/mmBtu Result from model
LNG plant tolling fee (if fully or partially segmented structure)
Real rate of return cap 8 percent IMF
Fee amount $3.78/mmBtu Result from model
Gas price to LNG plant (if transfer structure) LNG netback price Authors’ assumption
Table 7. Assumptions about the LNG project (in 2016 USD)

34
Uncertain Potential: Managing Tanzania’s Gas Revenues
Fiscal regime
Offshore blocks Block 2 PSA addendum Block 2 PSA addendum
Offshore pipelines (if fully segmented structure) General legislation IMF
LNG plant (if fully or partially segmented structure)
General legislation IMF
“Delivery point” for gas valuation for tax purposes Offshore pipelines exit Authors’ assumption
TPDC equity
Offshore blocks
Share 10 percent Block 2 PSA addendum
Type Carried-repaid through TPDC production share
IMF
Carried real interest rate 6.5 percent Authors’ assumption
Offshore pipelines (if fully segmented structure)
Share 12 percent IMF
Type Fully paid IMF
LNG plant (if fully or partially segmented structure)
Share 12 percent IMF
Type Fully paid IMF
Assumption Source
Reserves (2p) 0.88 tcf Wood Mackenzie
Commencement of operations 2004 Authors’ assumption
Supply allocation
Domestic market 100 percent Authors’ assumption
LNG plant 0 percent Authors’ assumption
Exploration capital expenditure $85 million Wood Mackenzie
Development capital expenditure $624 million Wood Mackenzie
Operating expenditure $0.40/mmBtu Wood Mackenzie
Decommissioning cost
Percentage of capital expenditure 10 percent Authors’ assumption
Treatment for tax purposes As operating exp. Petroleum Act
Loan real interest rate 6 percent Authors’ assumption
Domestic pipeline tariff $0.40/mmBtu Company reports
Gas price to domestic market $4/mmBtu Company reports
Fiscal regime MPSA 2008 Authors’ assumption
“Delivery point” for gas valuation for tax purposes Onshore blocks exit Authors’ assumption
TPDC equity
Share 20 percent Company reports
Type Carried-repaid through TPDC production share
Company reports
Carried real interest rate 6.5 percent Authors’ assumption
Table 8. Assumptions about the onshore blocks (in 2016 USD)

35
Uncertain Potential: Managing Tanzania’s Gas Revenues
Assumption Source
GDP in 2015/16 $45,127 million IMF
Annual non-gas GDP growth 5.5 percent IMF
Domestic inflation 5 percent Bank of Tanzania
Global inflation 2 percent Authors’ assumption
Govt. own revenue in 2015/16 $6,450 million IMF
Annual non-gas revenue growth 5.5 percent Authors’ assumption
Grants received in 2015/16 $230 million IMF
End of grants Upper middle income status
Authors’ assumption
Govt. primary expenditure in 2015/16 $7,548 million IMF
Annual primary expenditure growth 5.5 percent Authors’ assumption
Expenditure composition
Development expenditure 30 percent IMF
Recurrent expenditure 70 percent IMF
Govt. debt in 2015/16 $16,923 million IMF
Debt composition
External debt 75 percent Bank of Tanzania
Domestic debt 25 percent Bank of Tanzania
Govt. real interest rate for debt ≤ 40% of GDP 1.0 percent IMF
Govt. real interest rate for debt > 40% of GDP 4.5 percent Authors’ assumption
Real interest earned on oil and gas fund 2 percent Authors’ assumption
Reserves
The Ministry of Energy and Minerals (MEM) estimates that 57.27 tcf of gas has been discovered to date.73 Estimates of recoverable gas vary. MEM estimates a recovery factor of around 70 percent, equivalent to 40.09 tcf. However, this estimate includes reserves for which there are currently no development plans. It is possible that some of these reserves will be developed in the future, but we are relatively conservative and only consider reserves for which there are currently development plans. Our baseline uses Wood Mackenzie’s estimate of 2p (proved and probable) reserves.74
Block Name Operator Other partners
Offshore
Block 1 Shell (60.00 percent) Ophir Energy (20.00 percent), Pavilion Energy (20.00 percent)
Block 2 Statoil (65.00 percent) ExxonMobil (35.00 percent)
Block 4 Shell (60.00 percent) Ophir Energy (20.00 percent), Pavilion Energy (20.00 percent)
Onshore
Kiliwani North Aminex (51.75 percent)
RAK Gas (23.75 percent), Solo Oil (10.00 percent), Bounty Oil and Gas (9.50 percent), TPDC (5.00 percent)
Mnazi Bay Maurel & Prom (48.06 percent)
Wentworth Resources (31.94 percent), TPDC (20.00 percent)
Songo Orca Exploration Group Inc (80.00 percent)
TPDC (20.00 percent)
73 Ministry of Energy and Minerals, Energy Sector Quarterly Review, 18.74 Wood Mackenzie, Tanzania Upstream Summary, 17.75 Ibid., 11-12.
Table 9. Assumptions about the economy and public finances (in 2016 USD)
Table 10. Blocks with commercial (2p) reserves75
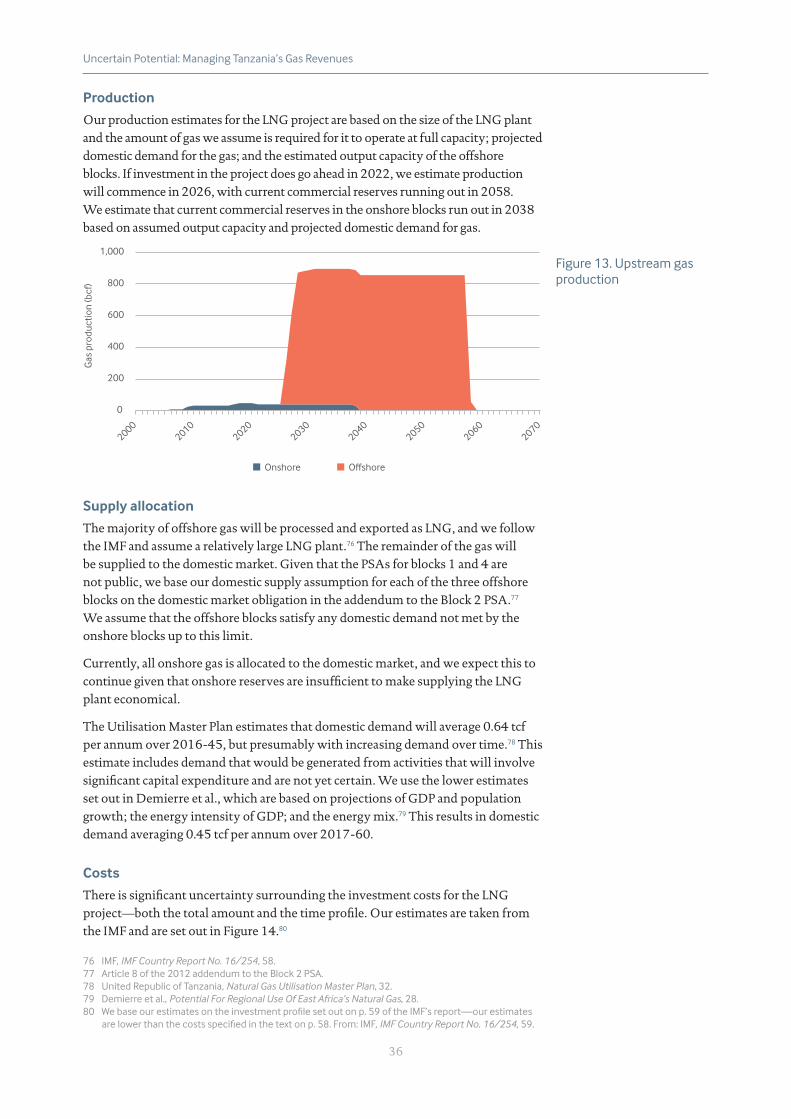
36
Uncertain Potential: Managing Tanzania’s Gas Revenues
Production
Our production estimates for the LNG project are based on the size of the LNG plant and the amount of gas we assume is required for it to operate at full capacity; projected domestic demand for the gas; and the estimated output capacity of the offshore blocks. If investment in the project does go ahead in 2022, we estimate production will commence in 2026, with current commercial reserves running out in 2058. We estimate that current commercial reserves in the onshore blocks run out in 2038 based on assumed output capacity and projected domestic demand for gas.
0
200
400
600
800
1,000
20002010
20202030
20402050
20602070
Gas
pro
duct
ion
(bcf
)
■ Onshore ■ Offshore
Supply allocation
The majority of offshore gas will be processed and exported as LNG, and we follow the IMF and assume a relatively large LNG plant.76 The remainder of the gas will be supplied to the domestic market. Given that the PSAs for blocks 1 and 4 are not public, we base our domestic supply assumption for each of the three offshore blocks on the domestic market obligation in the addendum to the Block 2 PSA.77 We assume that the offshore blocks satisfy any domestic demand not met by the onshore blocks up to this limit.
Currently, all onshore gas is allocated to the domestic market, and we expect this to continue given that onshore reserves are insufficient to make supplying the LNG plant economical.
The Utilisation Master Plan estimates that domestic demand will average 0.64 tcf per annum over 2016-45, but presumably with increasing demand over time.78 This estimate includes demand that would be generated from activities that will involve significant capital expenditure and are not yet certain. We use the lower estimates set out in Demierre et al., which are based on projections of GDP and population growth; the energy intensity of GDP; and the energy mix.79 This results in domestic demand averaging 0.45 tcf per annum over 2017-60.
Costs
There is significant uncertainty surrounding the investment costs for the LNG project—both the total amount and the time profile. Our estimates are taken from the IMF and are set out in Figure 14.80
76 IMF, IMF Country Report No. 16/254, 58.77 Article 8 of the 2012 addendum to the Block 2 PSA.78 United Republic of Tanzania, Natural Gas Utilisation Master Plan, 32.79 Demierre et al., Potential For Regional Use Of East Africa’s Natural Gas, 28. 80 We base our estimates on the investment profile set out on p. 59 of the IMF’s report—our estimates
are lower than the costs specified in the text on p. 58. From: IMF, IMF Country Report No. 16/254, 59.
Figure 13. Upstream gas production

37
Uncertain Potential: Managing Tanzania’s Gas Revenues
0
1,000
2,000
3,000
4,000
5,000
6,000
7,000
8,000
9,000
20102011
20122013
20142015
20162017
20182019
20202021
20222023
20242025
20262027
20282029
20302031
20322033
20342035
Cap
ital e
xpen
ditu
re ($
mill
ions
)
■ Offshore exploration ■ Offshore development ■ Offshore pipeline ■ LNG plant
We base our operating cost estimates for the offshore blocks and LNG plant on estimates for Mozambique (given that they are publically available) and adjust them upward in line with the World Bank’s assessment that Tanzanian costs will be 25 percent higher due to the smaller field size.81 We estimate the operating cost for the offshore pipelines using the transmission cost model in Demierre et al.82
Given investment in the current onshore projects is almost complete, there is more certainty around these costs. Our estimate is based on Wood Mackenzie and company data. We also base our operating cost estimates for the onshore blocks on Wood Mackenzie data.83
Sale prices
The target markets for Tanzanian LNG exports are expected to be in Asia, for which Japanese prices are a reliable metric. Given the inherent unpredictability, we do not assume a LNG price in our baseline. Instead, we look at what a range of prices are likely to mean for the investment decision and government revenues.
In the absence of gas imports and exports, and with the majority of gas being purchased by the government at a set price, there is currently little correlation between global price dynamics and the price of gas sold to the domestic market in Tanzania. In 2016, the government purchased 86 percent of the onshore gas produced, with the remainder sold directly to the private sector at a higher price.84 We assume that this arrangement will continue for the onshore operators and a similar allocation will exist for the offshore operators. Based on historical prices, we expect the average price for the onshore operators to be approximately $4 per mmBtu in the coming years. Offshore operators may be unwilling to accept a lower price than the onshore operators, but higher prices may be difficult for the government and private sector consumers to meet. We therefore assume that the offshore operators will receive the same price for domestic sales.
81 ICF International. The Future of Natural Gas in Mozambique: Towards a Gas Master Plan (2012), 22; Standard Bank, Mozambique LNG: Macroeconomic Study, 52.
82 Demierre et al., Potential for Regional Use of East Africa’s Natural Gas, 23.83 Wood Mackenzie, Tanzania Upstream Summary, 18-23.84 Company annual reports for 2016.
Figure 14. Exploration and development costs for the LNG project
38
Uncertain Potential: Managing Tanzania’s Gas Revenues
Transport costs
Our estimate of shipment costs for transporting LNG from the LNG plant to Asian markets is at the lower end of the range of $2–$3 per mmBtu assumed by the IMF. As the International Gas Union notes, shipping costs have fallen considerably in recent years and are not expected to recover in the foreseeable future.85
The planned location for the LNG plant is relatively close to the existing pipeline network that supplies the domestic market. Gas arriving from the offshore blocks should be able to be transferred to this network with minimal additional cost. On this basis, we assume that the tariff for distributing gas to the domestic market from the onshore blocks and from the exit point of the offshore pipelines is the same. Our assumed tariff of $0.4 per mmBtu was the weighted average of distribution costs for onshore operators in 2015.86
Segmentation of the LNG project value chain
We assume a partially segmented value chain, as we believe that the government and companies are unlikely to agree to either an integrated or fully segmented structure. The Petroleum Act 2015 stipulates that costs incurred from processing and liquefaction activities cannot be recovered from revenues generated by the offshore blocks, presumably prohibiting use of an integrated structure.87,88 Full segmentation also seems unlikely. The offshore pipelines are expected to serve individual blocks and not be made available to other blocks. A fully segmented structure would therefore entail additional regulatory and commercial complexity without adding much value for either the government or companies.
There will be market transactions between the upstream and midstream in a fully or partially segmented structure. The type of transaction will depend on the arrangement that these entities have. One of two possible arrangements is likely. The first is an owner-buyer arrangement, in which ownership of the gas is transferred along the value chain (e.g., the upstream operators sell their gas to the LNG plant operators who sell it overseas). The second is a tolling arrangement, in which the upstream operators retain ownership of the gas until it is sold in the domestic or export market, and pay a service fee to the LNG plant and any other operators in the chain. We follow the IMF in assuming that the upstream will have a tolling arrangement with the LNG plant.
The fiscal regime
The segmentation of the LNG project will determine whether it will operate under one or more fiscal regimes. If the project has an integrated structure, we expect the fiscal regimes in the PSAs to be applied to the whole project (although this would require some revision of the individual PSA regimes). If the project has a fully or partially segmented structure, we expect the government to continue to levy the PSA fiscal regimes on the upstream, and to levy separate fiscal regimes on any midstream entities.
Because the government and companies have not disclosed the PSAs, we base our baseline fiscal terms on the contents of the leaked addendum to the Block 2 PSA, government statements in 2014, and an assumption that the terms approximate the
85 IMF, IMF Country Report No. 16/254, 49; IGU, World LNG Report 2016, 34-44.86 Company annual reports for 2016.87 Section 117 of the Petroleum Act 2015.88 The addendum to the Block 2 PSA indicates its contractor has sole discretion to select the structure
it operates under, but we understand that the block 1 and 4 PSAs do not have this provision and it is expected that the different blocks will operate under the same structure.
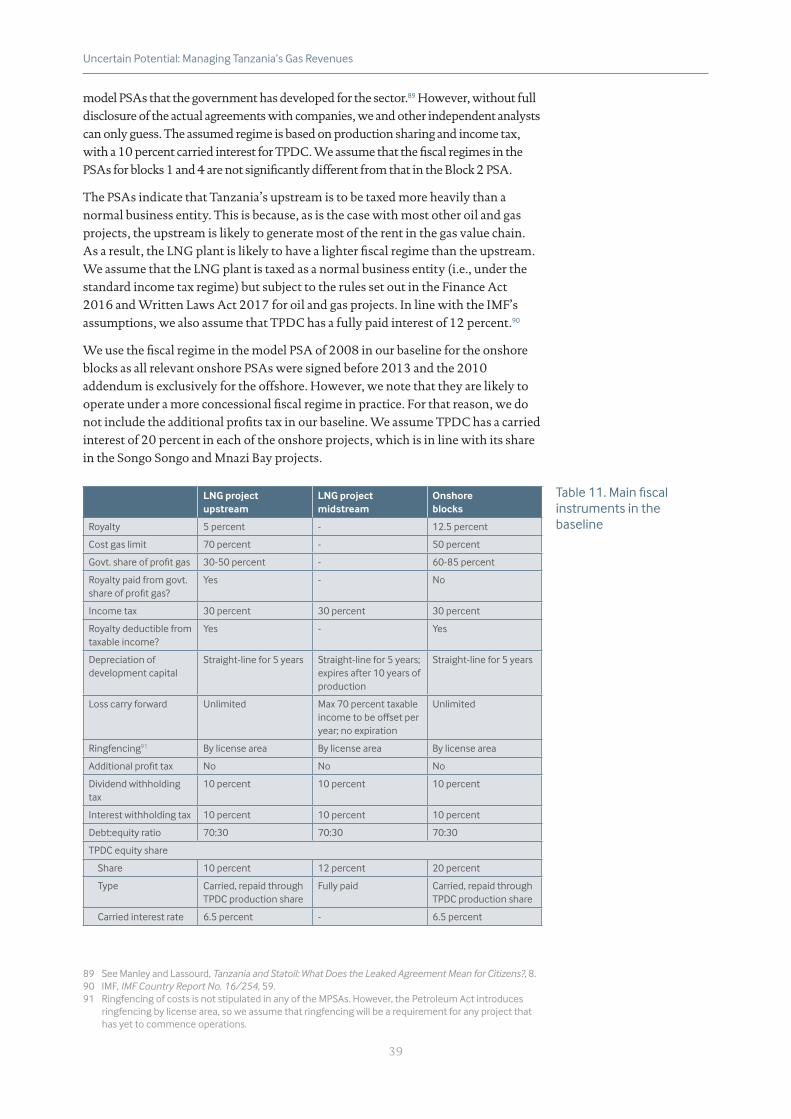
39
Uncertain Potential: Managing Tanzania’s Gas Revenues
model PSAs that the government has developed for the sector.89 However, without full disclosure of the actual agreements with companies, we and other independent analysts can only guess. The assumed regime is based on production sharing and income tax, with a 10 percent carried interest for TPDC. We assume that the fiscal regimes in the PSAs for blocks 1 and 4 are not significantly different from that in the Block 2 PSA.
The PSAs indicate that Tanzania’s upstream is to be taxed more heavily than a normal business entity. This is because, as is the case with most other oil and gas projects, the upstream is likely to generate most of the rent in the gas value chain. As a result, the LNG plant is likely to have a lighter fiscal regime than the upstream. We assume that the LNG plant is taxed as a normal business entity (i.e., under the standard income tax regime) but subject to the rules set out in the Finance Act 2016 and Written Laws Act 2017 for oil and gas projects. In line with the IMF’s assumptions, we also assume that TPDC has a fully paid interest of 12 percent.90
We use the fiscal regime in the model PSA of 2008 in our baseline for the onshore blocks as all relevant onshore PSAs were signed before 2013 and the 2010 addendum is exclusively for the offshore. However, we note that they are likely to operate under a more concessional fiscal regime in practice. For that reason, we do not include the additional profits tax in our baseline. We assume TPDC has a carried interest of 20 percent in each of the onshore projects, which is in line with its share in the Songo Songo and Mnazi Bay projects.
LNG project upstream
LNG project midstream
Onshore blocks
Royalty 5 percent - 12.5 percent
Cost gas limit 70 percent - 50 percent
Govt. share of profit gas 30-50 percent - 60-85 percent
Royalty paid from govt. share of profit gas?
Yes - No
Income tax 30 percent 30 percent 30 percent
Royalty deductible from taxable income?
Yes - Yes
Depreciation of development capital
Straight-line for 5 years Straight-line for 5 years; expires after 10 years of production
Straight-line for 5 years
Loss carry forward Unlimited Max 70 percent taxable income to be offset per year; no expiration
Unlimited
Ringfencing91 By license area By license area By license area
Additional profit tax No No No
Dividend withholding tax
10 percent 10 percent 10 percent
Interest withholding tax 10 percent 10 percent 10 percent
Debt:equity ratio 70:30 70:30 70:30
TPDC equity share
Share 10 percent 12 percent 20 percent
Type Carried, repaid through TPDC production share
Fully paid Carried, repaid through TPDC production share
Carried interest rate 6.5 percent - 6.5 percent
89 See Manley and Lassourd, Tanzania and Statoil: What Does the Leaked Agreement Mean for Citizens?, 8.90 IMF, IMF Country Report No. 16/254, 59.91 Ringfencing of costs is not stipulated in any of the MPSAs. However, the Petroleum Act introduces
ringfencing by license area, so we assume that ringfencing will be a requirement for any project that has yet to commence operations.
Table 11. Main fiscal instruments in the baseline

40
Uncertain Potential: Managing Tanzania’s Gas Revenues
Pricing between the LNG project entities
In a partially segmented structure with a tolling arrangement, companies will have an incentive to set a high tolling fee. Tolling fees are generally regulated either in the form of a ceiling on the rate of return that can be earned by the LNG plant or a ceiling on the tolling fee itself. To regulate the rate of return, the tolling fee is set at a level that allows the LNG plant to earn a specified rate of return but no more. The fee can then be adjusted during the project lifetime to ensure that this rate of return is maintained. To regulate the tolling fee itself, the tolling fee is set at a certain level and then adjusted at agreed intervals to take into account the rate of inflation (and changes to any other predetermined factors). We follow the IMF in assuming that the tolling fee in Tanzania’s LNG project will be regulated through capping the LNG plant’s rate of return at 8 percent.92
LNG project hurdle rate
Our assumed hurdle rate of return of 13 percent (in real terms) is based on the latest Wood Mackenzie survey of hurdle rates used for LNG projects across the globe. This survey finds that the most common hurdle rate used for LNG projects is 15 percent. While not specified, we assume this rate is in nominal terms, given that other Wood Mackenzie reports quote hurdle rates in nominal terms. We assume long-term global inflation of 2 percent so adjust it to get a real hurdle rate of 13 percent.93
The economy and public finances
Given that we examine the impact of potential gas revenue on public finances, assumptions about the performance of the wider economy and management of public finances are also important. Our baseline for the wider economy and public finances starts with actual data from 2015/16 (treated here as the calendar year of 2016), which we take from the latest budget and IMF review of its Policy Support Instrument.94 Our analysis covers a long-term, 50-year horizon, so we overlook short-term fluctuations and focus instead on the trends in key variables. Trend estimates are predominantly based on historical data.
We base our assumption of non-gas GDP growth of 5.5 percent a year (in real terms) on the average growth rate of EAC members over the last 20 years. However, we do take into consideration that economic growth is likely to be slightly faster over the next few years, with the IMF assuming growth of 6.5 percent in the medium term.95
We estimate gas GDP from the bottom-up based on the value added per unit of gas produced. This is derived as the difference between the realized price and the cost of imported goods and capital. Given the slack in the economy, we assume that domestic inputs would not have been produced if not demanded by the gas sector, and we therefore assume they generate additional GDP.96
92 IMF, IMF Country Report No. 16/254, 59.93 Wood Mackenzie, 1st ‘State of the Upstream Industry’ survey, 7.94 Ministry of Finance and Planning, Budget Speech 2017 (2017); IMF, IMF Country Report No. 17/180.95 The IMF’s estimate is for total GDP growth (i.e. including gas), but the distinction between the two
measures is of little importance in the medium term given limited gas production during this period. From: IMF, IMF Country Report No. 16/253, 4.
96 The gas sector will have an additional impact on GDP beyond domestic value addition and the rents it generates. Improved power generation capacity could facilitate greater industrialisation and economic diversification. Concurrently, a booming gas sector might divert resources from other sectors, undermining their competitiveness. Neither of these effects are modelled.

41
Uncertain Potential: Managing Tanzania’s Gas Revenues
We assume that non-gas, non-grant revenue will grow in line with the rest of the non-gas economy. On the one hand, the revenue to GDP ratio is rather low and would be expected to increase on a sustainable development path, but on the other hand, empirical evidence suggests that increases in resource revenues have an adverse effect on mobilizing other domestic revenue.97 Grants are expected to decline in the future—we model a linear decrease in grants down to zero as GDP per capita reaches upper middle income status.
We also assume primary expenditure growth follows economic growth and stays fixed as a percentage of GDP. However, once the fiscal rules are applied, we model expenditure only growing to the extent that it does not break any of the rules. Our assumption that recurrent expenditure will comprise 70 percent of expenditure and development expenditure the remaining 30 percent is based on the historical trend. While the government has recently committed to increasing development expenditure to 40 percent of the budget, we assume the composition will return to its historical average in the long term.98
We assume that all current debt can be renewed at concessional rates, given that the vast majority of it is either concessional or borrowed domestically. The assumed concessional rate of 1 percent (in real terms) is based on the historical average reported by the IMF.99 We assume any debt beyond 40 percent of the previous year’s GDP is borrowed at external commercial rates. The assumed interest rate for this debt of 4.5 percent (in real terms) is in line with the average Eurobond rates across Africa.100
97 Ernesto Crivelli and Sanjeev Gupta. Resource Blessing, Resource Curse? Domestic Revenue Effort in Resource-Rich Countries (IMF, 2014).
98 Ministry of Finance and Planning, Budget Speech 2016, 10.99 IMF, IMF Country Report No. 15/181, 13; IMF, IMF Country Report No. 16/253, 11.100 Trevor Hambayi. Africa Eurobond Financing A Ticking 35 Billion Debt Bust (2016), 3.

42
Uncertain Potential: Managing Tanzania’s Gas Revenues
REFERENCES
ADE. Public Expenditure and Financial Accountability (PEFA) Assessment – Mainland Tanzania (Central Government). 2013. Accessed 15 May 2017. http://www.mof.go.tz/mofdocs/PFMRP/PEFA/29_01_2014/2013%20Tanzania%20Central%20Government%20PEFA%20Report.pdf
African Development Bank and Bill and Melinda Gates Foundation. Timing and Magnitude of New Natural Resource Revenues in Africa. 2015. Accessed 15 May 2017. https://www.afdb.org/fileadmin/uploads/afdb/Documents/Publications/Timing_and_magnitude_of_new_natural_resource_revenues_in_Africa.pdf
Arezki, Rabah, Valerie A. Ramey and Liugang Sheng. News Shocks in Open Economies: Evidence from Giant Oil Discoveries. International Monetary Fund, 2015. Accessed 15 May 2017. https://www.imf.org/external/pubs/ft/wp/2015/wp15209.pdf
Bauer, Andrew, Malan Rietveld and Perrine Toledano. Managing the Public Trust: How to Make Natural Resource Funds Work for Citizens. Natural Resource Governance and Columbia Center on Sustainable Investment, 2014. Accessed 15 May 2017. https://www.resourcegovernance.org/sites/default/files/NRF_Complete_Report_EN.pdf
Bassanetti, Antonio, Carlo Cottarelli and Andrea Presbitero. Lost and Found: Market Access and Public Debt Dynamics. International Monetary Fund, 2016. Accessed 15 May 2017. https://www.imf.org/~/media/Websites/IMF/imported-full-text-pdf/external/pubs/ft/wp/2016/_wp16253.ashx
Baunsgaard, Thomas, Mauricio Villafuerte, Marcos Poplawski-Ribeiro and Christine Richmond. Fiscal Frameworks for Resource Rich Developing Countries. International Monetary Fund, 2016. Accessed 15 May 2017. https://www.imf.org/external/pubs/ft/sdn/2012/sdn1204.pdf
BOAS & Associates. Final Report of the Tanzania Extractive Industries Transparency Initiative for the period July 1 2014 to June 30 2015. 2017. Accessed 15 May 2017. http://www.teiti.or.tz/wp-content/uploads/2017/06/FINAL-TEITI-2014-15-Report.pdf
Collier, Paul. Under Pressure. IMF, 2013. Accessed 15 May 2017. http://www.imf.org/external/pubs/ft/fandd/2013/12/collier.htm
Collier, Paul. “The Institutional and Psychological Foundations of Natural Resource Policies.” Journal of Development Studies 53 (2) (2017): 217-228. Accessed 15 July 2017. doi.org/10.1080/00220388.2016.1160067.
Crivelli, Ernesto and Sanjeev Gupta. Resource Blessing, Resource Curse? Domestic Revenue Effort in Resource-Rich Countries. IMF, 2014. Accessed 15 May 2017. https://www.imf.org/~/media/Websites/IMF/imported-full-text-pdf/external/pubs/ft/wp/2014/_wp1405.ashx
Cust, James, and David Mihalyi. Presource curse? Oil discoveries, elevated expectations and growth disappointments. World Bank, 2017. Accessed 15 July 2017. http://documents.worldbank.org/curated/en/517431499697641884/pdf/WPS8140.pdf
Cust, James, David Manley, and Giorgia Cecchinato. “Unburnable Wealth of Nations,” Finance and Development. 54(1) (2017): 46-49. Accessed 15 May 2017. http://www.imf.org/external/pubs/ft/fandd/2017/03/pdf/cust.pdf
Dabla-Norris, Era, Jim Brumby, Annette Kyobe, Zac Mills and Chris Papageorgiou. Investing in Public Investment: An Index of Public Investment Efficiency. IMF, 2011. Accessed 15 May 2017. https://www.imf.org/external/pubs/ft/wp/2011/wp1137.pdf
Demierre, Jonathan, Morgan Bazilian, Jonathan Carbajal, Shaky Sherpa, and Vijay Modi. Potential for Regional Use of East Africa’s Natural Gas. Sustainable Development Solutions Network, 2014. Accessed 15 May 2017. http://energypolicy.columbia.edu/sites/default/files/energy/Potential-for-Regional-Use-of-East-Africas-Natural-Gas-SEL-SDSN.pdf
East African Community. Protocol on the Establishment of the East African Community Monetary Union. 2013. Accessed 15 May 2017. http://www.eac.int/sites/default/files/docs/protocol_eac_monetary-union.pdf
The Economist. “Sovereign-wealth funds catch on in Africa.” The Economist, 16 March 2017. Accessed 15 May 2017. http://www.economist.com/news/finance-and-economics/21718893-countries-disagree-about-how-use-them-sovereign-wealth-funds-catch

43
Uncertain Potential: Managing Tanzania’s Gas Revenues
Evans, Mark. In Ghana, Fiscal Responsibility Remains Elusive Even as Oil Flows. Natural Resource Governance Institute, 2015. Accessed 15 May 2017. http://www.resourcegovernance.org/blog/ghana-fiscal-responsibility-remains-elusive-even-oil-flows
EY. Spotlight on oil and gas megaprojects. 2014. Accessed 15 May 2017. http://www.ey.com/Publication/vwLUAssets/EY-spotlight-on-oil-and-gas-megaprojects/$FILE/EY-spotlight-on-oil-and-gas-megaprojects.pdf
Ghana Ministry of Finance. 2016 Annual Report on the Petroleum Funds. 2016. Accessed 15 May 2017. http://www.mofep.gov.gh/sites/default/files/reports/petroleum/2016%20Annual%20report%20on%20the%20Petroleum%20Funds.pdf
Hambayi, Trevor. Africa Eurobond Financing A Ticking 35 Billion Debt Bust. 2016. Accessed 15 May 2017. https://www.academia.edu/24841059/Africa_Eurobond_Financing_A_Ticking_35_Billion_Debt_Bust
Houreld, Katherine. “Final Investment Decision On Tanzania LNG Plant Still 5 Yrs Away – Statoil.” Reuters, 16 November 2016. Accessed 15 May 2017. http://www.reuters.com/article/tanzania-gas-idUSL4N1DH4D6.
Hubert, Don and Rob Pitman. Past the Tipping Point? Contract disclosure within EITI. Natural Resource Governance Institute, 2017. Accessed 15 May 2017. http://www.resourcegovernance.org/sites/default/files/documents/past-the-tipping-point-contract-disclosure-within-eiti-web.pdf
Huurdeman, Lex. “Natural Gas: Fiscal Regime Challenges.” Presentation at the East African Community and International Monetary Fund Workshop on Fiscal Management of Oil and Natural Gas in East Africa, Arusha, Tanzania, 15 January 2014. https://www.imf.org/external/np/seminars/eng/2014/eac/pdf/031514.pdf
ICF International. The Future of Natural Gas in Mozambique: Towards a Gas Master Plan. 2012. Accessed 15 May 2017. http://www.eisourcebook.org/cms/January%202016/Mozambique%20Towards%20a%20Natural%20Gas%20Master%20Plan.pdf
International Gas Union. IGU World LNG Report 2016. 2016. Accessed 15 May 2017. www.igu.org/download/file/fid/2123
International Monetary Fund. IMF Country Report No. 14/121. 2014. Accessed 15 May 2017. https://www.imf.org/external/pubs/ft/scr/2014/cr14121.pdf
International Monetary Fund. IMF Country Report No. 16/253 – Debt Sustainability Analysis. 2016. Accessed 15 May 2017. https://www.imf.org/external/pubs/ft/dsa/pdf/2016/dsacr16253.pdf
International Monetary Fund. IMF Country Report No. 16/254. 2016. Accessed 15 May 2017. https://www.imf.org/external/pubs/ft/scr/2016/cr16254.pdf
International Monetary Fund. IMF Country Report No. 17/180. 2017. Accessed 15 July 2017. http://www.imf.org/~/media/Files/Publications/CR/2017/cr17180.ashx
International Monetary Fund. “World Economic Outlook Database.” Last modified April 2017. http://www.imf.org/external/pubs/ft/weo/2017/01/weodata/index.aspx.
International Budget Partnership. Open Budget Survey 2015 – Tanzania. 2016. Accessed 15 May 2017. http://www.internationalbudget.org/wp-content/uploads/OBS2015-CS-Tanzania-English.pdf
Khan, Tehmina, Trang Nguyen, Franziska Ohnsorge and Richard Schodde. From Commodity Discovery to Production. World Bank, 2016. Accessed 15 May 2017. http://documents.worldbank.org/curated/en/573121473944783883/pdf/WPS7823.pdf
Manley, David and Thomas Lassourd. Tanzania and Statoil: What Does the Leaked Agreement Mean for Citizens? Natural Resource Governance Institute, 2014. Accessed 15 May 2017. http://www.resourcegovernance.org/sites/default/files/Tanzania_Statoil_20140808.pdf
Ministry of Energy and Minerals. Energy Sector Quarterly Review, Ed. No. 4. 2016. Accessed 15 May 2017. https://mem.go.tz/wp-content/uploads/2016/09/28.09.2016Final-ESQD-4TH-QUARTER-APRIL-TO-JUNE-2016-final-draft.pdf
Mihalyi, David. Debt Sustainability Challenges in Resource Rich Countries. Natural Resource Governance Institute, 2016. Accessed 15 May 2017. http://www.resourcegovernance.org/blog/debt-sustainability-challenges-resource-rich-developing-countries
Ministry of Finance and Planning. Budget Speech 2016. 2016. Accessed 15 May 2017. http://www.mof.go.tz/mofdocs/msemaji/BUDGET SPEECH FINAL 2016.pdf

The Natural Resource Governance Institute, an independent, non-profit organization, helps people to realize the benefits of their countries’ oil, gas and mineral wealth through applied research, and innovative approaches to capacity development, technical advice and advocacy. Learn more at www.resourcegovernance.org
Ministry of Finance and Planning. Budget Speech 2017. 2017. Accessed 15 July 2017. http://www.mof.go.tz/mofdocs/msemaji/BUDGET%20SPEECH%202017_2018.pdf
National Bureau of Statistics. National Accounts of Tanzania Mainland 2007-2015. 2016. Accessed 15 May 2017. http://www.nbs.go.tz/nbs/takwimu/na/National_Accounts_of_Tanzania_Mainland_Publication_2015.pdf
Ng’wanakilala, Fumbuka. “Tanzania hopes for LNG plant agreement with oil majors by 2018.” Reuters, 24 January 2017. Accessed 15 May 2017. http://www.reuters.com/article/us-tanzania-gas-idUSKBN1581F4.
Ng’wanakilala, Fumbuka. “Tanzania Plans Gas Pipeline to Uganda.” Reuters, 4 May 2016. Accessed 15 May 2017. http://af.reuters.com/article/africaTech/idAFL5N1816VF.
Reuters. “Gas-rich Tanzania to start power exports in 2015.” Reuters, 25 August 2013. Accessed 15 May 2017. http://www.reuters.com/article/tanzania-gas-idUSL6N0GQ0JR20130825
Scurfield, Thomas and David Manley. Negotiating Tanzania’s gas future. Natural Resource Governance Institute, 2017. (Forthcoming).
Standard Bank. Mozambique LNG: Macroeconomic Study. 2014. Accessed 15 May 2017. http://www.mzlng.com/content/documents/MZLNG/LNG/Development/2014-MozambiqueLNGReport-ENG.pdf
Twaweza. Great Expectations – Citizens’ views about the gas sector. 2015. Accessed 15 May 2017. http://www.twaweza.org/uploads/files/NaturalResources-FINAL-EN.pdf
UN. “World Population Prospects”. Accessed 15 May 2017. https://esa.un.org/unpd/wpp/Download/Standard/Population/
URT. Final Draft Natural Gas Utilisation Master Plan 2016-45. 2016. Accessed 15 May 2017. https://mem.go.tz/wp-content/uploads/2016/09/21.09.2016NGUMP-DRAFT-FINAL-REPORT-May-2016-CLEAN.pdf
URT. National Five Year Development Plan 2016/17-2020/21. 2016. Accessed 15 May 2017. http://www.mof.go.tz/mofdocs/msemaji/Five%202016_17_2020_21.pdf
Wood Mackenzie. Tanzania Upstream Summary September 2016. 2016.
Wood Mackenzie. 1st ‘State of the Upstream Industry’ survey. 2017.
World Bank. Tanzania Mainland Poverty Assessment: Executive Summary. 2015. Accessed 15 May 2017. http://documents.worldbank.org/curated/en/679851467999966244/pdf/AUS6819-WP-v1-P148501-PUBLIC-Tanzania-summary-15Apr15-Box391437B.pdf
World Bank. World Bank Commodities Price Forecast. 2017. Accessed 15 May 2017. http://pubdocs.worldbank.org/en/662641493046964412/CMO-April-2017-Forecasts.pdf
The authors wish to thank Philip Daniel and the African Development Bank’s Pietro Toigo and Charles Nyirahuku for reviewing this document. They also thank Lee Robinson for making a significant contribution to the development of the financial model that informed the brief.