Embed Size (px)
Citation preview

MEETING OF THE BOARD OF GOVERNORS Committee on Educational Planning, Policies, and Programs
May 26, 2021 at 2:45 p.m. Via Videoconference and PBS North Carolina Live Stream University of North Carolina System Office Center for School Leadership Development, Room 128 Chapel Hill, North Carolina
AGENDA
OPEN SESSION A-1. Approval of the Open and Closed Session Minutes of April 21, 2021 ................................. Temple Sloan
A-2. Academic Affairs Update ........................................................................................... Kimberly van Noort
A-3. Faculty Teaching Workload Report ............................................................................ Kimberly van Noort
A-4. UNC System Academic Program Actions ............................................................................. David English a. Degree Program Establishmentsb. Degree Program Delegated Actions
A-5. Licensure Program Approvals .......................................................................................... Daniel Harrison
A-6. Section 700.1.1 of the UNC Policy Manual–Waiver of the SAT/ACT Requirement ... Kimberly van Noort
A-7. North Carolina State University Early College High School Off-Campus Waiver ....... Kimberly van Noort
A-8. Adjourn

MEETING OF THE BOARD OF GOVERNORS
Committee on Educational Planning, Policies, and Programs May 26, 2021
AGENDA ITEM
A-3. Faculty Teaching Workload Report ................................................................................. Kimberly van Noort Situation: The Board of Governors annually reviews the report on faculty instructional workload,
in compliance with Section 400.3.4 of the UNC Policy Manual, Monitoring Faculty Teaching Workloads.
Background: Section 400.3.4 of the UNC Policy Manual was originally adopted in 1996, and most
recently amended in 2013. The policy requires that “…all campuses and constituent institutions shall implement annual faculty performance evaluation policies that measure and reward all aspects of faculty workload, separately and in combination, consistent with the instructional mission.” The Board’s policy identifies minimum sections-per-instructional full-time equivalent ratios.
The data come from the most recent available National Study of Instructional Costs and
Productivity (the “Delaware Study”), to which UNC System institutions report each year. The metrics returned from the Delaware Study include course sections per FTE and student credit hours per FTE, both limited to organized course sections (lectures, labs, seminars). Delaware Study data are used not only for faculty workload monitoring but also feed into disciplinary weights in the enrollment funding model.
Assessment: Board policy sets minimum standard teaching loads, which vary based on institutions’
Carnegie classifications. The report first provides charts that examine teaching loads for tenured/tenure-track faculty aggregated by Carnegie Classification. Each UNC System Carnegie Classification grouping is compared to national data as provided by the Delaware Study.
Included in the appendices are 10 years of historical data for each individual UNC System institution, broken out for just tenured/tenure-track faculty and then for all faculty. For 2018, the most recent year for which data is available, all UNC System Carnegie Classification groupings meet or exceed their teaching load minimums.
Action: This item requires a vote by the committee, with a vote by the full Board of Governors
through the consent agenda.

2020 Faculty Teaching Workload Report
May 27, 2021
University of North Carolina System Chapel Hill, North Carolina

1
Introduction
Faculty work is complex, with all faculty engaging in some combination of research, teaching, and service. As the expectations for this mixture vary across field, faculty type, and institutional type, Section 400.3.4 of the UNC Policy Monitoring Faculty Teaching Workloads states that “all campuses and constituent institutions shall implement annual faculty performance evaluation policies that measure and reward all aspects of faculty workload, separately and in combination, consistent with the instructional mission.” The policy addresses faculty teaching workload policies, standardized data collection systems, and campus-based processes for monitoring faculty teaching workload. The full policy can be found in Appendix A.
In 2011, the UNC Board of Governors (Board) Committee on Educational Planning, Policies, and Programs appointed five Board members, two university chancellors, and two other senior advisors to the Faculty Workload Advisory Group to review Section 400.3.4 of the UNC Policy Manual. In spring 2012, the Advisory Group presented their findings and recommendations to the full committee. Based on the findings and recommendations of the Advisory Group, the Board adopted an amended policy on faculty teaching workloads on January 11, 2013, which states:
All campuses and constituent institutions will develop and implement policies and procedures to monitor faculty teaching loads and to approve significant or sustained variations from expected minimums. Policies must include the criteria and approval process for reductions in institutional load attendant to increased administrative responsibilities, externally-funded research, including course buy-outs, and additional institutional and departmental service obligations. Given the complexity of faculty work activities, individual faculty teaching loads are best managed at the department and school level, and not the system or state level. However, to ensure meaningful comparisons of faculty teaching load over time and across peers, all campuses shall adopt a standard methodology for collecting data on teaching load. This standard is described below.
For reporting purposes the Board of Governors (Board) will annually review data from the National Study of Instructional Costs & Productivity (The Delaware Study) of teaching loads for full time equivalent faculty within the University. The Delaware Study provides comparable teaching data at the discipline level using the following faculty categories: regular tenure stream, other regular, supplemental and teaching assistants. Teaching load is derived by the number of organized class courses a faculty member is assigned in a given semester. Courses that are not conducted in regularly scheduled class meetings, such as “readings,” “special topics,” “problems” or “research” courses, including dissertation/thesis research, and “individual lesson” courses (typically in music and fine arts) are excluded from the Teaching Load calculation.
Per Board policy, standard annual teaching loads will be differentiated to accommodate the diverse missions of the individual campuses as articulated by Carnegie Classification. The following represent

2
the standard faculty teaching load measured by the average number of organized class courses taught per semester:
Research Universities - Very High Research Activity: 2 Research Universities - High Research Activity & Doctoral Granting: 2.5 Master’s Colleges & Universities - Large & Medium: 3 Baccalaureate Colleges - Arts & Sciences: 4 Baccalaureate Colleges - Diverse Fields: 4
A benefit of participation in the Delaware Study is that data are provided for all participating institutions by Carnegie Classification. This allows the results from UNC System constituent institutions to be benchmarked against peers by Carnegie Classification.1 This comparison provides a national snapshot of comparable institutions’ figures and helps to ground the results of System constituent institutions in a national context. Please note that this is not a representative sample of institutions and that both the number and specific institutions vary from year to year.
The following pages present the faculty teaching workload section averages for the category “Tenured Faculty,” contrasting the average sections taught at System constituent institutions with that of the same Carnegie Classification from the Delaware Study by only tenured or tenure-track faculty members. Appendix B1 and Appendix B2 present institutional level details for sections taught and student credit hours (SCHs) per FTE faculty for “Tenured Faculty.” Appendix B3 and Appendix B4 provide the same institutional level detail for the Delaware Category of “All Faculty.” 2
1In order to process all institutional data fully, the most recent data provided by the Delaware Study for UNC institutions and their peers are from fall 2018. 2All Faculty includes: Tenured/Tenure-Track Faculty, Other Regular Faculty, Supplemental Faculty, and Teaching Assistants.

3
UNC System Instructional Teaching Load: Research Universities Very High
Figure 1: Average Sections Per Semester per FTE1 Faculty, 2008 – 2018 Figure 2: Average SCHs Per Semester per FTE1 Faculty, 2008 – 2018
: UNC Group Mean : UNC Group Standard : UNC Group Mean : UNC Group Standard
x : Carnegie Mean – : Carnegie Median : Carnegie Interquartile Range (IQR) x : Carnegie Mean – : Carnegie Median : Carnegie Interquartile Range (IQR)
• UNC System constituent institutions in the Research Universities – Very High category: North Carolina State University and UNC-Chapel Hill.

4
UNC System Instructional Teaching Load: Research Universities High and Doctoral
Figure 1: Average Sections Per Semester per FTE1 Faculty, 2008 – 2018 Figure 2: Average SCHs Per Semester per FTE1 Faculty, 2008 – 2018
: UNC Group Mean : UNC Group Standard : UNC Group Mean : UNC Group Standard
x : Carnegie Mean – : Carnegie Median : Carnegie Interquartile Range (IQR) x : Carnegie Mean – : Carnegie Median : Carnegie Interquartile Range (IQR)
• UNC System constituent institutions in the Research Universities – High category: East Carolina University, North Carolina A&T
State University, UNC Charlotte, and UNC Greensboro: All Years. UNC Wilmington is included for 2018. • This group meets or exceeds the Board standard for sections taught per semester in 2008-12, 2014-15, and 2017-18.

5
UNC System Instructional Teaching Load: Master’s – All Levels
Figure 1: Average Sections Per Semester per FTE1 Faculty, 2008 – 2018 Figure 2: Average SCHs Per Semester per FTE1 Faculty, 2008 – 2018
: UNC Group Mean : UNC Group Standard : UNC Group Mean : UNC Group Standard
x : Carnegie Mean – : Carnegie Median : Carnegie Interquartile Range (IQR) x : Carnegie Mean – : Carnegie Median : Carnegie Interquartile Range (IQR)
• UNC System constituent institutions in the Master’s categories: Appalachian State University, Fayetteville State University, North Carolina Central University, UNC Pembroke, Western Carolina University, and Winston-Salem State University: All Years. Elizabeth City State University was included 2014-2017. UNC Wilmington was included from 2008-2017.
• This group meets or exceeds the Board standard for sections taught per semester in all years.

6
UNC System Instructional Teaching Load: Baccalaureate – Arts & Sciences and Diverse Fields
Figure 1: Average Sections Per Semester per FTE1 Faculty, 2008 – 2018 Figure 2: Average SCHs Per Semester per FTE1 Faculty, 2008 – 2018
: UNC Group Mean : UNC Group Standard : UNC Group Mean : UNC Group Standard
x : Carnegie Mean – : Carnegie Median : Carnegie Interquartile Range (IQR) x : Carnegie Mean – : Carnegie Median : Carnegie Interquartile Range (IQR)
• UNC System constituent institutions in the Baccalaureate Colleges category: UNC Asheville: All years. Elizabeth City State University was included for 2008 – 2013 and 2018.
• This group exceeds the Board standard for sections taught per semester in 2009 – 2014, and again in 2018.

7
Appendix A The UNC Policy Manual
400.3.4* Adopted 04/12/96
Amended 03/07/01 Amended 01/11/13
Monitoring Faculty Teaching Workloads
Introduction:
As a result of findings and recommendations of the 1995 Legislative Study Commission on the Status of Education at the University of North Carolina, the 1995 Session of the General Assembly enacted House Bill 229, Section 15.9 entitled “Rewarding Faculty Teaching.” The bill requires;
The Board of Governors shall design and implement a system to monitor faculty teaching workloads on the campuses of the constituent institutions.
The Board of Governors shall direct constituent institutions that teaching be given primary consideration in making faculty personnel decisions regarding tenure, teaching, and promotional decisions for those positions for which teaching is the primary responsibility. The Board shall assure itself that personnel policies reflect this direction.
The Board of Governors shall develop a plan for rewarding faculty who teach more than a standard academic load.
The Board of Governors shall review the procedures used by the constituent institutions to screen and employ graduate teaching assistants. The Board shall direct that adequate procedures be used by each constituent institution to ensure that all graduate teaching assistants have the ability to communicate and teach effectively in the classroom.
The Board of Governors shall report on the implementation of this section to the Joint Legislative Education Oversight Committee by April 15, 1996.
System to Monitor Faculty Teaching Loads:
All campuses and constituent institutions will develop and implement policies and procedures to monitor faculty teaching loads and to approve significant or sustained variations from expected minimums. Policies must include the criteria and approval process for reductions in institutional load attendant to increased administrative responsibilities, externally-funded research, including course buy-outs, and additional institutional and departmental service obligations. Given the complexity of faculty work activities, individual faculty teaching loads are best managed at the department and school level, and not the system or state level. However, to ensure meaningful comparisons of faculty teaching load over time and across peers, all campuses shall adopt a standard methodology for collecting data on teaching load. This standard is described below.
For reporting purposes the Board of Governors will annually review data from the National Study of Instructional Costs & Productivity (The Delaware Study)1 of teaching loads for full time equivalent faculty within the University. The Delaware Study provides comparable teaching data at the discipline level using the following faculty categories: regular tenure stream, other regular, supplemental and teaching assistants. Teaching load is derived by the number of organized class courses a faculty member is assigned in a given semester. Courses that are not conducted in regularly scheduled class meetings, such as “readings,” “special topics,” “problems” or “research” courses, including dissertation/thesis research, and “individual lesson” courses (typically in music and fine arts) are excluded from the Teaching Load calculation.

8
Standard annual teaching loads will be differentiated to accommodate the diverse missions of the individual campuses. These differences will be captured by Carnegie Classification.2 Standard faculty teaching load measured by number of organized class courses a faculty member is assigned in a given academic year is the following:
• Research Universities I: 4
• Doctoral Universities I: 5
• Masters (Comprehensive) I: 6
• Baccalaureate (Liberal Arts) I: 8
• Baccalaureate (Liberal Arts) II: 8
Distinction between Teaching, Instructional, and Total Faculty Workload:
In addition to teaching load, as defined above, instructional workload also includes developing materials for a new course, developing courseware or other materials for technology-based instruction, supervising undergraduate research and masters theses and doctoral dissertations, directing students in co-curricular activities such as plays, preparing and equipping new laboratories, supervision of teaching assistants, and academic advising.
To ensure that course material delivered in the classroom is relevant, faculty perform scholarly activities such as research, scholarship, and creative expression. These activities may include writing articles, monographs, and grant proposals, editing a scholarly journal, preparing a juried art exhibit, directing a center or institute, or performing in a play, concert, or musical recital.
Faculty also engage in service activities that inform classroom teaching and student learning. These activities may include responses to requests for information, advice, and technical assistance as well as instruction offered directly through continuing education. Service includes training and technology transfer for business and industry, assistance to public schools and unit of government, and commentary and information for the press and other media. Service also includes time spent internal to the university which may include participation in faculty governance, serving on search committees for new faculty, and preparing for discipline accreditation visits.
In order to appropriately monitor and reward faculty teaching, evaluations must be placed in the context of total faculty workload. Therefore, all campuses and constituent institutions shall implement annual faculty performance evaluation policies that measure and reward all aspects of faculty workload, separately and in combination, consistent with the instructional mission.
Rewarding Teaching:
The board’s intent is that measures described in the previous section will lead to personnel policies and decisions that take due account of each faculty member’s contribution to the undergraduate teaching mission of the institution. The President and the board are concerned that faculty be rewarded both for the quantity and even more for the quality of teaching. Concerning quality, the board notes the enthusiastic support from campuses and the public for its teaching awards. It takes pride in the standard for teaching excellence that is set by award recipients.
All policies and procedures required under The UNC Policy 400.3.4 must be submitted by campuses and constituent institutions to General Administration and approved by the President.

9
*Supersedes and replaces the prior UNC Policy 400.3.4, “Monitoring Faculty Teaching Workloads” as this version was approved by the Board of Governors on January 11, 2013.
1The National Study of Instructional Costs & Productivity (“The Delaware Study”) is the acknowledged “tool of choice” for comparative analysis of faculty teaching loads, direct instructional cost, and separately budgeted scholarly activity, all at the level of the academic discipline. 2The Carnegie Classification™ is a framework for recognizing and describing institutional diversity in U.S. higher education. This framework has been widely used in the study of higher education, both as a way to represent and control for institutional differences, and also in the design of research studies to ensure adequate representation of sampled institutions, students, or faculty.
10
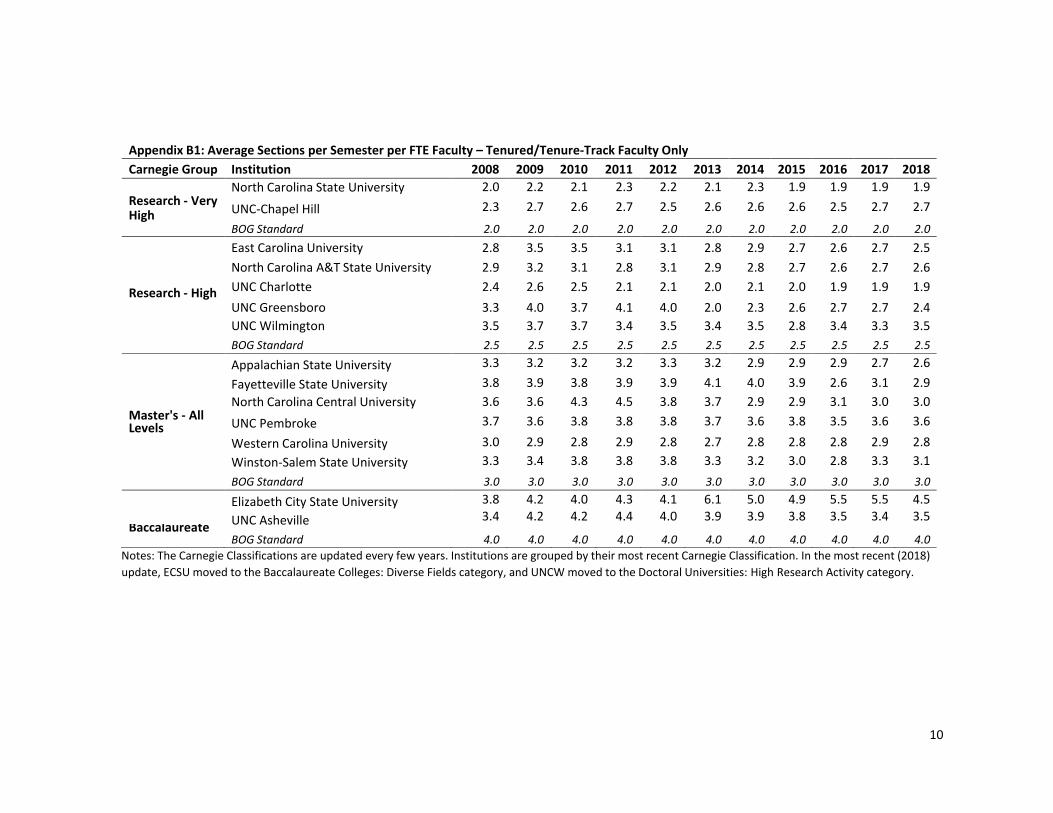
Appendix B1: Average Sections per Semester per FTE Faculty – Tenured/Tenure-Track Faculty Only Carnegie Group Institution 2008 2009 2010 2011 2012 2013 2014 2015 2016 2017 2018
North Carolina State University 2.0 2.2 2.1 2.3 2.2 2.1 2.3 1.9 1.9 1.9 1.9 Research - Very High UNC-Chapel Hill 2.3 2.7 2.6 2.7 2.5 2.6 2.6 2.6 2.5 2.7 2.7
BOG Standard 2.0 2.0 2.0 2.0 2.0 2.0 2.0 2.0 2.0 2.0 2.0 East Carolina University 2.8 3.5 3.5 3.1 3.1 2.8 2.9 2.7 2.6 2.7 2.5 North Carolina A&T State University 2.9 3.2 3.1 2.8 3.1 2.9 2.8 2.7 2.6 2.7 2.6
Research - High UNC Charlotte 2.4 2.6 2.5 2.1 2.1 2.0 2.1 2.0 1.9 1.9 1.9 UNC Greensboro 3.3 4.0 3.7 4.1 4.0 2.0 2.3 2.6 2.7 2.7 2.4 UNC Wilmington 3.5 3.7 3.7 3.4 3.5 3.4 3.5 2.8 3.4 3.3 3.5 BOG Standard 2.5 2.5 2.5 2.5 2.5 2.5 2.5 2.5 2.5 2.5 2.5 Appalachian State University 3.3 3.2 3.2 3.2 3.3 3.2 2.9 2.9 2.9 2.7 2.6 Fayetteville State University 3.8 3.9 3.8 3.9 3.9 4.1 4.0 3.9 2.6 3.1 2.9 North Carolina Central University 3.6 3.6 4.3 4.5 3.8 3.7 2.9 2.9 3.1 3.0 3.0
Master's - All Levels UNC Pembroke 3.7 3.6 3.8 3.8 3.8 3.7 3.6 3.8 3.5 3.6 3.6
Western Carolina University 3.0 2.9 2.8 2.9 2.8 2.7 2.8 2.8 2.8 2.9 2.8 Winston-Salem State University 3.3 3.4 3.8 3.8 3.8 3.3 3.2 3.0 2.8 3.3 3.1 BOG Standard 3.0 3.0 3.0 3.0 3.0 3.0 3.0 3.0 3.0 3.0 3.0 Elizabeth City State University 3.8 4.2 4.0 4.3 4.1 6.1 5.0 4.9 5.5 5.5 4.5 UNC Asheville 3.4 4.2 4.2 4.4 4.0 3.9 3.9 3.8 3.5 3.4 3.5
Baccalaureate
BOG Standard 4.0 4.0 4.0 4.0 4.0 4.0 4.0 4.0 4.0 4.0 4.0 Notes: The Carnegie Classifications are updated every few years. Institutions are grouped by their most recent Carnegie Classification. In the most recent (2018) update, ECSU moved to the Baccalaureate Colleges: Diverse Fields category, and UNCW moved to the Doctoral Universities: High Research Activity category.
11
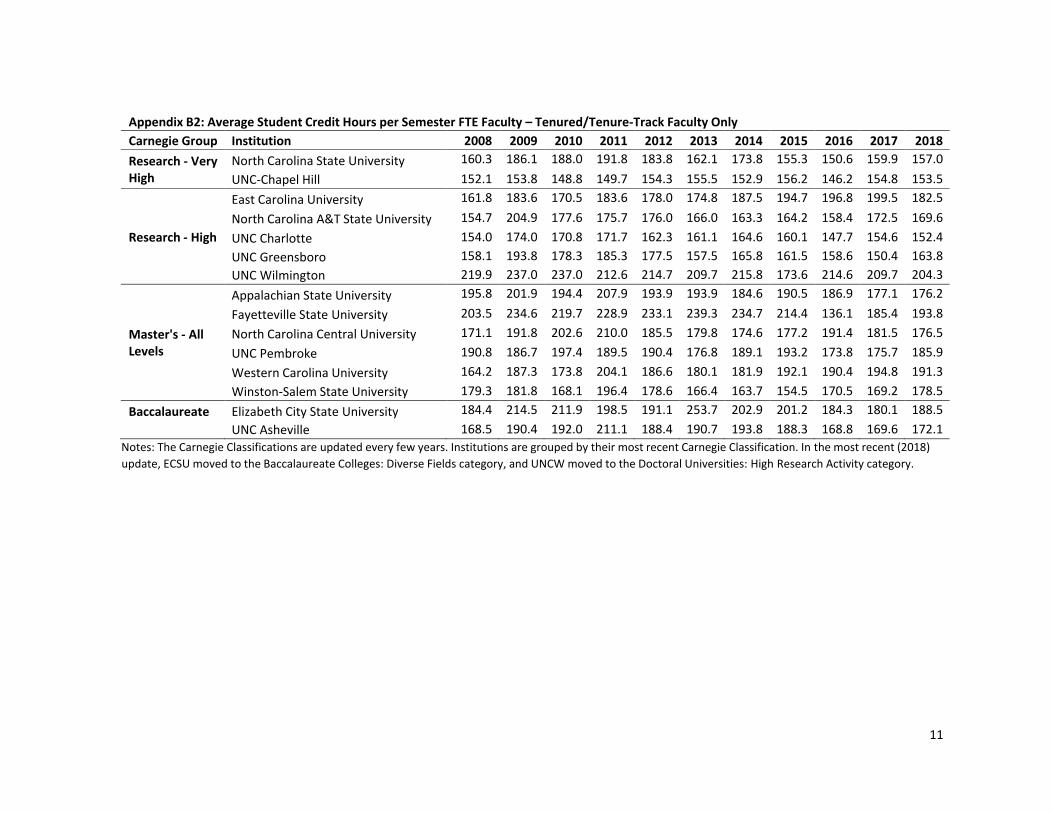
Appendix B2: Average Student Credit Hours per Semester FTE Faculty – Tenured/Tenure-Track Faculty Only Carnegie Group Institution 2008 2009 2010 2011 2012 2013 2014 2015 2016 2017 2018 Research - Very High
North Carolina State University 160.3 186.1 188.0 191.8 183.8 162.1 173.8 155.3 150.6 159.9 157.0 UNC-Chapel Hill 152.1 153.8 148.8 149.7 154.3 155.5 152.9 156.2 146.2 154.8 153.5
East Carolina University 161.8 183.6 170.5 183.6 178.0 174.8 187.5 194.7 196.8 199.5 182.5 North Carolina A&T State University 154.7 204.9 177.6 175.7 176.0 166.0 163.3 164.2 158.4 172.5 169.6
Research - High UNC Charlotte 154.0 174.0 170.8 171.7 162.3 161.1 164.6 160.1 147.7 154.6 152.4 UNC Greensboro 158.1 193.8 178.3 185.3 177.5 157.5 165.8 161.5 158.6 150.4 163.8 UNC Wilmington 219.9 237.0 237.0 212.6 214.7 209.7 215.8 173.6 214.6 209.7 204.3 Appalachian State University 195.8 201.9 194.4 207.9 193.9 193.9 184.6 190.5 186.9 177.1 176.2 Fayetteville State University 203.5 234.6 219.7 228.9 233.1 239.3 234.7 214.4 136.1 185.4 193.8
Master's - All Levels
North Carolina Central University 171.1 191.8 202.6 210.0 185.5 179.8 174.6 177.2 191.4 181.5 176.5 UNC Pembroke 190.8 186.7 197.4 189.5 190.4 176.8 189.1 193.2 173.8 175.7 185.9
Western Carolina University 164.2 187.3 173.8 204.1 186.6 180.1 181.9 192.1 190.4 194.8 191.3 Winston-Salem State University 179.3 181.8 168.1 196.4 178.6 166.4 163.7 154.5 170.5 169.2 178.5
Baccalaureate Elizabeth City State University 184.4 214.5 211.9 198.5 191.1 253.7 202.9 201.2 184.3 180.1 188.5 UNC Asheville 168.5 190.4 192.0 211.1 188.4 190.7 193.8 188.3 168.8 169.6 172.1 Notes: The Carnegie Classifications are updated every few years. Institutions are grouped by their most recent Carnegie Classification. In the most recent (2018) update, ECSU moved to the Baccalaureate Colleges: Diverse Fields category, and UNCW moved to the Doctoral Universities: High Research Activity category.

12
Appendix B3: Average Sections per Semester per FTE Faculty – All Faculty Carnegie Group Institution 2008 2009 2010 2011 2012 2013 2014 2015 2016 2017 2018
Research - Very High
North Carolina State University 2.6 2.8 2.8 3.2 3.2 3.0 3.3 3.1 3.1 3.2 3.2 UNC-Chapel Hill 2.6 3.1 3.1 3.1 3.0 3.0 3.0 3.1 3.0 3.0 3.0
BOG Standard 2.0 2.0 2.0 2.0 2.0 2.0 2.0 2.0 2.0 2.0 2.0 East Carolina University 3.1 4.3 3.9 3.6 3.6 3.4 3.3 3.3 3.2 3.3 3.2 North Carolina A&T State University 3.4 3.8 3.7 3.3 3.4 3.7 3.6 3.6 3.5 3.1 3.0
Research - High UNC Charlotte 3.0 3.1 3.0 2.8 2.9 2.8 2.8 2.8 2.7 2.8 2.9 UNC Greensboro 3.6 4.1 4.0 4.0 4.2 2.7 2.8 3.0 3.4 3.3 3.7 UNC Wilmington 3.7 3.8 3.8 3.7 3.7 3.7 3.8 3.3 3.7 3.7 3.8 BOG Standard 2.5 2.5 2.5 2.5 2.5 2.5 2.5 2.5 2.5 2.5 2.5 Appalachian State University 3.5 3.5 3.5 3.6 3.7 3.5 3.4 3.4 3.4 3.3 3.1 Fayetteville State University 3.9 3.9 3.8 4.0 4.0 4.1 4.1 3.4 2.8 3.3 3.1
Master's - All Levels
North Carolina Central University 4.2 3.8 4.2 4.6 4.2 3.9 3.2 3.1 2.9 2.8 3.3 UNC Pembroke 3.9 3.9 3.9 3.9 3.9 4.0 3.9 4.1 3.6 3.4 3.5
Western Carolina University 3.2 3.1 3.1 3.1 3.1 3.1 3.2 3.2 3.2 3.2 3.2 Winston-Salem State University 3.2 3.0 3.4 3.5 3.4 3.8 3.1 3.0 2.8 3.3 3.4 BOG Standard 3.0 3.0 3.0 3.0 3.0 3.0 3.0 3.0 3.0 3.0 3.0 Elizabeth City State University 4.0 4.3 4.0 4.6 4.4 6.1 5.1 4.9 5.5 5.5 4.5
Baccalaureate UNC Asheville 3.7 4.5 4.4 4.5 4.3 4.2 4.3 4.2 3.7 3.6 3.7 BOG Standard 4.0 4.0 4.0 4.0 4.0 4.0 4.0 4.0 4.0 4.0 4.0 Notes: The Carnegie Classifications are updated every few years. Institutions are grouped by their most recent Carnegie Classification. In the most recent (2018) update, ECSU moved to the Baccalaureate Colleges: Diverse Fields category, and UNCW moved to the Doctoral Universities: High Research Activity category.
All Faculty includes: Tenured/Tenure-Track Faculty, Other Regular Faculty, Supplemental Faculty, and Teaching Assistants.

13
Appendix B4: Average Student Credit Hours per Semester per FTE Faculty – All Faculty Carnegie Group Institution 2008 2009 2010 2011 2012 2013 2014 2015 2016 2017 2018 Research - Very High
North Carolina State University 216.8 243.1 220.7 236.8 245.6 229.5 242.5 220.5 224.8 232.5 240.5 UNC-Chapel Hill 173.5 185.3 189.1 188.8 190.2 187.1 187.9 197.7 185.5 187.2 186.0
East Carolina University 201.2 253.4 224.0 232.9 231.5 228.5 236.3 249.0 256.1 258.2 251.4 North Carolina A&T State University 187.2 247.4 233.9 226.5 211.7 229.8 236.2 242.4 241.2 231.3 220.4
Research - High UNC Charlotte 216.3 232.2 237.3 248.7 236.1 252.9 259.7 264.9 252.6 260.9 264.2 UNC Greensboro 225.1 246.1 230.9 229.8 234.0 204.1 212.4 217.0 222.3 215.3 253.3 UNC Wilmington 236.4 246.9 246.9 230.8 228.4 227.9 238.7 206.2 236.8 231.9 226.0 Appalachian State University 216.4 218.0 213.2 229.5 226.4 227.9 216.6 216.3 221.1 216.9 212.0 Fayetteville State University 213.6 241.3 226.2 233.5 238.7 244.8 240.8 198.2 151.3 201.3 207.4
Master's - All Levels
North Carolina Central University 217.9 216.4 229.5 229.3 220.9 202.0 201.6 193.1 182.1 175.9 198.2 UNC Pembroke 203.9 202.8 208.8 198.7 194.6 196.0 197.4 213.5 181.2 180.0 198.6
Western Carolina University 182.0 208.5 189.2 218.3 202.4 209.0 210.2 213.4 215.7 217.8 221.6 Winston-Salem State University 181.1 172.7 167.4 182.3 166.5 196.6 166.5 162.2 172.1 171.8 191.4
Baccalaureate Elizabeth City State University 198.5 228.0 206.1 208.8 201.1 253.7 205.3 208.3 184.3 180.1 188.5 UNC Asheville 184.2 202.8 198.8 212.7 197.4 198.2 195.9 196.7 172.9 175.5 183.6 Notes: The Carnegie Classifications are updated every few years. Institutions are grouped by their most recent Carnegie Classification. In the most recent (2018) update, ECSU moved to the Baccalaureate Colleges: Diverse Fields category, and UNCW moved to the Doctoral Universities: High Research Activity category.
All Faculty includes: Tenured/Tenure-Track Faculty, Other Regular Faculty, Supplemental Faculty, and Teaching Assistants.