Embed Size (px)
Citation preview

Page 1 of 44
(Constituted in the Republic of Singapore pursuant to a Trust Deed dated 28 January 2019 (as amended))
UNAUDITED CONDENSED INTERIM FINANCIAL STATEMENTS AND DISTRIBUTION ANNOUNCEMENT FOR THE FULL YEAR ENDED 30 JUNE 2021 AND SECOND FINANCIAL HALF YEAR PERIOD FROM 1 JANUARY 2021 TO 30 JUNE 2021
TABLE OF CONTENTS
Item No. Description Page No.
- Introduction & Corporate information 2-3
- Summary of Lendlease Global Commercial REIT Group Results 3
1(a)(i)
Condensed Interim Consolidated Statement of Profit or Loss and Distribution Statement
4-8
1(a)(ii)
Condensed Interim Consolidated Statement of Comprehensive Income
6-9
1(b)(i) Condensed Interim Statement of Financial Position 10-11
1(c) Condensed Interim Consolidated Statement of Cash Flow 12-13
1(d)(i) Condensed Interim Statements of Movements in Unitholders’ Funds 14-17
1(d)(ii) Details of Any Change in the Units 18
1(d)(iii) Notes to the Condensed Interim Financial Statements 18-37
2 Review of Condensed Interim Financial Statements 37
3 Review of Performance 37-38
4 Variance between Actual and Forecast Results 38
5 Outlook & Prospects 38-40
6 & 7 Distributions 41-43
8 General Mandate for Interested Person Transactions 43
9 Segmented revenue and results 43
10 Breakdown of Total Distributions 43
11 Confirmation pursuant to Rule 720(1) of the Listing Manual 43
12 Confirmation Pursuant to Rule 704(13) of The Listing Manual 43
DBS Bank Ltd. is the Sole Financial Adviser and Issue Manager for the initial public offering of Lendlease Global Commercial REIT (the “Offering”). DBS Bank Ltd. and Citigroup Global Markets Singapore Pte. Ltd. were the joint global coordinators, bookrunners and underwriters for the Offering.
LENDLEASE GLOBAL COMMERCIAL REIT
UNAUDITED CONDENSED INTERIM FINANCIAL STATEMENTS AND DISTRIBUTION ANNOUNCEMENT FOR THE FULL YEAR ENDED 30 JUNE 2021 AND SECOND FINANCIAL HALF YEAR PERIOD FROM 1 JANUARY 2021 TO 30 JUNE 2021
Page 2 of 44
Introduction & Corporate information Lendlease Global Commercial REIT (“LREIT”) is a Singapore real estate investment trust constituted by the Trust Deed dated 28 January 2019 (as amended). It is principally regulated by the Securities and Futures Act, Chapter 289 of Singapore, the Code on Collective Investment Schemes issued by the MAS (“CIS Code”), including Appendix 6 of the CIS Code (the “Property Funds Appendix”), other relevant regulations and the Trust Deed. LREIT was listed on the Mainboard of Singapore Exchange Securities Trading Limited (“SGX-ST”) on 2 October 2019 (“Listing Date”). The Sponsor, Lendlease Corporation Limited (“Sponsor” or “Lendlease Corporation”), is part of the Lendlease Group, comprising Lendlease Corporation, Lendlease Trust and their subsidiaries (the “Lendlease Group”, and the Sponsor and its subsidiaries, the “Sponsor Group”). Lendlease Group is a leading international property and infrastructure group with operations in Australia, Asia, Europe and the Americas and is listed on the Australian Securities Exchange. Lendlease Global Commercial Trust Management Pte. Ltd. (the “Manager”) is an indirect wholly-owned subsidiary of the Sponsor. The Trustee of LREIT is RBC Investor Services Trust Singapore Limited (the “Trustee”). LREIT is established with the principal investment strategy of investing, directly or indirectly, in a diversified portfolio of stabilised income-producing real estate assets located globally, which are used primarily for retail and/or office purposes, as well as real estate-related assets in connection with the foregoing. LREIT’s property portfolio comprises a leasehold interest in one retail mall located in Singapore and a freehold interest in three office buildings located in Milan, Italy (the “Properties”). The details of each of these properties are as follows:
(i) a 99-year leasehold1 interest in 313@somerset, which is a retail mall located in Singapore (the “313@somerset”); and
(ii) a freehold interest in Sky Complex, which comprises three office buildings located in Milan, Italy (the “Sky Complex”).
LREIT holds a 5.0% stake in Lendlease Asian Retail Investment Fund 3 Limited (“ARIF 3”)2, which holds a 75.0% indirect interest in the property known as Jem. Jem is an integrated office and retail development located in Jurong Gateway, the commercial hub of the Jurong Lake District, Singapore.
The Manager had made announcements on 9 April 2020 and 20 April 2020 respectively, with regard to the IPO profit and distribution forecast for the financial year ending 30 June 2020 (“FY2020”) and the profit and distribution projection for the financial year ending 30 June 2021 (“FY2021”), as it may no longer be a fair basis against which the actual performance of LREIT could be compared given current circumstances. Footnotes: 1. Commencing on 21 November 2006 and ending on 20 November 2105.
2. ARIF 3 is managed by an indirect wholly-owned subsidiary of the sponsor of LREIT. Management fees will be paid at the respective levels and will not be double counted.

LENDLEASE GLOBAL COMMERCIAL REIT
UNAUDITED CONDENSED INTERIM FINANCIAL STATEMENTS AND DISTRIBUTION ANNOUNCEMENT FOR THE FULL YEAR ENDED 30 JUNE 2021 AND SECOND FINANCIAL HALF YEAR PERIOD FROM 1 JANUARY 2021 TO 30 JUNE 2021
Page 3 of 44
Condensed Interim Financial Statements Presentation
As disclosed in the Prospectus, SGX-ST granted LREIT a waiver from compliance with Rule 705(2)(b) of the SGX-ST Listing Manual in relation to the announcement of results for the financial quarter ended 30 September 2019 on the basis that LREIT did not have any meaningful financial results for the quarter as it was a private trust and the Properties had not been acquired. Accordingly, LREIT announced its first financial results on 10 February 2020 for the period from the Listing Date to 31 December 2019. LREIT was dormant from its date of constitution, 28 January 2019 to the Listing Date.
Any discrepancies in the tables included in this announcement between the listed amounts and the totals thereof are due to rounding. Distribution Policy LREIT intends to make distributions to Unitholders semi-annually and will distribute at least 90.0% of its adjusted net cashflow from operations for each financial year. The actual level of distribution will be determined at the Manager’s discretion. The second distribution for FY2021 will be for the period from 1 January 2021 to 30 June 2021 and will be paid on or before 30 September 2021. LREIT intends to distribute 100.0% of LREIT’s adjusted net cashflow from operations for the period from the Listing Date to the end of 30 June 2021. Summary of Lendlease Global Commercial REIT Group Results
NM: Not meaningful
Footnotes: A. The annualised results for FY2020 is based on the actual results from 2 October 2019 to 30 June 2020 (273 days) pro-rated to
366 days.
6 months
ended
30 Jun 2021
6 months
ended
30 Jun 2020
FY2021 FY2020
Actual Actual Actual Annualised A
Gross Revenue (S$'000) 37,043 34,129 8.5% 78,651 74,455 5.6%
Net Property Income (S$'000) 26,525 24,109 10.0% 56,918 54,014 5.4%
Amount Distributable (S$'000)
- to Perpetual Securities holders 598 - NM 598 - NM
- to Unitholders 27,577 20,660 33.5% 55,123 47,824 15.3%
Available Distribution per Unit ("DPU") (cents) 2.34 1.76 32.8% 4.68 4.08 14.6%
Variance Variance
GROUP
LENDLEASE GLOBAL COMMERCIAL REIT
UNAUDITED CONDENSED INTERIM FINANCIAL STATEMENTS AND DISTRIBUTION ANNOUNCEMENT FOR THE FULL YEAR ENDED 30 JUNE 2021 AND SECOND FINANCIAL HALF YEAR PERIOD FROM 1 JANUARY 2021 TO 30 JUNE 2021
Page 4 of 44
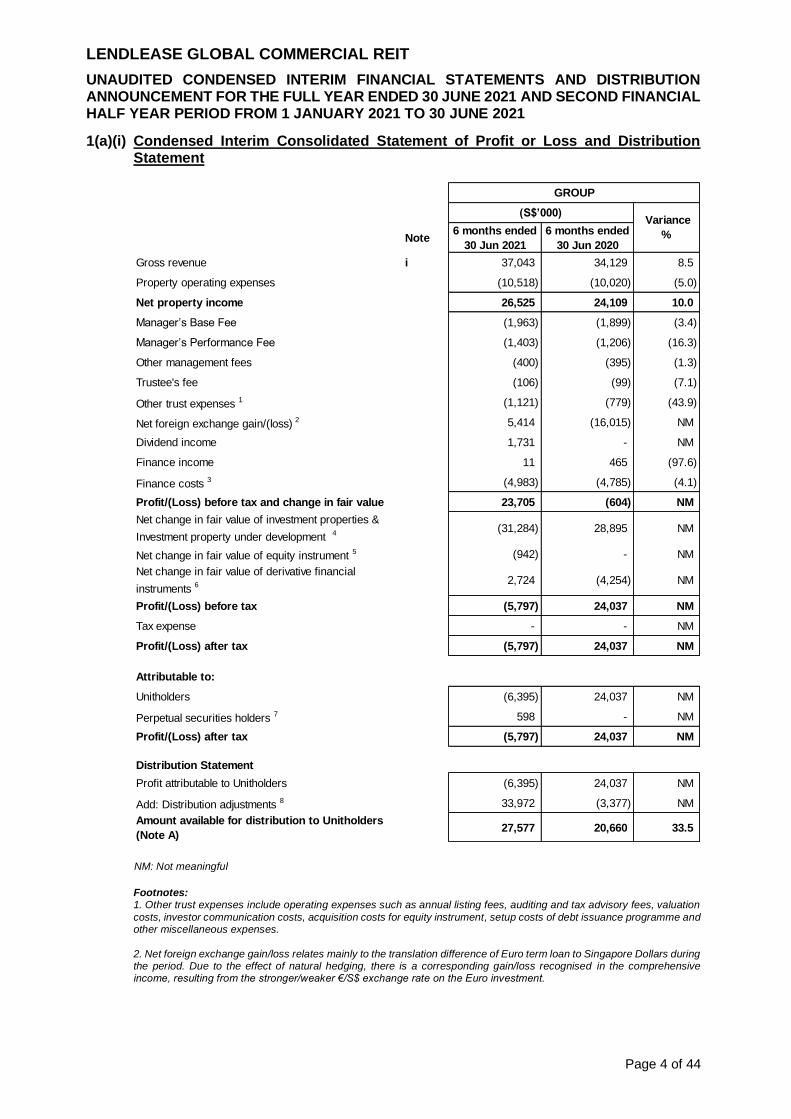
1(a)(i) Condensed Interim Consolidated Statement of Profit or Loss and Distribution Statement
NM: Not meaningful
Footnotes: 1. Other trust expenses include operating expenses such as annual listing fees, auditing and tax advisory fees, valuation
costs, investor communication costs, acquisition costs for equity instrument, setup costs of debt issuance programme and other miscellaneous expenses.
2. Net foreign exchange gain/loss relates mainly to the translation difference of Euro term loan to Singapore Dollars during the period. Due to the effect of natural hedging, there is a corresponding gain/loss recognised in the comprehensive income, resulting from the stronger/weaker €/S$ exchange rate on the Euro investment.
Note6 months ended
30 Jun 2021
6 months ended
30 Jun 2020
Gross revenue i 37,043 34,129 8.5
Property operating expenses (10,518) (10,020) (5.0)
Net property income 26,525 24,109 10.0
Manager’s Base Fee (1,963) (1,899) (3.4)
Manager’s Performance Fee (1,403) (1,206) (16.3)
Other management fees (400) (395) (1.3)
Trustee's fee (106) (99) (7.1)
Other trust expenses 1 (1,121) (779) (43.9)
Net foreign exchange gain/(loss) 2 5,414 (16,015) NM
Dividend income 1,731 - NM
Finance income 11 465 (97.6)
Finance costs 3 (4,983) (4,785) (4.1)
Profit/(Loss) before tax and change in fair value 23,705 (604) NM
Net change in fair value of investment properties &
Investment property under development 4 (31,284) 28,895 NM
Net change in fair value of equity instrument 5 (942) - NM
Net change in fair value of derivative financial
instruments 6 2,724 (4,254) NM
Profit/(Loss) before tax (5,797) 24,037 NM
Tax expense - - NM
Profit/(Loss) after tax (5,797) 24,037 NM
Attributable to:
Unitholders (6,395) 24,037 NM
Perpetual securities holders 7 598 - NM
Profit/(Loss) after tax (5,797) 24,037 NM
Distribution Statement
Profit attributable to Unitholders (6,395) 24,037 NM
Add: Distribution adjustments 8 33,972 (3,377) NM
Amount available for distribution to Unitholders
(Note A)27,577 20,660 33.5
GROUP
Variance
%
(S$’000)

LENDLEASE GLOBAL COMMERCIAL REIT
UNAUDITED CONDENSED INTERIM FINANCIAL STATEMENTS AND DISTRIBUTION ANNOUNCEMENT FOR THE FULL YEAR ENDED 30 JUNE 2021 AND SECOND FINANCIAL HALF YEAR PERIOD FROM 1 JANUARY 2021 TO 30 JUNE 2021
Page 5 of 44
1(a)(i) Condensed Interim Consolidated Statement of Profit or Loss and Distribution
Statement
3. Finance costs comprise mainly interest expense and amortisation of debt-related transaction costs.
4. All transaction costs directly attributable to the acquisition of the Properties have been capitalised in accordance with
IAS 40. This is then recorded as a fair value change in the profit or loss statement from revaluation of investment properties. This is a non-tax chargeable/deductible item and therefore does not affect income available for distribution to Unitholders.
5. Comprises net change in fair value of equity instrument through profit or loss. This is a non-tax chargeable/deductible item and therefore does not affect income available for distribution to Unitholders.
6. Comprises mainly net change in fair value of interest rate swaps, options and currency forwards which were entered to hedge interest rate and foreign exchange risks. This is a non-tax chargeable/deductible item and therefore does not affect income available for distribution to Unitholders.
7. On 4 June 2021, LREIT issued $200 million of perpetual securities with no fixed final redemption date. The perpetual securities confer a right to its holders to receive distribution payments at a rate of 4.20% per annum, with the first
distribution rate reset falling on 4 June 2026 and subsequent resets occurring every 5 years thereafter. Distributions are payable semi-annually in arrears on a discretionary basis and are non-cumulative in accordance with the terms and conditions of the perpetual securities.
8. Comprises Manager’s base fee and performance fee paid/payable in units, property management fee paid/payable in units, net change in fair value of investment properties, investment property under development, equity instrument and
derivative financial instruments, amortisation of debt-related transaction costs, incentive amounts, acquisition costs for equity instrument and other adjustments related to non-cash or timing differences in income and expenses.
Footnote: 1. Foreign source distribution mainly pertains to income from Sky Complex. Any income from this property that has not
been distributed to LREIT by the date LREIT makes distribution to its Unitholders will constitute a capital distribution.
6 months
ended
30 Jun 2021
6 months
ended
30 Jun 2020
Note A
Distribution from:
- Singapore 17,260 11,071 55.9
- Foreign source 1 10,317 9,589 7.6
Total 27,577 20,660 33.5
(S$’000)
GROUP
Variance
%

LENDLEASE GLOBAL COMMERCIAL REIT
UNAUDITED CONDENSED INTERIM FINANCIAL STATEMENTS AND DISTRIBUTION ANNOUNCEMENT FOR THE FULL YEAR ENDED 30 JUNE 2021 AND SECOND FINANCIAL HALF YEAR PERIOD FROM 1 JANUARY 2021 TO 30 JUNE 2021
Page 6 of 44
1(a)(ii) Condensed Interim Consolidated Statement of Comprehensive Income
NM: Not meaningful
6 months
ended
30 Jun 2021
6 months
ended
30 Jun 2020
Profit/(Loss) after tax (5,797) 24,037 NM
Item that may be reclassified subsequently to
profit or loss:
Other comprehensive income:
Net currency translation differences relating to
financial statements of a foreign subsidiary(5,981) 16,253 NM
Total comprehensive income (11,778) 40,290 NM
Total comprehensive income attributable to:
Unitholders (12,376) 40,290 NM
Perpetual securities holders 598 - NM
(11,778) 40,290 NM
Variance
%
(S$’000)
GROUP

LENDLEASE GLOBAL COMMERCIAL REIT
UNAUDITED CONDENSED INTERIM FINANCIAL STATEMENTS AND DISTRIBUTION ANNOUNCEMENT FOR THE FULL YEAR ENDED 30 JUNE 2021 AND SECOND FINANCIAL HALF YEAR PERIOD FROM 1 JANUARY 2021 TO 30 JUNE 2021
Page 7 of 44
1(a)(i) Condensed Interim Consolidated Statement of Profit or Loss and Distribution
Statement
*Not meaningful as LREIT was listed on the 2 October 2019. Please refer to Note 3 “Review of performance” for a review
of the actual results for the period against the annualised results for the same period in the previous financial period.
Footnotes: 1. Other trust expenses include operating expenses such as annual listing fees, auditing and tax advisory fees, valuation
costs, investor communication costs, acquisition costs for equity instrument, setup costs of debt issuance programme and other miscellaneous expenses.
2. Net foreign exchange gain/loss relates mainly to the translation difference of Euro term loan to Singapore Dollars during
the period. Due to the effect of natural hedging, there is a corresponding gain/loss recognised in the comprehensive income, resulting from the stronger/weaker €/S$ exchange rate on the Euro investment.
3. Finance costs comprise mainly interest expense and amortisation of debt-related transaction costs.
Note FY2021
2 Oct 2019
(Listing Date)
to 30 Jun 2020
Gross revenue i 78,651 55,536
Property operating expenses (21,733) (15,247)
Net property income 56,918 40,289
Manager’s base fee (3,933) (2,850)
Manager’s performance fee (2,923) (2,015)
Other management fees (801) (580)
Trustee's fee (209) (148)
Other trust expenses 1 (2,561) (1,228)
Net foreign exchange gain/(loss) 2 (9,219) (10,999)
Dividend income 1,731 -
Finance income 51 531
Finance costs 3 (10,040) (7,240)
Profit/(Loss) before tax and change in fair value 29,014 15,760
Net change in fair value of investment properties &
Investment property under development 4 (31,284) (20,102)
Net change in fair value of equity instrument 5 (942) -
Net change in fair value of derivative financial
instruments 6 1,873 (4,274)
Profit/(Loss) before tax (1,339) (8,616)
Tax expense - -
Profit/(Loss) after tax (1,339) (8,616)
Attributable to:
Unitholders (1,937) (8,616)
Perpetual securities holders 7 598 -
Profit/(Loss) after tax (1,339) (8,616)
Distribution Statement
Profit attributable to Unitholders (1,937) (8,616)
Add: Distribution adjustments 8 57,060 44,288
Amount available for distribution to Unitholders
(Note A)55,123 35,672
GROUP
(S$’000)
Variance
%*
Please see
footnote *
Please see
footnote *
Please see
footnote *

LENDLEASE GLOBAL COMMERCIAL REIT
UNAUDITED CONDENSED INTERIM FINANCIAL STATEMENTS AND DISTRIBUTION ANNOUNCEMENT FOR THE FULL YEAR ENDED 30 JUNE 2021 AND SECOND FINANCIAL HALF YEAR PERIOD FROM 1 JANUARY 2021 TO 30 JUNE 2021
Page 8 of 44
1(a)(i) Condensed Interim Consolidated Statement of Profit or Loss and Distribution
Statement
4. All transaction costs directly attributable to the acquisition of the Properties have been capitalised in accordance with IAS 40. This is then recorded as a fair value change in the profit or loss statement from revaluation of investment properties.
This is a non-tax chargeable/deductible item and therefore does not affect income available for distribution to Unitholders. 5. Comprises net change in fair value of equity instrument through profit or loss. This is a non-tax chargeable/deductible
item and therefore does not affect income available for distribution to Unitholders.
6. Comprises mainly net change in fair value of interest rate swaps, options and currency forwards which were entered to hedge interest rate and foreign exchange risks. This is a non-tax chargeable/deductible item and therefore does not affect income available for distribution to Unitholders.
7. On 4 June 2021, LREIT issued $200 million of perpetual securities with no fixed final redemption date. The perpetual securities confer a right to its holders to receive distribution payments at a rate of 4.20% per annum, with the first
distribution rate reset falling on 4 June 2026 and subsequent resets occurring every 5 years thereafter. Distributions are payable semi-annually in arrears on a discretionary basis and are non-cumulative in accordance with the terms and conditions of the perpetual securities.
8. Comprises Manager’s base fee and performance fee paid/payable in units, property management fee paid/payable in units, net change in fair value of investment properties, investment property under development, equity instrument and
derivative financial instruments, amortisation of debt-related transaction costs, incentive amounts, acquisition costs for equity instrument and other adjustments related to non-cash or timing differences in income and expenses.
* Not meaningful as LREIT was listed on the 2 October 2019. Please refer to Note 3 “Review of performance” for a review
of the actual results for the period against the annualised results for the same period in the previous financial period.
Footnote: 1. Foreign source distribution mainly pertains to income from Sky Complex. Any income from this property that has not been distributed to LREIT by the date LREIT makes distribution to its Unitholders will constitute a capital distribution.
FY2021
2 Oct 2019
(Listing Date)
to 30 Jun 2020
Note A
Distribution from:
- Singapore 35,422 21,396
- Foreign source 1 19,701 14,276
Total 55,123 35,672
GROUP
(S$’000)
Variance
% *
Please see
footnote *

LENDLEASE GLOBAL COMMERCIAL REIT
UNAUDITED CONDENSED INTERIM FINANCIAL STATEMENTS AND DISTRIBUTION ANNOUNCEMENT FOR THE FULL YEAR ENDED 30 JUNE 2021 AND SECOND FINANCIAL HALF YEAR PERIOD FROM 1 JANUARY 2021 TO 30 JUNE 2021
Page 9 of 44
1(a)(ii) Condensed Interim Consolidated Statement of Comprehensive Income
* Not meaningful as LREIT was listed on the 2 October 2019. Please refer to Note 3 “Review of performance” for a review
of the actual results for the period against the annualised results for the same period in the previous financial period.
FY2021
2 Oct 2019
(Listing Date)
to 30 Jun 2020
Profit/(Loss) after tax (1,339) (8,616)
Item that may be reclassified subsequently to
profit or loss:
Other comprehensive income:
Net currency translation differences relating to
financial statements of a foreign subsidiary9,005 11,218
Total comprehensive income 7,666 2,602
Total comprehensive income attributable to:
Unitholders 7,068 2,602
Perpetual securities holders 598 -
7,666 2,602
Please see
footnote *
(S$’000)
Variance
% *
Please see
footnote *
GROUP

LENDLEASE GLOBAL COMMERCIAL REIT
UNAUDITED CONDENSED INTERIM FINANCIAL STATEMENTS AND DISTRIBUTION ANNOUNCEMENT FOR THE FULL YEAR ENDED 30 JUNE 2021 AND SECOND FINANCIAL HALF YEAR PERIOD FROM 1 JANUARY 2021 TO 30 JUNE 2021
Page 10 of 44
Footnotes:
1. Derivative financial instruments reflect the fair value of interest rate swaps, options and currency forwards which were entered to hedge interest rate and foreign exchange risks.
2. This relates to the lease liability recognised by the Group on its existing operating lease arrangements in accordance
with the principles of IFRS 16.
3. Net asset value (“NAV”) and net tangible asset (“NTA”) backing per unit based on issued units at the end of the period.
GROUP GROUP
Note 30 Jun 2021
(S$’000)
30 Jun 2020
(S$’000)
Current assets
Cash and cash equivalents ii 249,264 83,678
Trade and other receivables 6,664 10,553
Other current assets 2,910 4,663
258,838 98,894
Non-current assets
Investment properties iii 1,419,857 1,442,598
Investment property under development iv 5,521 -
Equity instrument at fair value v 44,591 -
Other receivables 7,311 12,845
Other non current assets 869 1,012
Derivative financial instruments 1 128 149
1,478,277 1,456,604
Total assets 1,737,115 1,555,498
Current liabilities
Trade and other payables 27,393 21,827
Lease liability 2 416 -
Derivative financial instruments 1 207 320
28,016 22,147
Non-current liabilities
Trade and other payables 5,300 7,999
Lease liability 2 2,105 -
Loans and borrowings vi 542,573 528,999
Derivative financial instruments 1 2,322 4,103
552,300 541,101
Total liabilities 580,316 563,248
Net assets 1,156,799 992,250
Represented by:
Unitholders’ funds 957,902 992,250
Perpetual securities holders 198,897 -
1,156,799 992,250
NAV per Unit (S$) 3 vii 0.81 0.85
1(b)(i) Condensed Interim Statement of Financial Position

LENDLEASE GLOBAL COMMERCIAL REIT
UNAUDITED CONDENSED INTERIM FINANCIAL STATEMENTS AND DISTRIBUTION ANNOUNCEMENT FOR THE FULL YEAR ENDED 30 JUNE 2021 AND SECOND FINANCIAL HALF YEAR PERIOD FROM 1 JANUARY 2021 TO 30 JUNE 2021
Page 11 of 44
Footnotes:
1. Derivative financial instruments reflect the fair value of interest rate swaps, options and currency forwards which were entered to hedge interest rate and foreign exchange risks.
2. This relates to the lease liability recognised by the Group on its existing operating lease arrangements in accordance
with the principles of IFRS 16. 3. Net asset value (“NAV”) and net tangible asset (“NTA”) backing per unit based on issued units at the end of the period.
LREIT LREIT
Note 30 Jun 2021
(S$’000)
30 Jun 2020
(S$’000)
Current assets
Cash and cash equivalents ii 232,768 60,664
Trade and other receivables 833 4,942
Other current assets 2,582 4,359
236,183 69,965
Non-current assets
Investment properties iii 983,000 1,008,000
Investment property under development iv 5,521 -
Investment in subsidiary 435,245 435,245
Equity instrument at fair value v 44,591 -
Other non current assets 869 1,012
Derivative financial instruments 1 128 149
1,469,354 1,444,406
Total assets 1,705,537 1,514,371
Current liabilities
Trade and other payables 22,997 17,555
Lease liability 2 416 -
Derivative financial instruments 1 207 320
23,620 17,875
Non-current liabilities
Trade and other payables 5,300 7,999
Lease liability 2 2,105 -
Loans and borrowings vi 542,573 528,999
Derivative financial instruments 1 2,322 4,103
552,300 541,101
Total liabilities 575,920 558,976
Net assets 1,129,617 955,395
Represented by:
Unitholders’ funds 930,720 955,395
Perpetual securities holders 198,897 -
1,129,617 955,395
NAV per Unit (S$) 3 vii 0.79 0.82
1(b)(i) Condensed Interim Statement of Financial Position

LENDLEASE GLOBAL COMMERCIAL REIT
UNAUDITED CONDENSED INTERIM FINANCIAL STATEMENTS AND DISTRIBUTION ANNOUNCEMENT FOR THE FULL YEAR ENDED 30 JUNE 2021 AND SECOND FINANCIAL HALF YEAR PERIOD FROM 1 JANUARY 2021 TO 30 JUNE 2021
Page 12 of 44
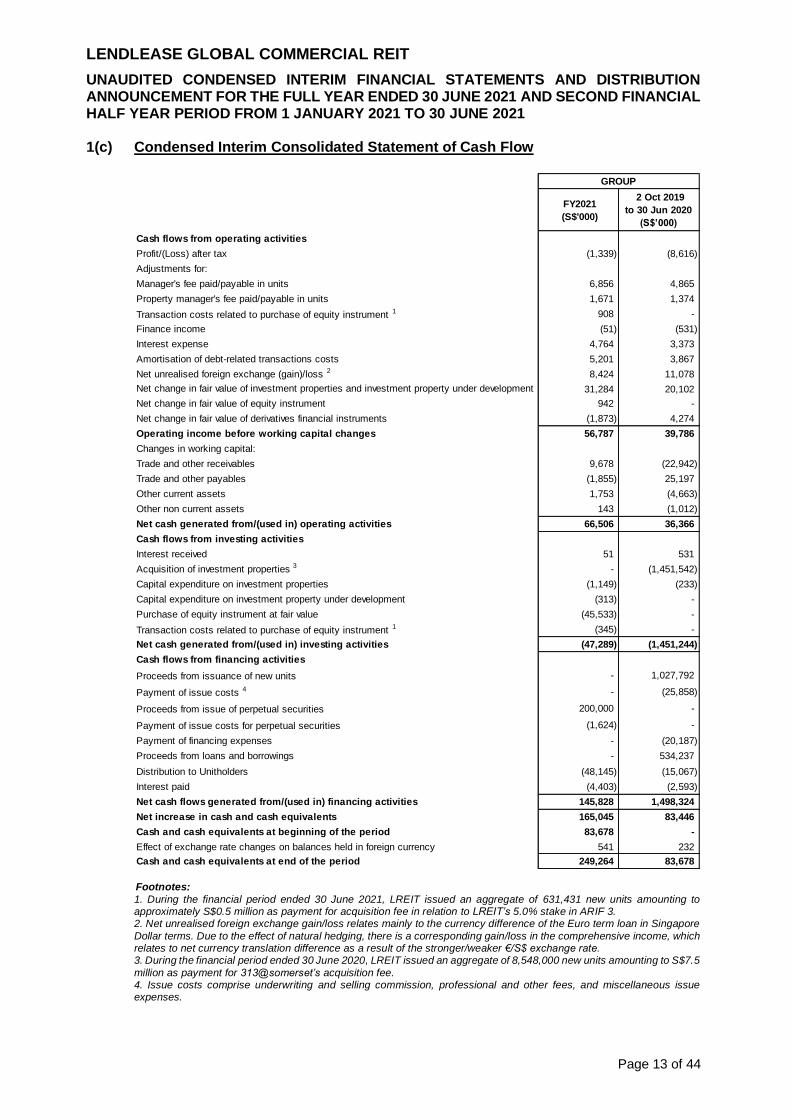
1(c) Condensed Interim Consolidated Statement of Cash Flow
Footnotes: 1. Net unrealised foreign exchange gain/loss relates mainly to the currency difference of the Euro term loan in Singapore Dollar terms. Due to the effect of natural hedging, there is a corresponding gain/loss in the comprehensive income, which
relates to net currency translation difference as a result of the stronger/weaker €/S$ exchange rate. 2. Cash flows used in acquisition of investment properties during the period 6 months ended 30 Jun 2020 comprise mainly acquisition costs for Sky Complex.
3. Issue costs comprise underwriting and selling commission, professional and other fees, and miscellaneous issue expenses.
6 months ended
30 Jun 2021
(S$'000)
6 months ended
30 Jun 2020
(S$'000)
Cash flows from operating activities
Profit/(Loss) after tax (5,797) 24,037
Adjustments for:
Manager's fee paid/payable in units 3,366 3,105
Property manager's fee paid/payable in units 825 904
Transaction costs related to purchase of equity instrument 405 -
Finance income (11) (465)
Interest expense 2,301 2,210
Amortisation of debt-related transactions costs 2,607 2,575
Net unrealised foreign exchange (gain)/loss 1 (5,774) 16,094
Net change in fair value of investment properties and investment property under development 31,284 (28,895)
Net change in fair value of equity instrument 942 -
Net change in fair value of derivatives financial instruments (2,724) 4,254
Operating income before working capital changes 27,424 23,819
Changes in working capital:
Trade and other receivables 7,326 4,854
Trade and other payables (38) 1,038
Other current assets 709 (2,514)
Other non current assets 54 (957)
Net cash generated from/(used in) operating activities 35,475 26,240
Cash flows from investing activities
Interest received 11 465
Acquisition of investment properties 2 - (4,538)
Capital expenditure on investment properties (797) (233)
Capital expenditure on investment property under development (313) -
Transaction costs related to purchase of equity instrument (297) -
Net cash generated from/(used in) investing activities (1,396) (4,306)
Cash flows from financing activities
Payment of issue costs 3 - (9,810)
Proceeds from issue of perpetual securities 200,000 -
Payment of issue costs for perpetual securities (1,624) -
Payment of financing expenses - (366)
Distribution to Unitholders (27,545) (15,067)
Interest paid (2,420) (1,880)
Net cash flows generated from/(used in) financing activities 168,411 (27,123)
Net increase/(decrease) in cash and cash equivalents 202,490 (5,189)
Cash and cash equivalents at beginning of the period 46,436 88,482
Effect of exchange rate changes on balances held in foreign currency 338 385
Cash and cash equivalents at end of the period 249,264 83,678
GROUP
LENDLEASE GLOBAL COMMERCIAL REIT
UNAUDITED CONDENSED INTERIM FINANCIAL STATEMENTS AND DISTRIBUTION ANNOUNCEMENT FOR THE FULL YEAR ENDED 30 JUNE 2021 AND SECOND FINANCIAL HALF YEAR PERIOD FROM 1 JANUARY 2021 TO 30 JUNE 2021
Page 13 of 44
1(c) Condensed Interim Consolidated Statement of Cash Flow
Footnotes:
1. During the financial period ended 30 June 2021, LREIT issued an aggregate of 631,431 new units amounting to approximately S$0.5 million as payment for acquisition fee in relation to LREIT’s 5.0% stake in ARIF 3. 2. Net unrealised foreign exchange gain/loss relates mainly to the currency difference of the Euro term loan in Singapore
Dollar terms. Due to the effect of natural hedging, there is a corresponding gain/loss in the comprehensive income, which relates to net currency translation difference as a result of the stronger/weaker €/S$ exchange rate. 3. During the financial period ended 30 June 2020, LREIT issued an aggregate of 8,548,000 new units amounting to S$7.5
million as payment for 313@somerset’s acquisition fee. 4. Issue costs comprise underwriting and selling commission, professional and other fees, and miscellaneous issue expenses.
FY2021
(S$'000)
2 Oct 2019
to 30 Jun 2020
(S$’000)
Cash flows from operating activities
Profit/(Loss) after tax (1,339) (8,616)
Adjustments for:
Manager's fee paid/payable in units 6,856 4,865
Property manager's fee paid/payable in units 1,671 1,374
Transaction costs related to purchase of equity instrument 1 908 -
Finance income (51) (531)
Interest expense 4,764 3,373
Amortisation of debt-related transactions costs 5,201 3,867
Net unrealised foreign exchange (gain)/loss 2 8,424 11,078
Net change in fair value of investment properties and investment property under development 31,284 20,102
Net change in fair value of equity instrument 942 -
Net change in fair value of derivatives financial instruments (1,873) 4,274
Operating income before working capital changes 56,787 39,786
Changes in working capital:
Trade and other receivables 9,678 (22,942)
Trade and other payables (1,855) 25,197
Other current assets 1,753 (4,663)
Other non current assets 143 (1,012)
Net cash generated from/(used in) operating activities 66,506 36,366
Cash flows from investing activities
Interest received 51 531
Acquisition of investment properties 3 - (1,451,542)
Capital expenditure on investment properties (1,149) (233)
Capital expenditure on investment property under development (313) -
Purchase of equity instrument at fair value (45,533) -
Transaction costs related to purchase of equity instrument 1 (345) -
Net cash generated from/(used in) investing activities (47,289) (1,451,244)
Cash flows from financing activities
Proceeds from issuance of new units - 1,027,792
Payment of issue costs 4 - (25,858)
Proceeds from issue of perpetual securities 200,000 -
Payment of issue costs for perpetual securities (1,624) -
Payment of financing expenses - (20,187)
Proceeds from loans and borrowings - 534,237
Distribution to Unitholders (48,145) (15,067)
Interest paid (4,403) (2,593)
Net cash flows generated from/(used in) financing activities 145,828 1,498,324
Net increase in cash and cash equivalents 165,045 83,446
Cash and cash equivalents at beginning of the period 83,678 -
Effect of exchange rate changes on balances held in foreign currency 541 232
Cash and cash equivalents at end of the period 249,264 83,678
GROUP

LENDLEASE GLOBAL COMMERCIAL REIT
UNAUDITED CONDENSED INTERIM FINANCIAL STATEMENTS AND DISTRIBUTION ANNOUNCEMENT FOR THE FULL YEAR ENDED 30 JUNE 2021 AND SECOND FINANCIAL HALF YEAR PERIOD FROM 1 JANUARY 2021 TO 30 JUNE 2021
Page 14 of 44
1(d)(i) Condensed Interim Statements of Movements in Unitholders’ Funds
Footnote: 1. Issue costs comprise underwriting and selling commission, professional and other fees, and miscellaneous issue
expenses.
GROUP GROUP
6 months ended
30 Jun 2021
(S$'000)
6 months ended
30 Jun 2020
(S$'000)
Operations
Balance as at the beginning of the period (4,158) (32,653)
Profit/(Loss) after tax attributable to Unitholders (6,395) 24,037
Balance as at end of the period (10,553) (8,616)
Unitholders' transactions
Balance as at the beginning of the period 972,961 998,226
Issue costs1 on the Listing Date - 3,708
Manager’s base fee paid in units 1,970 1,883
Property Manager's fee paid in units 846 898
Distributions (27,545) (15,067)
Balance as at end of the period 948,232 989,648
Foreign currency translation reserve
Balance as at the beginning of the period 26,204 (5,035)
Translation differences relating to financial statements
of a foreign subsidiary(5,981) 16,253
Balance as at end of the period 20,223 11,218
Total Unitholders’ funds as at end of the period 957,902 992,250
Perpetual securities holders
Balance as at beginning of the period - -
Issue of perpetual securities 200,000 -
Issue expenses (1,701) -
Profit attributable to perpetual securities holders 598 -
Balance at end of the period 198,897 -

LENDLEASE GLOBAL COMMERCIAL REIT
UNAUDITED CONDENSED INTERIM FINANCIAL STATEMENTS AND DISTRIBUTION ANNOUNCEMENT FOR THE FULL YEAR ENDED 30 JUNE 2021 AND SECOND FINANCIAL HALF YEAR PERIOD FROM 1 JANUARY 2021 TO 30 JUNE 2021
Page 15 of 44
1(d)(i) Condensed Interim Statements of Movements in Unitholders’ Funds
* Less than S$1,000. Footnote:
1. Issue costs comprise underwriting and selling commission, professional and other fees, and miscellaneous issue expenses.
GROUP GROUP
FY2021
(S$'000)
28 Jan 2019
to 30 Jun 2020
(S$’000)
Operations
Balance as at the beginning of the period (8,616) -
Profit/(Loss) after tax attributable to Unitholders (1,937) (8,616)
Balance as at end of the period (10,553) (8,616)
Unitholders' transactions
Balance as at the beginning of the period 989,648 -
Issue of new units on the Listing Date - 1,027,792
Issue costs1 on the Listing Date - (25,858)
Manager’s base fee paid in units 2,937 1,883
Manager’s performance fee paid in units 2,015 -
Manager’s acquisition fee paid in units 455 -
Property Manager's fee paid in units 1,322 898
Distributions (48,145) (15,067)
Balance as at end of the period 948,232 989,648
Foreign currency translation reserve
Balance as at the beginning of the period 11,218 -
Translation differences relating to financial statements
of a foreign subsidiary9,005 11,218
Balance as at end of the period 20,223 11,218
Total Unitholders’ funds as at end of the period 957,902 992,250
Perpetual securities holders
Balance as at beginning of the period - -
Issue of perpetual securities 200,000 -
Issue expenses (1,701) -
Profit attributable to perpetual securities holders 598 -
Balance at end of the period 198,897 -
*

LENDLEASE GLOBAL COMMERCIAL REIT
UNAUDITED CONDENSED INTERIM FINANCIAL STATEMENTS AND DISTRIBUTION ANNOUNCEMENT FOR THE FULL YEAR ENDED 30 JUNE 2021 AND SECOND FINANCIAL HALF YEAR PERIOD FROM 1 JANUARY 2021 TO 30 JUNE 2021
Page 16 of 44
1(d)(i) Condensed Interim Statements of Movements in Unitholders’ Funds
Footnote: 1. Issue costs comprise underwriting and selling commission, professional and other fees, and miscellaneous issue expenses.
LREIT LREIT
6 months ended
30 Jun 2021
(S$'000)
6 months ended
30 Jun 2020
(S$'000)
Operations
Balance as at the beginning of the period (21,683) (25,231)
Profit/(Loss) after tax attributable to Unitholders 4,171 (9,022)
Balance as at end of the period (17,512) (34,253)
Unitholders' transactions
Balance as at the beginning of the period 972,961 998,226
Issue costs1 on the Listing Date - 3,708
Manager’s base fee paid in units 1,970 1,883
Property Manager's fee paid in units 846 898
Distributions (27,545) (15,067)
Balance as at end of the period 948,232 989,648
Total Unitholders’ funds as at end of the period 930,720 955,395
Perpetual securities holders
Balance as at beginning of the period - -
Issue of perpetual securities 200,000 -
Issue expenses (1,701) -
Profit attributable to perpetual securities holders 598 -
Balance at end of the period 198,897 -

LENDLEASE GLOBAL COMMERCIAL REIT
UNAUDITED CONDENSED INTERIM FINANCIAL STATEMENTS AND DISTRIBUTION ANNOUNCEMENT FOR THE FULL YEAR ENDED 30 JUNE 2021 AND SECOND FINANCIAL HALF YEAR PERIOD FROM 1 JANUARY 2021 TO 30 JUNE 2021
Page 17 of 44
1(d)(i) Condensed Interim Statements of Movements in Unitholders’ Funds
* Less than S$1,000.
Footnote: 1. Issue costs comprise underwriting and selling commission, professional and other fees, and miscellaneous issue
expenses.
LREIT LREIT
FY2021
(S$'000)
28 Jan 2019
to 30 Jun 2020
(S$’000)
Operations
Balance as at the beginning of the period (34,253) -
Profit/(Loss) after tax attributable to Unitholders 16,741 (34,253)
Balance as at end of the period (17,512) (34,253)
Unitholders' transactions
Balance as at the beginning of the period 989,648 -
Issue of new units on the Listing Date - 1,027,792
Issue costs1 on the Listing Date - (25,858)
Manager’s base fee paid in units 2,937 1,883
Manager’s performance fee paid in units 2,015 -
Manager’s acquisition fee paid in units 455 -
Property Manager's fee paid in units 1,322 898
Distributions (48,145) (15,067)
Balance as at end of the period 948,232 989,648
Total Unitholders’ funds as at end of the period 930,720 955,395
Perpetual securities holders
Balance as at beginning of the period - -
Issue of perpetual securities 200,000 -
Issue expenses (1,701) -
Profit attributable to perpetual securities holders 598 -
Balance at end of the period 198,897 -
*
LENDLEASE GLOBAL COMMERCIAL REIT
UNAUDITED CONDENSED INTERIM FINANCIAL STATEMENTS AND DISTRIBUTION ANNOUNCEMENT FOR THE FULL YEAR ENDED 30 JUNE 2021 AND SECOND FINANCIAL HALF YEAR PERIOD FROM 1 JANUARY 2021 TO 30 JUNE 2021
Page 18 of 44
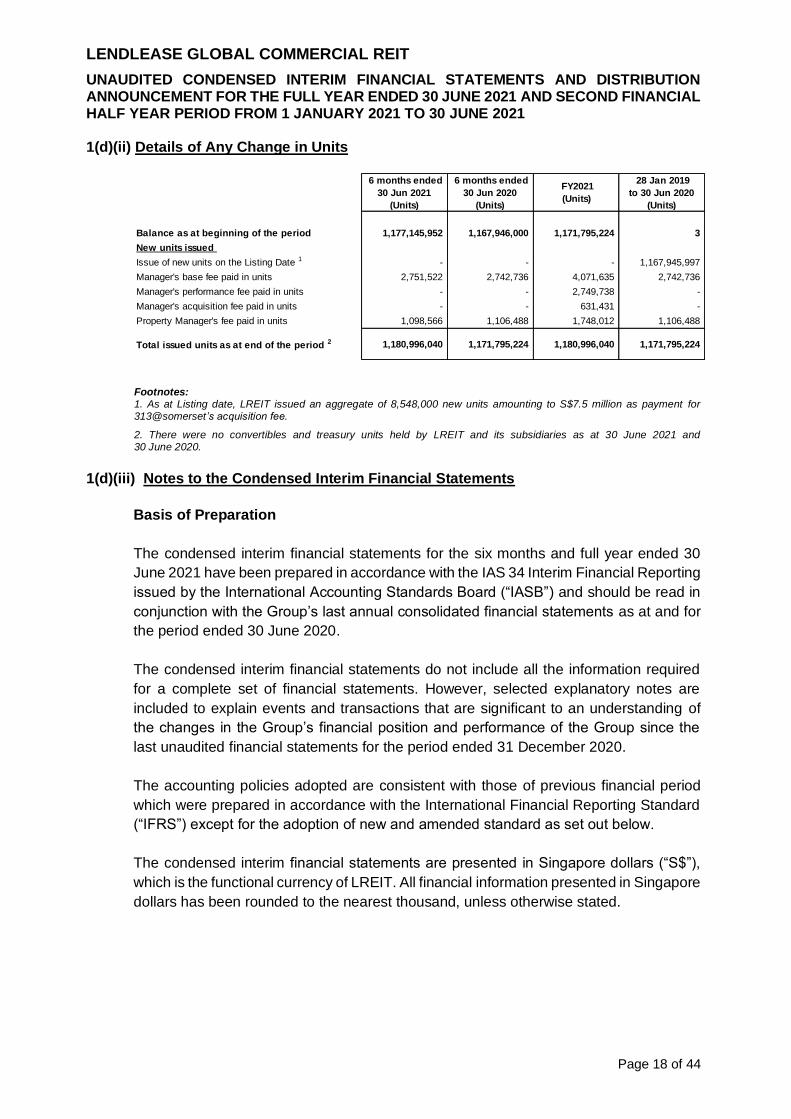
1(d)(ii) Details of Any Change in Units
Footnotes: 1. As at Listing date, LREIT issued an aggregate of 8,548,000 new units amounting to S$7.5 million as payment for 313@somerset’s acquisition fee.
2. There were no convertibles and treasury units held by LREIT and its subsidiaries as at 30 June 2021 and 30 June 2020.
1(d)(iii) Notes to the Condensed Interim Financial Statements
Basis of Preparation
The condensed interim financial statements for the six months and full year ended 30
June 2021 have been prepared in accordance with the IAS 34 Interim Financial Reporting
issued by the International Accounting Standards Board (“IASB”) and should be read in
conjunction with the Group’s last annual consolidated financial statements as at and for
the period ended 30 June 2020.
The condensed interim financial statements do not include all the information required
for a complete set of financial statements. However, selected explanatory notes are
included to explain events and transactions that are significant to an understanding of
the changes in the Group’s financial position and performance of the Group since the
last unaudited financial statements for the period ended 31 December 2020.
The accounting policies adopted are consistent with those of previous financial period
which were prepared in accordance with the International Financial Reporting Standard
(“IFRS”) except for the adoption of new and amended standard as set out below.
The condensed interim financial statements are presented in Singapore dollars (“S$”),
which is the functional currency of LREIT. All financial information presented in Singapore
dollars has been rounded to the nearest thousand, unless otherwise stated.
6 months ended
30 Jun 2021
(Units)
6 months ended
30 Jun 2020
(Units)
FY2021
(Units)
28 Jan 2019
to 30 Jun 2020
(Units)
Balance as at beginning of the period 1,177,145,952 1,167,946,000 1,171,795,224 3
New units issued
Issue of new units on the Listing Date 1 - - - 1,167,945,997
Manager's base fee paid in units 2,751,522 2,742,736 4,071,635 2,742,736
Manager's performance fee paid in units - - 2,749,738 -
Manager's acquisition fee paid in units - - 631,431 -
Property Manager's fee paid in units 1,098,566 1,106,488 1,748,012 1,106,488
Total issued units as at end of the period 2 1,180,996,040 1,171,795,224 1,180,996,040 1,171,795,224

LENDLEASE GLOBAL COMMERCIAL REIT
UNAUDITED CONDENSED INTERIM FINANCIAL STATEMENTS AND DISTRIBUTION ANNOUNCEMENT FOR THE FULL YEAR ENDED 30 JUNE 2021 AND SECOND FINANCIAL HALF YEAR PERIOD FROM 1 JANUARY 2021 TO 30 JUNE 2021
Page 19 of 44
New and amended standards adopted by the Group
A number of amendments to Standards have become applicable for the current reporting
period. The Group did not have to change its accounting policies or make retrospective
adjustments as a result of adopting those standards.
Use of estimates and judgements
In preparing the condensed interim financial statements, management has made
judgements, estimates and assumptions that affect the application of accounting policies
and the reported amounts of assets, liabilities, income and expenses. Actual results may
differ from these estimates.
Estimates and underlying assumptions are reviewed on an ongoing basis. Revisions to
accounting estimates are recognised in the period in which the estimates are revised and
in any future periods affected.
Information about critical judgements and estimates made in applying the Group’s
accounting policies that have the most significant effect on the amounts recognised in
the condensed interim financial statements are described in note iii – investment
properties and note iv - investment property under development.
Measurement of fair values
A number of the Group’s accounting policies and disclosures require the measurement
of fair values, for both financial and non-financial assets and liabilities.
The Group has an established control framework with respect to the measurement of fair
values. The Manager has overall responsibility for the appointment of external valuers,
where necessary, and all significant fair value measurements and reports directly to the
Board of Directors of the Manager.
When measuring the fair value of an asset or a liability, the Manager uses market
observable data as far as possible. Fair values are categorised into different levels in a
fair value hierarchy based on the inputs used in the valuation techniques as follows:
• Level 1: Quoted prices (unadjusted) in active markets for identical assets or liabilities;
• Level 2: Inputs other than quoted prices included in Level 1 that are observable for the
asset or liability, either directly (i.e., as prices) or indirectly (i.e., derived from prices); and
• Level 3: Inputs for the asset or liability that are not based on observable market data
(unobservable inputs).
If the inputs used to measure the fair value of an asset or a liability fall into different levels
of the fair value hierarchy, then the fair value measurement is categorised in its entirety
in the same level of the fair value hierarchy as the lowest level input that is significant to
the entire measurement (with Level 3 being the lowest).

LENDLEASE GLOBAL COMMERCIAL REIT
UNAUDITED CONDENSED INTERIM FINANCIAL STATEMENTS AND DISTRIBUTION ANNOUNCEMENT FOR THE FULL YEAR ENDED 30 JUNE 2021 AND SECOND FINANCIAL HALF YEAR PERIOD FROM 1 JANUARY 2021 TO 30 JUNE 2021
Page 20 of 44
The Group recognises transfers between levels of the fair value hierarchy as of the end
of the reporting period during which the change has occurred.
Further information about the assumptions made in measuring fair values is included in
the following notes:
• Note iii: Investment properties;
• Note iv: Investment property under development: and
• Note v: Equity instrument at fair value
Segment reporting
An operating segment is a component of the Group that engages in business activities
from which it may earn revenue and incur expenses, including revenues and expenses
that relate to transactions with any of the Group’s other components. All operating
segments’ operating results are reviewed regularly by the Group’s Chief Operating
Decision Makers (“CODMs”) which comprise mainly the Board of Directors including the
Chief Executive Officer (“CEO”) of the Manager to make decisions about resources to be
allocated to the segment and assess its performance, and for which discrete financial
information is available.
Segment results include items directly attributable to a segment as well as those that can
be allocated on a reasonable basis.
Unallocated items mainly comprise fees, other trust expenses, foreign exchange
gain/loss, finance cost, interest and other income, fair value of derivative financial
instruments and income tax expense as these are centrally manage by the Group.
Segment capital expenditure is the total cost incurred during the year to acquire plant
and equipment, investment properties and investment property under development.
i Gross revenue and operating segment
Operating segment
For segment reporting purpose, the primary segment is by geography and it comprises
Singapore and Italy. The Group’s reportable operating segments are as follow:
(i) Singapore – leasing of property retail mall in Singapore.
(ii) Italy – leasing of Sky Complex, comprising three office buildings in Milan, Italy.
Segment information is presented in respect of the Group’s geographical segments. The
operations of each of the Group’s geographical segments are separately managed
because of different economic and regulatory environments in which they operate in. For
the purpose of making resource allocation and the assessment of segment performance,
the Group’s CODMs have focused on its investment properties. For each of the reporting
segments, the Manager reviews internal management reports on a monthly basis. This
forms the basis of identifying the operating segments of the Group under IFRS 8
Operating Segments.

LENDLEASE GLOBAL COMMERCIAL REIT
UNAUDITED CONDENSED INTERIM FINANCIAL STATEMENTS AND DISTRIBUTION ANNOUNCEMENT FOR THE FULL YEAR ENDED 30 JUNE 2021 AND SECOND FINANCIAL HALF YEAR PERIOD FROM 1 JANUARY 2021 TO 30 JUNE 2021
Page 21 of 44
i Gross revenue and operating segment
Operating segment
Singapore Italy Group
(S$’000) (S$’000) (S$’000)
6 months ended 30 Jun 2021
Revenue
Gross revenue 23,899 13,144 37,043
Property operating expenses (9,232) (1,286) (10,518)
Total segment net property income 14,667 11,858 26,525
Dividend income 1,731 - 1,731
Unallocated items:
Manager's base fees (1,963)
Manager's performance fees (1,403)
Other management fees (400)
Trustee's fee (106)
Other trust expenses (1,121)
Net foreign exchange gain/(loss) 5,414
Finance income 11
Finance costs (4,983)
Profit/(Loss) before tax and change in fair value 23,705
Fair value gains/(losses) of investment properties & investment
property under development (25,385) (5,899) (31,284)
Fair value gains/(losses) of equity instrument (942) - (942)
Unallocated item:
Fair value gains/(losses) of derivative financial instruments 2,724
Profit/(Loss) before tax (5,797)
Segment assets 1,270,292 466,823 1,737,115
Segment liabilities 575,920 4,396 580,316

LENDLEASE GLOBAL COMMERCIAL REIT
UNAUDITED CONDENSED INTERIM FINANCIAL STATEMENTS AND DISTRIBUTION ANNOUNCEMENT FOR THE FULL YEAR ENDED 30 JUNE 2021 AND SECOND FINANCIAL HALF YEAR PERIOD FROM 1 JANUARY 2021 TO 30 JUNE 2021
Page 22 of 44
i Gross revenue and operating segment
Operating segment
Singapore Italy Group
(S$’000) (S$’000) (S$’000)
6 months ended 30 Jun 2020
Revenue
Gross revenue 21,506 12,623 34,129
Property operating expenses (8,783) (1,237) (10,020)
Total segment net property income 12,723 11,386 24,109
Unallocated items:
Manager's base fees (1,899)
Manager's performance fees (1,206)
Other management fees (395)
Trustee's fee (99)
Other trust expenses (779)
Net foreign exchange gain/(loss) (16,015)
Finance income 465
Finance costs (4,785)
Profit/(Loss) before tax and change in fair value (604)
Fair value gains/(losses) of investment properties 6,022 22,873 28,895
Unallocated item:
Fair value gains/(losses) of derivative financial instruments (4,254)
Profit/(Loss) before tax 24,037
Segment assets 1,079,126 476,372 1,555,498
Segment liabilities 558,976 4,272 563,248

LENDLEASE GLOBAL COMMERCIAL REIT
UNAUDITED CONDENSED INTERIM FINANCIAL STATEMENTS AND DISTRIBUTION ANNOUNCEMENT FOR THE FULL YEAR ENDED 30 JUNE 2021 AND SECOND FINANCIAL HALF YEAR PERIOD FROM 1 JANUARY 2021 TO 30 JUNE 2021
Page 23 of 44
i Gross revenue and operating segment
Operating segment
Singapore Italy Group
(S$’000) (S$’000) (S$’000)
FY2021
Revenue
Gross revenue 52,336 26,315 78,651
Property operating expenses (19,127) (2,606) (21,733)
Total segment net property income 33,209 23,709 56,918
Dividend income 1,731 - 1,731
Unallocated items:
Manager's base fees (3,933)
Manager's performance fees (2,923)
Other management fees (801)
Trustee's fee (209)
Other trust expenses (2,561)
Net foreign exchange gain/(loss) (9,219)
Finance income 51
Finance costs (10,040)
Profit/(Loss) before tax and change in fair value 29,014
Fair value gains/(losses) of investment properties & investment
property under development (25,385) (5,899) (31,284)
Fair value gains/(losses) of equity instrument (942) - (942)
Unallocated item:
Fair value gains/(losses) of derivative financial instruments 1,873
Profit/(Loss) before tax (1,339)
Segment assets 1,270,292 466,823 1,737,115
Segment liabilities 575,920 4,396 580,316

LENDLEASE GLOBAL COMMERCIAL REIT
UNAUDITED CONDENSED INTERIM FINANCIAL STATEMENTS AND DISTRIBUTION ANNOUNCEMENT FOR THE FULL YEAR ENDED 30 JUNE 2021 AND SECOND FINANCIAL HALF YEAR PERIOD FROM 1 JANUARY 2021 TO 30 JUNE 2021
Page 24 of 44
i Gross revenue and operating segment
Operating segment
Breakdown of gross revenue
Singapore Italy Group
(S$’000) (S$’000) (S$’000)
For the period from 28 January 2019 to 30 June 2020
Revenue
Gross revenue 36,844 18,692 55,536
Property operating expenses (13,434) (1,813) (15,247)
Total segment net property income 23,410 16,879 40,289
Unallocated items:
Manager's base fees (2,850)
Manager's performance fees (2,015)
Other management fees (580)
Trustee's fee (148)
Other trust expenses (1,228)
Net foreign exchange gain/(loss) (10,999)
Finance income 531
Finance costs (7,240)
Profit/(Loss) before tax and change in fair value 15,760
Fair value gains/(losses) of investment properties (30,319) 10,217 (20,102)
Unallocated item:
Fair value gains/(losses) of derivative financial instruments (4,274)
Profit/(Loss) before tax (8,616)
Segment assets 1,079,126 476,372 1,555,498
Segment liabilities 558,976 4,272 563,248
FY2021
2 Oct 2019
(Listing Date)
to 30 Jun 2020
Variance
%
Gross revenue reported for first half year 41,608 21,407 94.4
Profit/(Loss) after tax reported for first half year 4,458 (32,653) NM
Gross revenue reported for second half year 37,043 34,129 8.5
Profit/(Loss) after tax reported for second half year (5,797) 24,037 NM
Group
(S$’000)

LENDLEASE GLOBAL COMMERCIAL REIT
UNAUDITED CONDENSED INTERIM FINANCIAL STATEMENTS AND DISTRIBUTION ANNOUNCEMENT FOR THE FULL YEAR ENDED 30 JUNE 2021 AND SECOND FINANCIAL HALF YEAR PERIOD FROM 1 JANUARY 2021 TO 30 JUNE 2021
Page 25 of 44
i Gross revenue and operating segment
Breakdown of gross revenue
Turnover rent is contingent rent derived from operating leases.
ii Cash and cash equivalents
The increase in cash and cash equivalents is mainly due to the issuance of $200 million
of perpetual securities.
iii Investment properties
6 months ended
30 Jun 2021
6 months ended
30 Jun 2020FY2021
2 Oct 2019
(Listing Date)
to 30 Jun 2020
Rental income 34,628 32,588 73,998 52,600
Turnover rent 461 424 1,276 905
Other property income 1,954 1,117 3,377 2,031
37,043 34,129 78,651 55,536
(S$’000)
GroupGroup
(S$’000)
30 Jun 2021 30 Jun 2020 30 Jun 2021 30 Jun 2020
Cash at banks and on hand 49,264 46,678 32,768 23,664
Fixed deposits with financial institution 200,000 37,000 200,000 37,000
249,264 83,678 232,768 60,664
Group LREIT
(S$’000) (S$’000)
GROUP GROUP
30 Jun 2021
(S$’000)
30 Jun 2020
(S$’000)
Property
Singapore 983,000 1,008,000
Italy 436,857 434,598
Investment Properties 1,419,857 1,442,598
GROUP GROUP
30 Jun 2021
(S$'000)
2 Oct 2019
to 30 Jun 2020
(S$'000)
Balance as at the beginning of the period 1,442,598 -
Acquisitions (including acquisition costs) - 1,451,542
Capital expenditure 2,525 624
Currency translation difference 8,159 10,534
Change in fair value of investment properties (33,425) (20,102)
Balance as at the end of the period 1,419,857 1,442,598
LENDLEASE GLOBAL COMMERCIAL REIT
UNAUDITED CONDENSED INTERIM FINANCIAL STATEMENTS AND DISTRIBUTION ANNOUNCEMENT FOR THE FULL YEAR ENDED 30 JUNE 2021 AND SECOND FINANCIAL HALF YEAR PERIOD FROM 1 JANUARY 2021 TO 30 JUNE 2021
Page 26 of 44
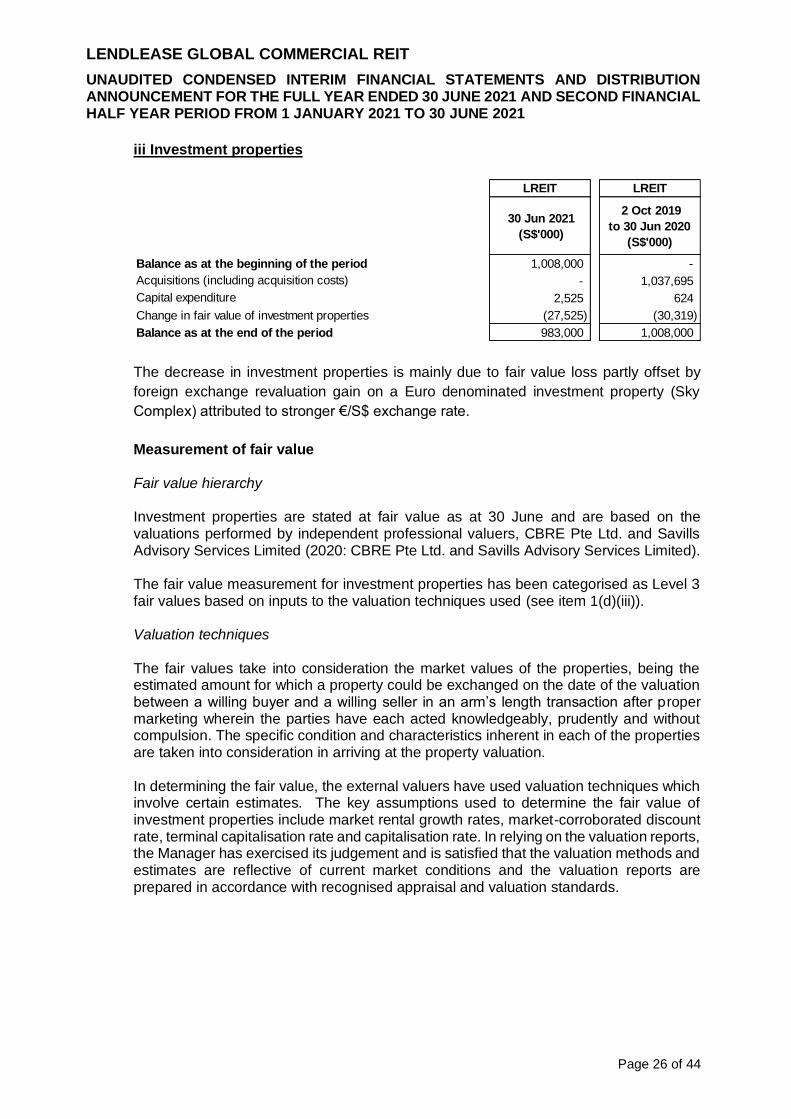
iii Investment properties
The decrease in investment properties is mainly due to fair value loss partly offset by
foreign exchange revaluation gain on a Euro denominated investment property (Sky
Complex) attributed to stronger €/S$ exchange rate.
Measurement of fair value
Fair value hierarchy Investment properties are stated at fair value as at 30 June and are based on the valuations performed by independent professional valuers, CBRE Pte Ltd. and Savills Advisory Services Limited (2020: CBRE Pte Ltd. and Savills Advisory Services Limited). The fair value measurement for investment properties has been categorised as Level 3 fair values based on inputs to the valuation techniques used (see item 1(d)(iii)).
Valuation techniques The fair values take into consideration the market values of the properties, being the estimated amount for which a property could be exchanged on the date of the valuation between a willing buyer and a willing seller in an arm’s length transaction after proper marketing wherein the parties have each acted knowledgeably, prudently and without compulsion. The specific condition and characteristics inherent in each of the properties are taken into consideration in arriving at the property valuation. In determining the fair value, the external valuers have used valuation techniques which involve certain estimates. The key assumptions used to determine the fair value of investment properties include market rental growth rates, market-corroborated discount rate, terminal capitalisation rate and capitalisation rate. In relying on the valuation reports, the Manager has exercised its judgement and is satisfied that the valuation methods and estimates are reflective of current market conditions and the valuation reports are prepared in accordance with recognised appraisal and valuation standards.
LREIT LREIT
30 Jun 2021
(S$'000)
2 Oct 2019
to 30 Jun 2020
(S$'000)
Balance as at the beginning of the period 1,008,000 -
Acquisitions (including acquisition costs) - 1,037,695
Capital expenditure 2,525 624
Change in fair value of investment properties (27,525) (30,319)
Balance as at the end of the period 983,000 1,008,000

LENDLEASE GLOBAL COMMERCIAL REIT
UNAUDITED CONDENSED INTERIM FINANCIAL STATEMENTS AND DISTRIBUTION ANNOUNCEMENT FOR THE FULL YEAR ENDED 30 JUNE 2021 AND SECOND FINANCIAL HALF YEAR PERIOD FROM 1 JANUARY 2021 TO 30 JUNE 2021
Page 27 of 44
iii Investment properties
Valuation techniques
The external valuers have considered valuation techniques including the income capitalisation method and discounted cash flow analysis in arriving at the open market value as at the reporting date. The external valuers have considered all available information as at 30 June relating to COVID-19 and have made necessary adjustments to the valuation. The valuation reports also highlighted that given the unprecedented set of circumstances on which to base a judgement, less certainty, and a higher degree of caution, should be attached to their valuations than would normally be the case. Due to the unknown future impact that COVID-19 might have on the real estate market, the external valuers have also recommended to keep the valuation of these properties under frequent review. The discounted cash flow analysis involves the estimation and projection of a net income stream over a period and discounting the net income stream with an internal rate of return to arrive at the market value. The discounted cash flow analysis requires the external valuers to assume a rental growth rate indicative of market and the selection of a target internal rate of return consistent with current market requirements. The capitalisation method is an investment approach whereby the estimated gross passing income (on both a passing and market rent basis) has been adjusted against anticipated operating costs to produce a net income on a fully leased basis. The adopted fully leased net income is capitalised at an appropriate investment yield. Thereafter, various adjustments including assumed vacancy allowance are made, where appropriate, for the capitalisation method.
Key unobservable inputs The following table shows the key unobservable inputs used in the valuation models:
Valuation technique Key unobservable inputs
Inter-relationship between key unobservable inputs and fair value measurement
Discounted cash flows analysis
• Discount rate of 6.15% to 6.75% (2020: 6.00% to 6.75%)
• Terminal capitalisation rate of 4.40% to 5.25% (2020: 4.40% to 5.25%)
• 10-year average market rental growth rate of 2.85% (2020: 2.80%)
The estimated fair value would increase (decrease) if discount rate was lower (higher). The estimated fair value would increase (decrease) if terminal capitalisation rate was lower (higher). The estimated fair value would increase (decrease) if 10-year average market rental growth rate was higher (lower).
Capitalisation method
• Capitalisation rate of 4.25% (2020: 4.25%)
The estimated fair value would increase (decrease) if capitalisation rate was lower (higher).

LENDLEASE GLOBAL COMMERCIAL REIT
UNAUDITED CONDENSED INTERIM FINANCIAL STATEMENTS AND DISTRIBUTION ANNOUNCEMENT FOR THE FULL YEAR ENDED 30 JUNE 2021 AND SECOND FINANCIAL HALF YEAR PERIOD FROM 1 JANUARY 2021 TO 30 JUNE 2021
Page 28 of 44
iv Investment property under development
Investment property under development relates to development of a site adjacent to
313@somerset into a multi-functional event space.
Measurement of fair value
Fair value hierarchy
Investment property under development is stated at fair value as at 30 June and is based on the valuation performed by independent professional valuer, CBRE Pte Ltd.. The fair value measurement for investment property under development has been categorised as a Level 3 fair values based on the inputs to the valuation techniques used (see item 1(d)(iii)).
Level 3 fair value measurement Reconciliation of movements in Level 3 fair value measurement The reconciliation of Level 3 fair value measurements for investment property under development is presented in the table above.
GROUP GROUP
30 Jun 2021
(S$'000)
2 Oct 2019
to 30 Jun 2020
(S$'000)
Balance as at the beginning of the period - -
Recognition of right-of-use-asset on initial application of IFRS 16 2,521 -
Development expenditure capitalised 859 -
Net change in fair value of investment property under development 2,141 -
Balance as at the end of the period 5,521 -
LREIT LREIT
30 Jun 2021
(S$'000)
2 Oct 2019
to 30 Jun 2020
(S$'000)
Balance as at the beginning of the period - -
Recognition of right-of-use-asset on initial application of IFRS 16 2,521 -
Development expenditure capitalised 859 -
Net change in fair value of investment property under development 2,141 -
Balance as at the end of the period 5,521 -

LENDLEASE GLOBAL COMMERCIAL REIT
UNAUDITED CONDENSED INTERIM FINANCIAL STATEMENTS AND DISTRIBUTION ANNOUNCEMENT FOR THE FULL YEAR ENDED 30 JUNE 2021 AND SECOND FINANCIAL HALF YEAR PERIOD FROM 1 JANUARY 2021 TO 30 JUNE 2021
Page 29 of 44
iv Investment property under development
Valuation techniques In determining the fair value of investment property under development, the valuers have adopted the residual method whereby the estimated development costs to be incurred and developer’s profit are deducted from the gross development value to arrive at the residual value. The gross development value is the estimated value of the property assuming satisfactory completion of the development as at the date of valuation and is determined using the income capitalisation method and discounted cash flow analysis
(see item 1(d)(iii)). The key assumptions include the estimation of net income based on rental assumption which are considered in line with prevailing market conditions and general market practice within Singapore, a market-corroborated discount rate, terminal capitalisation rate, capitalisation rate and estimated development costs to be incurred.
Key unobservable inputs
The following table shows the key unobservable inputs used in the valuation models:
Valuation technique Key unobservable inputs
Inter-relationship between key unobservable inputs and fair value measurement
Residual method Discounted cash flow
analysis
• Discount rate of 8.50%
• Terminal capitalisation rate of 8.50% Capitalisation methods
• Capitalisation rate of 8.50% Estimated development costs to be incurred (including land costs)
The estimated fair value would increase (decrease) if discount rate was lower (higher). The estimated fair value would increase (decrease) if terminal capitalisation rate was lower (higher). The estimated fair value would increase (decrease) if capitalisation rate was lower (higher). The estimated fair value would increase (decrease) if the estimated development costs to be incurred (including land costs) were lower (higher).
LENDLEASE GLOBAL COMMERCIAL REIT
UNAUDITED CONDENSED INTERIM FINANCIAL STATEMENTS AND DISTRIBUTION ANNOUNCEMENT FOR THE FULL YEAR ENDED 30 JUNE 2021 AND SECOND FINANCIAL HALF YEAR PERIOD FROM 1 JANUARY 2021 TO 30 JUNE 2021
Page 30 of 44
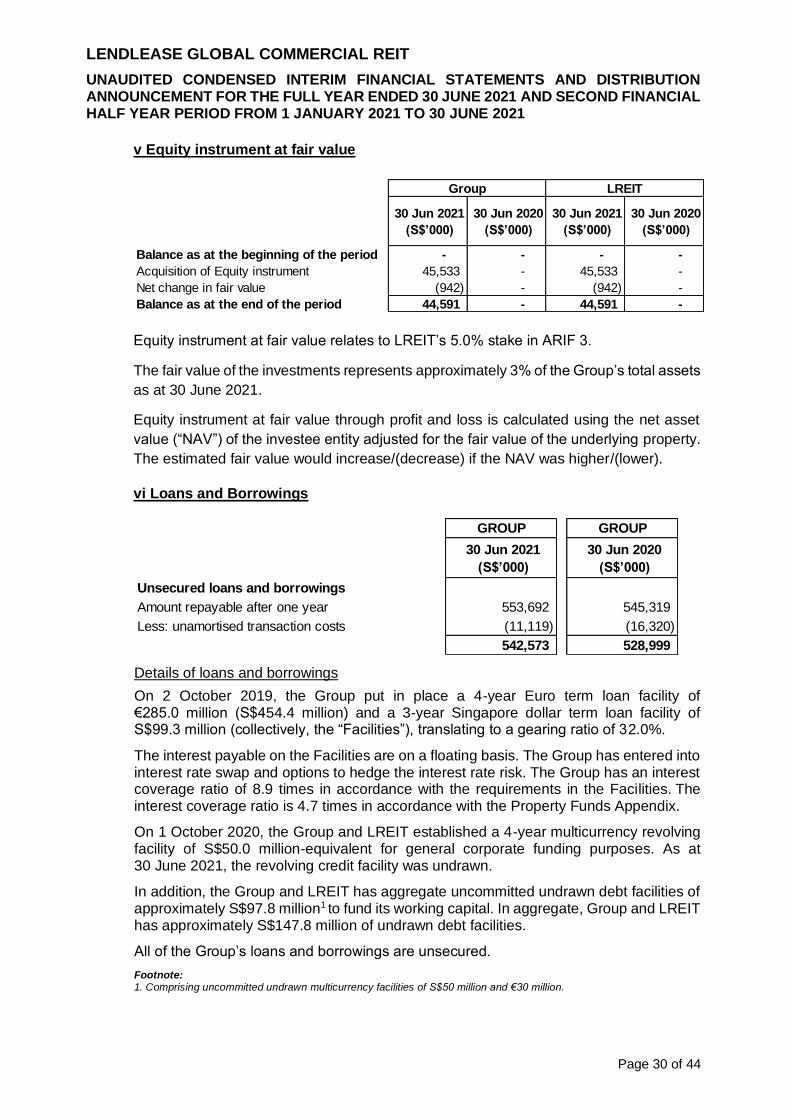
v Equity instrument at fair value
Equity instrument at fair value relates to LREIT’s 5.0% stake in ARIF 3.
The fair value of the investments represents approximately 3% of the Group’s total assets
as at 30 June 2021.
Equity instrument at fair value through profit and loss is calculated using the net asset
value (“NAV”) of the investee entity adjusted for the fair value of the underlying property.
The estimated fair value would increase/(decrease) if the NAV was higher/(lower).
vi Loans and Borrowings
Details of loans and borrowings
On 2 October 2019, the Group put in place a 4-year Euro term loan facility of €285.0 million (S$454.4 million) and a 3-year Singapore dollar term loan facility of S$99.3 million (collectively, the “Facilities”), translating to a gearing ratio of 32.0%.
The interest payable on the Facilities are on a floating basis. The Group has entered into interest rate swap and options to hedge the interest rate risk. The Group has an interest coverage ratio of 8.9 times in accordance with the requirements in the Facilities. The interest coverage ratio is 4.7 times in accordance with the Property Funds Appendix.
On 1 October 2020, the Group and LREIT established a 4-year multicurrency revolving facility of S$50.0 million-equivalent for general corporate funding purposes. As at 30 June 2021, the revolving credit facility was undrawn.
In addition, the Group and LREIT has aggregate uncommitted undrawn debt facilities of approximately S$97.8 million1 to fund its working capital. In aggregate, Group and LREIT has approximately S$147.8 million of undrawn debt facilities.
All of the Group’s loans and borrowings are unsecured.
Footnote: 1. Comprising uncommitted undrawn multicurrency facilities of S$50 million and €30 million.
30 Jun 2021
(S$’000)
30 Jun 2020
(S$’000)
30 Jun 2021
(S$’000)
30 Jun 2020
(S$’000)
Balance as at the beginning of the period - - - -
Acquisition of Equity instrument 45,533 - 45,533 -
Net change in fair value (942) - (942) -
Balance as at the end of the period 44,591 - 44,591 -
Group LREIT
GROUP GROUP
30 Jun 2021
(S$’000)
30 Jun 2020
(S$’000)
Unsecured loans and borrowings
Amount repayable after one year 553,692 545,319
Less: unamortised transaction costs (11,119) (16,320)
542,573 528,999
LENDLEASE GLOBAL COMMERCIAL REIT
UNAUDITED CONDENSED INTERIM FINANCIAL STATEMENTS AND DISTRIBUTION ANNOUNCEMENT FOR THE FULL YEAR ENDED 30 JUNE 2021 AND SECOND FINANCIAL HALF YEAR PERIOD FROM 1 JANUARY 2021 TO 30 JUNE 2021
Page 31 of 44
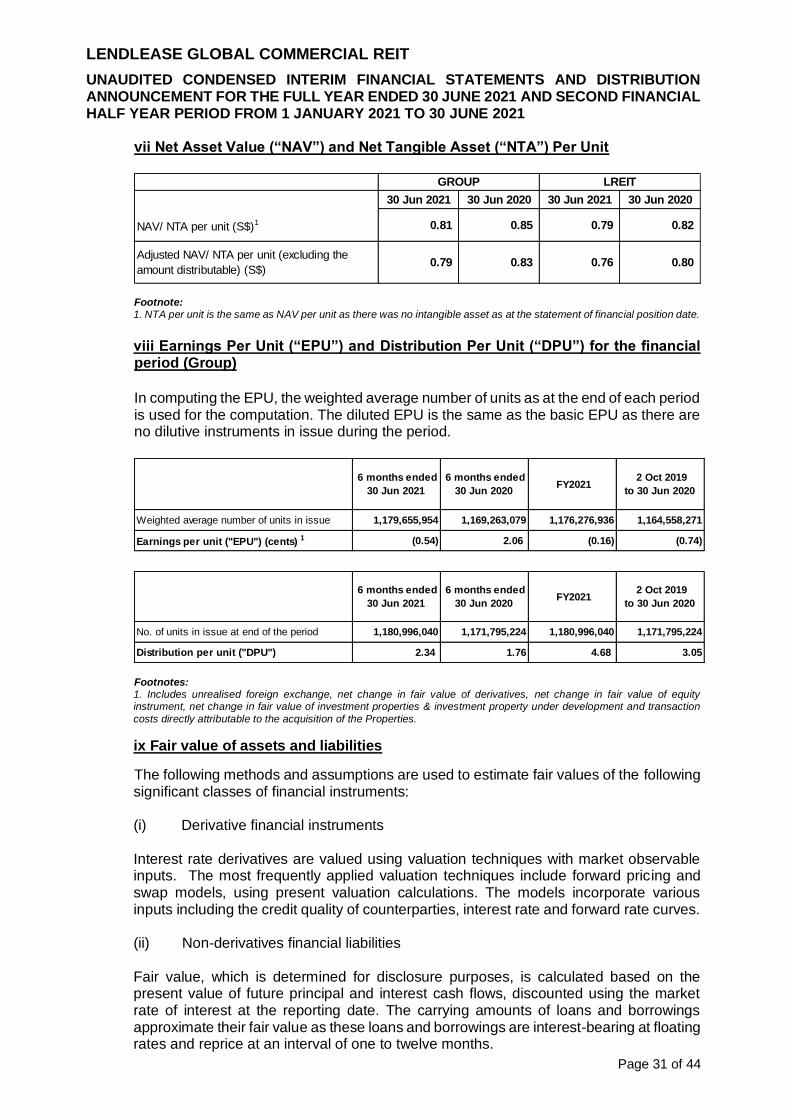
vii Net Asset Value (“NAV”) and Net Tangible Asset (“NTA”) Per Unit
Footnote: 1. NTA per unit is the same as NAV per unit as there was no intangible asset as at the statement of financial position date.
viii Earnings Per Unit (“EPU”) and Distribution Per Unit (“DPU”) for the financial period (Group)
In computing the EPU, the weighted average number of units as at the end of each period is used for the computation. The diluted EPU is the same as the basic EPU as there are no dilutive instruments in issue during the period.
Footnotes: 1. Includes unrealised foreign exchange, net change in fair value of derivatives, net change in fair value of equity instrument, net change in fair value of investment properties & investment property under development and transaction
costs directly attributable to the acquisition of the Properties.
ix Fair value of assets and liabilities
The following methods and assumptions are used to estimate fair values of the following significant classes of financial instruments:
(i) Derivative financial instruments
Interest rate derivatives are valued using valuation techniques with market observable inputs. The most frequently applied valuation techniques include forward pricing and swap models, using present valuation calculations. The models incorporate various inputs including the credit quality of counterparties, interest rate and forward rate curves. (ii) Non-derivatives financial liabilities Fair value, which is determined for disclosure purposes, is calculated based on the present value of future principal and interest cash flows, discounted using the market rate of interest at the reporting date. The carrying amounts of loans and borrowings approximate their fair value as these loans and borrowings are interest-bearing at floating rates and reprice at an interval of one to twelve months.
30 Jun 2021 30 Jun 2020 30 Jun 2021 30 Jun 2020
NAV/ NTA per unit (S$)1 0.81 0.85 0.79 0.82
Adjusted NAV/ NTA per unit (excluding the
amount distributable) (S$)0.79 0.83 0.76 0.80
GROUP LREIT
6 months ended
30 Jun 2021
6 months ended
30 Jun 2020 FY2021
2 Oct 2019
to 30 Jun 2020
Weighted average number of units in issue 1,179,655,954 1,169,263,079 1,176,276,936 1,164,558,271
Earnings per unit ("EPU") (cents) 1 (0.54) 2.06 (0.16) (0.74)
6 months ended
30 Jun 2021
6 months ended
30 Jun 2020 FY2021
2 Oct 2019
to 30 Jun 2020
No. of units in issue at end of the period 1,180,996,040 1,171,795,224 1,180,996,040 1,171,795,224
Distribution per unit ("DPU") 2.34 1.76 4.68 3.05

LENDLEASE GLOBAL COMMERCIAL REIT
UNAUDITED CONDENSED INTERIM FINANCIAL STATEMENTS AND DISTRIBUTION ANNOUNCEMENT FOR THE FULL YEAR ENDED 30 JUNE 2021 AND SECOND FINANCIAL HALF YEAR PERIOD FROM 1 JANUARY 2021 TO 30 JUNE 2021
Page 32 of 44
ix Fair value of assets and liabilities (iii) Financial instruments that are not measured at fair value Other non-derivative financial liabilities are measured at fair value at initial recognition and for disclosure purposes, at each annual reporting date. Fair value is calculated based on the present value of future principal and interest cash flows, discounted at the market rate of interest at the measurement date. Other non-derivative financial liabilities include loans and borrowings. Interest rates used in determining fair values The weighted average interest rates used to discount estimated cash flows, where applicable, are based on forward rates as at 30 June plus a credit spread, and are as follows:
GROUP LREIT
FY2021 FY2020 FY2021 FY2020
% % % %
Unsecured interest-bearing term loans 0.52 0.52 0.52 0.52
(iv) Financial instruments for which fair value is equal to the carrying value These financial instruments include cash and cash equivalents, trade and other receivables, other current assets, other non-current assets and trade and other payables. The carrying amounts of these financial instruments are approximations of their fair values because they are either short term in nature or effect of discounting is immaterial. (v) Equity instrument at fair value
The fair value measurement for equity instrument at fair value has been categorised as Level 3 fair values based on inputs to the valuation techniques used.
The fair value of the equity instrument is calculated using the net asset value of the unquoted entity adjusted for the fair value of the underlying property. The estimated fair value would increase/(decrease) if the net asset value was higher/(lower).
Accounting classifications and fair values The fair values of financial assets and liabilities, together with the carrying amounts shown in the statements of financial position, are as follows. It does not include fair value information for financial assets and financial liabilities not measured at fair value if the carrying amount is a reasonable approximation of fair value.

LENDLEASE GLOBAL COMMERCIAL REIT
UNAUDITED CONDENSED INTERIM FINANCIAL STATEMENTS AND DISTRIBUTION ANNOUNCEMENT FOR THE FULL YEAR ENDED 30 JUNE 2021 AND SECOND FINANCIAL HALF YEAR PERIOD FROM 1 JANUARY 2021 TO 30 JUNE 2021
Page 33 of 44
ix Fair value of assets and liabilities
Footnotes: 1. Excludes grant receivables and net VAT receivables. 2. Excludes deposits and prepayments.
3. Excludes rental received in advance, grant payables and net GST payables.
At Total
amortised
costFVTPL
carrying
amount
30 June 2021
Group
Financial assets not measured at fair value
Trade and other receivables1 861 - - 861
Other non-current assets 869 - - 869
Cash and cash equivalents 249,264 - - 249,264
Other current assets2 1,766 - - 1,766
252,760 - - 252,760
Financial assets measured at fair value
Equity instrument at fair value - 44,591 - 44,591 - - 44,591 44,591
Derivative financial asset - 128 - 128 - 128 - 128
- 44,719 - 44,719
Financial liabilities not measured at fair value
Trade and other payables 3 - - (26,844) (26,844)
Loans and borrowings - - (542,573) (542,573) - (555,926) - (555,926)
Lease liabilities - - (2,521) (2,521)
- - (571,938) (571,938)
Financial liabilities measured at fair value
Derivative financial liabilities - (2,529) - (2,529) - (2,529) - (2,529)
Carrying amount Fair value
Other
financial
liabilities
Level 1 Level 2 Level 3 Total
$’000

LENDLEASE GLOBAL COMMERCIAL REIT
UNAUDITED CONDENSED INTERIM FINANCIAL STATEMENTS AND DISTRIBUTION ANNOUNCEMENT FOR THE FULL YEAR ENDED 30 JUNE 2021 AND SECOND FINANCIAL HALF YEAR PERIOD FROM 1 JANUARY 2021 TO 30 JUNE 2021
Page 34 of 44
ix Fair value of assets and liabilities
Footnotes: 1. Excludes grant receivables and net VAT/GST receivables. 2. Excludes deposits and prepayments.
3. Excludes rental received in advance and grant payables.
At Total
amortised
costFVTPL
carrying
amount
30 June 2020
Group
Financial assets not measured at fair value
Trade and other receivables1 2,790 - - 2,790
Other non-current assets 1,012 - - 1,012
Cash and cash equivalents 83,678 - - 83,678
Other current assets2 1,222 - - 1,222
88,702 - - 88,702
Financial assets measured at fair value
Derivative financial asset - 149 - 149 - 149 - 149
Financial liabilities not measured at fair value
Trade and other payables 3 - - (23,766) (23,766)
Loans and borrowings - - (528,999) (528,999) - (548,449) - (548,449)
- - (552,765) (552,765)
Financial liabilities measured at fair value
Derivative financial liabilities - (4,423) - (4,423) - (4,423) - (4,423)
$’000
Carrying amount Fair value
Other
financial
liabilities
Level 1 Level 2 Level 3 Total

LENDLEASE GLOBAL COMMERCIAL REIT
UNAUDITED CONDENSED INTERIM FINANCIAL STATEMENTS AND DISTRIBUTION ANNOUNCEMENT FOR THE FULL YEAR ENDED 30 JUNE 2021 AND SECOND FINANCIAL HALF YEAR PERIOD FROM 1 JANUARY 2021 TO 30 JUNE 2021
Page 35 of 44
ix Fair value of assets and liabilities
Footnotes:
1. Excludes grant receivables and net VAT receivables. 2. Excludes deposits and prepayments. 3. Excludes rental received in advance, grant payables and net GST payables.
At Total
amortised
costFVTPL
carrying
amount
30 June 2021
LREIT
Financial assets not measured at fair value
Trade and other receivables1 811 - - 811
Other non-current assets 869 - - 869
Cash and cash equivalents 232,768 - - 232,768
Other current assets2 1,766 - - 1,766
236,214 - - 236,214
Financial assets measured at fair value
Equity instrument at fair value - 44,591 - 44,591 - - 44,591 44,591
Derivative financial asset - 128 - 128 - 128 - 128
- 44,719 - 44,719
Financial liabilities not measured at fair value
Trade and other payables 3 - - (25,695) (25,695)
Loans and borrowings - - (542,573) (542,573) - (555,926) - (555,926)
Lease liabilities - - (2,521) (2,521)
- - (570,789) (570,789)
Financial liabilities measured at fair value
Derivative financial liabilities - (2,529) - (2,529) - (2,529) - (2,529)
$’000
Carrying amount Fair value
Other
financial
liabilities
Level 1 Level 2 Level 3 Total

LENDLEASE GLOBAL COMMERCIAL REIT
UNAUDITED CONDENSED INTERIM FINANCIAL STATEMENTS AND DISTRIBUTION ANNOUNCEMENT FOR THE FULL YEAR ENDED 30 JUNE 2021 AND SECOND FINANCIAL HALF YEAR PERIOD FROM 1 JANUARY 2021 TO 30 JUNE 2021
Page 36 of 44
ix Fair value of assets and liabilities
Footnotes: 1 Excludes grant receivables and net VAT/GST receivables. 2 Excludes deposits and prepayments. 3 Excludes rental received in advance and grant payables.
x Capital commitments As at 30 June 2021, the Group had approximately $2,333,000 capital expenditure contracted but not provided for in the unaudited condensed interim financial statements.
At Total
amortised
costFVTPL
carrying
amount
30 June 2020
LREIT
Financial assets not measured at fair value
Trade and other receivables1 2,790 - - 2,790
Other non-current assets 1,012 - - 1,012
Cash and cash equivalents 60,664 - - 60,664
Other current assets2 1,222 - - 1,222
65,688 - - 65,688
Financial assets measured at fair value
Derivative financial asset - 149 - 149 - 149 - 149
Financial liabilities not measured at fair value
Trade and other payables 3 - - (22,793) (22,793)
Loans and borrowings - - (528,999) (528,999) - (548,449) - (548,449)
- - (551,792) (551,792)
Financial liabilities measured at fair value
Derivative financial liabilities - (4,423) - (4,423) - (4,423) - (4,423)
$’000
Carrying amount Fair value
Other
financial
liabilities
Level 1 Level 2 Level 3 Total

LENDLEASE GLOBAL COMMERCIAL REIT
UNAUDITED CONDENSED INTERIM FINANCIAL STATEMENTS AND DISTRIBUTION ANNOUNCEMENT FOR THE FULL YEAR ENDED 30 JUNE 2021 AND SECOND FINANCIAL HALF YEAR PERIOD FROM 1 JANUARY 2021 TO 30 JUNE 2021
Page 37 of 44
xi Subsequent events
In the Extraordinary General Meeting held on 26 July 2021, the Unitholders have voted with 99.91% in favour of the proposed acquisition of shares in Lendlease Jem Partners Fund Limited and Lendlease Asian Retail Investment Fund 3 Limited.
2 The condensed interim financial statements and distribution announcement for the full year ended 30 June 2021 and second financial half year period from 1 January 2021 to 30 June 2021 including the explanatory notes have not been audited or reviewed.
3 Review of Performance
NM: Not meaningful
Footnotes: 1. Net foreign exchange loss is not annualised as foreign exchange loss is based on foreign exchange rate differences.
2. The annualised results for FY2020 is based on the actual results from 2 October 2019 to 30 June 2020 (273 days) pro-rated to 366 days.
6 months ended: 30 Jun 2021 vs 30 Jun 2020
Gross revenue of S$37.0 million for the period was S$2.9 million or 8.5% higher than the 6 months ended 30 June 2020. The higher revenue was attributed to decrease in rental waivers granted by LREIT to the tenants at 313@somerset and higher revenue from Sky Complex due to foreign exchange.
Property operating expenses were S$10.5 million or 5.0% higher than the 6 months ended 30 June 2020. The higher expenses were mainly attributed to net provision for doubtful debts of $0.7 million and higher expenses from Sky Complex due to foreign exchange. This is partly offset by lower expenses contributed from marketing, insurances, salary & related expenses and operating expenses.
As a result, net property income for the period was S$26.5 million or 10% higher than the 6 months ended 30 June 2020.
After accounting for management fees and other trust expenses, the amount distributable to Unitholders was S$27.6 million, translating to a DPU of 2.34 cents, which is 32.8% higher than the 6 months ended 30 June 2020.
Actual Annualised 2
Consolidated Statement of Profit or Loss FY2021 FY2020
Gross revenue 37,043 34,129 8.5 78,651 74,455 5.6
Property operating expenses (10,518) (10,020) (5.0) (21,733) (20,441) (6.3)
Net property income 26,525 24,109 10.0 56,918 54,014 5.4
Manager’s base fee (1,963) (1,899) (3.4) (3,933) (3,821) (2.9)
Manager’s performance fee (1,403) (1,206) (16.3) (2,923) (2,701) (8.2)
Other management fees (400) (395) (1.3) (801) (778) (3.0)
Trustee's fee (106) (99) (7.1) (209) (198) (5.6)
Other trust expense (1,121) (779) (43.9) (2,561) (1,646) (55.6)
Net foreign exchange gain/(loss) 1 5,414 (16,015) NM (9,219) (10,999) 16.2
Dividend income 1,731 - NM 1,731 - NM
Finance income 11 465 (97.6) 51 712 (92.8)
Finance costs (4,983) (4,785) (4.1) (10,040) (9,706) (3.4)
Profit/(Loss) before tax and change in fair
value23,705 (604) NM 29,014 24,877 16.6
Amount available for distribution to
Unitholders27,577 20,660 33.5 55,123 47,824 15.3
Available distribution per unit (cents) 2.34 1.76 32.8 4.68 4.08 14.6
6 months
ended
30 Jun 2021
6 months
ended
30 Jun 2020
Variance
%
GROUP
(S$’000) (S$’000)
Variance
%

LENDLEASE GLOBAL COMMERCIAL REIT
UNAUDITED CONDENSED INTERIM FINANCIAL STATEMENTS AND DISTRIBUTION ANNOUNCEMENT FOR THE FULL YEAR ENDED 30 JUNE 2021 AND SECOND FINANCIAL HALF YEAR PERIOD FROM 1 JANUARY 2021 TO 30 JUNE 2021
Page 38 of 44
3 Review of Performance
Full year ended: Actual vs Annualised
Gross revenue of S$78.7 million for the period was S$4.2 million or 5.6% higher than the annualised 12 months ended 30 June 2020. The higher revenue was attributed to decrease in rental waivers granted by LREIT to the tenants at 313@somerset and higher revenue from Sky Complex due to foreign exchange.
Property operating expenses were S$1.3 million or 6.3% higher than the annualised 12 months ended 30 June 2020. The higher expenses were mainly attributed to provision for doubtful debts of $2.3 million and higher expenses from Sky Complex due to foreign exchange. This is partly offset by lower expenses contributed from marketing, insurances, salary & related expenses, operating expenses and utilities expenses.
As a result, net property income for the period was S$56.9 million or 5.4% higher than the annualised 12 months ended 30 June 2020. After accounting for management fees and other trust expenses, the amount distributable to Unitholders was S$55.1 million, translating to a DPU of 4.68 cents, which is 14.6% higher than the annualised 12 months ended 30 June 2020.
4 Variance between Actual and Forecast Results
The Manager had made announcements on 9 April 2020 and 20 April 2020 respectively, with regard to the IPO profit and distribution forecast for the financial year ending 30 June 2020 and the profit and distribution projection for the financial year ending 30 June 2021, as it may no longer be a fair basis against which the actual performance of LREIT could be compared given current circumstances. Please refer to “Review of performance” for a review of the actual results for the period against the annualised results for the same period in the previous financial period.
5 Commentary on the competitive conditions of the industry in which the group
operates and any known factors or events that may affect the group in the next reporting period and the next 12 months The International Monetary Fund has projected the global economy to grow 6%1 and 4.4%1 in 2021 and 2022, respectively. The projections are 0.81 percentage point (for 2021) and 0.21 percentage point (for 2022) stronger than its forecast in October 2020, which reflects higher-than-expected growth outturns in the second half of 2021 for most regions after lockdowns were eased and as economies adapted to new ways of working. While growth, in general, recovered stronger than expected, it remains below pre-pandemic trends across most countries. The second and third infection waves have necessitated renewed restrictions in many countries, and this stop-go rhythm means that recovery is uneven and far from complete. Future economic developments will depend on the path of the health crisis, including whether the new COVID-19 strains prove susceptible to vaccines, the effectiveness of policy actions to limit persistent economic damage and the evolution of economic financial conditions.
1 International Monetary Fund, World Economic Outlook, April 2021: Managing Divergent Recoveries

LENDLEASE GLOBAL COMMERCIAL REIT
UNAUDITED CONDENSED INTERIM FINANCIAL STATEMENTS AND DISTRIBUTION ANNOUNCEMENT FOR THE FULL YEAR ENDED 30 JUNE 2021 AND SECOND FINANCIAL HALF YEAR PERIOD FROM 1 JANUARY 2021 TO 30 JUNE 2021
Page 39 of 44
5 Commentary on the competitive conditions of the industry in which the group
operates and any known factors or events that may affect the group in the next reporting period and the next 12 months
Singapore Based on advance estimates by the Ministry of Trade and Industry, the Singapore economy grew by 14.3%2 year-on-year (“YoY”) in the second quarter of 2021. This was largely due to the low base in the second quarter of 2020 when the economy fell by 13.3%2 due to the Circuit Breaker (CB) measures implemented from 7 April to 1 June 2020. Retail sales grew approximately 19%3 YoY in the first five months of 2021. In May 2021, retail sales increased 79.7%3 YoY, up 25.73 percentage points recorded in April 2021. Similarly, the significant YoY growth was attributed to the low base in May 2020 when the CB measures were put in place to contain the COVID-19 outbreak. The Singapore government continued to adopt more targeted approach to calibrate the resumption of economic and community activities. Following the implementation of Phase 2 (Heightened Alert) on 14 May 2021, a calibrated tightening of some safe management measures for higher-risk indoor and mask-off settings, will be in effect to protect the community. While most businesses are expected to turn the corner as Singapore's economy gradually reopens, uncertainty remains on the effectiveness of the vaccines against new strains of the virus. Demand for retail space will likely remain soft with the continued safe distancing measures being implemented and border closures. In the short term, the weak demand may continue to weigh on rental performance.
Milan Alongside the Italian economy, business and consumer confidence continued to improve in June. According to the preliminary estimates by the Italian National Institute of Statistics, the consumer price index for June climbed 1.3%4 YoY and 0.1%4 month-on-month. In the office sector, vacancy rates in Milan remained stable at 9.6%5 in 1Q 2021. While the total transacted space recorded a drop of 30%5 YoY to 68,0005 square metres, Milan office market has continued to stay dynamic, marking a growing interest for small and medium-sized enterprises. More than 60%5 of the transactions recorded were spaces under 1,000 square metres. The CBD and Periphery submarkets accounted for approximately 71%5 of the total transacted space. As at 1Q 2021, the average office rental in Milan stood at €6005 per square metre per annum. On the investment front, Milan has maintained its appeal and concluded approximately 80%5 of the total office transactions in Italy.
2 Ministry of Trade and Industry, Singapore’s GDP Grew by 14.3 Per Cent in the Second Quarter of 2021 3 Department of Statistics Singapore, Retail Sales Index, May 2021 4 Italian National Institute of Statistics, Monthly Report May-June 2021 5 Cushman & Wakefield, Milan Office Q1 2021

LENDLEASE GLOBAL COMMERCIAL REIT
UNAUDITED CONDENSED INTERIM FINANCIAL STATEMENTS AND DISTRIBUTION ANNOUNCEMENT FOR THE FULL YEAR ENDED 30 JUNE 2021 AND SECOND FINANCIAL HALF YEAR PERIOD FROM 1 JANUARY 2021 TO 30 JUNE 2021
Page 40 of 44
5 Commentary on the competitive conditions of the industry in which the group
operates and any known factors or events that may affect the group in the next reporting period and the next 12 months
According to the latest report by Cushman & Wakefield, office absorption rate for the next five years is expected to be lower compared to the past five years. Businesses, in the short term, will continue to assess the structural impacts of COVID-19 on future demand for office space and how the space could be transformed from being just a place to work to becoming a place where employees gather to interact and collaborate. Looking ahead The Manager will continue to closely monitor developments relating to the COVID-19 pandemic. The Manager has taken necessary precautionary measures at LREIT’s assets in accordance with guidelines from local health authorities. For the retail assets in Singapore, the Manager prioritises maintaining occupancy levels, active management to ensure the mall stays relevant and keeping ongoing communications with tenants to understand their needs. As the Manager continues to shape the future of the retail landscape to create a seamless chain between online and on-site shopping, it will leverage on Lendlease Plus to collaborate with tenants to extend their reach to shoppers. To enhance Unitholders’ value, the Manager will continue to improve the underlying performance of LREIT’s assets and adopt disciplined capital and asset management strategies to reduce costs and non-core expenditures.

LENDLEASE GLOBAL COMMERCIAL REIT
UNAUDITED CONDENSED INTERIM FINANCIAL STATEMENTS AND DISTRIBUTION ANNOUNCEMENT FOR THE FULL YEAR ENDED 30 JUNE 2021 AND SECOND FINANCIAL HALF YEAR PERIOD FROM 1 JANUARY 2021 TO 30 JUNE 2021
Page 41 of 44
6 Distributions
(a) Current financial period
Any distributions declared for the current financial period? Yes
Name of distribution: 4th distribution for the period from 1 January 2021 to 30
June 2021
Distribution type: Income
Distribution rate: Taxable Income – 1.3148 cents per unit
Tax-Exempt Income – 1.0202 cents per unit
Par value of units: Not meaningful
Tax rate: Taxable Income Distribution
Qualifying investors and individuals (other than those who hold their units through a partnership) will generally receive pre-tax distributions. These distributions are exempt from tax in the hands of individuals unless such distributions are derived through a Singapore partnership or from the carrying on of a trade, business or profession in which case, such distributions are not exempt from tax and the individual must declare the gross distribution received as income in their Singapore tax returns.
Qualifying foreign non-individual investors and qualifying non-resident funds will receive their distributions after deduction of tax at the rate of 10%.
All other investors will receive their distributions after deduction of tax at the rate of 17%.
Tax-Exempt Income Distribution Tax-Exempt Income Distribution is exempt from tax in the hands of all Unitholders.
(b) Books closure date: 18 Aug 2021
(c) Date payable: 14 Sep 2021

LENDLEASE GLOBAL COMMERCIAL REIT
UNAUDITED CONDENSED INTERIM FINANCIAL STATEMENTS AND DISTRIBUTION ANNOUNCEMENT FOR THE FULL YEAR ENDED 30 JUNE 2021 AND SECOND FINANCIAL HALF YEAR PERIOD FROM 1 JANUARY 2021 TO 30 JUNE 2021
Page 42 of 44
6 Distributions
(d) Corresponding period of the preceding financial period
Any distributions declared for the current financial period? Yes
Name of distribution: 2nd distribution for the period from 1 January 2020 to 30
June 2020
Distribution type: Income / Capital
Distribution rate: Taxable Income – 0.938 cents per unit
Tax-Exempt Income – 0.286 cents per unit
Capital – 0.534 cents per unit
Par value of units: Not meaningful
Tax rate: Taxable Income Distribution Qualifying investors and individuals (other than those who hold their units through a partnership) will generally receive pre-tax distributions. These distributions are exempt from tax in the hands of individuals unless such distributions are derived through a Singapore partnership or from the carrying on of a trade, business or profession in which case, such distributions are not exempt from tax and the individual must declare the gross distribution received as income in their Singapore tax returns.
Qualifying foreign non-individual investors and qualifying non-resident funds will receive their distributions after deduction of tax at the rate of 10%.
All other investors will receive their distributions after deduction of tax at the rate of 17%.
Tax-Exempt Income Distribution Tax-Exempt Income Distribution is exempt from tax in the hands of all Unitholders.
Capital Distribution Capital Distribution represents a return of capital to Unitholders for Singapore income tax purposes and is therefore not subject to income tax. For Unitholders who are liable to Singapore income tax on profits from sale of LREIT Units, the amount of Capital Distribution will be applied to reduce the cost base of their LREIT Units for Singapore income tax purposes.
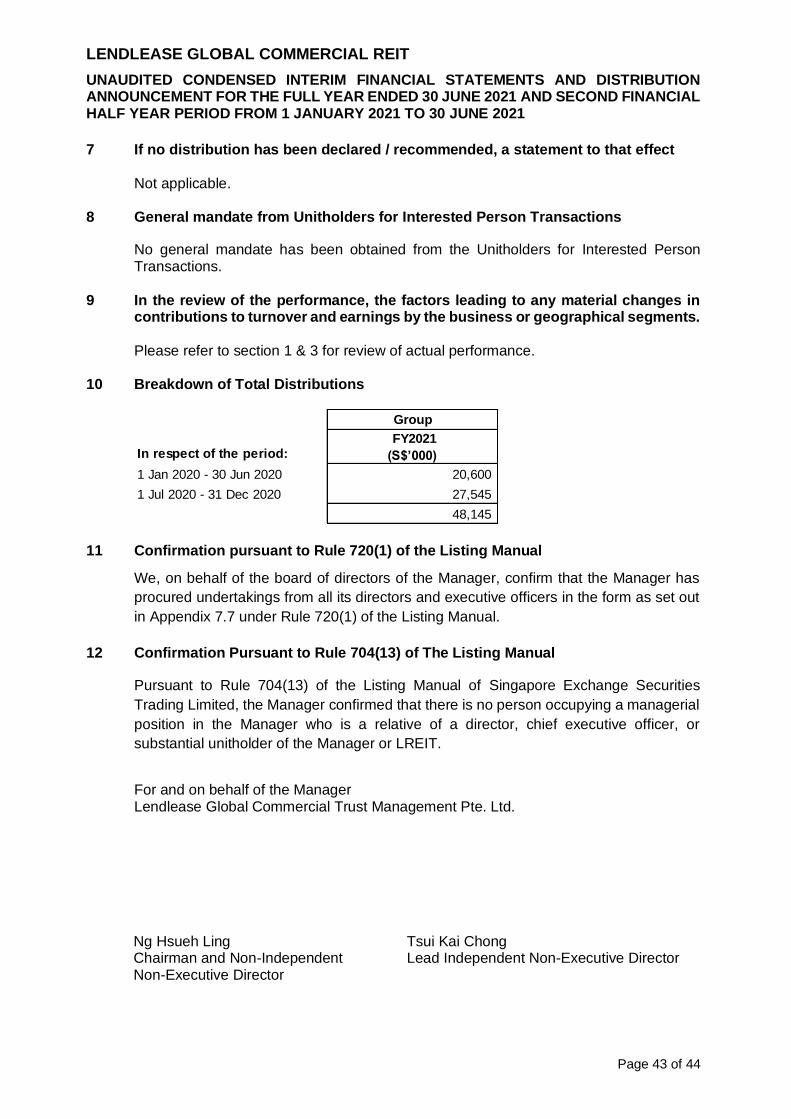
LENDLEASE GLOBAL COMMERCIAL REIT
UNAUDITED CONDENSED INTERIM FINANCIAL STATEMENTS AND DISTRIBUTION ANNOUNCEMENT FOR THE FULL YEAR ENDED 30 JUNE 2021 AND SECOND FINANCIAL HALF YEAR PERIOD FROM 1 JANUARY 2021 TO 30 JUNE 2021
Page 43 of 44
7 If no distribution has been declared / recommended, a statement to that effect Not applicable. 8 General mandate from Unitholders for Interested Person Transactions
No general mandate has been obtained from the Unitholders for Interested Person Transactions.
9 In the review of the performance, the factors leading to any material changes in contributions to turnover and earnings by the business or geographical segments.
Please refer to section 1 & 3 for review of actual performance.
10 Breakdown of Total Distributions
11 Confirmation pursuant to Rule 720(1) of the Listing Manual
We, on behalf of the board of directors of the Manager, confirm that the Manager has
procured undertakings from all its directors and executive officers in the form as set out
in Appendix 7.7 under Rule 720(1) of the Listing Manual.
12 Confirmation Pursuant to Rule 704(13) of The Listing Manual
Pursuant to Rule 704(13) of the Listing Manual of Singapore Exchange Securities
Trading Limited, the Manager confirmed that there is no person occupying a managerial
position in the Manager who is a relative of a director, chief executive officer, or
substantial unitholder of the Manager or LREIT.
For and on behalf of the Manager Lendlease Global Commercial Trust Management Pte. Ltd.
Ng Hsueh Ling Tsui Kai Chong Chairman and Non-Independent Lead Independent Non-Executive Director Non-Executive Director
Group
In respect of the period: FY2021
(S$’000)
1 Jan 2020 - 30 Jun 2020 20,600
1 Jul 2020 - 31 Dec 2020 27,545
48,145

LENDLEASE GLOBAL COMMERCIAL REIT
UNAUDITED CONDENSED INTERIM FINANCIAL STATEMENTS AND DISTRIBUTION ANNOUNCEMENT FOR THE FULL YEAR ENDED 30 JUNE 2021 AND SECOND FINANCIAL HALF YEAR PERIOD FROM 1 JANUARY 2021 TO 30 JUNE 2021
Page 44 of 44
Certain statements in this release constitute “forward-looking statements”. This release also contains forward-looking financial information. Such forward-looking statements and financial information involve known and unknown risks, uncertainties and other factors which may cause the actual results, performance or achievements of Group to be materially different from any future results, performance or achievements expressed or implied by such forward-looking statements and financial information. Such forward-looking statements and financial information are based on numerous assumptions regarding the Manager’s present and future business strategies and the environment in which the Group will operate in the future. Because these statements and financial information reflect the current views of the Manager concerning future events, these statements and financial information necessarily involve risks, uncertainties and assumptions. Actual future performance could differ materially from these forward-looking statements and financial information. You should not place any reliance on these forward-looking statements and financial information.
By Order of the Board Mr Cho Form Po Company Secretary Lendlease Global Commercial Trust Management Pte. Ltd. (Company Registration No. 201902535N) As Manager of Lendlease Global Commercial REIT 10 August 2021

Lendlease Global
Commercial REITSecond-half and Full-year Financial Results FY2021
10 August 2021
Lendlease Global Commercial REIT 2Important NoticeThis presentation may contain forward-looking statements. Actual future performance, outcomes and results may differ materially from those expressed inforward-looking statements as a result of a number of risks, uncertainties and assumptions. Representative examples of these risks, uncertainties andassumptions include (without limitation) general industry and economic conditions, interest rate trends, cost of capital and capital availability, competition fromother companies, shifts in customer demands, customers and partners, changes in operating expenses including employee wages, benefits and training,governmental and public policy changes and the continued availability of financing in the amounts and the terms necessary to support future business.
You are cautioned not to place undue reliance on these forward-looking statements, which are based on the current view of management regarding futureevents. No representation or warranty expressed or implied is made as to, and no reliance should be placed on, the fairness, accuracy, completeness orcorrectness of the information or opinions contained in this presentation. Neither Lendlease Global Commercial Trust Management Pte. Ltd. (the “Manager”) norany of its affiliates, advisers or representatives shall have any liability whatsoever (in negligence or otherwise) for any loss howsoever arising, whether directly orindirectly, from any use, reliance or distribution of this presentation or its contents or otherwise arising in connection with this presentation.
The past performance of Lendlease Global Commercial REIT (“LREIT”) is not indicative of future performance. The listing of the units in LREIT (“Units”) onSingapore Exchange Securities Trading Limited (the “SGX-ST”) does not guarantee a liquid market for the Units. The value of the Units and the income derivedfrom them may fall as well as rise. Units are not obligations of, deposits in, or guaranteed by, the Manager or any of its affiliates. An investment in the Units issubject to investment risks, including the possible loss of the principal amount invested. Investors have no right to request that the Manager redeem or purchasetheir Units while the Units are listed on the SGX-ST. It is intended that holders of Units may only deal in their Units through trading on the SGX-ST.
This presentation is for information only and does not constitute an invitation or offer to acquire, purchase or subscribe for the Units.
Contents
1. Key Highlights
2. Financial Performance
3. Portfolio Performance
4. Moving Forward
5. Market Review
6. Appendix

KEY HIGHLIGHTS

Lendlease Global Commercial REIT 5Second-half and Full-year Financial Results FY2021
Key Highlights✓ Distributable income up 33.5% YoY in 2H FY2021, translating to a distribution of 2.34 cents per unit
✓ Portfolio occupancy remained high at 99.8%
✓ 99.91% voted in favour at the extraordinary general meeting to increase indirect interest1 in Jem
✓ First perpetual securities issued to expand LREIT’s avenues and diversity of funding
(1) LREIT will hold up to 31.8% indirect interest in Jem upon completion of the acquisition, which is expected to be 30 September 2021.
(2) Refers to 313@somerset as Sky Complex is 100% leased till 2032, excluding tenant’s break option in 2026. Continued to secure new tenants and leasing prospects
to uphold occupancy rate.
Key Financial Metrics(2H FY2021)
Key Portfolio Metrics(as at 30 June 2021)
Distributable
Income
S$27.6 million+33.5% YoY
Gross Revenue
S$37.0 million+8.5% YoY
Net Property
Income
S$26.5 million+10.0% YoY
Portfolio
Occupancy
99.8%
Weighted
Average Lease
Expiry(by NLA)
8.8 years
Tenant
Retention(by NLA)
61.5%2

Lendlease Global Commercial REIT 6
Jem, a dominant retail mall in the West of Singapore, is one of Jurong Gateway’s best performing mixed-use assets.
Subsequent event: 99.91% voted in favour to increase indirect interest in Jem• The almost-unanimous approval and strong participation from LREIT’s unitholders is a significant milestone and
strong testimony achieved.
• The acquisition will enhance LREIT’s portfolio resilience through income diversification.
Second-half and Full-year Financial Results FY2021
Note: LREIT will hold up to 31.8% indirect interest in Jem upon completion of the acquisition, which is expected to be 30 September 2021.

FINANCIAL PERFORMANCE
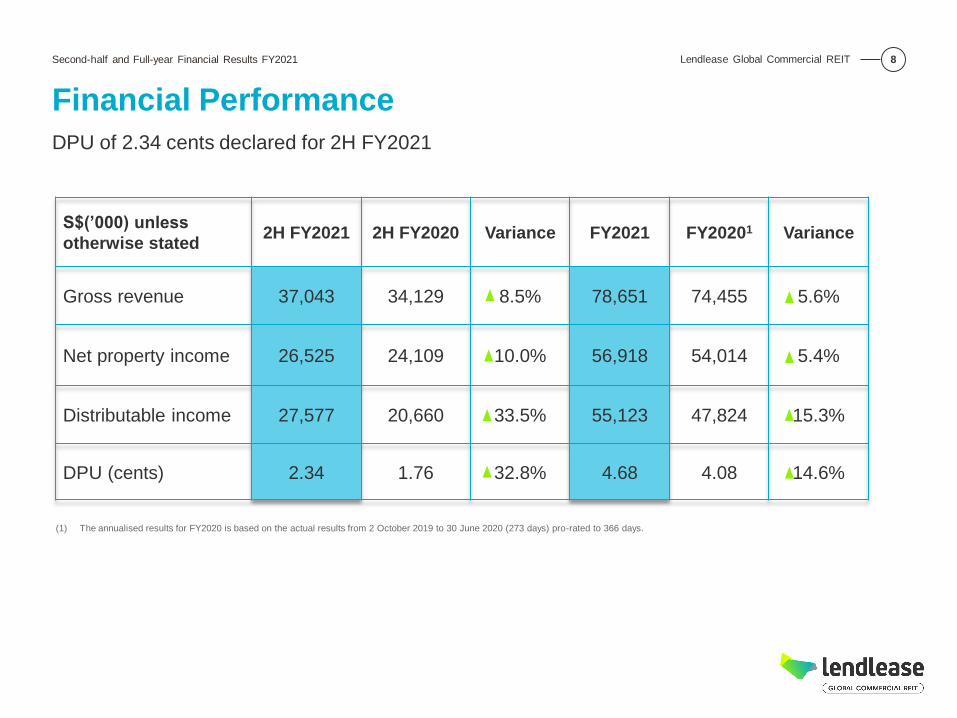
Lendlease Global Commercial REIT 8
S$(’000) unless
otherwise stated2H FY2021 2H FY2020 Variance FY2021 FY20201 Variance
Gross revenue 37,043 34,129 8.5% 78,651 74,455 5.6%
Net property income 26,525 24,109 10.0% 56,918 54,014 5.4%
Distributable income 27,577 20,660 33.5% 55,123 47,824 15.3%
DPU (cents) 2.34 1.76 32.8% 4.68 4.08 14.6%
Financial Performance
DPU of 2.34 cents declared for 2H FY2021
(1) The annualised results for FY2020 is based on the actual results from 2 October 2019 to 30 June 2020 (273 days) pro-rated to 366 days.
Second-half and Full-year Financial Results FY2021

Lendlease Global Commercial REIT 9
S$ million unless otherwise stated As at 30 June 2021 As at 31 December 2020
Total assets 1,737.1 1,577.5
Total liabilities 580.3 582.5
Net assets 1,156.8 995.0
Unitholders’ fund 957.9 995.0
Perpetual securities 198.9 -
Units in issue (number) 1,180,996,040 1,177,145,952
NAV per unit (S$) 0.811 0.85
Balance Sheet
Total assets include cash of S$249.3 million to meet current financial and operational obligations
(1) Excludes perpetual securities.
Second-half and Full-year Financial Results FY2021

Lendlease Global Commercial REIT 10
As at 30 June 2021 As at 31 March 2021
Gross borrowings S$553.7 million S$548.9 million
Gearing ratio 32.0% 35.4%
Weighted average debt maturity 2.2 years 2.4 years
Weighted average running cost of debt1 0.88% p.a. 0.88% p.a.
Interest coverage 8.9 times2 7.7 times
Key Financial Indicators
Stable liquidity position
(1) Excludes amortisation of debt-related transaction costs.
(2) The interest coverage ratio of 8.9 times is in accordance with requirements in its debt agreements, and 4.7 times in accordance with the Property Funds Appendix of the Code on Collective
Investment Schemes.
Second-half and Full-year Financial Results FY2021

Lendlease Global Commercial REIT 11
Capital Management• 100% unsecured debt
• Natural hedge on investment into Sky Complex via Euro term loan
• Diversity of debt funding across a syndicate of lenders
• S$147.8 million of undrawn multicurrency debt facilities1
• S$120 million 4-year loan facilities put in place on 4 August 2021
99.3
454.4(€285.0)
50.00
100
200
300
400
500
FY2022 FY2023 FY2024 FY2025
S$ million
No
refinancing
till FY2023
(1) S147.8 million of undrawn facilities includes S$50 million of committed facilities as at 30 June 2021.
€ Term Loan
S$ Term Loan
S$ Revolving Credit Facilities
(undrawn)
Debt Maturity Profile
Second-half and Full-year Financial Results FY2021

Lendlease Global Commercial REIT 12
Period: 1 January to 30 June 2021
Notice of books closure date 10 Aug 2021
Last day of trading on ‘cum’ basis 16 Aug 2021, 5.00pm
Ex-date 17 Aug 2021, 9.00am
Books closure date 18 Aug 2021
Payment date 14 Sep 2021
Distribution Details
Distribution per unit: 2.34 cents
Second-half and Full-year Financial Results FY2021

PORTFOLIO PERFORMANCE

Lendlease Global Commercial REIT 14
Portfolio Overview
High portfolio occupancy of 99.8% with a long WALE of 8.8 years by NLA and 4.5 years by GRI
Healthy Occupancy Rate Diversified Tenant Base (by GRI)
Lease Expiry Profile
9% 6% 6%1%
77%
24% 25%
15%
3%
33%
FY2022 FY2023 FY2024 FY2025 Beyond FY2025
By NLA By GRI
Broadcasting33%
Food & Beverages27%
Fashion & Accessories18%
IT & Telecommunication, 4%
Shoes & Bags, 4%
Entertainment, 4%
Others11%99.5% 99.8%
30 June 2020 30 June 2021
Second-half and Full-year Financial Results FY2021

Lendlease Global Commercial REIT 15
Portfolio Overview: Valuation
Portfolio valuation stood at S$1.4 billion as at 30 June 2021
Second-half and Full-year Financial Results FY2021
Valuation as at
30 June 2021
(million)
Valuation as at
30 June 2020
(million)
Variance
(%)
Cap rate as at
30 June 2021
(%)
Cap rate as at
30 June 2020
(%)
313@somerset S$988.5(1) S$1,008 1.9 4.25(2) 4.25
Sky Complex€274.0
(S$436.9(3))
€277.7
(S$434.6(4))
1.3 (€)
0.5 (S$)5.25 5.25
Total S$1,425.4 S$1,442.6 1.2 N.A. N.A.
(1) Includes the development of the multifunctional event space, adjacent to 313@somerset, which will be connected seamlessly to the Discovery Walk that links to 313@somerset. The valuation of the event
space was S$5.5 million as at 30 June 2021.
(2) Refers to operating asset only.
(3) Conversion of € to S$ is based on the FX rate of 1.594 as at 30 June 2021.
(4) Conversion of € to S$ is based on the FX rate of 1.565 as at 30 June 2020.

Lendlease Global Commercial REIT 16
Tenant sales (Jan to Jun 2021) Visitation (Jan to Jun 2021)
49.2 46.0
11.7
35.5
0
20
40
60
80
100
2020 2021
S$ in millions
Jan-Mar Apr-Jun
61.0
81.5
Retail Performance: Tenant Sales and Visitation• Tenant sales and visitation grew 33.7% and 6.2% YoY in 2H FY2021 respectively.
• Safety remains our top priority. We will continue to remain vigilant and work together with the
authorities and tenants to provide a safe environment for the community to work, play and eat.
• Tenant sales and visitation may remain muted in the coming months as Singapore continues to adopt
more targeted approach to calibrate the resumption of economic and community activities.
S$ in millions Jan-Mar Apr-Jun Jul-Sep Oct-Dec
2020 49.2 11.7 42.6 50.8
2021 46.0 35.5
8.6
6.6
2.24.8
0
2
4
6
8
10
12
2020 2021
Number in
millions
Jan-Mar Apr-Jun
10.811.4
No. in millions Jan-Mar Apr-Jun Jul-Sep Oct-Dec
2020 8.6 2.2 6.2 7.0
2021 6.6 4.8
Second-half and Full-year Financial Results FY2021

Lendlease Global Commercial REIT 17
Retail Performance: Committed Occupancy • Occupancy rate maintained above Orchard Road’s average of 91%1.
• Three new tenants secured during the quarter to enhance in-store retail experience for shoppers.
Occupancy rate
99.2 99.2
97.8
95.6
98.7 98.699.2
85
90
95
100
Dec-19 Mar-20 Jun-20 Sep-20 Dec-20 Mar-21 Jun-21
%
Average occupancy rate in Orchard Road
(1) Source: Colliers International
Second-half and Full-year Financial Results FY2021
New tenants onboard
Physical store of an ecommerce site
managed by Changi Airport GroupSpecialty bubble tea concept
originated from Taiwan
Boutique specialises in luxury
brand accessories

Lendlease Global Commercial REIT 18
Continue to create engaging experiences for shoppers
Collaborate with merchants to generate sales for tenants while making safety a priority
Second-half and Full-year Financial Results FY2021

Lendlease Global Commercial REIT 19
Office Performance: Sky Complex in Milan• The Italian economy continued to improve since the beginning of 2021.
• Milano Santa Giulia continued to attract flight-to-quality tenants. The Periphery, where Sky Complex
is located, and the CBD submarkets, accounted for approximately 71%1 of the total transacted space
in 1Q 2021.
2
3
5
Milano Santa Giulia district in the Periphery submarket
South Zone(New Business District)1
North Zone (Urban Park)
High speed rail
connection to Rome
Convenient access to
Milan Linate Airport
with connections to
London, Frankfurt
4
Sky Complex
Spark One and Spark Two, new
grade-A office development
projects. Approximately 80% of the
space in Spark One was pre-let to
Saipem, a global engineering
company.
Residential area with 1,800
families and a shopping and
entertainment street
Community park of size
45,000sqm
New campus of Giuseppe Verdi
Conservatory, the largest music
academy in Italy
Multifunctional arena where 2026
Winter Olympics will be held
1
2
3
4
5
(1) Source: Cushman & Wakefield, Milan Office Q1 2021
Second-half and Full-year Financial Results FY2021

Lendlease Global Commercial REIT 20
Other Investments: Development of a multifunctional event space, adjacent to 313@somerset• The event space is set to present a vibrant, first-of-its-kind lifestyle and entertainment experience,
offering unique food concepts and serving as a venue for concerts and events through a partnership
with Live Nation, the world’s leading live entertainment company.
• To forge strong connections with the local community, a branding contest for visual concepts and
name suggestions for the site has been launched.
• Construction is expected to commence by end-2021.
Second-half and Full-year Financial Results FY2021
Artist impression. Multifunctional event space, adjacent to 313@somerset.

MOVING FORWARD

Lendlease Global Commercial REIT 22
Key focus in the near term
Second-half and Full-year Financial Results FY2021
Safety as our top
priority
• Singapore has returned to Phase Two (Heightened Alert) to put a lid on the spike in
community cases.
• Continue to work together with the authorities and tenants to ensure a COVID-safe
environment.
• Continue to tap Sponsor’s pipeline to acquire high-quality assets with stable cash flow.
• Focus on cost optimisation and a solid balance sheet supported by diverse sources of
capital.
Acquisition growth
Organic growth
• Build on our retail assets’ proposition for omnichannel tenants to deliver an integrated
shopping experience.
• Focus on maintaining occupancy and keeping an open communication with tenants.
• Drive sustainable business growth through proactive asset management.
• Targeted marketing campaigns to boost sales.

MARKET REVIEW
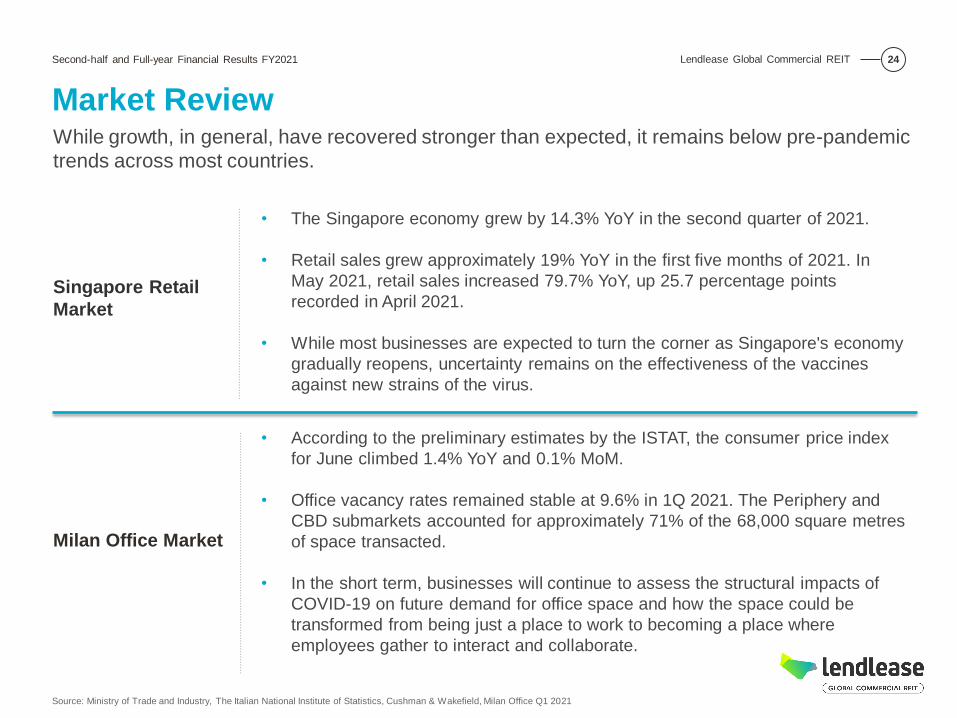
Lendlease Global Commercial REIT 24
Market Review
Singapore Retail
Market
• The Singapore economy grew by 14.3% YoY in the second quarter of 2021.
• Retail sales grew approximately 19% YoY in the first five months of 2021. In
May 2021, retail sales increased 79.7% YoY, up 25.7 percentage points
recorded in April 2021.
• While most businesses are expected to turn the corner as Singapore's economy
gradually reopens, uncertainty remains on the effectiveness of the vaccines
against new strains of the virus.
While growth, in general, have recovered stronger than expected, it remains below pre-pandemic
trends across most countries.
Source: Ministry of Trade and Industry, The Italian National Institute of Statistics, Cushman & Wakefield, Milan Office Q1 2021
Milan Office Market
• According to the preliminary estimates by the ISTAT, the consumer price index
for June climbed 1.4% YoY and 0.1% MoM.
• Office vacancy rates remained stable at 9.6% in 1Q 2021. The Periphery and
CBD submarkets accounted for approximately 71% of the 68,000 square metres
of space transacted.
• In the short term, businesses will continue to assess the structural impacts of
COVID-19 on future demand for office space and how the space could be
transformed from being just a place to work to becoming a place where
employees gather to interact and collaborate.
Second-half and Full-year Financial Results FY2021

APPENDIX

Lendlease Global Commercial REIT 26Second-half and Full-year Financial Results FY2021
313@somerset, retail mall in Singapore
A youth-oriented retail mall centrally located on Singapore’s Orchard Road shopping belt, directly connected to
the Somerset MRT Station.
Key Statistics
(as at 30 June 2021)
Occupancy 99.2%
WALE1.4 years
(by NLA and GRI)
Valuation S$983 million
Valuation cap rate 4.25%
NLA 288,318 sq ft
Ownership100%
(99-year leasehold)1
(1) 99-year leasehold commencing from 21 November 2006 until 20 November 2105.
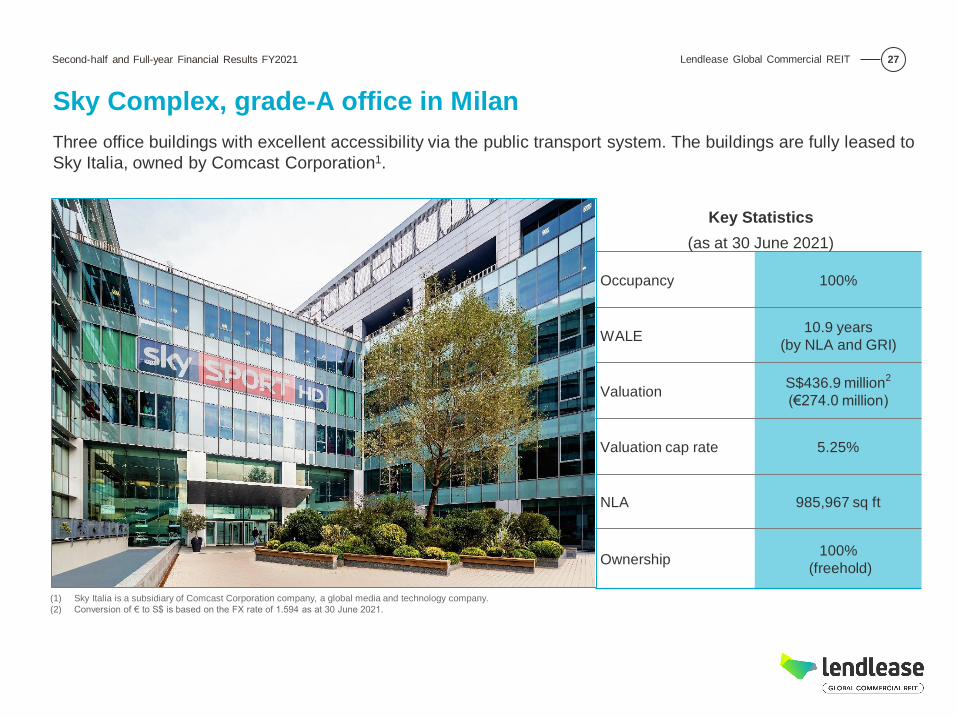
Lendlease Global Commercial REIT 27Second-half and Full-year Financial Results FY2021
Key Statistics
(as at 30 June 2021)
Occupancy 100%
WALE10.9 years
(by NLA and GRI)
ValuationS$436.9 million2
(€274.0 million)
Valuation cap rate 5.25%
NLA 985,967 sq ft
Ownership100%
(freehold)
(1) Sky Italia is a subsidiary of Comcast Corporation company, a global media and technology company.
(2) Conversion of € to S$ is based on the FX rate of 1.594 as at 30 June 2021.
Sky Complex, grade-A office in Milan
Three office buildings with excellent accessibility via the public transport system. The buildings are fully leased to
Sky Italia, owned by Comcast Corporation1.

Thank You
313@SOMERSET, SINGAPORE SKY COMPLEX, MILAN
STRATEGIC STAKE IN JEM VIA 5% INTEREST IN LENDLEASE ASIAN RETAIL INVESTMENT FUND 3 ARTIST IMPRESSION. MULTIFUNCTIONAL EVENT SPACE, ADJACENT TO 313@SOMERSET
For enquiries, please contact Ling Bee Lin, Manager Investor Relations
Tel: (65) 6671 7374 / Email: [email protected]

1
Distributable Income Up 33.5% to S$27.6 million
in 2H FY2021 Distribution per unit up 32.8% to 2.34 cents in 2H FY2021
Key highlights
• Portfolio continued to remain resilient with high occupancy of 99.8%
• Long weighted average lease expiry (“WALE”) of 8.81 years by net lettable area (“NLA”)
and 4.51 years by gross rental income (“GRI”)
• Gearing ratio improved to 32.0% from 35.4% in the previous quarter with a weighted
average running cost of debt of 0.88% p.a.
• High weighted interest coverage ratio of 8.9 times2
• 99.91% voted in favour to increase indirect interest3 in Jem
• First perpetual securities issued to expand LREIT’s avenues and diversity of funding
DBS Bank Ltd. is the Sole Financial Adviser and Issue Manager for the initial public offering of Lendlease Global
Commercial REIT (the “Offering”). DBS Bank Ltd. and Citigroup Global Markets Singapore Pte. Ltd. were the joint
global coordinators, bookrunners and underwriters for the Offering.
Singapore, 10 August 2021 - Lendlease Global Commercial Trust Management Pte. Ltd. (the
“Manager”), the manager of Lendlease Global Commercial REIT (“LREIT”), is pleased to
announce that distributable income increased 33.5% year-on-year (“YoY”) to S$27.6 million in 2H
FY2021, translating to a distribution of 2.34 cents per unit. For FY2021, distributable income rose
15.3%4 YoY to S$55.1 million, equivalent to a distribution of 4.68 cents per unit.
Gross revenue for 2H FY2021 was S$37.0 million, up 8.5% YoY. The higher revenue was
attributed to lower rental waivers granted to the tenants at 313@somerset amid the calibrated
reopening of the economy and higher revenue from Sky Complex due to foreign exchange. The
increase in gross revenue has resulted in a higher net property income (“NPI”) of S$26.5 million
for 2H FY2021. For FY2021, gross revenue and NPI increased 5.6% and 5.4% YoY to S$78.7
million and S$56.9 million respectively.
Property expenses in FY2021 were S$1.3 million or 6.3% higher than the same period a year
ago. The higher expenses were mainly attributed to the provision of S$2.3 million doubtful debts
amid the impact of COVID-19 on some tenants at 313@somerset. However, this was partially
1 Assumes that Sky Italia does not exercise its break option in 2026. 2 The interest coverage ratio of 8.9 times is in accordance with requirements in its debt agreements and 4.7 times in accordance with the Property Funds Appendix of the Code on Collective Investment Schemes. 3 LREIT will hold up to 31.8% indirect interest in Jem upon completion of the acquisition, which is expected to be 30 September 2021. 4 The annualised result for FY2020 is based on the actual results from 2 October 2019 to 30 June 2020 (273 days) pro-rated to 366 days.

2
offset by lower marketing, insurance, salary & related expenses, operating expenses and utilities
expenses.
Summary of Financial Results
S$(’000) unless
otherwise stated
2H
FY2021
2H
FY2020
Variance
(%) FY2021 FY20204
Variance
(%)
Gross revenue 37,043 34,129 8.5 78,651 74,455 5.6
Property operating
expenses (10,518) (10,020) (5.0) (21,733) (20,441) (6.3)
Net property income 26,525 24,109 10.0 56,918 54,014 5.4
Distributable income
to Unitholders 27,577 20,660 33.5 55,123 47,824 15.3
DPU (cents) 2.34 1.76 32.8 4.68 4.08 14.6
Capital Management
On 27 May 2021, LREIT priced S$200 million of perpetual securities under its S$1 billion
Multicurrency Debt Issuance Programme at 4.20% per annum for the first five years. The issuance
attracted strong demand from a wide range of high-quality institutional and retail investors.
Gross borrowings were S$553.7 million as at 30 June 2021 with an improved gearing ratio of
32.0%. The Group and LREIT have undrawn debt facilities of S$147.8 million-equivalent
multicurrency to fund its working capital.
The weighted average debt maturity was 2.2 years with a weighted average running cost of debt
of 0.88% per annum. LREIT’s high interest coverage ratio of 8.9 times was in accordance with
requirements in its debt agreements, and 4.7 times in accordance with the Property Funds
Appendix of the Code on Collective Investment Schemes. The current levels of the interest rate
coverage ratios continue to provide ample buffer from the debt covenant of 2.0 times. All of
LREIT’s debt are unsecured, ensuring that it has balance sheet flexibility.
Subsequent to the financial year end, S$120 million 4-year loan facilities were put in place on 4
August 2021 to partially finance the acquisition of interests in Jem and for general working capital
and/or corporate funding purposes.

3
Operations Performance
LREIT’s portfolio occupancy remained high at 99.8% as at 30 June 2021, with a long WALE of
8.81 years by NLA and 4.51 years by GRI. As at the period ended 30 June 2021, LREIT’s
aggregate portfolio property value stood at S$1.45 billion based on independent appraisals of
LREIT’s investment properties.
313@somerset, prime retail mall in Singapore
As at 30 June 2021, occupancy rate for 313@somerset climbed 0.6 percentage point to 99.2%
on the back of three new tenants secured to enhance in-store retail experience for shoppers. As
at the period end, tenant retention rate stood at 61.5%6 as the Manager continued to rejuvenate
the mall to uphold its position as a vibrant and youthful destination hub.
Tenant sales and visitation rose 33.7% and 6.2% YoY to S$81.5 million and 11.4 million in 2H
FY2021 respectively. During the same period, fashion & accessories and food & beverage
tenants, which accounted for approximately 45% by portfolio GRI, continued to improve its sales
by 37% YoY.
Following the implementation of Phase 2 (Heightened Alert) on 14 May 2021, the Singapore
government has continued to adopt a more targeted approach to calibrate the resumption of
economic and community activities. With the latest measures announced on 20 July 2021 to
suspend dining-in and group sizes for social gatherings reduced to two people (from five
previously), the Manager expects tenant sales and visitation to remain muted in the coming
months. It will continue to focus on targeted campaigns to boost sales, prioritise maintaining
occupancy and keep open communication with tenants amid the dynamic retail environment.
The multifunctional event space adjacent to 313@somerset
Construction of the event space is expected to commence by end-2021. Upon completion, which
takes approximately 12 to 18 months, the event space is set to present a vibrant, first-of-its-kind
lifestyle and entertainment experience, offering unique food concepts and serving as a venue for
concerts and events through a partnership with Live Nation, the world’s leading live entertainment
company.
To forge strong connections with the local community, a branding contest for visual concepts and
name suggestions has been launched for the site.
5 Includes the development of the multifunctional event space, adjacent to 313@somerset, which will be connected seamlessly to the Discovery Walk that links to 313@somerset. The valuation of the event space was S$5.5 million as at 30 June 2021. 6 Based on NLA due in FY2021.

4
Sky Complex, three grade-A offices in Milan
The Italian economy continued to improve since the beginning of 2021. Sky Complex has proven
to be a resilient asset since the onset of COVID-19 pandemic and has continued to generate
stable income. To-date, its tenant, Sky Italia, has made all its rental payments in a timely manner.
In the near term, the Manager expects the three grade A offices to remain resilient and continue
to generate stable income for LREIT’s unitholders.
Subsequent event: 99.91% voted in favour to increase indirect interest1 in Jem
The almost-unanimous approval and strong participation at the extraordinary general meeting on
26 July 2021 is a significant milestone and strong testimony achieved by LREIT. Post-completion
of the acquisition, the enlarged portfolio size of up to S$1.8 billion will strengthen LREIT’s portfolio
resiliency and boost income diversification.
Mr Kelvin Chow, Chief Executive Officer of the Manager, said, “We are heartened and
encouraged by the resounding support and decisive vote from our Unitholders. This is indeed an
endorsement of confidence for the REIT, the Board and the Management team. We will continue
to focus on optimising LREIT’s portfolio and its performance, and to deliver stable returns to our
Unitholders.”
Commenting on LREIT’s portfolio, Mr Chow, added, “LREIT has delivered higher net property
income and distributable income year-on-year, and we are pleased to end FY2021 with a
consistently high portfolio occupancy of 99.8%. While we remain well-capitalised with ample
financial flexibility, we will continue to exercise prudence.”
Market Outlook
Singapore Retail Industry
Based on advance estimates by the Ministry of Trade and Industry, the Singapore economy grew
by 14.3%7 YoY in the second quarter of 2021. This was largely due to the low base in the second
quarter of 2020 when the economy fell by 13.3%7 due to the Circuit Breaker (“CB”) measures
implemented from 7 April to 1 June 2020.
Retail sales grew approximately 19%8 YoY in the first five months of 2021. In May 2021, retail
sales increased 79.7%8 YoY, up 25.78 percentage points recorded in April 2021. Similarly, the
significant YoY growth was attributed to the low base in May 2020 when the CB measures were
put in place to contain the COVID-19 outbreak.
The Singapore government continued to adopt more targeted approach to calibrate the
resumption of economic and community activities. Following the implementation of Phase 2
7 Ministry of Trade and Industry, Singapore’s GDP Grew by 14.3 Per Cent in the Second Quarter of 2021 8 Department of Statistics Singapore, Retail Sales Index, May 2021

5
(Heightened Alert) on 14 May 2021, a calibrated tightening of some safe management measures
for higher-risk indoor and mask-off settings, will be in effect to protect the community.
While most businesses are expected to turn the corner as Singapore's economy gradually
reopens, uncertainty remains on the effectiveness of the vaccines against new strains of the virus.
Demand for retail space will likely remain soft with the continued safe distancing measures being
implemented and border closures. In the short term, the weak demand may continue to weigh on
rental performance
Milan Office Industry
Alongside the Italian economy, business and consumer confidence continued to improve in June.
According to the preliminary estimates by the Italian National Institute of Statistics, the consumer
price index for June climbed 1.4%9 YoY and 0.1%9 month-on-month.
In the office sector, vacancy rates in Milan remained stable at 9.6%10 in 1Q 2021. While the total
transacted space recorded a drop of 30%10 YoY to 68,00010 square metres, Milan office market
has continued to stay dynamic, marking a growing interest for small and medium-sized
enterprises. More than 60%10 of the transactions recorded were spaces under 1,000 sm. The
CBD and Periphery submarkets accounted for approximately 71%10 of the total transacted space.
As at 1Q 2021, the average office rental in Milan stood at €600 per square metre per annum10.
On the investment front, Milan has maintained its appeal and concluded approximately 80%10 of
the total office transactions in Italy.
According to the latest report by Cushman & Wakefield, office absorption rate for the next five
years is expected to be lower compared to the past five years. Businesses, in the short term, will
continue to assess the structural impacts of COVID-19 on future demand for office space and
how the space could be transformed from being just a place to work to becoming a place where
employees gather to interact and collaborate.
Distribution Policy
LREIT intends to make distributions to Unitholders semi-annually and will distribute at least 90.0%
of its adjusted net cashflow from operations for each financial year. The actual level of distribution
will be determined at the Manager’s discretion. LREIT intends to distribute 100.0% of its adjusted
net cashflow from operations for the period from 2 October 2019 (being the date LREIT was listed)
to the end of 30 June 2021.
ENDS
9 Italian National Institute of Statistics, Monthly Report May-June 2021 10 Cushman & Wakefield, Milan Office Q1 2021

6
About Lendlease Global Commercial REIT
Listed on 2 October 2019, Lendlease Global Commercial REIT (“LREIT”) is established with the principal
investment strategy of investing, directly or indirectly, in a diversified portfolio of stabilised income-producing
real estate assets located globally, which are used primarily for retail and/or office purposes.
Its portfolio comprises a leasehold interest in, 313@somerset, a prime retail property located in Singapore
and a freehold interest in Sky Complex, which comprises three grade-A office buildings located in Milan.
These two assets have a total NLA of approximately 1.3 million square feet, with an appraised value of
S$1.4 billion. On 1 October 2020, LREIT acquired a stake in Jem, an integrated office and retail
development in Singapore, through a 5 per cent interest in Lendlease Asian Retail Investment Fund 3.
LREIT is managed by Lendlease Global Commercial Trust Management Pte. Ltd., an indirect wholly-owned
subsidiary of Lendlease. Its key objectives are to provide Unitholders with regular and stable distributions,
achieve long-term growth in distribution per unit and net asset value per unit, and maintain an appropriate
capital structure.
About the Sponsor - Lendlease Corporation Limited
The Sponsor, Lendlease Corporation Limited, is part of the Lendlease Group11, an international property
and infrastructure group with core expertise in shaping cities and creating strong and connected
communities, with operations in Australia, Asia, Europe and the Americas.
Headquartered in Sydney and established in 1958, the Lendlease Group’s vision is Together we create
value through places where communities thrive.
The Lendlease Group’s approach is to maintain a portfolio of operations that deliver diversification of
earnings by segment and region, providing a mitigant to property cycles. This approach means that through
cycles the composition of earning from each segment or region may vary.
The Lendlease Group has a development pipeline value of approximately A$110 billion12, core construction
backlog of A$14 billion12 and funds under management of A$38 billion12. The Lendlease Group is a trusted
investment manager to over 150 key capital partners in property and investments.
For more information, please contact Investor Relations:
Lendlease Global Commercial Trust Management Pte. Ltd.
Ling Bee Lin
Tel: +65 6671 7374
11 Lendlease Group comprises the Sponsor, Lendlease Trust and their subsidiaries. 12 As at 31 December 2020.

7
Important Notice
This press release is for information purposes only and does not constitute or form part of an offer, invitation
or solicitation of any offer to purchase or subscribe for any securities of Lendlease Global Commercial REIT
(“LREIT”) in Singapore or any other jurisdiction nor should it or any part of it form the basis of, or be relied
upon in connection with, any contract or commitment whatsoever.
The value of units in LREIT (the “Units”) and the income derived from them may fall as well as rise. Units
are not obligations of, deposits in, or guaranteed by Lendlease Global Commercial Trust Management Pte.
Ltd. (the “Manager”), RBC Investor Services Trust Singapore Limited (as trustee of LREIT) or any of their
affiliates.
This press release may contain forward-looking statements that involve risks and uncertainties. Actual
future performance, outcomes and results may differ materially from those expressed in forward-looking
statements as a result of a number of risks, uncertainties and assumptions. Representative examples of
these factors include (without limitation) general industry and economic conditions, interest rate trends, cost
of capital and capital availability, competition from similar developments, shifts in expected levels of
property rental income, changes in operating expenses, (including employee wages, benefits and training
costs), property expenses and governmental and public policy changes and the continued availability of
financing in the amounts and the terms necessary to support future business.
An investment in Units is subject to investment risks, including the possible loss of the principal amount
invested. Holders of Units (“Unitholder”) have no right to request the Manager to redeem or purchase
their Units while the Units are listed. It is intended that Unitholders may only deal in their Units through
trading on Singapore Exchange Securities Trading Limited (“SGX-ST”). Listing of the Units on SGX-ST
does not guarantee a liquid market for the Units.
This press release is not to be distributed or circulated outside of Singapore. Any failure to comply with this
restriction may constitute a violation of United State securities laws or the laws of any other jurisdiction.
The past performance of LREIT is not necessarily indicative of its future performance.