Embed Size (px)
Citation preview
Legend The rapid assessment of the situation above based on available data was established in conjunction with in-country experts and officials It provides an overview of trends according to the following
trends are of significant concern
trends are of concern
trends are stable or progressing on certain issues but not on others
trends show some measure of improvement in all relevant indicators assessed
trends show significant improve-ment and there is no concern
insufficient data
Rapid Assessment
Accurate assessments of progress require relevant accurate and timely data The above data quality assessment ranges from
very poor very good
InvestmentsOverall less than an estimated 2 percent of the total government expenditures has been spent onwater-related matters Government investments havebeen allocated mainly to agricultural water resourcesand water supply and sanitation - large systems ODA disbursements went mainly to disaster preventionand preparedness and flood preventioncontrol andwater supply and sanitation - large systems
OverallPressures on waterThe highest density of population roughly 90 per-cent is within the coastal area and thus all residents of the coastal area depend wholly on groundwater supply to meet their domestic needs One exceptionis the Georgetown area where 30 percent of the water used is surface water from the East-Demeraraconservancy Although Guyana has institutionsagencies policies and regulations in place topromote proper water management the countrystill faces numerous water-related challenges suchas (i) inadequate irrigation water supply during dryseasons and flooding during wet seasons in farming and residential areas (ii) contamination of potablewater supplies leading to water-borne diseasessuch as vector-borne lymphatic-filariasis and leptospirosis (iii) limited and dilapidated drainageand irrigation infrastructure especially in the mainagricultural areas and (iv) lack of highly-qualifiedpersonnel within water sector institutions
Data ConcernsData is a vital input to water management and invest-ment in water related infrastructure and projectsData and available research for Guyana is sparse
Investments in coordinated data collection collation analysis and dissemination is vital to demonstrate the benefits of water-related investments to governmentsdonors and ultimately private capital investors
It is to be noted that it is virtually impossible to find national-level gender-disaggregated data for almost allthemes contained in the UN-Water Country Briefs
Disclaimersbull The most recent and updated information can be found in the original databases cited throughout
bull The rapid assessment methodology presentedhere is an advocacy tool designed to generatedebate and attention to the issues and is devel-oped in conjunction with national governmentfocal points
bull Data presented herein stems either from existing databases or was collected from national reports experts and institutions and in some cases raw data underwent various manipulations to categorize the information for this presentation
bull Due to data limitations the investment-relatedestimates may not include water-related invest-ments that are counted under other categoriesof investments and some investment categories(ie disaster prevention and preparedness)may include some investments that are not directly water-related Moreover water being acrosscutting issue investments in other parts ofthe government (not calculated here) may also benefit water management
bull The words investments invested funded for ODA refer to gross disbursements of ODA according to the OECD definitions The wordsinvestments invested funded for governmentrefer to government expenditure (2003 ndash 2010)and government budget (2011 amp 2012) Inaddition investment data and analysis do notinclude any other forms of investment (such as private sector investments)
This project was implemented by the AQUASTAT Programme of the Food and Agriculture Organization of the United Nations (FAO) on behalf of UN-Water with financial support from United States Department of State (USDS) Brief produced 19 June 2013
Additional information on the project data and methodologies can be accessed at
httpwwwunwaterorgWaterCountryBriefshtml
Data Quality
There is a lack of data on certain key indicators
Limited data on drinking water quality is available
Data is not readily available
A detailed disaster database is not available
Data is not readily available especially on the energy requirements of providing water andtreating wastewater
Data is not readily available
Data is not readily available There is no data available on the equity and human rights on sani-tation and drinking water within the UN-WaterGLAAS Report 2012
AssessmentsIrrigated agricultureRecent improvements in drainage and irrigation infrastructure have led to an increase in irrigated cropyields
Drinking water supply and sanitationSince 1998 both urban and rural areas have experienced a constant increment in use of an improveddrinking water source and improved sanitation facility The maintenance of water supply and sanitationservices in Guyana has always been a challenge
Water intensity in industry During 1992 to 2000 the value generated by industry per m3 of water increased by 3 percent annually and during 2000 to 2005 this value decreased by 21 percent annually
Water-related disasters Although Guyana is not a disaster-prone country forecasts predict that Guyana will be significantly affected in terms of drying trend
Water for energy energy for water In Guyana almost the entire technically exploitable hydropower potential remains untapped There areplans to develop hydropower in the country
Environment and ecosystem healthWater pollution and increased pressure on biodiversity are identified as main environmental prioritiesfor Guyana
Tracking governanceGuyana has institutions agencies policies and regulations in place to promote proper water manage-ment though the country still faces water stress challenges
AtlanticOcean
I
IIIII
IV V
VI
VII
VIII
IX
X
BOLIVARIAN REPUBLICOF VENEZUELA
BRAZIL
SURINAME
Georgetown
Essequibo
Potaro
Mazaruni
Cuy uni
Dem
erar
aBe
rbic
e
Corentyne
Esse
quib
o
Kw
itaro
Kuyuw ini
Rupununi
Bar
am aBarim
a
Torani canal
Pomeroon
Canje
Mah
aica
Takat
u
Tapakuma
Boerasirie
Boerasirie EDWC
Abary
Abary
Waini
Core
ntyn
e
Mahdia
Mabaruma
Lethem
Linden
Bartica
Anna Regina
Corriverton
New Amsterdam
At lan ticOcea n
GUYANA
Albers Equal Area Projection WGS 1984
Legend
The designations employed and the presentation of material in this publication do not imply the expression of any opinion whatsoever on the part of theFood and Agriculture Organization of the United Nations concerning the legal status of any country territory city or area or of its authorities
or concerning the delimitation of its frontiers or boundaries
Disclaimer
FAO - AQUASTAT 2013
0 100 20050 Kilometers
Zone of Irrigation Development
Capital Regional Capital Town
Administrative Boundary
International Boundary River
Canal
Lake
Barima - WainiPomeroon - SupenaarnEssequibo Islands - West DemeraraDemerara - MahaicaMahaica - BerbiceEast Berbice - CorentyneCuyuni - MazaruniPotaro - SiparuniUpper Takutu - Upper EssequiboUpper Demerara - Berbice
IIIIIIIVVVIVIIVIIIIXX
Regions of Guyana
Dam Conservancy
___ ___
year
758 000 inhabitants
214 970 km2
4 inhabitantskm2
0636 118
0490
34
2 387 mmyear
241 000 million m3year
317 942 m3inhabitant
06
150 000 ha
34
not avalaible
Total population (UN Population Division)
Total area
Population density
Human Development Index (UNDP)
(between 0 and 1 1 is highest) Country rank (total 186 countries 1 is highest) Gender Inequality Index (0 is equality between women and men 1 is least equality)
Water sanitation and hygiene-related deaths of total deaths (WHO)
Long-term average annual precipitation (CRU CL 20)
Long-term average actual renewable water resources (FAO AQUASTAT)
Actual annual renewable water resources per capita (FAO AQUASTAT)
of total actual renewable freshwater resources withdrawn (MDG Water Indicator) (FAO AQUASTAT)
Total area equipped for irrigation (FAO FAOSTAT)
of the cultivated area equipped for irrigation (FAO FAOSTAT)
Ramsar sites (Ramsar) ndash number ndash total area
2012
2011
2012
2012
2004
2011
2011
2012
2010
2008
2008
2011
2013
Industrial
Municipal
Water withdrawals by sector (total 1 444 million m3 in 2010)
14 42
944 Agricultural
Guyana UN-Water Country Brief
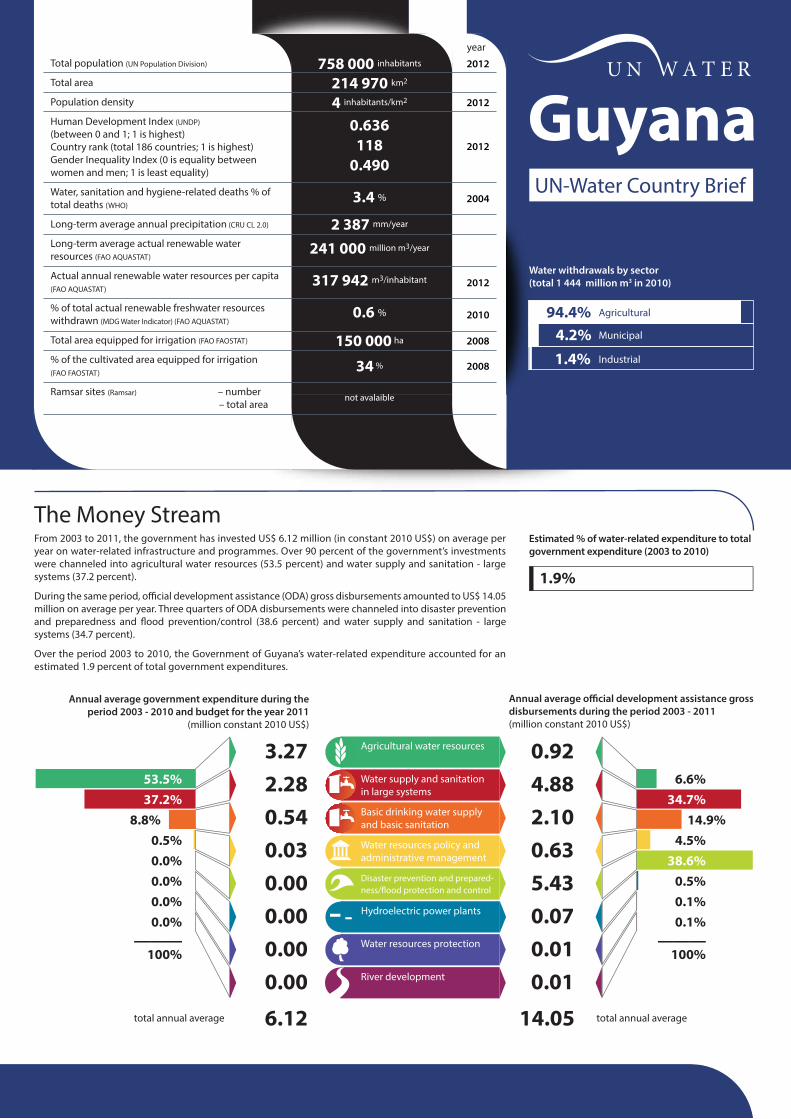
The Money Stream From 2003 to 2011 the government has invested US$ 612 million (in constant 2010 US$) on average per year on water-related infrastructure and programmes Over 90 percent of the governmentrsquos investments were channeled into agricultural water resources (535 percent) and water supply and sanitation - large systems (372 percent)
During the same period official development assistance (ODA) gross disbursements amounted to US$ 1405 million on average per year Three quarters of ODA disbursements were channeled into disaster prevention and preparedness and flood preventioncontrol (386 percent) and water supply and sanitation - large systems (347 percent)
Over the period 2003 to 2010 the Government of Guyanarsquos water-related expenditure accounted for an estimated 19 percent of total government expenditures
Annual average government expenditure during the period 2003 - 2010 and budget for the year 2011
(million constant 2010 US$)
327 535 228
05488 05
372
00 003 00 000 00 00 000
100 000 000
Disaster prevention and prepared-nessflood protection and control
total annual average 612
Estimated of water-related expenditure to total government expenditure (2003 to 2010)
19
Annual average official development assistance gross disbursements during the period 2003 - 2011 (million constant 2010 US$)
092 488 210 063 543 007 001 001
1405
66
149 45
347
386 05 01 01
100
total annual average
During 1992 to 2000 the value generated by industry per m3 of water increased by 3 percent annually and during 2000 to 2005 this value decreased by 21 percent annually
Environment andEcosystem Health
The vast majority of agricultural activities takes place in the coastal plains For more than 8 km inland the land is below sea level at high tide Therefore drainage and water control are major problems and agricultural development has always been tied to the defense against water intrusion from the sea and from rainwater runoff
The establishment of conservancies (ie large shallow dams that trap surface water runoff) and extraction pumps on rivers has sustained regular irrigation water supply During dry periods these systems ensure the ability to meet demand although some deficit in water supply occur under extreme events such as during El Nintildeo occurrences
During 1992 to 2000 the value generated by agriculture per m3 of water increased by 3 percent annually Rice and sugarcane are the main irrigated crops In addition a small area of citrus and vegetables is irrigated
Impact for developmentWith an installed capacity of 1 MW Guyanagenerated 1 GWh in 2008 which representedless than one percent of the nationrsquos hydropowertechnically exploitable capability
Energy for WaterWater for Energy
Water - relatedDisasters
Impact for developmentGuyana has well established national institutions and agencies overseeing water-related matters However there is a lack of monitoring data to make informed decisions on the efficient use and manage-ment of water sources The government faces the need to strengthen these organizations through training of staff and increasing budgetary allocations
Tracking WaterGovernance
Irrigated Agriculture
Impact for developmentThe National Drainage and Irrigation Authority has been spending large sums to build and improve drainageand irrigation infrastructure These investments have contributed to earnings of over US$40 million in exportsales of rice alone Guyanarsquos rice export has increased both in volume and value in 2010 surpassing all previ-ous records Yet limited and dilapidated drainage and irrigation infrastructure especially in main agriculturaldeveloped areas remains a challenge In 2011 agriculture accounted for 21 percent of gross domestic prod-uct In 2012 women accounted for 8 percent of the economically active population in agriculture
Rainfall variability and agricultural GDP(FAO AQUASTAT World Bank)
National rainfall index variability(percentage of deviation from average national
rainfall index)
Variability in agricultural GDP(percentage of deviation from trend of agricultural goods
produced per km2 of agricultural land)
1963 1968 1978 1988 19981973 1983 1993 2003
Impact for developmentAccording to a 2010 UNEP report floods land and water pollution and increased pressure on biodiversity are identified as main environmental priorities for Guyana Some estimated 177 million litres of untreated sewage are reportedly discharged per day into the mouth of the Demerara River The problem of land and water pollution is a consequence of several factors such as inadequate infrastructure limited monitoring insufficient financial resources lack of strong enforcement of environmental regulations In the interior of Guyana mining activities degrade surface water and groundwater
Impact for developmentIndustrial water use is distributed in the manufacturingbottling of beverages food processing extraction of minerals (gold and other) The extractive industries are located in the interior and remote areas of the country and are regulated by the mining regulations with respect to water discharge During dry seasons conflicts arise when mining is done on rivers creeks which serve as potable water sources to local communities
Water Intensityin Industry
Value added by industryin million constant 2000 US$
Value generated by industry per m3 of water(FAO AQUASTAT World Bank)
mill
ion
cons
tant
200
0 U
S$
Value generated by industryin constant 2000 US$ per m3 of water
1990 1995 2000 2005
Several institutions are involved in the management of Guyanas water resources For example watersupply to the majority of the country is provided through the Guyana Water Authority (GUYWA)monitoring of water quality and sewerage and sanita-tion activities are under the Ministry of Health the National Drainage and Irrigation Board (NDIB) is responsible for drainage and irrigation the Ministryof Public Works Communications and RegionalDevelopment establishes water sector policy andthe Hydrometeorology Department of the Ministryof Agriculture oversees monitoring and assessmentof surface water and groundwater resources and theprovision of basic meteorological information
Water quality index 2010
A score of 100 indicates optimal performance
428
(YCELPCIESINColumbia University WEF JRCEuropean Commission)
Impact for developmentGuyana has not been impacted too significantly by water-related disasters Nonetheless the available data indicates that between 1980 and 2011 over 650 000 people were affected During the same period there are only four data points of reported economic damage totaling million current US$ 709 worth in economic damage
Actualgeneration
Technicallyexploitable capabilitynot yet generated
1 36 999
Hydropower capacity and generation 2008in GWhyear (World Energy Council)
Estimates from climate models developed by the United Kingdomrsquos Meteorological Officersquos Hadley Centre predict that Guyana will experience a general drying trend Even though Guyana belongs to those countries in the world with the highest rainfall models show that Guyana will be among the most af-fected countries in the world by climate change with average precipitation having decreased by roughly 1 mmday between now and 2050 A drying trend of this nature dictates the need for storage reservoirs ex-tensive drainage and irrigation networks and man-agement systems The goal has been to sustain and improve livelihoods through interventions that would benefit individuals and the country as a whole
-40
-20
0
20
40
mill
ion
cons
tant
200
0 U
S$
20001990 1995 2005
Agriculture value addedin million constant 2000 US$
Value generated by agriculturein constant 2000 US$ per m3 of water
Value generated by agriculture per m3 of water(FAO AQUASTAT World Bank)
100
150
200
250
009
012
Drinking Water Supplyand Sanitation
Some 94 percent of the population in Guyana used an improved drinking water source in 2010 (98 percent
Impact for developmentWater sanitation and hygiene factors were responsible for over 300 deaths in 2004 which accounted for 34 percent of all deaths in Guyana In general improved water and sanitation infrastructure and services provide multiple benefits to the local population for health (decrease in mortality) and labour productivity (lower workplace absenteeism) outcomes They can also underpin confidence and expand markets for industries such as tourism Globally it is estimated that 88 percent of diarrheal diseases are caused by water sanitation and hygiene factors
Under 5 child mortality rate (probability of dying by age 5 per 1000 live births)
Improved drinking water sourceImproved sanitation facilities (both indicators above in of total population)
Access to drinking water and sanitationamp under-5 child mortality(UN Inter-agency Group for Child Mortality Estimation (IGME) and WHOUNICEF Joint Monitoring Programme)
1990 1995 2000 2005 2010
per 1
000
live
birt
hs
60
70
80
90
100
30
40
50
60
70
50
100
150
200
250
134
172
67
20112010200920082007200620052004200320022001200019991998199719961995199419931992199119901989198819871986
01010111110111111011021110
00000
2031
0000
1000101000000000
0-0
100 0000
35 000354 717
-100 000
1800
5 950200
12 2007 000
27 310870
03 500
3000
3000
5502 000
0
-15
0-0
165500
---0---
29--0--0----0
Year Numberof Events
Deaths Affected Economic Damage(million current US$)
- means no data available
(Dartmouth Flood Observatory)
lsquoWater-related disastersrsquo within the scope of this WCB study do not include droughts
Ratification of the International Covenant on Econom-ic Social and Cultural Rights (ICESCR)
15 February 1977
(The right to water is implicit within the right to an adequate standard of living and inextricably related to the right to the highest attainable standard of health outlined in the ICESCR)
in urban areas and 93 percent in rural areas) as com-pared to 88 percent in 1994 Some 84 percent of the population had access to improved sanitation facilities in 2010 (82 percent in rural areas and 88 percent in urban areas) up from 78 percent in 1994 Despite these improvements the sewerage and water services face operational maintenance financial and institu-tional challenges
10
Status and Trends
Government expenditure during the period Official development assistance gross disburseshy2003 ndash 2010 and budget for the years 2011 amp 2012 ments during the period 2003 - 2011 (million constant 2010 US$) (million constant 2010 US$)
Mill
ion
cons
tant
201
0 U
S$
8
6
4
2
0
2003 2005 2007 2009 2011 2003 2005 2007 2009 2011
Government water-related investment over the period 2003 to 2012 bull Agricultural water resources received the largest share of investments during this period with notable peaks in 2005 2008 and 2012 when it received 75 59 and 62 million constant 2010 US$ respectively bull In 2003 water supply and sanitation ndash large systems received 79 million constant 2010 US$ representing the largest amount invested by the government in one water-related category over this period
Water-related official development assistance over the period 2003 to 2011 bull Overall water-related ODA disbursements averaged 141 million constant US$ over the period with a high in 2009 (205 million constant US$) and a low in 2004 (70 million constant US$) bull Flood prevention control combined with disaster prevention and preparedness received with 386 percent the highest share of ODA disbursements In 2008 it accounted for 60 percent of water-related ODA disbursements with 93 million constant 2010 US$ bull Water supply and sanitation ndash large systems received 347 percent of ODA disbursements over the period with a peak in 2009 when 97 million constant US$ amounted to 369 percent of all water-related ODA disbursements bull Agricultural water resources received support from ODA only in 2010 and 2011
Actual expenditure refers to the amount spent by the government during a given year Where actual expenditure data is not available the government budget is used and refers to the amount that the government reportedly budgeted for the given year The OECD Creditor Reporting System categories were chosen for the collection of these water-related investments and the data was obtained by the WCB project through in-country research in cooperation with the government (during 2012) while ODA data stems from the OECD Creditor Reporting System (collected December 2012)
Water supply and sanitation in large systems Water desalination plants intakes storage treatment pumping stations conveyance and distribution systems sewerage domestic and industrial wastewater treatment plants
Basic drinking water supply and basic sanitation Water supply and sanitation through low-cost technologies such as hand-pumps spring catchment gravity-fed systems rainwater collection storage tanks small distribution systems latrines small-bore sewers on-site disposal (septic tanks)
Water resources policy and administrative manageshyment Water sector policy planning and programmes water legislation and management institution capacity building and advice water supply assessments and studies groundshywater water quality and watershed studies hydrogeology Excluding agricultural water resources
Disaster prevention and preparednessFlood protection and control Disaster risk reduction activities such as developing knowledge natural risks cartography legal norms for construction early warning systems emergency contingency stocks and contingency planning including preparations for forced displacement Floods from rivers or the sea including sea water intrusion control and sea level rise related activities
Agricultural water resources Irrigation reservoirs hydraulic structures groundwater exploitation for agricultural use
Hydroelectric power plants Including power-genershyating river barrages
Water resources protection Inland surface waters (rivers lakes etc) conservation and rehabilitation of groundwater prevention of water contamination from agrochemicals industrial effluents
River development Integrated river basin projects river flow control dams and reservoirs Excluding dams primarily for irrigation and hydropower and activities related to river transport
Government water-related investment over the period 2003 to 2012bull Agricultural water resources received the largest share of investments during this period with notable peaks in 2005 2008 and 2012 when it received 75 59 and 62 million constant 2010 US$ respectivelybull In 2003 water supply and sanitation ndash large systems received 79 million constant 2010 US$ representing the largest amount invested by the government in one water-related category over this period
Water-related official development assistance over the period 2003 to 2011 bull Overall water-related ODA disbursements averaged 141 million constant US$ over the period with a high in 2009 (205 million constant US$) and a low in 2004 (70 million constant US$)bull Flood prevention control combined with disaster prevention and preparedness received with 386 percent the highest share of ODA disbursements In 2008 it accounted for 60 percent of water-related ODA disbursements with 93 million constant 2010 US$ bull Water supply and sanitation ndash large systems received 347 percent of ODA disbursements over the period with a peak in 2009 when 97 million constant US$ amounted to 369 percent of all water-related ODA disbursementsbull Agricultural water resources received support from ODA only in 2010 and 2011
Actual expenditure refers to the amount spent by the government during a given year Where actual expenditure data is not available the government budget is used and refers to the amount that the government reportedly budgeted for the given year The OECD Creditor Reporting System categories were chosen for the collection of these water-related investments and the data was obtained by the WCB project through in-country research in cooperation with the government (during 2012) while ODA data stems from the OECD Creditor Reporting System (collected December 2012)
Official development assistance gross disburse-ments during the period 2003 - 2011(million constant 2010 US$)
2003 20032007 20072009 20092011 20112005 2005
Government expenditure during the period2003 ndash 2010 and budget for the years 2011 amp 2012(million constant 2010 US$)
Mill
ion
cons
tant
201
0 U
S$
Water - relatedDisasters
Impact for developmentGuyana has well established national institutions and agencies overseeing water-related matters However there is a lack of monitoring data to make informed decisions on the efficient use and manage-ment of water sources The government faces the need to strengthen these organizations through training of staff and increasing budgetary allocations
Tracking WaterGovernance
Several institutions are involved in the management of Guyanas water resources For example watersupply to the majority of the country is provided through the Guyana Water Authority (GUYWA)monitoring of water quality and sewerage and sanita-tion activities are under the Ministry of Health the National Drainage and Irrigation Board (NDIB) is responsible for drainage and irrigation the Ministryof Public Works Communications and RegionalDevelopment establishes water sector policy andthe Hydrometeorology Department of the Ministryof Agriculture oversees monitoring and assessmentof surface water and groundwater resources and theprovision of basic meteorological information
Impact for developmentGuyana has not been impacted too significantly by water-related disasters Nonetheless the available data indicates that between 1980 and 2011 over 650 000 people were affected During the same period there are only four data points of reported economic damage totaling million current US$ 709 worth in economic damage
Estimates from climate models developed by the United Kingdomrsquos Meteorological Officersquos Hadley Centre predict that Guyana will experience a general drying trend Even though Guyana belongs to those countries in the world with the highest rainfall models show that Guyana will be among the most af-fected countries in the world by climate change with average precipitation having decreased by roughly 1 mmday between now and 2050 A drying trend of this nature dictates the need for storage reservoirs ex-tensive drainage and irrigation networks and man-agement systems The goal has been to sustain and improve livelihoods through interventions that would benefit individuals and the country as a whole
Water supply and sanitation in large systems Waterdesalination plants intakes storage treatment pumpingstations conveyance and distribution systems seweragedomestic and industrial wastewater treatment plants
Basic drinking water supply and basic sanitationWater supply and sanitation through low-cost technologiessuch as hand-pumps spring catchment gravity-fed systemsrainwater collection storage tanks small distributionsystems latrines small-bore sewers on-site disposal (septictanks)
Water resources policy and administrative manage-ment Water sector policy planning and programmes water legislation and management institution capacity building and advice water supply assessments and studies ground-water water quality and watershed studies hydrogeology Excluding agricultural water resources
Disaster prevention and preparednessFloodprotection and control Disaster risk reduction activitiessuch as developing knowledge natural risks cartographylegal norms for construction early warning systemsemergency contingency stocks and contingency planningincluding preparations for forced displacement Floodsfrom rivers or the sea including sea water intrusion controland sea level rise related activities
Agricultural water resources Irrigation reservoirshydraulic structures groundwater exploitation foragricultural use
Hydroelectric power plants Including power-gener-ating river barrages
Water resources protection Inland surface waters(rivers lakes etc) conservation and rehabilitation ofgroundwater prevention of water contamination fromagrochemicals industrial effluents
River development Integrated river basin projectsriver flow control dams and reservoirs Excluding damsprimarily for irrigation and hydropower and activities relatedto river transport
0
2
4
6
8
10
Status and Trends
Drinking Water Supplyand Sanitation
Some 94 percent of the population in Guyana used an improved drinking water source in 2010 (98 percent
Impact for developmentWater sanitation and hygiene factors were responsible for over 300 deaths in 2004 which accounted for 34 percent of all deaths in Guyana In general improved water and sanitation infrastructure and services provide multiple benefits to the local population for health (decrease in mortality) and labour productivity (lower workplace absenteeism) outcomes They can also underpin confidence and expand markets for industries such as tourism Globally it is estimated that 88 percent of diarrheal diseases are caused by water sanitation and hygiene factors
Under 5 child mortality rate (probability of dying by age 5 per 1000 live births)
Improved drinking water sourceImproved sanitation facilities (both indicators above in of total population)
Access to drinking water and sanitationamp under-5 child mortality(UN Inter-agency Group for Child Mortality Estimation (IGME) and WHOUNICEF Joint Monitoring Programme)
1990 1995 2000 2005 2010
per 1
000
live
birt
hs
60
70
80
90
100
30
40
50
60
70
20112010200920082007200620052004200320022001200019991998199719961995199419931992199119901989198819871986
01010111110111111011021110
00000
2031
0000
1000101000000000
0-0
100 0000
35 000354 717
-100 000
1800
5 950200
12 2007 000
27 310870
03 500
3000
3000
5502 000
0
-15
0-0
165500
---0---
29--0--0----0
Year Numberof Events
Deaths Affected Economic Damage(million current US$)
- means no data available
(Dartmouth Flood Observatory)
lsquoWater-related disastersrsquo within the scope of this WCB study do not include droughts
Ratification of the International Covenant on Econom-ic Social and Cultural Rights (ICESCR)
15 February 1977
(The right to water is implicit within the right to an adequate standard of living and inextricably related to the right to the highest attainable standard of health outlined in the ICESCR)
in urban areas and 93 percent in rural areas) as com-pared to 88 percent in 1994 Some 84 percent of the population had access to improved sanitation facilities in 2010 (82 percent in rural areas and 88 percent in urban areas) up from 78 percent in 1994 Despite these improvements the sewerage and water services face operational maintenance financial and institu-tional challenges
Impact for development With an installed capacity of 1 MW Guyana generated 1 GWh in 2008 which represented less than one percent of the nationrsquos hydropower technically exploitable capability
Energy for Water Water for Energy
Water Intensity in Industry
Environment and Ecosystem Health
Impact for development According to a 2010 UNEP report floods land and water pollution and increased pressure on biodiversity are identified as main environmental priorities for Guyana Some estimated 177 million litres of untreated sewage are reportedly discharged per day into the mouth of the Demerara River The problem of land and water pollution is a consequence of several factors such as inadequate infrastructure limited monitoring insufficient financial resources lack of strong enforcement of environmental regulations In the interior of Guyana mining activities degrade surface water and groundwater
Water quality index 2010
Impact for development Industrial water use is distributed in the manufacturingbottling of beverages food processing extraction of minerals (gold and other) The extractive industries are located in the interior and remote areas of the country and are regulated by the mining regulations with respect to water discharge During dry seasons conflicts arise when mining is done on rivers creeks which serve as potable water sources to local communities
Value generated by industry per m3 of water (FAO AQUASTAT World Bank)
Hydropower capacity and generation 2008 in GWhyear (World Energy Council)
1 36 999 Actual Technically
generation exploitable capability not yet generated
250
mill
ion
cons
tant
200
0 U
S$
134
172
67
(YCELPCIESINColumbia University WEF JRCEuropean Commission) 200
150
100
50
428
A score of 100 indicates optimal performance 1990 1995 2000 2005
Value generated by industry in constant 2000 US$ per m3 of water
Value added by industry in million constant 2000 US$
During 1992 to 2000 the value generated by industry per m3 of water increased by 3 percent annually and during 2000 to 2005 this value decreased by 21 percent annually
The vast majority of agricultural activities takes place in the coastal plains For more than 8 km inland the land is
Irrigated Agriculture
Impact for development The National Drainage and Irrigation Authority has been spending large sums to build and improve drainage and irrigation infrastructure These investments have contributed to earnings of over US$40 million in export sales of rice alone Guyanarsquos rice export has increased both in volume and value in 2010 surpassing all previshyous records Yet limited and dilapidated drainage and irrigation infrastructure especially in main agricultural developed areas remains a challenge In 2011 agriculture accounted for 21 percent of gross domestic prodshyuct In 2012 women accounted for 8 percent of the economically active population in agriculture
Rainfall variability and agricultural GDP (FAO AQUASTAT World Bank)
Value generated by agriculture per m3 of water (FAO AQUASTAT World Bank)
below sea level at high tide Therefore drainage and 250
200
150
mill
ion
cons
tant
200
0 U
S$
009
012water control are major problems and agricultural development has always been tied to the defense against water intrusion from the sea and from rainwater runoff
The establishment of conservancies (ie large shallow dams that trap surface water runoff) and extraction pumps on rivers has sustained regular irrigation water supply During dry periods these systems ensure the ability to meet demand although some deficit in water 100
1963 1968 1978 1988 19981973 1983 1993 2003 supply occur under extreme events such as during El 1990 1995 2000 2005
National rainfall index variability (percentage of deviation from average national
rainfall index)
Variability in agricultural GDP (percentage of deviation from trend of agricultural goods
produced per km2 of agricultural land)
Nintildeo occurrences
During 1992 to 2000 the value generated by agriculture per m3 of water increased by 3 percent annually Rice and sugarcane are the main irrigated crops In addition a small area of citrus and vegetables is irrigated
Agriculture value added in million constant 2000 US$
Value generated by agriculture in constant 2000 US$ per m3 of water
-40
-20
0
20
40
During 1992 to 2000 the value generated by industry per m3 of water increased by 3 percent annually and during 2000 to 2005 this value decreased by 21 percent annually
Government water-related investment over the period 2003 to 2012bull Agricultural water resources received the largest share of investments during this period with notable peaks in 2005 2008 and 2012 when it received 75 59 and 62 million constant 2010 US$ respectivelybull In 2003 water supply and sanitation ndash large systems received 79 million constant 2010 US$ representing the largest amount invested by the government in one water-related category over this period
Water-related official development assistance over the period 2003 to 2011 bull Overall water-related ODA disbursements averaged 141 million constant US$ over the period with a high in 2009 (205 million constant US$) and a low in 2004 (70 million constant US$)bull Flood prevention control combined with disaster prevention and preparedness received with 386 percent the highest share of ODA disbursements In 2008 it accounted for 60 percent of water-related ODA disbursements with 93 million constant 2010 US$ bull Water supply and sanitation ndash large systems received 347 percent of ODA disbursements over the period with a peak in 2009 when 97 million constant US$ amounted to 369 percent of all water-related ODA disbursementsbull Agricultural water resources received support from ODA only in 2010 and 2011
Actual expenditure refers to the amount spent by the government during a given year Where actual expenditure data is not available the government budget is used and refers to the amount that the government reportedly budgeted for the given year The OECD Creditor Reporting System categories were chosen for the collection of these water-related investments and the data was obtained by the WCB project through in-country research in cooperation with the government (during 2012) while ODA data stems from the OECD Creditor Reporting System (collected December 2012)
Official development assistance gross disburse-ments during the period 2003 - 2011(million constant 2010 US$)
2003 20032007 20072009 20092011 20112005 2005
Government expenditure during the period2003 ndash 2010 and budget for the years 2011 amp 2012(million constant 2010 US$)
Mill
ion
cons
tant
201
0 U
S$
Environment andEcosystem Health
The vast majority of agricultural activities takes place in the coastal plains For more than 8 km inland the land is below sea level at high tide Therefore drainage and water control are major problems and agricultural development has always been tied to the defense against water intrusion from the sea and from rainwater runoff
The establishment of conservancies (ie large shallow dams that trap surface water runoff) and extraction pumps on rivers has sustained regular irrigation water supply During dry periods these systems ensure the ability to meet demand although some deficit in water supply occur under extreme events such as during El Nintildeo occurrences
During 1992 to 2000 the value generated by agriculture per m3 of water increased by 3 percent annually Rice and sugarcane are the main irrigated crops In addition a small area of citrus and vegetables is irrigated
Impact for developmentWith an installed capacity of 1 MW Guyanagenerated 1 GWh in 2008 which representedless than one percent of the nationrsquos hydropowertechnically exploitable capability
Energy for WaterWater for Energy
Irrigated Agriculture
Impact for developmentThe National Drainage and Irrigation Authority has been spending large sums to build and improve drainageand irrigation infrastructure These investments have contributed to earnings of over US$40 million in exportsales of rice alone Guyanarsquos rice export has increased both in volume and value in 2010 surpassing all previ-ous records Yet limited and dilapidated drainage and irrigation infrastructure especially in main agriculturaldeveloped areas remains a challenge In 2011 agriculture accounted for 21 percent of gross domestic prod-uct In 2012 women accounted for 8 percent of the economically active population in agriculture
Rainfall variability and agricultural GDP(FAO AQUASTAT World Bank)
National rainfall index variability(percentage of deviation from average national
rainfall index)
Variability in agricultural GDP(percentage of deviation from trend of agricultural goods
produced per km2 of agricultural land)
1963 1968 1978 1988 19981973 1983 1993 2003
Impact for developmentAccording to a 2010 UNEP report floods land and water pollution and increased pressure on biodiversity are identified as main environmental priorities for Guyana Some estimated 177 million litres of untreated sewage are reportedly discharged per day into the mouth of the Demerara River The problem of land and water pollution is a consequence of several factors such as inadequate infrastructure limited monitoring insufficient financial resources lack of strong enforcement of environmental regulations In the interior of Guyana mining activities degrade surface water and groundwater
Impact for developmentIndustrial water use is distributed in the manufacturingbottling of beverages food processing extraction of minerals (gold and other) The extractive industries are located in the interior and remote areas of the country and are regulated by the mining regulations with respect to water discharge During dry seasons conflicts arise when mining is done on rivers creeks which serve as potable water sources to local communities
Water Intensityin Industry
Value added by industryin million constant 2000 US$
Value generated by industry per m3 of water(FAO AQUASTAT World Bank)
mill
ion
cons
tant
200
0 U
S$
Value generated by industryin constant 2000 US$ per m3 of water
1990 1995 2000 2005
Water quality index 2010
A score of 100 indicates optimal performance
428
(YCELPCIESINColumbia University WEF JRCEuropean Commission)
Actualgeneration
Technicallyexploitable capabilitynot yet generated
1 36 999
Hydropower capacity and generation 2008in GWhyear (World Energy Council)
Water supply and sanitation in large systems Waterdesalination plants intakes storage treatment pumpingstations conveyance and distribution systems seweragedomestic and industrial wastewater treatment plants
Basic drinking water supply and basic sanitationWater supply and sanitation through low-cost technologiessuch as hand-pumps spring catchment gravity-fed systemsrainwater collection storage tanks small distributionsystems latrines small-bore sewers on-site disposal (septictanks)
Water resources policy and administrative manage-ment Water sector policy planning and programmes water legislation and management institution capacity building and advice water supply assessments and studies ground-water water quality and watershed studies hydrogeology Excluding agricultural water resources
Disaster prevention and preparednessFloodprotection and control Disaster risk reduction activitiessuch as developing knowledge natural risks cartographylegal norms for construction early warning systemsemergency contingency stocks and contingency planningincluding preparations for forced displacement Floodsfrom rivers or the sea including sea water intrusion controland sea level rise related activities
Agricultural water resources Irrigation reservoirshydraulic structures groundwater exploitation foragricultural use
Hydroelectric power plants Including power-gener-ating river barrages
Water resources protection Inland surface waters(rivers lakes etc) conservation and rehabilitation ofgroundwater prevention of water contamination fromagrochemicals industrial effluents
River development Integrated river basin projectsriver flow control dams and reservoirs Excluding damsprimarily for irrigation and hydropower and activities relatedto river transport
0
2
4
6
8
10
Status and Trends
-40
-20
0
20
40
mill
ion
cons
tant
200
0 U
S$
20001990 1995 2005
Agriculture value addedin million constant 2000 US$
Value generated by agriculturein constant 2000 US$ per m3 of water
Value generated by agriculture per m3 of water(FAO AQUASTAT World Bank)
100
150
200
250
009
012
50
100
150
200
250
134
172
67
Water - related Disasters
2011 2010 2009 2008 2007 2006 2005 2004 2003 2002 2001 2000 1999 1998 1997 1996 1995 1994 1993 1992 1991 1990 1989 1988 1987 1986
0 1 0 1 0 1 1 1 1 1 0 1 1 1 1 1 1 0 1 1 0 2 1 1 1 0
0 0 0 0 0
20 31
0 0 0 0
10 0 0 1 0 1 0 0 0 0 0 0 0 0 0
0 -0
100 000 0
35 000 354 717
-100 000
180 0
5 950 200
12 200 7 000
27 310 870
0 3 500
300 0
300 0
550 2 000
0
-15
0 -0
165 500
---0 ---
29 --0 --0 ----0
Year Number of Events
Deaths Affected Economic Damage (million current US$)
- means no data available
(Dartmouth Flood Observatory)
Impact for development Guyana has not been impacted too significantly by water-related disasters Nonetheless the available data indicates that between 1980 and 2011 over 650 000 people were affected During the same period there are only four data points of reported economic damage totaling million current US$ 709 worth in economic damage
Estimates from climate models developed by the United Kingdomrsquos Meteorological Officersquos Hadley Centre predict that Guyana will experience a general drying trend Even though Guyana belongs to those countries in the world with the highest rainfall models show that Guyana will be among the most afshyfected countries in the world by climate change with average precipitation having decreased by roughly 1 mmday between now and 2050 A drying trend of this nature dictates the need for storage reservoirs exshytensive drainage and irrigation networks and manshyagement systems The goal has been to sustain and improve livelihoods through interventions that would benefit individuals and the country as a whole
lsquoWater-related disastersrsquo within the scope of this WCB study do not include droughts
Impact for development Guyana has well established national institutions and agencies overseeing water-related matters However there is a lack of monitoring data to make informed decisions on the efficient use and manageshyment of water sources The government faces the need to strengthen these organizations through training of staff and increasing budgetary allocations
Tracking Water Drinking Water Supply and Sanitation
Governance
Impact for development Water sanitation and hygiene factors were responsible for over 300 deaths in 2004 which accounted for 34 percent of all deaths in Guyana In general improved water and sanitation infrastructure and services provide multiple benefits to the local population for health (decrease in mortality) and labour productivity (lower workplace absenteeism) outcomes They can also underpin confidence and expand markets for industries such as tourism Globally it is estimated that 88 percent of diarrheal diseases are caused by water sanitation and hygiene factors
Access to drinking water and sanitation amp under-5 child mortality (UN Inter-agency Group for Child Mortality Estimation (IGME) and WHOUNICEF Joint Monitoring Programme)
100 70
90
80
per 1
000
live
birt
hs
30
40
50
60
1990 1995 2000 2005 2010
70
60
Several institutions are involved in the management of Guyanas water resources For example water supply to the majority of the country is provided through the Guyana Water Authority (GUYWA)
Improved drinking water source Improved sanitation facilities (both indicators above in of total population) Under 5 child mortality rate
monitoring of water quality and sewerage and sanita- Ratification of the International Covenant on Economshy (probability of dying by age 5 per 1000 live births) tion activities are under the Ministry of Health the ic Social and Cultural Rights (ICESCR) National Drainage and Irrigation Board (NDIB) is 15 February 1977 responsible for drainage and irrigation the Ministry in urban areas and 93 percent in rural areas) as comshyof Public Works Communications and Regional Development establishes water sector policy and the Hydrometeorology Department of the Ministry
(The right to water is implicit within the right to an adequate standard of living and inextricably related to the right to the highest attainable standard of health outlined in the ICESCR)
pared to 88 percent in 1994 Some 84 percent of the population had access to improved sanitation facilities in 2010 (82 percent in rural areas and 88 percent in
of Agriculture oversees monitoring and assessment urban areas) up from 78 percent in 1994 Despite of surface water and groundwater resources and the Some 94 percent of the population in Guyana used an these improvements the sewerage and water services provision of basic meteorological information improved drinking water source in 2010 (98 percent face operational maintenance financial and institushy
tional challenges
year
The Money StreamFrom 2003 to 2011 the government has invested US$ 612 million (in constant 2010 US$) on average peryear on water-related infrastructure and programmes Over 90 percent of the governmentrsquos investmentswere channeled into agricultural water resources (535 percent) and water supply and sanitation - largesystems (372 percent)
During the same period official development assistance (ODA) gross disbursements amounted to US$ 1405 million on average per year Three quarters of ODA disbursements were channeled into disaster prevention and preparedness and flood preventioncontrol (386 percent) and water supply and sanitation - large systems (347 percent)
Over the period 2003 to 2010 the Government of Guyanarsquos water-related expenditure accounted for anestimated 19 percent of total government expenditures
19
758 000 inhabitants
214 970 km2
4 inhabitantskm2
0636118
0490
34
2 387 mmyear
241 000 million m3year
317 942 m3inhabitant
06
150 000 ha
34
not avalaible
Total population (UN Population Division)
Total area
Population density
Human Development Index (UNDP)
(between 0 and 1 1 is highest)Country rank (total 186 countries 1 is highest)Gender Inequality Index (0 is equality between women and men 1 is least equality)
Water sanitation and hygiene-related deaths of total deaths (WHO)
Long-term average annual precipitation (CRU CL 20)
Long-term average actual renewable water resources (FAO AQUASTAT)
Actual annual renewable water resources per capita (FAO AQUASTAT)
of total actual renewable freshwater resources withdrawn (MDG Water Indicator) (FAO AQUASTAT)
Total area equipped for irrigation (FAO FAOSTAT)
of the cultivated area equipped for irrigation(FAO FAOSTAT)
Ramsar sites (Ramsar) ndash number ndash total area
2012
2011
2012
2012
2004
2011
2011
2012
2010
2008
2008
2011
2013
Estimated of water-related expenditure to total government expenditure (2003 to 2010)
Industrial
Municipal
Water withdrawals by sector(total 1 444 million m3 in 2010)
1442
944 Agricultural
Data ConcernsData is a vital input to water management and invest-ment in water related infrastructure and projectsData and available research for Guyana is sparse
Investments in coordinated data collection collation analysis and dissemination is vital to demonstrate the benefits of water-related investments to governmentsdonors and ultimately private capital investors
It is to be noted that it is virtually impossible to find national-level gender-disaggregated data for almost allthemes contained in the UN-Water Country Briefs
Disclaimersbull The most recent and updated information can be found in the original databases cited throughout
bull The rapid assessment methodology presentedhere is an advocacy tool designed to generatedebate and attention to the issues and is devel-oped in conjunction with national governmentfocal points
bull Data presented herein stems either from existing databases or was collected from national reports experts and institutions and in some cases raw data underwent various manipulations to categorize the information for this presentation
bull Due to data limitations the investment-relatedestimates may not include water-related invest-ments that are counted under other categoriesof investments and some investment categories(ie disaster prevention and preparedness)may include some investments that are not directly water-related Moreover water being acrosscutting issue investments in other parts ofthe government (not calculated here) may also benefit water management
bull The words investments invested funded for ODA refer to gross disbursements of ODA according to the OECD definitions The wordsinvestments invested funded for governmentrefer to government expenditure (2003 ndash 2010)and government budget (2011 amp 2012) Inaddition investment data and analysis do notinclude any other forms of investment (such as private sector investments)
This project was implemented by the AQUASTAT Programme of the Food and Agriculture Organization of the United Nations (FAO) on behalf of UN-Water with financial support from United States Department of State (USDS) Brief produced 19 June 2013
Additional information on the project data and methodologies can be accessed at
httpwwwunwaterorgWaterCountryBriefshtml
Annual average official development assistance gross disbursements during the period 2003 - 2011 (million constant 2010 US$)
Annual average government expenditure during the period 2003 - 2010 and budget for the year 2011
(million constant 2010 US$)
327228054003000000000000
092488210063543007001001
total annual average total annual average612 1405
Disaster prevention and prepared-nessflood protection and control
535372
880500000000___
100
66347
14945
386050101___
100
GuyanaUN-Water Country Brief
AtlanticOcean
I
IIIII
IV V
VI
VII
VIII
IX
X
BOLIVARIAN REPUBLICOF VENEZUELA
BRAZIL
SURINAME
Georgetown
Essequibo
Potaro
Mazaruni
Cuy uni
Dem
erar
aBe
rbic
e
Corentyne
Esse
quib
o
Kw
itaro
Kuyuw ini
Rupununi
Bar
am aBarim
a
Torani canal
Pomeroon
Canje
Mah
aica
Takat
u
Tapakuma
Boerasirie
Boerasirie EDWC
Abary
Abary
Waini
Core
ntyn
e
Mahdia
Mabaruma
Lethem
Linden
Bartica
Anna Regina
Corriverton
New Amsterdam
At lan ticOcea n
GUYANA
Albers Equal Area Projection WGS 1984
Legend
The designations employed and the presentation of material in this publication do not imply the expression of any opinion whatsoever on the part of theFood and Agriculture Organization of the United Nations concerning the legal status of any country territory city or area or of its authorities
or concerning the delimitation of its frontiers or boundaries
Disclaimer
FAO - AQUASTAT 2013
0 100 20050 Kilometers
Zone of Irrigation Development
Capital Regional Capital Town
Administrative Boundary
International Boundary River
Canal
Lake
Barima - WainiPomeroon - SupenaarnEssequibo Islands - West DemeraraDemerara - MahaicaMahaica - BerbiceEast Berbice - CorentyneCuyuni - MazaruniPotaro - SiparuniUpper Takutu - Upper EssequiboUpper Demerara - Berbice
IIIIIIIVVVIVIIVIIIIXX
Regions of Guyana
Dam Conservancy
Legend The rapid assessment of the situation above based on available data was established in conjunction with in-country experts and officials It provides an overview of trends according to the following
trends are of significant concern
trends are of concern
trends are stable or progressing on certain issues but not on others
trends show some measure of improvement in all relevant indicators assessed
trends show significant improveshyment and there is no concern
insufficient data
Rapid Assessment
Accurate assessments of progress require relevant accurate and timely data The above data quality assessment ranges from
very poor very good
Investments Overall less than an estimated 2 percent of the total government expenditures has been spent on water-related matters Government investments have been allocated mainly to agricultural water resources and water supply and sanitation - large systems ODA disbursements went mainly to disaster prevention and preparedness and flood preventioncontrol and water supply and sanitation - large systems
Overall Pressures on water The highest density of population roughly 90 pershycent is within the coastal area and thus all residents of the coastal area depend wholly on groundwater supply to meet their domestic needs One exception is the Georgetown area where 30 percent of the water used is surface water from the East-Demerara conservancy Although Guyana has institutions agencies policies and regulations in place to promote proper water management the country still faces numerous water-related challenges such as (i) inadequate irrigation water supply during dry seasons and flooding during wet seasons in farming and residential areas (ii) contamination of potable water supplies leading to water-borne diseases such as vector-borne lymphatic-filariasis and leptospirosis (iii) limited and dilapidated drainage and irrigation infrastructure especially in the main agricultural areas and (iv) lack of highly-qualified personnel within water sector institutions
Data Quality
There is a lack of data on certain key indicators
Limited data on drinking water quality is available
Data is not readily available
A detailed disaster database is not available
Data is not readily available especially on the energy requirements of providing water and treating wastewater
Data is not readily available
Data is not readily available There is no data available on the equity and human rights on sanishytation and drinking water within the UN-Water GLAAS Report 2012
Assessments Irrigated agriculture Recent improvements in drainage and irrigation infrastructure have led to an increase in irrigated crop yields
Drinking water supply and sanitation Since 1998 both urban and rural areas have experienced a constant increment in use of an improved drinking water source and improved sanitation facility The maintenance of water supply and sanitation services in Guyana has always been a challenge
Water intensity in industry During 1992 to 2000 the value generated by industry per m3 of water increased by 3 percent annually and during 2000 to 2005 this value decreased by 21 percent annually
Water-related disasters Although Guyana is not a disaster-prone country forecasts predict that Guyana will be significantly affected in terms of drying trend
Water for energy energy for water In Guyana almost the entire technically exploitable hydropower potential remains untapped There are plans to develop hydropower in the country
Environment and ecosystem health Water pollution and increased pressure on biodiversity are identified as main environmental priorities for Guyana
Tracking governance Guyana has institutions agencies policies and regulations in place to promote proper water manageshyment though the country still faces water stress challenges
Legend The rapid assessment of the situation above based on available data was established in conjunction with in-country experts and officials It provides an overview of trends according to the following
trends are of significant concern
trends are of concern
trends are stable or progressing on certain issues but not on others
trends show some measure of improvement in all relevant indicators assessed
trends show significant improve-ment and there is no concern
insufficient data
Rapid Assessmentyear
The Money StreamFrom 2003 to 2011 the government has invested US$ 612 million (in constant 2010 US$) on average per year on water-related infrastructure and programmes Over 90 percent of the governmentrsquos investments were channeled into agricultural water resources (535 percent) and water supply and sanitation - large systems (372 percent)
During the same period official development assistance (ODA) gross disbursements amounted to US$ 1405 million on average per year Three quarters of ODA disbursements were channeled into disaster prevention and preparedness and flood preventioncontrol (386 percent) and water supply and sanitation - large systems (347 percent)
Over the period 2003 to 2010 the Government of Guyanarsquos water-related expenditure accounted for an estimated 19 percent of total government expenditures
Accurate assessments of progress require relevant accurate and timely data The above data quality assessment ranges from
very poor very good
InvestmentsOverall less than an estimated 2 percent of the total government expenditures has been spent on water-related matters Government investments have been allocated mainly to agricultural water resources and water supply and sanitation - large systems ODA disbursements went mainly to disaster prevention and preparedness and flood preventioncontrol and water supply and sanitation - large systems
OverallPressures on waterThe highest density of population roughly 90 per-cent is within the coastal area and thus all residents of the coastal area depend wholly on groundwater supply to meet their domestic needs One exception is the Georgetown area where 30 percent of the water used is surface water from the East-Demerara conservancy Although Guyana has institutions agencies policies and regulations in place to promote proper water management the country still faces numerous water-related challenges such as (i) inadequate irrigation water supply during dry seasons and flooding during wet seasons in farming and residential areas (ii) contamination of potable water supplies leading to water-borne diseases such as vector-borne lymphatic-filariasis and leptospirosis (iii) limited and dilapidated drainage and irrigation infrastructure especially in the main agricultural areas and (iv) lack of highly-qualified personnel within water sector institutions
19
758 000 inhabitants
214 970 km2
4 inhabitantskm2
0636118
0490
34
2 387 mmyear
241 000 million m3year
317 942 m3inhabitant
06
150 000 ha
34
not avalaible
Total population (UN Population Division)
Total area
Population density
Human Development Index (UNDP)
(between 0 and 1 1 is highest)Country rank (total 186 countries 1 is highest)Gender Inequality Index (0 is equality between women and men 1 is least equality)
Water sanitation and hygiene-related deaths of total deaths (WHO)
Long-term average annual precipitation (CRU CL 20)
Long-term average actual renewable water resources (FAO AQUASTAT)
Actual annual renewable water resources per capita (FAO AQUASTAT)
of total actual renewable freshwater resources withdrawn (MDG Water Indicator) (FAO AQUASTAT)
Total area equipped for irrigation (FAO FAOSTAT)
of the cultivated area equipped for irrigation(FAO FAOSTAT)
Ramsar sites (Ramsar) ndash number ndash total area
2012
2011
2012
2012
2004
2011
2011
2012
2010
2008
2008
2011
2013
Estimated of water-related expenditure to total government expenditure (2003 to 2010)
Industrial
Municipal
Water withdrawals by sector(total 1 444 million m3 in 2010)
1442
944 Agricultural
Annual average official development assistance gross disbursements during the period 2003 - 2011 (million constant 2010 US$)
Annual average government expenditure during the period 2003 - 2010 and budget for the year 2011
(million constant 2010 US$)
327228054003000000000000
092488210063543007001001
total annual average total annual average612 1405
Disaster prevention and prepared-nessflood protection and control
535372
880500000000___
100
66347
14945
386050101___
100
Data Quality
There is a lack of data on certain key indicators
Limited data on drinking water quality is available
Data is not readily available
A detailed disaster database is not available
Data is not readily available especially on the energy requirements of providing water and treating wastewater
Data is not readily available
Data is not readily available There is no data available on the equity and human rights on sani-tation and drinking water within the UN-Water GLAAS Report 2012
AssessmentsIrrigated agricultureRecent improvements in drainage and irrigation infrastructure have led to an increase in irrigated crop yields
Drinking water supply and sanitationSince 1998 both urban and rural areas have experienced a constant increment in use of an improved drinking water source and improved sanitation facility The maintenance of water supply and sanitation services in Guyana has always been a challenge
Water intensity in industry During 1992 to 2000 the value generated by industry per m3 of water increased by 3 percent annually and during 2000 to 2005 this value decreased by 21 percent annually
Water-related disasters Although Guyana is not a disaster-prone country forecasts predict that Guyana will be significantly affected in terms of drying trend
Water for energy energy for water In Guyana almost the entire technically exploitable hydropower potential remains untapped There are plans to develop hydropower in the country
Environment and ecosystem healthWater pollution and increased pressure on biodiversity are identified as main environmental priorities for Guyana
Tracking governanceGuyana has institutions agencies policies and regulations in place to promote proper water manage-ment though the country still faces water stress challenges
GuyanaUN-Water Country Brief
Es s equibo
Potar o
Mazaruni
Cuy un i
D e m
era r
a Be
rbic
e
Corentyne
E s s
e qui
b o
Kw
itaro
Kuy u w ini
Rupununi
B ar
a m a Barim
a
Torani canal
Pomeroon
Cane
Mah
aica
Takat
u
Ta p a k u m a
Boerasirie
Bo e ra s i ri e EDWC
Abary
Ab ary
W a i n i
Core
ntyn
e
Data Concerns
Ocean V Mahaica - Berbice j
Anna Regina
Corriverton Linden
Data is a vital input to water management and investshyment in water related infrastructure and projects Data and available research for Guyana is sparse
Investments in coordinated data collection collation analysis and dissemination is vital to demonstrate the benefits of water-related investments to governments donors and ultimately private capital investors
It is to be noted that it is virtually impossible to find national-level gender-disaggregated data for almost all themes contained in the UN-Water Country Briefs
Regions of Guyana I Barima - Waini II Pomeroon - Supenaarn III Essequibo Islands - West Demerara
Mabaruma
Atlantic IV Demerara - Mahaica
Legend
International Boundary River
At lan tic Administrative Boundary Canal Ocea n
Capital Regional Capital Town Dam Conservancy
Zone of Irrigation Development Lake
0 50 100 200 Kilometers
Albers Equal Area Projection WGS 1984
GUYANA FAO - AQUASTAT 2013
Disclaimer The designations employed and the presentation of material in this publication do not imply the expression of any opinion whatsoever on the part of the
Food and Agriculture Organization of the United Nations concerning the legal status of any country territory city or area or of its authoritiesor concerning the delimitation of its frontiers or boundaries
This project was implemented by the AQUASTAT Programme of the Food and Agriculture Organization of the United Nations (FAO) on behalf of UN-Water with financial support from United States Department of State (USDS) Brief produced 19 June 2013
Additional information on the project data and methodologies can be accessed at
httpwwwunwaterorg WaterCountryBriefshtml
I VI East Berbice - Corentyne VII Cuyuni - Mazaruni VIII Potaro - Siparuni IX Upper Takutu - Upper Essequibo
II BOLIVARIAN REPUBLIC X Upper Demerara - Berbice
OF VENEZUELA Georgetown III Bartica
IV V New Amsterdam
Disclaimers bull The most recent and updated information can be found in the original databases cited throughout
VII
X VI bull The rapid assessment methodology presented Mahdia
here is an advocacy tool designed to generate VIII debate and attention to the issues and is develshyoped in conjunction with national government focal points
SURINAME bull Data presented herein stems either from existing databases or was collected from national reports experts and institutions and in some cases raw data underwent various manipulations to
Lethem
IX categorize the information for this presentation BRAZIL
bull Due to data limitations the investment-related estimates may not include water-related investshyments that are counted under other categories of investments and some investment categories (ie disaster prevention and preparedness) may include some investments that are not directly water-related Moreover water being a crosscutting issue investments in other parts of the government (not calculated here) may also benefit water management
bull The words investments invested funded for ODA refer to gross disbursements of ODA according to the OECD definitions The words investments invested funded for government refer to government expenditure (2003 ndash 2010) and government budget (2011 amp 2012) In addition investment data and analysis do not include any other forms of investment (such as private sector investments)

During 1992 to 2000 the value generated by industry per m3 of water increased by 3 percent annually and during 2000 to 2005 this value decreased by 21 percent annually
Environment andEcosystem Health
The vast majority of agricultural activities takes place in the coastal plains For more than 8 km inland the land is below sea level at high tide Therefore drainage and water control are major problems and agricultural development has always been tied to the defense against water intrusion from the sea and from rainwater runoff
The establishment of conservancies (ie large shallow dams that trap surface water runoff) and extraction pumps on rivers has sustained regular irrigation water supply During dry periods these systems ensure the ability to meet demand although some deficit in water supply occur under extreme events such as during El Nintildeo occurrences
During 1992 to 2000 the value generated by agriculture per m3 of water increased by 3 percent annually Rice and sugarcane are the main irrigated crops In addition a small area of citrus and vegetables is irrigated
Impact for developmentWith an installed capacity of 1 MW Guyanagenerated 1 GWh in 2008 which representedless than one percent of the nationrsquos hydropowertechnically exploitable capability
Energy for WaterWater for Energy
Water - relatedDisasters
Impact for developmentGuyana has well established national institutions and agencies overseeing water-related matters However there is a lack of monitoring data to make informed decisions on the efficient use and manage-ment of water sources The government faces the need to strengthen these organizations through training of staff and increasing budgetary allocations
Tracking WaterGovernance
Irrigated Agriculture
Impact for developmentThe National Drainage and Irrigation Authority has been spending large sums to build and improve drainageand irrigation infrastructure These investments have contributed to earnings of over US$40 million in exportsales of rice alone Guyanarsquos rice export has increased both in volume and value in 2010 surpassing all previ-ous records Yet limited and dilapidated drainage and irrigation infrastructure especially in main agriculturaldeveloped areas remains a challenge In 2011 agriculture accounted for 21 percent of gross domestic prod-uct In 2012 women accounted for 8 percent of the economically active population in agriculture
Rainfall variability and agricultural GDP(FAO AQUASTAT World Bank)
National rainfall index variability(percentage of deviation from average national
rainfall index)
Variability in agricultural GDP(percentage of deviation from trend of agricultural goods
produced per km2 of agricultural land)
1963 1968 1978 1988 19981973 1983 1993 2003
Impact for developmentAccording to a 2010 UNEP report floods land and water pollution and increased pressure on biodiversity are identified as main environmental priorities for Guyana Some estimated 177 million litres of untreated sewage are reportedly discharged per day into the mouth of the Demerara River The problem of land and water pollution is a consequence of several factors such as inadequate infrastructure limited monitoring insufficient financial resources lack of strong enforcement of environmental regulations In the interior of Guyana mining activities degrade surface water and groundwater
Impact for developmentIndustrial water use is distributed in the manufacturingbottling of beverages food processing extraction of minerals (gold and other) The extractive industries are located in the interior and remote areas of the country and are regulated by the mining regulations with respect to water discharge During dry seasons conflicts arise when mining is done on rivers creeks which serve as potable water sources to local communities
Water Intensityin Industry
Value added by industryin million constant 2000 US$
Value generated by industry per m3 of water(FAO AQUASTAT World Bank)
mill
ion
cons
tant
200
0 U
S$
Value generated by industryin constant 2000 US$ per m3 of water
1990 1995 2000 2005
Several institutions are involved in the management of Guyanas water resources For example watersupply to the majority of the country is provided through the Guyana Water Authority (GUYWA)monitoring of water quality and sewerage and sanita-tion activities are under the Ministry of Health the National Drainage and Irrigation Board (NDIB) is responsible for drainage and irrigation the Ministryof Public Works Communications and RegionalDevelopment establishes water sector policy andthe Hydrometeorology Department of the Ministryof Agriculture oversees monitoring and assessmentof surface water and groundwater resources and theprovision of basic meteorological information
Water quality index 2010
A score of 100 indicates optimal performance
428
(YCELPCIESINColumbia University WEF JRCEuropean Commission)
Impact for developmentGuyana has not been impacted too significantly by water-related disasters Nonetheless the available data indicates that between 1980 and 2011 over 650 000 people were affected During the same period there are only four data points of reported economic damage totaling million current US$ 709 worth in economic damage
Actualgeneration
Technicallyexploitable capabilitynot yet generated
1 36 999
Hydropower capacity and generation 2008in GWhyear (World Energy Council)
Estimates from climate models developed by the United Kingdomrsquos Meteorological Officersquos Hadley Centre predict that Guyana will experience a general drying trend Even though Guyana belongs to those countries in the world with the highest rainfall models show that Guyana will be among the most af-fected countries in the world by climate change with average precipitation having decreased by roughly 1 mmday between now and 2050 A drying trend of this nature dictates the need for storage reservoirs ex-tensive drainage and irrigation networks and man-agement systems The goal has been to sustain and improve livelihoods through interventions that would benefit individuals and the country as a whole
-40
-20
0
20
40
mill
ion
cons
tant
200
0 U
S$
20001990 1995 2005
Agriculture value addedin million constant 2000 US$
Value generated by agriculturein constant 2000 US$ per m3 of water
Value generated by agriculture per m3 of water(FAO AQUASTAT World Bank)
100
150
200
250
009
012
Drinking Water Supplyand Sanitation
Some 94 percent of the population in Guyana used an improved drinking water source in 2010 (98 percent
Impact for developmentWater sanitation and hygiene factors were responsible for over 300 deaths in 2004 which accounted for 34 percent of all deaths in Guyana In general improved water and sanitation infrastructure and services provide multiple benefits to the local population for health (decrease in mortality) and labour productivity (lower workplace absenteeism) outcomes They can also underpin confidence and expand markets for industries such as tourism Globally it is estimated that 88 percent of diarrheal diseases are caused by water sanitation and hygiene factors
Under 5 child mortality rate (probability of dying by age 5 per 1000 live births)
Improved drinking water sourceImproved sanitation facilities (both indicators above in of total population)
Access to drinking water and sanitationamp under-5 child mortality(UN Inter-agency Group for Child Mortality Estimation (IGME) and WHOUNICEF Joint Monitoring Programme)
1990 1995 2000 2005 2010
per 1
000
live
birt
hs
60
70
80
90
100
30
40
50
60
70
50
100
150
200
250
134
172
67
20112010200920082007200620052004200320022001200019991998199719961995199419931992199119901989198819871986
01010111110111111011021110
00000
2031
0000
1000101000000000
0-0
100 0000
35 000354 717
-100 000
1800
5 950200
12 2007 000
27 310870
03 500
3000
3000
5502 000
0
-15
0-0
165500
---0---
29--0--0----0
Year Numberof Events
Deaths Affected Economic Damage(million current US$)
- means no data available
(Dartmouth Flood Observatory)
lsquoWater-related disastersrsquo within the scope of this WCB study do not include droughts
Ratification of the International Covenant on Econom-ic Social and Cultural Rights (ICESCR)
15 February 1977
(The right to water is implicit within the right to an adequate standard of living and inextricably related to the right to the highest attainable standard of health outlined in the ICESCR)
in urban areas and 93 percent in rural areas) as com-pared to 88 percent in 1994 Some 84 percent of the population had access to improved sanitation facilities in 2010 (82 percent in rural areas and 88 percent in urban areas) up from 78 percent in 1994 Despite these improvements the sewerage and water services face operational maintenance financial and institu-tional challenges
10
Status and Trends
Government expenditure during the period Official development assistance gross disburseshy2003 ndash 2010 and budget for the years 2011 amp 2012 ments during the period 2003 - 2011 (million constant 2010 US$) (million constant 2010 US$)
Mill
ion
cons
tant
201
0 U
S$
8
6
4
2
0
2003 2005 2007 2009 2011 2003 2005 2007 2009 2011
Government water-related investment over the period 2003 to 2012 bull Agricultural water resources received the largest share of investments during this period with notable peaks in 2005 2008 and 2012 when it received 75 59 and 62 million constant 2010 US$ respectively bull In 2003 water supply and sanitation ndash large systems received 79 million constant 2010 US$ representing the largest amount invested by the government in one water-related category over this period
Water-related official development assistance over the period 2003 to 2011 bull Overall water-related ODA disbursements averaged 141 million constant US$ over the period with a high in 2009 (205 million constant US$) and a low in 2004 (70 million constant US$) bull Flood prevention control combined with disaster prevention and preparedness received with 386 percent the highest share of ODA disbursements In 2008 it accounted for 60 percent of water-related ODA disbursements with 93 million constant 2010 US$ bull Water supply and sanitation ndash large systems received 347 percent of ODA disbursements over the period with a peak in 2009 when 97 million constant US$ amounted to 369 percent of all water-related ODA disbursements bull Agricultural water resources received support from ODA only in 2010 and 2011
Actual expenditure refers to the amount spent by the government during a given year Where actual expenditure data is not available the government budget is used and refers to the amount that the government reportedly budgeted for the given year The OECD Creditor Reporting System categories were chosen for the collection of these water-related investments and the data was obtained by the WCB project through in-country research in cooperation with the government (during 2012) while ODA data stems from the OECD Creditor Reporting System (collected December 2012)
Water supply and sanitation in large systems Water desalination plants intakes storage treatment pumping stations conveyance and distribution systems sewerage domestic and industrial wastewater treatment plants
Basic drinking water supply and basic sanitation Water supply and sanitation through low-cost technologies such as hand-pumps spring catchment gravity-fed systems rainwater collection storage tanks small distribution systems latrines small-bore sewers on-site disposal (septic tanks)
Water resources policy and administrative manageshyment Water sector policy planning and programmes water legislation and management institution capacity building and advice water supply assessments and studies groundshywater water quality and watershed studies hydrogeology Excluding agricultural water resources
Disaster prevention and preparednessFlood protection and control Disaster risk reduction activities such as developing knowledge natural risks cartography legal norms for construction early warning systems emergency contingency stocks and contingency planning including preparations for forced displacement Floods from rivers or the sea including sea water intrusion control and sea level rise related activities
Agricultural water resources Irrigation reservoirs hydraulic structures groundwater exploitation for agricultural use
Hydroelectric power plants Including power-genershyating river barrages
Water resources protection Inland surface waters (rivers lakes etc) conservation and rehabilitation of groundwater prevention of water contamination from agrochemicals industrial effluents
River development Integrated river basin projects river flow control dams and reservoirs Excluding dams primarily for irrigation and hydropower and activities related to river transport
Government water-related investment over the period 2003 to 2012bull Agricultural water resources received the largest share of investments during this period with notable peaks in 2005 2008 and 2012 when it received 75 59 and 62 million constant 2010 US$ respectivelybull In 2003 water supply and sanitation ndash large systems received 79 million constant 2010 US$ representing the largest amount invested by the government in one water-related category over this period
Water-related official development assistance over the period 2003 to 2011 bull Overall water-related ODA disbursements averaged 141 million constant US$ over the period with a high in 2009 (205 million constant US$) and a low in 2004 (70 million constant US$)bull Flood prevention control combined with disaster prevention and preparedness received with 386 percent the highest share of ODA disbursements In 2008 it accounted for 60 percent of water-related ODA disbursements with 93 million constant 2010 US$ bull Water supply and sanitation ndash large systems received 347 percent of ODA disbursements over the period with a peak in 2009 when 97 million constant US$ amounted to 369 percent of all water-related ODA disbursementsbull Agricultural water resources received support from ODA only in 2010 and 2011
Actual expenditure refers to the amount spent by the government during a given year Where actual expenditure data is not available the government budget is used and refers to the amount that the government reportedly budgeted for the given year The OECD Creditor Reporting System categories were chosen for the collection of these water-related investments and the data was obtained by the WCB project through in-country research in cooperation with the government (during 2012) while ODA data stems from the OECD Creditor Reporting System (collected December 2012)
Official development assistance gross disburse-ments during the period 2003 - 2011(million constant 2010 US$)
2003 20032007 20072009 20092011 20112005 2005
Government expenditure during the period2003 ndash 2010 and budget for the years 2011 amp 2012(million constant 2010 US$)
Mill
ion
cons
tant
201
0 U
S$
Water - relatedDisasters
Impact for developmentGuyana has well established national institutions and agencies overseeing water-related matters However there is a lack of monitoring data to make informed decisions on the efficient use and manage-ment of water sources The government faces the need to strengthen these organizations through training of staff and increasing budgetary allocations
Tracking WaterGovernance
Several institutions are involved in the management of Guyanas water resources For example watersupply to the majority of the country is provided through the Guyana Water Authority (GUYWA)monitoring of water quality and sewerage and sanita-tion activities are under the Ministry of Health the National Drainage and Irrigation Board (NDIB) is responsible for drainage and irrigation the Ministryof Public Works Communications and RegionalDevelopment establishes water sector policy andthe Hydrometeorology Department of the Ministryof Agriculture oversees monitoring and assessmentof surface water and groundwater resources and theprovision of basic meteorological information
Impact for developmentGuyana has not been impacted too significantly by water-related disasters Nonetheless the available data indicates that between 1980 and 2011 over 650 000 people were affected During the same period there are only four data points of reported economic damage totaling million current US$ 709 worth in economic damage
Estimates from climate models developed by the United Kingdomrsquos Meteorological Officersquos Hadley Centre predict that Guyana will experience a general drying trend Even though Guyana belongs to those countries in the world with the highest rainfall models show that Guyana will be among the most af-fected countries in the world by climate change with average precipitation having decreased by roughly 1 mmday between now and 2050 A drying trend of this nature dictates the need for storage reservoirs ex-tensive drainage and irrigation networks and man-agement systems The goal has been to sustain and improve livelihoods through interventions that would benefit individuals and the country as a whole
Water supply and sanitation in large systems Waterdesalination plants intakes storage treatment pumpingstations conveyance and distribution systems seweragedomestic and industrial wastewater treatment plants
Basic drinking water supply and basic sanitationWater supply and sanitation through low-cost technologiessuch as hand-pumps spring catchment gravity-fed systemsrainwater collection storage tanks small distributionsystems latrines small-bore sewers on-site disposal (septictanks)
Water resources policy and administrative manage-ment Water sector policy planning and programmes water legislation and management institution capacity building and advice water supply assessments and studies ground-water water quality and watershed studies hydrogeology Excluding agricultural water resources
Disaster prevention and preparednessFloodprotection and control Disaster risk reduction activitiessuch as developing knowledge natural risks cartographylegal norms for construction early warning systemsemergency contingency stocks and contingency planningincluding preparations for forced displacement Floodsfrom rivers or the sea including sea water intrusion controland sea level rise related activities
Agricultural water resources Irrigation reservoirshydraulic structures groundwater exploitation foragricultural use
Hydroelectric power plants Including power-gener-ating river barrages
Water resources protection Inland surface waters(rivers lakes etc) conservation and rehabilitation ofgroundwater prevention of water contamination fromagrochemicals industrial effluents
River development Integrated river basin projectsriver flow control dams and reservoirs Excluding damsprimarily for irrigation and hydropower and activities relatedto river transport
0
2
4
6
8
10
Status and Trends
Drinking Water Supplyand Sanitation
Some 94 percent of the population in Guyana used an improved drinking water source in 2010 (98 percent
Impact for developmentWater sanitation and hygiene factors were responsible for over 300 deaths in 2004 which accounted for 34 percent of all deaths in Guyana In general improved water and sanitation infrastructure and services provide multiple benefits to the local population for health (decrease in mortality) and labour productivity (lower workplace absenteeism) outcomes They can also underpin confidence and expand markets for industries such as tourism Globally it is estimated that 88 percent of diarrheal diseases are caused by water sanitation and hygiene factors
Under 5 child mortality rate (probability of dying by age 5 per 1000 live births)
Improved drinking water sourceImproved sanitation facilities (both indicators above in of total population)
Access to drinking water and sanitationamp under-5 child mortality(UN Inter-agency Group for Child Mortality Estimation (IGME) and WHOUNICEF Joint Monitoring Programme)
1990 1995 2000 2005 2010
per 1
000
live
birt
hs
60
70
80
90
100
30
40
50
60
70
20112010200920082007200620052004200320022001200019991998199719961995199419931992199119901989198819871986
01010111110111111011021110
00000
2031
0000
1000101000000000
0-0
100 0000
35 000354 717
-100 000
1800
5 950200
12 2007 000
27 310870
03 500
3000
3000
5502 000
0
-15
0-0
165500
---0---
29--0--0----0
Year Numberof Events
Deaths Affected Economic Damage(million current US$)
- means no data available
(Dartmouth Flood Observatory)
lsquoWater-related disastersrsquo within the scope of this WCB study do not include droughts
Ratification of the International Covenant on Econom-ic Social and Cultural Rights (ICESCR)
15 February 1977
(The right to water is implicit within the right to an adequate standard of living and inextricably related to the right to the highest attainable standard of health outlined in the ICESCR)
in urban areas and 93 percent in rural areas) as com-pared to 88 percent in 1994 Some 84 percent of the population had access to improved sanitation facilities in 2010 (82 percent in rural areas and 88 percent in urban areas) up from 78 percent in 1994 Despite these improvements the sewerage and water services face operational maintenance financial and institu-tional challenges
Impact for development With an installed capacity of 1 MW Guyana generated 1 GWh in 2008 which represented less than one percent of the nationrsquos hydropower technically exploitable capability
Energy for Water Water for Energy
Water Intensity in Industry
Environment and Ecosystem Health
Impact for development According to a 2010 UNEP report floods land and water pollution and increased pressure on biodiversity are identified as main environmental priorities for Guyana Some estimated 177 million litres of untreated sewage are reportedly discharged per day into the mouth of the Demerara River The problem of land and water pollution is a consequence of several factors such as inadequate infrastructure limited monitoring insufficient financial resources lack of strong enforcement of environmental regulations In the interior of Guyana mining activities degrade surface water and groundwater
Water quality index 2010
Impact for development Industrial water use is distributed in the manufacturingbottling of beverages food processing extraction of minerals (gold and other) The extractive industries are located in the interior and remote areas of the country and are regulated by the mining regulations with respect to water discharge During dry seasons conflicts arise when mining is done on rivers creeks which serve as potable water sources to local communities
Value generated by industry per m3 of water (FAO AQUASTAT World Bank)
Hydropower capacity and generation 2008 in GWhyear (World Energy Council)
1 36 999 Actual Technically
generation exploitable capability not yet generated
250
mill
ion
cons
tant
200
0 U
S$
134
172
67
(YCELPCIESINColumbia University WEF JRCEuropean Commission) 200
150
100
50
428
A score of 100 indicates optimal performance 1990 1995 2000 2005
Value generated by industry in constant 2000 US$ per m3 of water
Value added by industry in million constant 2000 US$
During 1992 to 2000 the value generated by industry per m3 of water increased by 3 percent annually and during 2000 to 2005 this value decreased by 21 percent annually
The vast majority of agricultural activities takes place in the coastal plains For more than 8 km inland the land is
Irrigated Agriculture
Impact for development The National Drainage and Irrigation Authority has been spending large sums to build and improve drainage and irrigation infrastructure These investments have contributed to earnings of over US$40 million in export sales of rice alone Guyanarsquos rice export has increased both in volume and value in 2010 surpassing all previshyous records Yet limited and dilapidated drainage and irrigation infrastructure especially in main agricultural developed areas remains a challenge In 2011 agriculture accounted for 21 percent of gross domestic prodshyuct In 2012 women accounted for 8 percent of the economically active population in agriculture
Rainfall variability and agricultural GDP (FAO AQUASTAT World Bank)
Value generated by agriculture per m3 of water (FAO AQUASTAT World Bank)
below sea level at high tide Therefore drainage and 250
200
150
mill
ion
cons
tant
200
0 U
S$
009
012water control are major problems and agricultural development has always been tied to the defense against water intrusion from the sea and from rainwater runoff
The establishment of conservancies (ie large shallow dams that trap surface water runoff) and extraction pumps on rivers has sustained regular irrigation water supply During dry periods these systems ensure the ability to meet demand although some deficit in water 100
1963 1968 1978 1988 19981973 1983 1993 2003 supply occur under extreme events such as during El 1990 1995 2000 2005
National rainfall index variability (percentage of deviation from average national
rainfall index)
Variability in agricultural GDP (percentage of deviation from trend of agricultural goods
produced per km2 of agricultural land)
Nintildeo occurrences
During 1992 to 2000 the value generated by agriculture per m3 of water increased by 3 percent annually Rice and sugarcane are the main irrigated crops In addition a small area of citrus and vegetables is irrigated
Agriculture value added in million constant 2000 US$
Value generated by agriculture in constant 2000 US$ per m3 of water
-40
-20
0
20
40
During 1992 to 2000 the value generated by industry per m3 of water increased by 3 percent annually and during 2000 to 2005 this value decreased by 21 percent annually
Government water-related investment over the period 2003 to 2012bull Agricultural water resources received the largest share of investments during this period with notable peaks in 2005 2008 and 2012 when it received 75 59 and 62 million constant 2010 US$ respectivelybull In 2003 water supply and sanitation ndash large systems received 79 million constant 2010 US$ representing the largest amount invested by the government in one water-related category over this period
Water-related official development assistance over the period 2003 to 2011 bull Overall water-related ODA disbursements averaged 141 million constant US$ over the period with a high in 2009 (205 million constant US$) and a low in 2004 (70 million constant US$)bull Flood prevention control combined with disaster prevention and preparedness received with 386 percent the highest share of ODA disbursements In 2008 it accounted for 60 percent of water-related ODA disbursements with 93 million constant 2010 US$ bull Water supply and sanitation ndash large systems received 347 percent of ODA disbursements over the period with a peak in 2009 when 97 million constant US$ amounted to 369 percent of all water-related ODA disbursementsbull Agricultural water resources received support from ODA only in 2010 and 2011
Actual expenditure refers to the amount spent by the government during a given year Where actual expenditure data is not available the government budget is used and refers to the amount that the government reportedly budgeted for the given year The OECD Creditor Reporting System categories were chosen for the collection of these water-related investments and the data was obtained by the WCB project through in-country research in cooperation with the government (during 2012) while ODA data stems from the OECD Creditor Reporting System (collected December 2012)
Official development assistance gross disburse-ments during the period 2003 - 2011(million constant 2010 US$)
2003 20032007 20072009 20092011 20112005 2005
Government expenditure during the period2003 ndash 2010 and budget for the years 2011 amp 2012(million constant 2010 US$)
Mill
ion
cons
tant
201
0 U
S$
Environment andEcosystem Health
The vast majority of agricultural activities takes place in the coastal plains For more than 8 km inland the land is below sea level at high tide Therefore drainage and water control are major problems and agricultural development has always been tied to the defense against water intrusion from the sea and from rainwater runoff
The establishment of conservancies (ie large shallow dams that trap surface water runoff) and extraction pumps on rivers has sustained regular irrigation water supply During dry periods these systems ensure the ability to meet demand although some deficit in water supply occur under extreme events such as during El Nintildeo occurrences
During 1992 to 2000 the value generated by agriculture per m3 of water increased by 3 percent annually Rice and sugarcane are the main irrigated crops In addition a small area of citrus and vegetables is irrigated
Impact for developmentWith an installed capacity of 1 MW Guyanagenerated 1 GWh in 2008 which representedless than one percent of the nationrsquos hydropowertechnically exploitable capability
Energy for WaterWater for Energy
Irrigated Agriculture
Impact for developmentThe National Drainage and Irrigation Authority has been spending large sums to build and improve drainageand irrigation infrastructure These investments have contributed to earnings of over US$40 million in exportsales of rice alone Guyanarsquos rice export has increased both in volume and value in 2010 surpassing all previ-ous records Yet limited and dilapidated drainage and irrigation infrastructure especially in main agriculturaldeveloped areas remains a challenge In 2011 agriculture accounted for 21 percent of gross domestic prod-uct In 2012 women accounted for 8 percent of the economically active population in agriculture
Rainfall variability and agricultural GDP(FAO AQUASTAT World Bank)
National rainfall index variability(percentage of deviation from average national
rainfall index)
Variability in agricultural GDP(percentage of deviation from trend of agricultural goods
produced per km2 of agricultural land)
1963 1968 1978 1988 19981973 1983 1993 2003
Impact for developmentAccording to a 2010 UNEP report floods land and water pollution and increased pressure on biodiversity are identified as main environmental priorities for Guyana Some estimated 177 million litres of untreated sewage are reportedly discharged per day into the mouth of the Demerara River The problem of land and water pollution is a consequence of several factors such as inadequate infrastructure limited monitoring insufficient financial resources lack of strong enforcement of environmental regulations In the interior of Guyana mining activities degrade surface water and groundwater
Impact for developmentIndustrial water use is distributed in the manufacturingbottling of beverages food processing extraction of minerals (gold and other) The extractive industries are located in the interior and remote areas of the country and are regulated by the mining regulations with respect to water discharge During dry seasons conflicts arise when mining is done on rivers creeks which serve as potable water sources to local communities
Water Intensityin Industry
Value added by industryin million constant 2000 US$
Value generated by industry per m3 of water(FAO AQUASTAT World Bank)
mill
ion
cons
tant
200
0 U
S$
Value generated by industryin constant 2000 US$ per m3 of water
1990 1995 2000 2005
Water quality index 2010
A score of 100 indicates optimal performance
428
(YCELPCIESINColumbia University WEF JRCEuropean Commission)
Actualgeneration
Technicallyexploitable capabilitynot yet generated
1 36 999
Hydropower capacity and generation 2008in GWhyear (World Energy Council)
Water supply and sanitation in large systems Waterdesalination plants intakes storage treatment pumpingstations conveyance and distribution systems seweragedomestic and industrial wastewater treatment plants
Basic drinking water supply and basic sanitationWater supply and sanitation through low-cost technologiessuch as hand-pumps spring catchment gravity-fed systemsrainwater collection storage tanks small distributionsystems latrines small-bore sewers on-site disposal (septictanks)
Water resources policy and administrative manage-ment Water sector policy planning and programmes water legislation and management institution capacity building and advice water supply assessments and studies ground-water water quality and watershed studies hydrogeology Excluding agricultural water resources
Disaster prevention and preparednessFloodprotection and control Disaster risk reduction activitiessuch as developing knowledge natural risks cartographylegal norms for construction early warning systemsemergency contingency stocks and contingency planningincluding preparations for forced displacement Floodsfrom rivers or the sea including sea water intrusion controland sea level rise related activities
Agricultural water resources Irrigation reservoirshydraulic structures groundwater exploitation foragricultural use
Hydroelectric power plants Including power-gener-ating river barrages
Water resources protection Inland surface waters(rivers lakes etc) conservation and rehabilitation ofgroundwater prevention of water contamination fromagrochemicals industrial effluents
River development Integrated river basin projectsriver flow control dams and reservoirs Excluding damsprimarily for irrigation and hydropower and activities relatedto river transport
0
2
4
6
8
10
Status and Trends
-40
-20
0
20
40
mill
ion
cons
tant
200
0 U
S$
20001990 1995 2005
Agriculture value addedin million constant 2000 US$
Value generated by agriculturein constant 2000 US$ per m3 of water
Value generated by agriculture per m3 of water(FAO AQUASTAT World Bank)
100
150
200
250
009
012
50
100
150
200
250
134
172
67
Water - related Disasters
2011 2010 2009 2008 2007 2006 2005 2004 2003 2002 2001 2000 1999 1998 1997 1996 1995 1994 1993 1992 1991 1990 1989 1988 1987 1986
0 1 0 1 0 1 1 1 1 1 0 1 1 1 1 1 1 0 1 1 0 2 1 1 1 0
0 0 0 0 0
20 31
0 0 0 0
10 0 0 1 0 1 0 0 0 0 0 0 0 0 0
0 -0
100 000 0
35 000 354 717
-100 000
180 0
5 950 200
12 200 7 000
27 310 870
0 3 500
300 0
300 0
550 2 000
0
-15
0 -0
165 500
---0 ---
29 --0 --0 ----0
Year Number of Events
Deaths Affected Economic Damage (million current US$)
- means no data available
(Dartmouth Flood Observatory)
Impact for development Guyana has not been impacted too significantly by water-related disasters Nonetheless the available data indicates that between 1980 and 2011 over 650 000 people were affected During the same period there are only four data points of reported economic damage totaling million current US$ 709 worth in economic damage
Estimates from climate models developed by the United Kingdomrsquos Meteorological Officersquos Hadley Centre predict that Guyana will experience a general drying trend Even though Guyana belongs to those countries in the world with the highest rainfall models show that Guyana will be among the most afshyfected countries in the world by climate change with average precipitation having decreased by roughly 1 mmday between now and 2050 A drying trend of this nature dictates the need for storage reservoirs exshytensive drainage and irrigation networks and manshyagement systems The goal has been to sustain and improve livelihoods through interventions that would benefit individuals and the country as a whole
lsquoWater-related disastersrsquo within the scope of this WCB study do not include droughts
Impact for development Guyana has well established national institutions and agencies overseeing water-related matters However there is a lack of monitoring data to make informed decisions on the efficient use and manageshyment of water sources The government faces the need to strengthen these organizations through training of staff and increasing budgetary allocations
Tracking Water Drinking Water Supply and Sanitation
Governance
Impact for development Water sanitation and hygiene factors were responsible for over 300 deaths in 2004 which accounted for 34 percent of all deaths in Guyana In general improved water and sanitation infrastructure and services provide multiple benefits to the local population for health (decrease in mortality) and labour productivity (lower workplace absenteeism) outcomes They can also underpin confidence and expand markets for industries such as tourism Globally it is estimated that 88 percent of diarrheal diseases are caused by water sanitation and hygiene factors
Access to drinking water and sanitation amp under-5 child mortality (UN Inter-agency Group for Child Mortality Estimation (IGME) and WHOUNICEF Joint Monitoring Programme)
100 70
90
80
per 1
000
live
birt
hs
30
40
50
60
1990 1995 2000 2005 2010
70
60
Several institutions are involved in the management of Guyanas water resources For example water supply to the majority of the country is provided through the Guyana Water Authority (GUYWA)
Improved drinking water source Improved sanitation facilities (both indicators above in of total population) Under 5 child mortality rate
monitoring of water quality and sewerage and sanita- Ratification of the International Covenant on Economshy (probability of dying by age 5 per 1000 live births) tion activities are under the Ministry of Health the ic Social and Cultural Rights (ICESCR) National Drainage and Irrigation Board (NDIB) is 15 February 1977 responsible for drainage and irrigation the Ministry in urban areas and 93 percent in rural areas) as comshyof Public Works Communications and Regional Development establishes water sector policy and the Hydrometeorology Department of the Ministry
(The right to water is implicit within the right to an adequate standard of living and inextricably related to the right to the highest attainable standard of health outlined in the ICESCR)
pared to 88 percent in 1994 Some 84 percent of the population had access to improved sanitation facilities in 2010 (82 percent in rural areas and 88 percent in
of Agriculture oversees monitoring and assessment urban areas) up from 78 percent in 1994 Despite of surface water and groundwater resources and the Some 94 percent of the population in Guyana used an these improvements the sewerage and water services provision of basic meteorological information improved drinking water source in 2010 (98 percent face operational maintenance financial and institushy
tional challenges
year
The Money StreamFrom 2003 to 2011 the government has invested US$ 612 million (in constant 2010 US$) on average peryear on water-related infrastructure and programmes Over 90 percent of the governmentrsquos investmentswere channeled into agricultural water resources (535 percent) and water supply and sanitation - largesystems (372 percent)
During the same period official development assistance (ODA) gross disbursements amounted to US$ 1405 million on average per year Three quarters of ODA disbursements were channeled into disaster prevention and preparedness and flood preventioncontrol (386 percent) and water supply and sanitation - large systems (347 percent)
Over the period 2003 to 2010 the Government of Guyanarsquos water-related expenditure accounted for anestimated 19 percent of total government expenditures
19
758 000 inhabitants
214 970 km2
4 inhabitantskm2
0636118
0490
34
2 387 mmyear
241 000 million m3year
317 942 m3inhabitant
06
150 000 ha
34
not avalaible
Total population (UN Population Division)
Total area
Population density
Human Development Index (UNDP)
(between 0 and 1 1 is highest)Country rank (total 186 countries 1 is highest)Gender Inequality Index (0 is equality between women and men 1 is least equality)
Water sanitation and hygiene-related deaths of total deaths (WHO)
Long-term average annual precipitation (CRU CL 20)
Long-term average actual renewable water resources (FAO AQUASTAT)
Actual annual renewable water resources per capita (FAO AQUASTAT)
of total actual renewable freshwater resources withdrawn (MDG Water Indicator) (FAO AQUASTAT)
Total area equipped for irrigation (FAO FAOSTAT)
of the cultivated area equipped for irrigation(FAO FAOSTAT)
Ramsar sites (Ramsar) ndash number ndash total area
2012
2011
2012
2012
2004
2011
2011
2012
2010
2008
2008
2011
2013
Estimated of water-related expenditure to total government expenditure (2003 to 2010)
Industrial
Municipal
Water withdrawals by sector(total 1 444 million m3 in 2010)
1442
944 Agricultural
Data ConcernsData is a vital input to water management and invest-ment in water related infrastructure and projectsData and available research for Guyana is sparse
Investments in coordinated data collection collation analysis and dissemination is vital to demonstrate the benefits of water-related investments to governmentsdonors and ultimately private capital investors
It is to be noted that it is virtually impossible to find national-level gender-disaggregated data for almost allthemes contained in the UN-Water Country Briefs
Disclaimersbull The most recent and updated information can be found in the original databases cited throughout
bull The rapid assessment methodology presentedhere is an advocacy tool designed to generatedebate and attention to the issues and is devel-oped in conjunction with national governmentfocal points
bull Data presented herein stems either from existing databases or was collected from national reports experts and institutions and in some cases raw data underwent various manipulations to categorize the information for this presentation
bull Due to data limitations the investment-relatedestimates may not include water-related invest-ments that are counted under other categoriesof investments and some investment categories(ie disaster prevention and preparedness)may include some investments that are not directly water-related Moreover water being acrosscutting issue investments in other parts ofthe government (not calculated here) may also benefit water management
bull The words investments invested funded for ODA refer to gross disbursements of ODA according to the OECD definitions The wordsinvestments invested funded for governmentrefer to government expenditure (2003 ndash 2010)and government budget (2011 amp 2012) Inaddition investment data and analysis do notinclude any other forms of investment (such as private sector investments)
This project was implemented by the AQUASTAT Programme of the Food and Agriculture Organization of the United Nations (FAO) on behalf of UN-Water with financial support from United States Department of State (USDS) Brief produced 19 June 2013
Additional information on the project data and methodologies can be accessed at
httpwwwunwaterorgWaterCountryBriefshtml
Annual average official development assistance gross disbursements during the period 2003 - 2011 (million constant 2010 US$)
Annual average government expenditure during the period 2003 - 2010 and budget for the year 2011
(million constant 2010 US$)
327228054003000000000000
092488210063543007001001
total annual average total annual average612 1405
Disaster prevention and prepared-nessflood protection and control
535372
880500000000___
100
66347
14945
386050101___
100
GuyanaUN-Water Country Brief
AtlanticOcean
I
IIIII
IV V
VI
VII
VIII
IX
X
BOLIVARIAN REPUBLICOF VENEZUELA
BRAZIL
SURINAME
Georgetown
Essequibo
Potaro
Mazaruni
Cuy uni
Dem
erar
aBe
rbic
e
Corentyne
Esse
quib
o
Kw
itaro
Kuyuw ini
Rupununi
Bar
am aBarim
a
Torani canal
Pomeroon
Canje
Mah
aica
Takat
u
Tapakuma
Boerasirie
Boerasirie EDWC
Abary
Abary
Waini
Core
ntyn
e
Mahdia
Mabaruma
Lethem
Linden
Bartica
Anna Regina
Corriverton
New Amsterdam
At lan ticOcea n
GUYANA
Albers Equal Area Projection WGS 1984
Legend
The designations employed and the presentation of material in this publication do not imply the expression of any opinion whatsoever on the part of theFood and Agriculture Organization of the United Nations concerning the legal status of any country territory city or area or of its authorities
or concerning the delimitation of its frontiers or boundaries
Disclaimer
FAO - AQUASTAT 2013
0 100 20050 Kilometers
Zone of Irrigation Development
Capital Regional Capital Town
Administrative Boundary
International Boundary River
Canal
Lake
Barima - WainiPomeroon - SupenaarnEssequibo Islands - West DemeraraDemerara - MahaicaMahaica - BerbiceEast Berbice - CorentyneCuyuni - MazaruniPotaro - SiparuniUpper Takutu - Upper EssequiboUpper Demerara - Berbice
IIIIIIIVVVIVIIVIIIIXX
Regions of Guyana
Dam Conservancy
Legend The rapid assessment of the situation above based on available data was established in conjunction with in-country experts and officials It provides an overview of trends according to the following
trends are of significant concern
trends are of concern
trends are stable or progressing on certain issues but not on others
trends show some measure of improvement in all relevant indicators assessed
trends show significant improveshyment and there is no concern
insufficient data
Rapid Assessment
Accurate assessments of progress require relevant accurate and timely data The above data quality assessment ranges from
very poor very good
Investments Overall less than an estimated 2 percent of the total government expenditures has been spent on water-related matters Government investments have been allocated mainly to agricultural water resources and water supply and sanitation - large systems ODA disbursements went mainly to disaster prevention and preparedness and flood preventioncontrol and water supply and sanitation - large systems
Overall Pressures on water The highest density of population roughly 90 pershycent is within the coastal area and thus all residents of the coastal area depend wholly on groundwater supply to meet their domestic needs One exception is the Georgetown area where 30 percent of the water used is surface water from the East-Demerara conservancy Although Guyana has institutions agencies policies and regulations in place to promote proper water management the country still faces numerous water-related challenges such as (i) inadequate irrigation water supply during dry seasons and flooding during wet seasons in farming and residential areas (ii) contamination of potable water supplies leading to water-borne diseases such as vector-borne lymphatic-filariasis and leptospirosis (iii) limited and dilapidated drainage and irrigation infrastructure especially in the main agricultural areas and (iv) lack of highly-qualified personnel within water sector institutions
Data Quality
There is a lack of data on certain key indicators
Limited data on drinking water quality is available
Data is not readily available
A detailed disaster database is not available
Data is not readily available especially on the energy requirements of providing water and treating wastewater
Data is not readily available
Data is not readily available There is no data available on the equity and human rights on sanishytation and drinking water within the UN-Water GLAAS Report 2012
Assessments Irrigated agriculture Recent improvements in drainage and irrigation infrastructure have led to an increase in irrigated crop yields
Drinking water supply and sanitation Since 1998 both urban and rural areas have experienced a constant increment in use of an improved drinking water source and improved sanitation facility The maintenance of water supply and sanitation services in Guyana has always been a challenge
Water intensity in industry During 1992 to 2000 the value generated by industry per m3 of water increased by 3 percent annually and during 2000 to 2005 this value decreased by 21 percent annually
Water-related disasters Although Guyana is not a disaster-prone country forecasts predict that Guyana will be significantly affected in terms of drying trend
Water for energy energy for water In Guyana almost the entire technically exploitable hydropower potential remains untapped There are plans to develop hydropower in the country
Environment and ecosystem health Water pollution and increased pressure on biodiversity are identified as main environmental priorities for Guyana
Tracking governance Guyana has institutions agencies policies and regulations in place to promote proper water manageshyment though the country still faces water stress challenges
Legend The rapid assessment of the situation above based on available data was established in conjunction with in-country experts and officials It provides an overview of trends according to the following
trends are of significant concern
trends are of concern
trends are stable or progressing on certain issues but not on others
trends show some measure of improvement in all relevant indicators assessed
trends show significant improve-ment and there is no concern
insufficient data
Rapid Assessmentyear
The Money StreamFrom 2003 to 2011 the government has invested US$ 612 million (in constant 2010 US$) on average per year on water-related infrastructure and programmes Over 90 percent of the governmentrsquos investments were channeled into agricultural water resources (535 percent) and water supply and sanitation - large systems (372 percent)
During the same period official development assistance (ODA) gross disbursements amounted to US$ 1405 million on average per year Three quarters of ODA disbursements were channeled into disaster prevention and preparedness and flood preventioncontrol (386 percent) and water supply and sanitation - large systems (347 percent)
Over the period 2003 to 2010 the Government of Guyanarsquos water-related expenditure accounted for an estimated 19 percent of total government expenditures
Accurate assessments of progress require relevant accurate and timely data The above data quality assessment ranges from
very poor very good
InvestmentsOverall less than an estimated 2 percent of the total government expenditures has been spent on water-related matters Government investments have been allocated mainly to agricultural water resources and water supply and sanitation - large systems ODA disbursements went mainly to disaster prevention and preparedness and flood preventioncontrol and water supply and sanitation - large systems
OverallPressures on waterThe highest density of population roughly 90 per-cent is within the coastal area and thus all residents of the coastal area depend wholly on groundwater supply to meet their domestic needs One exception is the Georgetown area where 30 percent of the water used is surface water from the East-Demerara conservancy Although Guyana has institutions agencies policies and regulations in place to promote proper water management the country still faces numerous water-related challenges such as (i) inadequate irrigation water supply during dry seasons and flooding during wet seasons in farming and residential areas (ii) contamination of potable water supplies leading to water-borne diseases such as vector-borne lymphatic-filariasis and leptospirosis (iii) limited and dilapidated drainage and irrigation infrastructure especially in the main agricultural areas and (iv) lack of highly-qualified personnel within water sector institutions
19
758 000 inhabitants
214 970 km2
4 inhabitantskm2
0636118
0490
34
2 387 mmyear
241 000 million m3year
317 942 m3inhabitant
06
150 000 ha
34
not avalaible
Total population (UN Population Division)
Total area
Population density
Human Development Index (UNDP)
(between 0 and 1 1 is highest)Country rank (total 186 countries 1 is highest)Gender Inequality Index (0 is equality between women and men 1 is least equality)
Water sanitation and hygiene-related deaths of total deaths (WHO)
Long-term average annual precipitation (CRU CL 20)
Long-term average actual renewable water resources (FAO AQUASTAT)
Actual annual renewable water resources per capita (FAO AQUASTAT)
of total actual renewable freshwater resources withdrawn (MDG Water Indicator) (FAO AQUASTAT)
Total area equipped for irrigation (FAO FAOSTAT)
of the cultivated area equipped for irrigation(FAO FAOSTAT)
Ramsar sites (Ramsar) ndash number ndash total area
2012
2011
2012
2012
2004
2011
2011
2012
2010
2008
2008
2011
2013
Estimated of water-related expenditure to total government expenditure (2003 to 2010)
Industrial
Municipal
Water withdrawals by sector(total 1 444 million m3 in 2010)
1442
944 Agricultural
Annual average official development assistance gross disbursements during the period 2003 - 2011 (million constant 2010 US$)
Annual average government expenditure during the period 2003 - 2010 and budget for the year 2011
(million constant 2010 US$)
327228054003000000000000
092488210063543007001001
total annual average total annual average612 1405
Disaster prevention and prepared-nessflood protection and control
535372
880500000000___
100
66347
14945
386050101___
100
Data Quality
There is a lack of data on certain key indicators
Limited data on drinking water quality is available
Data is not readily available
A detailed disaster database is not available
Data is not readily available especially on the energy requirements of providing water and treating wastewater
Data is not readily available
Data is not readily available There is no data available on the equity and human rights on sani-tation and drinking water within the UN-Water GLAAS Report 2012
AssessmentsIrrigated agricultureRecent improvements in drainage and irrigation infrastructure have led to an increase in irrigated crop yields
Drinking water supply and sanitationSince 1998 both urban and rural areas have experienced a constant increment in use of an improved drinking water source and improved sanitation facility The maintenance of water supply and sanitation services in Guyana has always been a challenge
Water intensity in industry During 1992 to 2000 the value generated by industry per m3 of water increased by 3 percent annually and during 2000 to 2005 this value decreased by 21 percent annually
Water-related disasters Although Guyana is not a disaster-prone country forecasts predict that Guyana will be significantly affected in terms of drying trend
Water for energy energy for water In Guyana almost the entire technically exploitable hydropower potential remains untapped There are plans to develop hydropower in the country
Environment and ecosystem healthWater pollution and increased pressure on biodiversity are identified as main environmental priorities for Guyana
Tracking governanceGuyana has institutions agencies policies and regulations in place to promote proper water manage-ment though the country still faces water stress challenges
GuyanaUN-Water Country Brief
Es s equibo
Potar o
Mazaruni
Cuy un i
D e m
era r
a Be
rbic
e
Corentyne
E s s
e qui
b o
Kw
itaro
Kuy u w ini
Rupununi
B ar
a m a Barim
a
Torani canal
Pomeroon
Cane
Mah
aica
Takat
u
Ta p a k u m a
Boerasirie
Bo e ra s i ri e EDWC
Abary
Ab ary
W a i n i
Core
ntyn
e
Data Concerns
Ocean V Mahaica - Berbice j
Anna Regina
Corriverton Linden
Data is a vital input to water management and investshyment in water related infrastructure and projects Data and available research for Guyana is sparse
Investments in coordinated data collection collation analysis and dissemination is vital to demonstrate the benefits of water-related investments to governments donors and ultimately private capital investors
It is to be noted that it is virtually impossible to find national-level gender-disaggregated data for almost all themes contained in the UN-Water Country Briefs
Regions of Guyana I Barima - Waini II Pomeroon - Supenaarn III Essequibo Islands - West Demerara
Mabaruma
Atlantic IV Demerara - Mahaica
Legend
International Boundary River
At lan tic Administrative Boundary Canal Ocea n
Capital Regional Capital Town Dam Conservancy
Zone of Irrigation Development Lake
0 50 100 200 Kilometers
Albers Equal Area Projection WGS 1984
GUYANA FAO - AQUASTAT 2013
Disclaimer The designations employed and the presentation of material in this publication do not imply the expression of any opinion whatsoever on the part of the
Food and Agriculture Organization of the United Nations concerning the legal status of any country territory city or area or of its authoritiesor concerning the delimitation of its frontiers or boundaries
This project was implemented by the AQUASTAT Programme of the Food and Agriculture Organization of the United Nations (FAO) on behalf of UN-Water with financial support from United States Department of State (USDS) Brief produced 19 June 2013
Additional information on the project data and methodologies can be accessed at
httpwwwunwaterorg WaterCountryBriefshtml
I VI East Berbice - Corentyne VII Cuyuni - Mazaruni VIII Potaro - Siparuni IX Upper Takutu - Upper Essequibo
II BOLIVARIAN REPUBLIC X Upper Demerara - Berbice
OF VENEZUELA Georgetown III Bartica
IV V New Amsterdam
Disclaimers bull The most recent and updated information can be found in the original databases cited throughout
VII
X VI bull The rapid assessment methodology presented Mahdia
here is an advocacy tool designed to generate VIII debate and attention to the issues and is develshyoped in conjunction with national government focal points
SURINAME bull Data presented herein stems either from existing databases or was collected from national reports experts and institutions and in some cases raw data underwent various manipulations to
Lethem
IX categorize the information for this presentation BRAZIL
bull Due to data limitations the investment-related estimates may not include water-related investshyments that are counted under other categories of investments and some investment categories (ie disaster prevention and preparedness) may include some investments that are not directly water-related Moreover water being a crosscutting issue investments in other parts of the government (not calculated here) may also benefit water management
bull The words investments invested funded for ODA refer to gross disbursements of ODA according to the OECD definitions The words investments invested funded for government refer to government expenditure (2003 ndash 2010) and government budget (2011 amp 2012) In addition investment data and analysis do not include any other forms of investment (such as private sector investments)
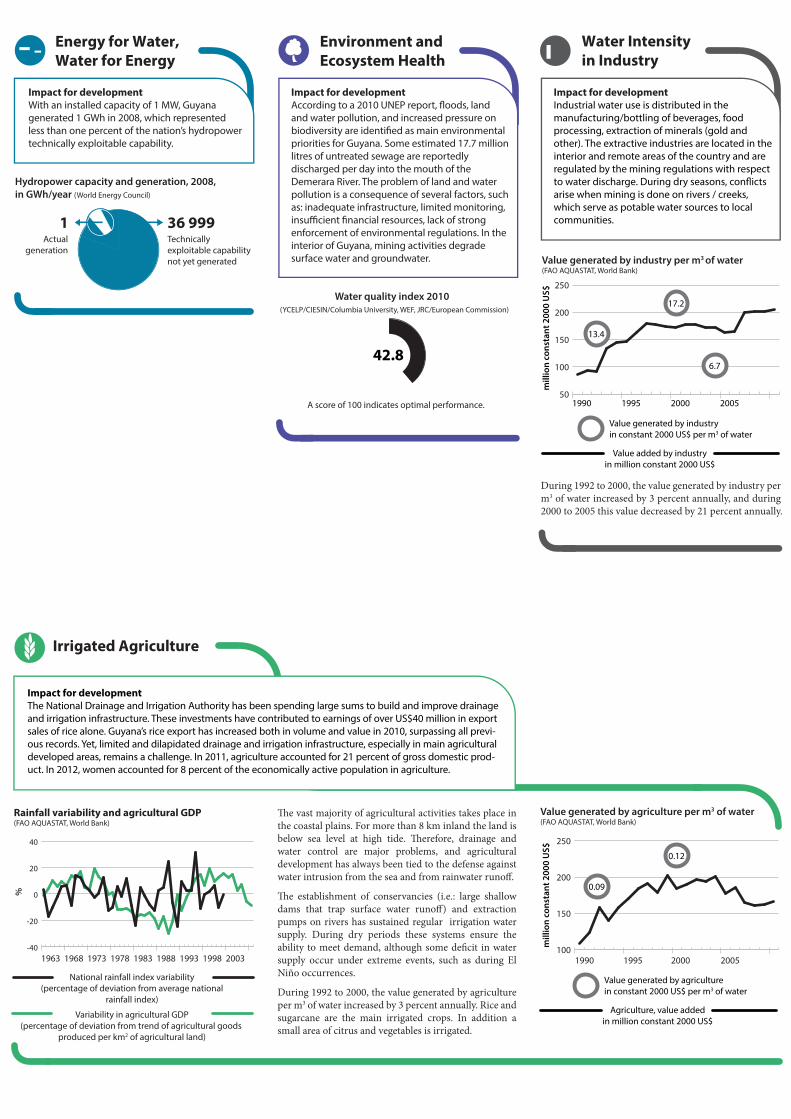
Government water-related investment over the period 2003 to 2012bull Agricultural water resources received the largest share of investments during this period with notable peaks in 2005 2008 and 2012 when it received 75 59 and 62 million constant 2010 US$ respectivelybull In 2003 water supply and sanitation ndash large systems received 79 million constant 2010 US$ representing the largest amount invested by the government in one water-related category over this period
Water-related official development assistance over the period 2003 to 2011 bull Overall water-related ODA disbursements averaged 141 million constant US$ over the period with a high in 2009 (205 million constant US$) and a low in 2004 (70 million constant US$)bull Flood prevention control combined with disaster prevention and preparedness received with 386 percent the highest share of ODA disbursements In 2008 it accounted for 60 percent of water-related ODA disbursements with 93 million constant 2010 US$ bull Water supply and sanitation ndash large systems received 347 percent of ODA disbursements over the period with a peak in 2009 when 97 million constant US$ amounted to 369 percent of all water-related ODA disbursementsbull Agricultural water resources received support from ODA only in 2010 and 2011
Actual expenditure refers to the amount spent by the government during a given year Where actual expenditure data is not available the government budget is used and refers to the amount that the government reportedly budgeted for the given year The OECD Creditor Reporting System categories were chosen for the collection of these water-related investments and the data was obtained by the WCB project through in-country research in cooperation with the government (during 2012) while ODA data stems from the OECD Creditor Reporting System (collected December 2012)
Official development assistance gross disburse-ments during the period 2003 - 2011(million constant 2010 US$)
2003 20032007 20072009 20092011 20112005 2005
Government expenditure during the period2003 ndash 2010 and budget for the years 2011 amp 2012(million constant 2010 US$)
Mill
ion
cons
tant
201
0 U
S$
Water - relatedDisasters
Impact for developmentGuyana has well established national institutions and agencies overseeing water-related matters However there is a lack of monitoring data to make informed decisions on the efficient use and manage-ment of water sources The government faces the need to strengthen these organizations through training of staff and increasing budgetary allocations
Tracking WaterGovernance
Several institutions are involved in the management of Guyanas water resources For example watersupply to the majority of the country is provided through the Guyana Water Authority (GUYWA)monitoring of water quality and sewerage and sanita-tion activities are under the Ministry of Health the National Drainage and Irrigation Board (NDIB) is responsible for drainage and irrigation the Ministryof Public Works Communications and RegionalDevelopment establishes water sector policy andthe Hydrometeorology Department of the Ministryof Agriculture oversees monitoring and assessmentof surface water and groundwater resources and theprovision of basic meteorological information
Impact for developmentGuyana has not been impacted too significantly by water-related disasters Nonetheless the available data indicates that between 1980 and 2011 over 650 000 people were affected During the same period there are only four data points of reported economic damage totaling million current US$ 709 worth in economic damage
Estimates from climate models developed by the United Kingdomrsquos Meteorological Officersquos Hadley Centre predict that Guyana will experience a general drying trend Even though Guyana belongs to those countries in the world with the highest rainfall models show that Guyana will be among the most af-fected countries in the world by climate change with average precipitation having decreased by roughly 1 mmday between now and 2050 A drying trend of this nature dictates the need for storage reservoirs ex-tensive drainage and irrigation networks and man-agement systems The goal has been to sustain and improve livelihoods through interventions that would benefit individuals and the country as a whole
Water supply and sanitation in large systems Waterdesalination plants intakes storage treatment pumpingstations conveyance and distribution systems seweragedomestic and industrial wastewater treatment plants
Basic drinking water supply and basic sanitationWater supply and sanitation through low-cost technologiessuch as hand-pumps spring catchment gravity-fed systemsrainwater collection storage tanks small distributionsystems latrines small-bore sewers on-site disposal (septictanks)
Water resources policy and administrative manage-ment Water sector policy planning and programmes water legislation and management institution capacity building and advice water supply assessments and studies ground-water water quality and watershed studies hydrogeology Excluding agricultural water resources
Disaster prevention and preparednessFloodprotection and control Disaster risk reduction activitiessuch as developing knowledge natural risks cartographylegal norms for construction early warning systemsemergency contingency stocks and contingency planningincluding preparations for forced displacement Floodsfrom rivers or the sea including sea water intrusion controland sea level rise related activities
Agricultural water resources Irrigation reservoirshydraulic structures groundwater exploitation foragricultural use
Hydroelectric power plants Including power-gener-ating river barrages
Water resources protection Inland surface waters(rivers lakes etc) conservation and rehabilitation ofgroundwater prevention of water contamination fromagrochemicals industrial effluents
River development Integrated river basin projectsriver flow control dams and reservoirs Excluding damsprimarily for irrigation and hydropower and activities relatedto river transport
0
2
4
6
8
10
Status and Trends
Drinking Water Supplyand Sanitation
Some 94 percent of the population in Guyana used an improved drinking water source in 2010 (98 percent
Impact for developmentWater sanitation and hygiene factors were responsible for over 300 deaths in 2004 which accounted for 34 percent of all deaths in Guyana In general improved water and sanitation infrastructure and services provide multiple benefits to the local population for health (decrease in mortality) and labour productivity (lower workplace absenteeism) outcomes They can also underpin confidence and expand markets for industries such as tourism Globally it is estimated that 88 percent of diarrheal diseases are caused by water sanitation and hygiene factors
Under 5 child mortality rate (probability of dying by age 5 per 1000 live births)
Improved drinking water sourceImproved sanitation facilities (both indicators above in of total population)
Access to drinking water and sanitationamp under-5 child mortality(UN Inter-agency Group for Child Mortality Estimation (IGME) and WHOUNICEF Joint Monitoring Programme)
1990 1995 2000 2005 2010
per 1
000
live
birt
hs
60
70
80
90
100
30
40
50
60
70
20112010200920082007200620052004200320022001200019991998199719961995199419931992199119901989198819871986
01010111110111111011021110
00000
2031
0000
1000101000000000
0-0
100 0000
35 000354 717
-100 000
1800
5 950200
12 2007 000
27 310870
03 500
3000
3000
5502 000
0
-15
0-0
165500
---0---
29--0--0----0
Year Numberof Events
Deaths Affected Economic Damage(million current US$)
- means no data available
(Dartmouth Flood Observatory)
lsquoWater-related disastersrsquo within the scope of this WCB study do not include droughts
Ratification of the International Covenant on Econom-ic Social and Cultural Rights (ICESCR)
15 February 1977
(The right to water is implicit within the right to an adequate standard of living and inextricably related to the right to the highest attainable standard of health outlined in the ICESCR)
in urban areas and 93 percent in rural areas) as com-pared to 88 percent in 1994 Some 84 percent of the population had access to improved sanitation facilities in 2010 (82 percent in rural areas and 88 percent in urban areas) up from 78 percent in 1994 Despite these improvements the sewerage and water services face operational maintenance financial and institu-tional challenges
Impact for development With an installed capacity of 1 MW Guyana generated 1 GWh in 2008 which represented less than one percent of the nationrsquos hydropower technically exploitable capability
Energy for Water Water for Energy
Water Intensity in Industry
Environment and Ecosystem Health
Impact for development According to a 2010 UNEP report floods land and water pollution and increased pressure on biodiversity are identified as main environmental priorities for Guyana Some estimated 177 million litres of untreated sewage are reportedly discharged per day into the mouth of the Demerara River The problem of land and water pollution is a consequence of several factors such as inadequate infrastructure limited monitoring insufficient financial resources lack of strong enforcement of environmental regulations In the interior of Guyana mining activities degrade surface water and groundwater
Water quality index 2010
Impact for development Industrial water use is distributed in the manufacturingbottling of beverages food processing extraction of minerals (gold and other) The extractive industries are located in the interior and remote areas of the country and are regulated by the mining regulations with respect to water discharge During dry seasons conflicts arise when mining is done on rivers creeks which serve as potable water sources to local communities
Value generated by industry per m3 of water (FAO AQUASTAT World Bank)
Hydropower capacity and generation 2008 in GWhyear (World Energy Council)
1 36 999 Actual Technically
generation exploitable capability not yet generated
250
mill
ion
cons
tant
200
0 U
S$
134
172
67
(YCELPCIESINColumbia University WEF JRCEuropean Commission) 200
150
100
50
428
A score of 100 indicates optimal performance 1990 1995 2000 2005
Value generated by industry in constant 2000 US$ per m3 of water
Value added by industry in million constant 2000 US$
During 1992 to 2000 the value generated by industry per m3 of water increased by 3 percent annually and during 2000 to 2005 this value decreased by 21 percent annually
The vast majority of agricultural activities takes place in the coastal plains For more than 8 km inland the land is
Irrigated Agriculture
Impact for development The National Drainage and Irrigation Authority has been spending large sums to build and improve drainage and irrigation infrastructure These investments have contributed to earnings of over US$40 million in export sales of rice alone Guyanarsquos rice export has increased both in volume and value in 2010 surpassing all previshyous records Yet limited and dilapidated drainage and irrigation infrastructure especially in main agricultural developed areas remains a challenge In 2011 agriculture accounted for 21 percent of gross domestic prodshyuct In 2012 women accounted for 8 percent of the economically active population in agriculture
Rainfall variability and agricultural GDP (FAO AQUASTAT World Bank)
Value generated by agriculture per m3 of water (FAO AQUASTAT World Bank)
below sea level at high tide Therefore drainage and 250
200
150
mill
ion
cons
tant
200
0 U
S$
009
012water control are major problems and agricultural development has always been tied to the defense against water intrusion from the sea and from rainwater runoff
The establishment of conservancies (ie large shallow dams that trap surface water runoff) and extraction pumps on rivers has sustained regular irrigation water supply During dry periods these systems ensure the ability to meet demand although some deficit in water 100
1963 1968 1978 1988 19981973 1983 1993 2003 supply occur under extreme events such as during El 1990 1995 2000 2005
National rainfall index variability (percentage of deviation from average national
rainfall index)
Variability in agricultural GDP (percentage of deviation from trend of agricultural goods
produced per km2 of agricultural land)
Nintildeo occurrences
During 1992 to 2000 the value generated by agriculture per m3 of water increased by 3 percent annually Rice and sugarcane are the main irrigated crops In addition a small area of citrus and vegetables is irrigated
Agriculture value added in million constant 2000 US$
Value generated by agriculture in constant 2000 US$ per m3 of water
-40
-20
0
20
40
During 1992 to 2000 the value generated by industry per m3 of water increased by 3 percent annually and during 2000 to 2005 this value decreased by 21 percent annually
Government water-related investment over the period 2003 to 2012bull Agricultural water resources received the largest share of investments during this period with notable peaks in 2005 2008 and 2012 when it received 75 59 and 62 million constant 2010 US$ respectivelybull In 2003 water supply and sanitation ndash large systems received 79 million constant 2010 US$ representing the largest amount invested by the government in one water-related category over this period
Water-related official development assistance over the period 2003 to 2011 bull Overall water-related ODA disbursements averaged 141 million constant US$ over the period with a high in 2009 (205 million constant US$) and a low in 2004 (70 million constant US$)bull Flood prevention control combined with disaster prevention and preparedness received with 386 percent the highest share of ODA disbursements In 2008 it accounted for 60 percent of water-related ODA disbursements with 93 million constant 2010 US$ bull Water supply and sanitation ndash large systems received 347 percent of ODA disbursements over the period with a peak in 2009 when 97 million constant US$ amounted to 369 percent of all water-related ODA disbursementsbull Agricultural water resources received support from ODA only in 2010 and 2011
Actual expenditure refers to the amount spent by the government during a given year Where actual expenditure data is not available the government budget is used and refers to the amount that the government reportedly budgeted for the given year The OECD Creditor Reporting System categories were chosen for the collection of these water-related investments and the data was obtained by the WCB project through in-country research in cooperation with the government (during 2012) while ODA data stems from the OECD Creditor Reporting System (collected December 2012)
Official development assistance gross disburse-ments during the period 2003 - 2011(million constant 2010 US$)
2003 20032007 20072009 20092011 20112005 2005
Government expenditure during the period2003 ndash 2010 and budget for the years 2011 amp 2012(million constant 2010 US$)
Mill
ion
cons
tant
201
0 U
S$
Environment andEcosystem Health
The vast majority of agricultural activities takes place in the coastal plains For more than 8 km inland the land is below sea level at high tide Therefore drainage and water control are major problems and agricultural development has always been tied to the defense against water intrusion from the sea and from rainwater runoff
The establishment of conservancies (ie large shallow dams that trap surface water runoff) and extraction pumps on rivers has sustained regular irrigation water supply During dry periods these systems ensure the ability to meet demand although some deficit in water supply occur under extreme events such as during El Nintildeo occurrences
During 1992 to 2000 the value generated by agriculture per m3 of water increased by 3 percent annually Rice and sugarcane are the main irrigated crops In addition a small area of citrus and vegetables is irrigated
Impact for developmentWith an installed capacity of 1 MW Guyanagenerated 1 GWh in 2008 which representedless than one percent of the nationrsquos hydropowertechnically exploitable capability
Energy for WaterWater for Energy
Irrigated Agriculture
Impact for developmentThe National Drainage and Irrigation Authority has been spending large sums to build and improve drainageand irrigation infrastructure These investments have contributed to earnings of over US$40 million in exportsales of rice alone Guyanarsquos rice export has increased both in volume and value in 2010 surpassing all previ-ous records Yet limited and dilapidated drainage and irrigation infrastructure especially in main agriculturaldeveloped areas remains a challenge In 2011 agriculture accounted for 21 percent of gross domestic prod-uct In 2012 women accounted for 8 percent of the economically active population in agriculture
Rainfall variability and agricultural GDP(FAO AQUASTAT World Bank)
National rainfall index variability(percentage of deviation from average national
rainfall index)
Variability in agricultural GDP(percentage of deviation from trend of agricultural goods
produced per km2 of agricultural land)
1963 1968 1978 1988 19981973 1983 1993 2003
Impact for developmentAccording to a 2010 UNEP report floods land and water pollution and increased pressure on biodiversity are identified as main environmental priorities for Guyana Some estimated 177 million litres of untreated sewage are reportedly discharged per day into the mouth of the Demerara River The problem of land and water pollution is a consequence of several factors such as inadequate infrastructure limited monitoring insufficient financial resources lack of strong enforcement of environmental regulations In the interior of Guyana mining activities degrade surface water and groundwater
Impact for developmentIndustrial water use is distributed in the manufacturingbottling of beverages food processing extraction of minerals (gold and other) The extractive industries are located in the interior and remote areas of the country and are regulated by the mining regulations with respect to water discharge During dry seasons conflicts arise when mining is done on rivers creeks which serve as potable water sources to local communities
Water Intensityin Industry
Value added by industryin million constant 2000 US$
Value generated by industry per m3 of water(FAO AQUASTAT World Bank)
mill
ion
cons
tant
200
0 U
S$
Value generated by industryin constant 2000 US$ per m3 of water
1990 1995 2000 2005
Water quality index 2010
A score of 100 indicates optimal performance
428
(YCELPCIESINColumbia University WEF JRCEuropean Commission)
Actualgeneration
Technicallyexploitable capabilitynot yet generated
1 36 999
Hydropower capacity and generation 2008in GWhyear (World Energy Council)
Water supply and sanitation in large systems Waterdesalination plants intakes storage treatment pumpingstations conveyance and distribution systems seweragedomestic and industrial wastewater treatment plants
Basic drinking water supply and basic sanitationWater supply and sanitation through low-cost technologiessuch as hand-pumps spring catchment gravity-fed systemsrainwater collection storage tanks small distributionsystems latrines small-bore sewers on-site disposal (septictanks)
Water resources policy and administrative manage-ment Water sector policy planning and programmes water legislation and management institution capacity building and advice water supply assessments and studies ground-water water quality and watershed studies hydrogeology Excluding agricultural water resources
Disaster prevention and preparednessFloodprotection and control Disaster risk reduction activitiessuch as developing knowledge natural risks cartographylegal norms for construction early warning systemsemergency contingency stocks and contingency planningincluding preparations for forced displacement Floodsfrom rivers or the sea including sea water intrusion controland sea level rise related activities
Agricultural water resources Irrigation reservoirshydraulic structures groundwater exploitation foragricultural use
Hydroelectric power plants Including power-gener-ating river barrages
Water resources protection Inland surface waters(rivers lakes etc) conservation and rehabilitation ofgroundwater prevention of water contamination fromagrochemicals industrial effluents
River development Integrated river basin projectsriver flow control dams and reservoirs Excluding damsprimarily for irrigation and hydropower and activities relatedto river transport
0
2
4
6
8
10
Status and Trends
-40
-20
0
20
40
mill
ion
cons
tant
200
0 U
S$
20001990 1995 2005
Agriculture value addedin million constant 2000 US$
Value generated by agriculturein constant 2000 US$ per m3 of water
Value generated by agriculture per m3 of water(FAO AQUASTAT World Bank)
100
150
200
250
009
012
50
100
150
200
250
134
172
67
Water - related Disasters
2011 2010 2009 2008 2007 2006 2005 2004 2003 2002 2001 2000 1999 1998 1997 1996 1995 1994 1993 1992 1991 1990 1989 1988 1987 1986
0 1 0 1 0 1 1 1 1 1 0 1 1 1 1 1 1 0 1 1 0 2 1 1 1 0
0 0 0 0 0
20 31
0 0 0 0
10 0 0 1 0 1 0 0 0 0 0 0 0 0 0
0 -0
100 000 0
35 000 354 717
-100 000
180 0
5 950 200
12 200 7 000
27 310 870
0 3 500
300 0
300 0
550 2 000
0
-15
0 -0
165 500
---0 ---
29 --0 --0 ----0
Year Number of Events
Deaths Affected Economic Damage (million current US$)
- means no data available
(Dartmouth Flood Observatory)
Impact for development Guyana has not been impacted too significantly by water-related disasters Nonetheless the available data indicates that between 1980 and 2011 over 650 000 people were affected During the same period there are only four data points of reported economic damage totaling million current US$ 709 worth in economic damage
Estimates from climate models developed by the United Kingdomrsquos Meteorological Officersquos Hadley Centre predict that Guyana will experience a general drying trend Even though Guyana belongs to those countries in the world with the highest rainfall models show that Guyana will be among the most afshyfected countries in the world by climate change with average precipitation having decreased by roughly 1 mmday between now and 2050 A drying trend of this nature dictates the need for storage reservoirs exshytensive drainage and irrigation networks and manshyagement systems The goal has been to sustain and improve livelihoods through interventions that would benefit individuals and the country as a whole
lsquoWater-related disastersrsquo within the scope of this WCB study do not include droughts
Impact for development Guyana has well established national institutions and agencies overseeing water-related matters However there is a lack of monitoring data to make informed decisions on the efficient use and manageshyment of water sources The government faces the need to strengthen these organizations through training of staff and increasing budgetary allocations
Tracking Water Drinking Water Supply and Sanitation
Governance
Impact for development Water sanitation and hygiene factors were responsible for over 300 deaths in 2004 which accounted for 34 percent of all deaths in Guyana In general improved water and sanitation infrastructure and services provide multiple benefits to the local population for health (decrease in mortality) and labour productivity (lower workplace absenteeism) outcomes They can also underpin confidence and expand markets for industries such as tourism Globally it is estimated that 88 percent of diarrheal diseases are caused by water sanitation and hygiene factors
Access to drinking water and sanitation amp under-5 child mortality (UN Inter-agency Group for Child Mortality Estimation (IGME) and WHOUNICEF Joint Monitoring Programme)
100 70
90
80
per 1
000
live
birt
hs
30
40
50
60
1990 1995 2000 2005 2010
70
60
Several institutions are involved in the management of Guyanas water resources For example water supply to the majority of the country is provided through the Guyana Water Authority (GUYWA)
Improved drinking water source Improved sanitation facilities (both indicators above in of total population) Under 5 child mortality rate
monitoring of water quality and sewerage and sanita- Ratification of the International Covenant on Economshy (probability of dying by age 5 per 1000 live births) tion activities are under the Ministry of Health the ic Social and Cultural Rights (ICESCR) National Drainage and Irrigation Board (NDIB) is 15 February 1977 responsible for drainage and irrigation the Ministry in urban areas and 93 percent in rural areas) as comshyof Public Works Communications and Regional Development establishes water sector policy and the Hydrometeorology Department of the Ministry
(The right to water is implicit within the right to an adequate standard of living and inextricably related to the right to the highest attainable standard of health outlined in the ICESCR)
pared to 88 percent in 1994 Some 84 percent of the population had access to improved sanitation facilities in 2010 (82 percent in rural areas and 88 percent in
of Agriculture oversees monitoring and assessment urban areas) up from 78 percent in 1994 Despite of surface water and groundwater resources and the Some 94 percent of the population in Guyana used an these improvements the sewerage and water services provision of basic meteorological information improved drinking water source in 2010 (98 percent face operational maintenance financial and institushy
tional challenges
year
The Money StreamFrom 2003 to 2011 the government has invested US$ 612 million (in constant 2010 US$) on average peryear on water-related infrastructure and programmes Over 90 percent of the governmentrsquos investmentswere channeled into agricultural water resources (535 percent) and water supply and sanitation - largesystems (372 percent)
During the same period official development assistance (ODA) gross disbursements amounted to US$ 1405 million on average per year Three quarters of ODA disbursements were channeled into disaster prevention and preparedness and flood preventioncontrol (386 percent) and water supply and sanitation - large systems (347 percent)
Over the period 2003 to 2010 the Government of Guyanarsquos water-related expenditure accounted for anestimated 19 percent of total government expenditures
19
758 000 inhabitants
214 970 km2
4 inhabitantskm2
0636118
0490
34
2 387 mmyear
241 000 million m3year
317 942 m3inhabitant
06
150 000 ha
34
not avalaible
Total population (UN Population Division)
Total area
Population density
Human Development Index (UNDP)
(between 0 and 1 1 is highest)Country rank (total 186 countries 1 is highest)Gender Inequality Index (0 is equality between women and men 1 is least equality)
Water sanitation and hygiene-related deaths of total deaths (WHO)
Long-term average annual precipitation (CRU CL 20)
Long-term average actual renewable water resources (FAO AQUASTAT)
Actual annual renewable water resources per capita (FAO AQUASTAT)
of total actual renewable freshwater resources withdrawn (MDG Water Indicator) (FAO AQUASTAT)
Total area equipped for irrigation (FAO FAOSTAT)
of the cultivated area equipped for irrigation(FAO FAOSTAT)
Ramsar sites (Ramsar) ndash number ndash total area
2012
2011
2012
2012
2004
2011
2011
2012
2010
2008
2008
2011
2013
Estimated of water-related expenditure to total government expenditure (2003 to 2010)
Industrial
Municipal
Water withdrawals by sector(total 1 444 million m3 in 2010)
1442
944 Agricultural
Data ConcernsData is a vital input to water management and invest-ment in water related infrastructure and projectsData and available research for Guyana is sparse
Investments in coordinated data collection collation analysis and dissemination is vital to demonstrate the benefits of water-related investments to governmentsdonors and ultimately private capital investors
It is to be noted that it is virtually impossible to find national-level gender-disaggregated data for almost allthemes contained in the UN-Water Country Briefs
Disclaimersbull The most recent and updated information can be found in the original databases cited throughout
bull The rapid assessment methodology presentedhere is an advocacy tool designed to generatedebate and attention to the issues and is devel-oped in conjunction with national governmentfocal points
bull Data presented herein stems either from existing databases or was collected from national reports experts and institutions and in some cases raw data underwent various manipulations to categorize the information for this presentation
bull Due to data limitations the investment-relatedestimates may not include water-related invest-ments that are counted under other categoriesof investments and some investment categories(ie disaster prevention and preparedness)may include some investments that are not directly water-related Moreover water being acrosscutting issue investments in other parts ofthe government (not calculated here) may also benefit water management
bull The words investments invested funded for ODA refer to gross disbursements of ODA according to the OECD definitions The wordsinvestments invested funded for governmentrefer to government expenditure (2003 ndash 2010)and government budget (2011 amp 2012) Inaddition investment data and analysis do notinclude any other forms of investment (such as private sector investments)
This project was implemented by the AQUASTAT Programme of the Food and Agriculture Organization of the United Nations (FAO) on behalf of UN-Water with financial support from United States Department of State (USDS) Brief produced 19 June 2013
Additional information on the project data and methodologies can be accessed at
httpwwwunwaterorgWaterCountryBriefshtml
Annual average official development assistance gross disbursements during the period 2003 - 2011 (million constant 2010 US$)
Annual average government expenditure during the period 2003 - 2010 and budget for the year 2011
(million constant 2010 US$)
327228054003000000000000
092488210063543007001001
total annual average total annual average612 1405
Disaster prevention and prepared-nessflood protection and control
535372
880500000000___
100
66347
14945
386050101___
100
GuyanaUN-Water Country Brief
AtlanticOcean
I
IIIII
IV V
VI
VII
VIII
IX
X
BOLIVARIAN REPUBLICOF VENEZUELA
BRAZIL
SURINAME
Georgetown
Essequibo
Potaro
Mazaruni
Cuy uni
Dem
erar
aBe
rbic
e
Corentyne
Esse
quib
o
Kw
itaro
Kuyuw ini
Rupununi
Bar
am aBarim
a
Torani canal
Pomeroon
Canje
Mah
aica
Takat
u
Tapakuma
Boerasirie
Boerasirie EDWC
Abary
Abary
Waini
Core
ntyn
e
Mahdia
Mabaruma
Lethem
Linden
Bartica
Anna Regina
Corriverton
New Amsterdam
At lan ticOcea n
GUYANA
Albers Equal Area Projection WGS 1984
Legend
The designations employed and the presentation of material in this publication do not imply the expression of any opinion whatsoever on the part of theFood and Agriculture Organization of the United Nations concerning the legal status of any country territory city or area or of its authorities
or concerning the delimitation of its frontiers or boundaries
Disclaimer
FAO - AQUASTAT 2013
0 100 20050 Kilometers
Zone of Irrigation Development
Capital Regional Capital Town
Administrative Boundary
International Boundary River
Canal
Lake
Barima - WainiPomeroon - SupenaarnEssequibo Islands - West DemeraraDemerara - MahaicaMahaica - BerbiceEast Berbice - CorentyneCuyuni - MazaruniPotaro - SiparuniUpper Takutu - Upper EssequiboUpper Demerara - Berbice
IIIIIIIVVVIVIIVIIIIXX
Regions of Guyana
Dam Conservancy
Legend The rapid assessment of the situation above based on available data was established in conjunction with in-country experts and officials It provides an overview of trends according to the following
trends are of significant concern
trends are of concern
trends are stable or progressing on certain issues but not on others
trends show some measure of improvement in all relevant indicators assessed
trends show significant improveshyment and there is no concern
insufficient data
Rapid Assessment
Accurate assessments of progress require relevant accurate and timely data The above data quality assessment ranges from
very poor very good
Investments Overall less than an estimated 2 percent of the total government expenditures has been spent on water-related matters Government investments have been allocated mainly to agricultural water resources and water supply and sanitation - large systems ODA disbursements went mainly to disaster prevention and preparedness and flood preventioncontrol and water supply and sanitation - large systems
Overall Pressures on water The highest density of population roughly 90 pershycent is within the coastal area and thus all residents of the coastal area depend wholly on groundwater supply to meet their domestic needs One exception is the Georgetown area where 30 percent of the water used is surface water from the East-Demerara conservancy Although Guyana has institutions agencies policies and regulations in place to promote proper water management the country still faces numerous water-related challenges such as (i) inadequate irrigation water supply during dry seasons and flooding during wet seasons in farming and residential areas (ii) contamination of potable water supplies leading to water-borne diseases such as vector-borne lymphatic-filariasis and leptospirosis (iii) limited and dilapidated drainage and irrigation infrastructure especially in the main agricultural areas and (iv) lack of highly-qualified personnel within water sector institutions
Data Quality
There is a lack of data on certain key indicators
Limited data on drinking water quality is available
Data is not readily available
A detailed disaster database is not available
Data is not readily available especially on the energy requirements of providing water and treating wastewater
Data is not readily available
Data is not readily available There is no data available on the equity and human rights on sanishytation and drinking water within the UN-Water GLAAS Report 2012
Assessments Irrigated agriculture Recent improvements in drainage and irrigation infrastructure have led to an increase in irrigated crop yields
Drinking water supply and sanitation Since 1998 both urban and rural areas have experienced a constant increment in use of an improved drinking water source and improved sanitation facility The maintenance of water supply and sanitation services in Guyana has always been a challenge
Water intensity in industry During 1992 to 2000 the value generated by industry per m3 of water increased by 3 percent annually and during 2000 to 2005 this value decreased by 21 percent annually
Water-related disasters Although Guyana is not a disaster-prone country forecasts predict that Guyana will be significantly affected in terms of drying trend
Water for energy energy for water In Guyana almost the entire technically exploitable hydropower potential remains untapped There are plans to develop hydropower in the country
Environment and ecosystem health Water pollution and increased pressure on biodiversity are identified as main environmental priorities for Guyana
Tracking governance Guyana has institutions agencies policies and regulations in place to promote proper water manageshyment though the country still faces water stress challenges
Legend The rapid assessment of the situation above based on available data was established in conjunction with in-country experts and officials It provides an overview of trends according to the following
trends are of significant concern
trends are of concern
trends are stable or progressing on certain issues but not on others
trends show some measure of improvement in all relevant indicators assessed
trends show significant improve-ment and there is no concern
insufficient data
Rapid Assessmentyear
The Money StreamFrom 2003 to 2011 the government has invested US$ 612 million (in constant 2010 US$) on average per year on water-related infrastructure and programmes Over 90 percent of the governmentrsquos investments were channeled into agricultural water resources (535 percent) and water supply and sanitation - large systems (372 percent)
During the same period official development assistance (ODA) gross disbursements amounted to US$ 1405 million on average per year Three quarters of ODA disbursements were channeled into disaster prevention and preparedness and flood preventioncontrol (386 percent) and water supply and sanitation - large systems (347 percent)
Over the period 2003 to 2010 the Government of Guyanarsquos water-related expenditure accounted for an estimated 19 percent of total government expenditures
Accurate assessments of progress require relevant accurate and timely data The above data quality assessment ranges from
very poor very good
InvestmentsOverall less than an estimated 2 percent of the total government expenditures has been spent on water-related matters Government investments have been allocated mainly to agricultural water resources and water supply and sanitation - large systems ODA disbursements went mainly to disaster prevention and preparedness and flood preventioncontrol and water supply and sanitation - large systems
OverallPressures on waterThe highest density of population roughly 90 per-cent is within the coastal area and thus all residents of the coastal area depend wholly on groundwater supply to meet their domestic needs One exception is the Georgetown area where 30 percent of the water used is surface water from the East-Demerara conservancy Although Guyana has institutions agencies policies and regulations in place to promote proper water management the country still faces numerous water-related challenges such as (i) inadequate irrigation water supply during dry seasons and flooding during wet seasons in farming and residential areas (ii) contamination of potable water supplies leading to water-borne diseases such as vector-borne lymphatic-filariasis and leptospirosis (iii) limited and dilapidated drainage and irrigation infrastructure especially in the main agricultural areas and (iv) lack of highly-qualified personnel within water sector institutions
19
758 000 inhabitants
214 970 km2
4 inhabitantskm2
0636118
0490
34
2 387 mmyear
241 000 million m3year
317 942 m3inhabitant
06
150 000 ha
34
not avalaible
Total population (UN Population Division)
Total area
Population density
Human Development Index (UNDP)
(between 0 and 1 1 is highest)Country rank (total 186 countries 1 is highest)Gender Inequality Index (0 is equality between women and men 1 is least equality)
Water sanitation and hygiene-related deaths of total deaths (WHO)
Long-term average annual precipitation (CRU CL 20)
Long-term average actual renewable water resources (FAO AQUASTAT)
Actual annual renewable water resources per capita (FAO AQUASTAT)
of total actual renewable freshwater resources withdrawn (MDG Water Indicator) (FAO AQUASTAT)
Total area equipped for irrigation (FAO FAOSTAT)
of the cultivated area equipped for irrigation(FAO FAOSTAT)
Ramsar sites (Ramsar) ndash number ndash total area
2012
2011
2012
2012
2004
2011
2011
2012
2010
2008
2008
2011
2013
Estimated of water-related expenditure to total government expenditure (2003 to 2010)
Industrial
Municipal
Water withdrawals by sector(total 1 444 million m3 in 2010)
1442
944 Agricultural
Annual average official development assistance gross disbursements during the period 2003 - 2011 (million constant 2010 US$)
Annual average government expenditure during the period 2003 - 2010 and budget for the year 2011
(million constant 2010 US$)
327228054003000000000000
092488210063543007001001
total annual average total annual average612 1405
Disaster prevention and prepared-nessflood protection and control
535372
880500000000___
100
66347
14945
386050101___
100
Data Quality
There is a lack of data on certain key indicators
Limited data on drinking water quality is available
Data is not readily available
A detailed disaster database is not available
Data is not readily available especially on the energy requirements of providing water and treating wastewater
Data is not readily available
Data is not readily available There is no data available on the equity and human rights on sani-tation and drinking water within the UN-Water GLAAS Report 2012
AssessmentsIrrigated agricultureRecent improvements in drainage and irrigation infrastructure have led to an increase in irrigated crop yields
Drinking water supply and sanitationSince 1998 both urban and rural areas have experienced a constant increment in use of an improved drinking water source and improved sanitation facility The maintenance of water supply and sanitation services in Guyana has always been a challenge
Water intensity in industry During 1992 to 2000 the value generated by industry per m3 of water increased by 3 percent annually and during 2000 to 2005 this value decreased by 21 percent annually
Water-related disasters Although Guyana is not a disaster-prone country forecasts predict that Guyana will be significantly affected in terms of drying trend
Water for energy energy for water In Guyana almost the entire technically exploitable hydropower potential remains untapped There are plans to develop hydropower in the country
Environment and ecosystem healthWater pollution and increased pressure on biodiversity are identified as main environmental priorities for Guyana
Tracking governanceGuyana has institutions agencies policies and regulations in place to promote proper water manage-ment though the country still faces water stress challenges
GuyanaUN-Water Country Brief
Es s equibo
Potar o
Mazaruni
Cuy un i
D e m
era r
a Be
rbic
e
Corentyne
E s s
e qui
b o
Kw
itaro
Kuy u w ini
Rupununi
B ar
a m a Barim
a
Torani canal
Pomeroon
Cane
Mah
aica
Takat
u
Ta p a k u m a
Boerasirie
Bo e ra s i ri e EDWC
Abary
Ab ary
W a i n i
Core
ntyn
e
Data Concerns
Ocean V Mahaica - Berbice j
Anna Regina
Corriverton Linden
Data is a vital input to water management and investshyment in water related infrastructure and projects Data and available research for Guyana is sparse
Investments in coordinated data collection collation analysis and dissemination is vital to demonstrate the benefits of water-related investments to governments donors and ultimately private capital investors
It is to be noted that it is virtually impossible to find national-level gender-disaggregated data for almost all themes contained in the UN-Water Country Briefs
Regions of Guyana I Barima - Waini II Pomeroon - Supenaarn III Essequibo Islands - West Demerara
Mabaruma
Atlantic IV Demerara - Mahaica
Legend
International Boundary River
At lan tic Administrative Boundary Canal Ocea n
Capital Regional Capital Town Dam Conservancy
Zone of Irrigation Development Lake
0 50 100 200 Kilometers
Albers Equal Area Projection WGS 1984
GUYANA FAO - AQUASTAT 2013
Disclaimer The designations employed and the presentation of material in this publication do not imply the expression of any opinion whatsoever on the part of the
Food and Agriculture Organization of the United Nations concerning the legal status of any country territory city or area or of its authoritiesor concerning the delimitation of its frontiers or boundaries
This project was implemented by the AQUASTAT Programme of the Food and Agriculture Organization of the United Nations (FAO) on behalf of UN-Water with financial support from United States Department of State (USDS) Brief produced 19 June 2013
Additional information on the project data and methodologies can be accessed at
httpwwwunwaterorg WaterCountryBriefshtml
I VI East Berbice - Corentyne VII Cuyuni - Mazaruni VIII Potaro - Siparuni IX Upper Takutu - Upper Essequibo
II BOLIVARIAN REPUBLIC X Upper Demerara - Berbice
OF VENEZUELA Georgetown III Bartica
IV V New Amsterdam
Disclaimers bull The most recent and updated information can be found in the original databases cited throughout
VII
X VI bull The rapid assessment methodology presented Mahdia
here is an advocacy tool designed to generate VIII debate and attention to the issues and is develshyoped in conjunction with national government focal points
SURINAME bull Data presented herein stems either from existing databases or was collected from national reports experts and institutions and in some cases raw data underwent various manipulations to
Lethem
IX categorize the information for this presentation BRAZIL
bull Due to data limitations the investment-related estimates may not include water-related investshyments that are counted under other categories of investments and some investment categories (ie disaster prevention and preparedness) may include some investments that are not directly water-related Moreover water being a crosscutting issue investments in other parts of the government (not calculated here) may also benefit water management
bull The words investments invested funded for ODA refer to gross disbursements of ODA according to the OECD definitions The words investments invested funded for government refer to government expenditure (2003 ndash 2010) and government budget (2011 amp 2012) In addition investment data and analysis do not include any other forms of investment (such as private sector investments)
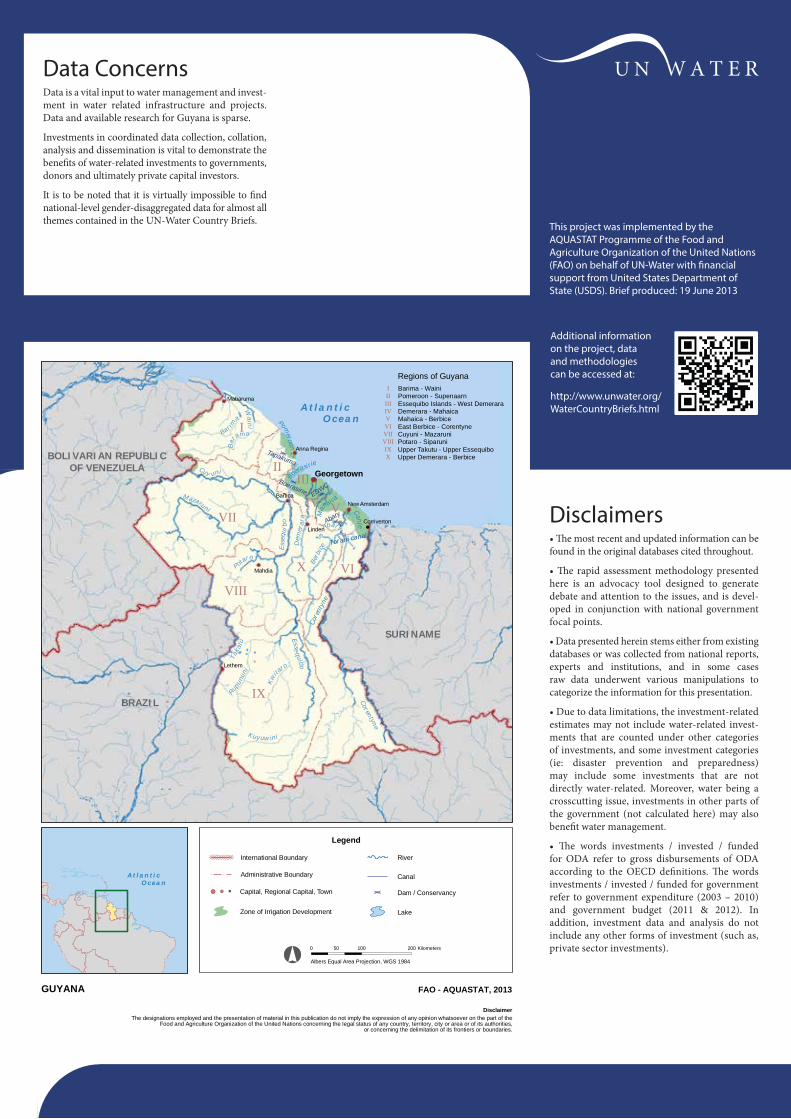


![Montreal G Molleman definitieve versie.ppt [Alleen-lezen] The Netherlands (2005 data) • Population: 16.305.526 • included migrants: 3.130.661 • Urbanisation 41,5% • Inhabitants/km2](https://img.dokumen.tips/doc/110x75/5f842c7e0f54237eab520fc7/montreal-g-molleman-definitieve-alleen-lezen-the-netherlands-2005-data-a-population.jpg)


