Embed Size (px)
Citation preview

u n i ve r s i t y o f co pe n h ag e n
Umami taste, free amino acid composition, and volatile compounds of brownseaweeds
Mouritsen, Ole G.; Duelund, Lars; Petersen, Mikael Agerlin; Hartmann, Anna Loraine; Frøst,Michael Bom
Published in:Journal of Applied Phycology
DOI:10.1007/s10811-018-1632-x
Publication date:2019
Document versionPeer reviewed version
Citation for published version (APA):Mouritsen, O. G., Duelund, L., Petersen, M. A., Hartmann, A. L., & Frøst, M. B. (2019). Umami taste, free aminoacid composition, and volatile compounds of brown seaweeds. Journal of Applied Phycology, 31(2), 1213-1232.https://doi.org/10.1007/s10811-018-1632-x
Download date: 24. Mar. 2022
University of Southern Denmark
Umami taste, free amino acid composition, and volatile compounds of brown seaweeds
Mouritsen, Ole G.; Duelund, Lars; Petersen, Mikael Agerlin; Hartmann, Anna Loraine; Frøst,Michael BomPublished in:Journal of Applied Phycology
DOI:10.1007/s10811-018-1632-x
Publication date:2019
Document versionAccepted manuscript
Citation for pulished version (APA):Mouritsen, O. G., Duelund, L., Petersen, M. A., Hartmann, A. L., & Frøst, M. B. (2019). Umami taste, free aminoacid composition, and volatile compounds of brown seaweeds. Journal of Applied Phycology, 31(2), 1213-1232.https://doi.org/10.1007/s10811-018-1632-x
Terms of useThis work is brought to you by the University of Southern Denmark through the SDU Research Portal.Unless otherwise specified it has been shared according to the terms for self-archiving.If no other license is stated, these terms apply:
• You may download this work for personal use only. • You may not further distribute the material or use it for any profit-making activity or commercial gain • You may freely distribute the URL identifying this open access versionIf you believe that this document breaches copyright please contact us providing details and we will investigate your claim.Please direct all enquiries to [email protected]
Download date: 16. sep.. 2020
Umami taste, free amino acid composition, and volatile 1
compounds of brown seaweeds 2
Ole G. Mouritsen*1, Lars Duelund2, Mikael Agerlin Petersen3, Anna Loraine 3
Hartmann1, Michael Bom Frøst1 4
5
Abstract 6
Umami taste is associated with deliciousness and was first suggested as a basic taste by Kikunae 7
Ikeda in 1909 when he discovered that the brown seaweed konbu (Saccharina japonica), used to 8
provide aqueous extracts for the Japanese soup stock dashi, contains very large amounts of free 9
glutamate. We have performed a comparative analysis of the free amino contents of 20 different 10
species of brown seaweeds used for human consumption from around the world, belonging to the 12 11
genera Nereocystis, Macrocystis, Laminaria, Saccharina, Undaria, Alaria, Postelsia, Himanthalia, 12
Ecklonia (former Eisenia), Sargassum, Fucus, and Corda. We furthermore measured mineral and 13
iodine contents as well as identified a range of volatile compounds and estimated their influence on 14
the perception of umami taste. The results provide a basis on which chefs and food producers can 15
control umami sensation in food items using some of the most popular species of edible brown 16
seaweeds. 17
18
Keywords: Umami; brown seaweeds, taste, HPLC-MS, GC 19
__________________________________________________ 20
*Ole G. Mouritsen 21
23
Lars Duelund 24
26
2
Mikael Agerlin Petersen 27
29
Anna Loraine Hartmann 30
32
Michael Bom Frøst 33
35
1 Department of Food Science, Taste for Life, Design and Consumer Behavior, Nordic Food Lab, 36
University of Copenhagen, 26 Rolighedsvej, DK-1958 Frederiksberg, Denmark 37
2 Department of Chemical Engineering, Biotechnology and Environmental Technology, University 38
of Southern Denmark, 55 Campusvej, DK-5230 Odense M, Denmark 39
3 Department of Food Science, Design and Consumer Behavior, University of Copenhagen, 26 40
Rolighedsvej, DK-1958 Frederiksberg, Denmark 41
42
43
1. Introduction 44
Whereas a great variety of different seaweeds, in particular brown seaweeds, for millennia have been 45
used as a staple food source in Asia (Arasaki, 1983) the tradition for using seaweeds as part of the 46
daily fare in Europe and the Americas is maintained in only a few places (Mouritsen, 2013; Bird, 47
2015; O’Connor, 2017; Mouritsen et al., 2018). However, due to increasing awareness of sustainable 48
marine food resources, a healthy and nutritious diet, and not least a growing interest in the 49
gastronomical value of algae among both chefs and food companies it appears that consumers in the 50
Western world are becoming more tuned to eating seaweeds and products derived from seaweeds. A 51
key issue in this development is a movement beyond a focus on nutrition and health towards an 52

3
appreciation of the taste and flavour of foodstuff based on seaweeds (Mouritsen, 2017; Pérez-Lloréns 53
et al., 2018). 54
55
In Southeast Asia seaweeds are recognized for their particular texture or mouthfeel and their capacity 56
for eliciting umami taste. In the Western world the connotation to seaweeds is often one related to 57
the off-putting odours of decaying seaweeds washed ashore. Also, some consumers find that 58
particularly brown seaweeds from the Fucales and Laminariales orders have too much and 59
overpowering marine flavours. Interestingly, the essence of deliciousness in the sensory perception 60
of food is often associated with the umami taste of the food in question. Umami is a basic taste (along 61
with sweet, sour, salty, and bitter) which was proposed in 1909 by Kikunae Ikeda (Ikeda, 2002) when 62
he discovered that the large brown seaweed konbu (Saccharina japonica) contains very large amounts 63
of free glutamate to which Ikeda attributed a new, fifth basic taste, umami. In the Japanese cuisine, 64
as well as in other South Asian food cultures, konbu is used to produce an aqueous extract that is the 65
basis of a soup stock, dashi, whose amino acid composition is rather singularly dominated by free 66
glutamate and free aspartate, both of which are now known to bind to and stimulate the umami 67
receptors (Zhang et al., 2008; Mouritsen and Khandelia, 2012). A traditional full Japanese dashi 68
contains in the addition to an extract of konbu also an aqueous extract of a special fish product, 69
katsuobushi. Konbu together with katsuobushi provide a synergy in the umami sensation by the 70
simultaneous presence of free glutamate and free inosinate (Mouritsen and Styrbæk, 2014). A dashi 71
only based on konbu is called konbu-dashi. The present paper focusses on such dashis based solely 72
on seaweed extracts. 73
74
In the Japanese cuisine, umami taste from konbu and dashi is not only used for soups but also to 75
flavour other dishes, in particular vegetables (Fuji, 2005; Antony et al., 2014; Japanese Culinary 76
Academy, 2016), rendering it possible to produce delicious dishes and meals with less sugar, less 77
salt, and less fats (Mouritsen and Styrbæk, 2014). However, deliciousness is not only a matter of 78
umami but equally well lucky combinations of both food taste and aromas, as well an appealing 79
mouthfeel (Mouritsen and Styrbæk, 2017). Moreover, the use of a particular seaweed in a certain dish 80
need not correlate in a simple manner with the sensation of umami. First of all, the actual contents of 81
umami compounds vary from one species to another, and also often between subspecies of, e.g., 82
Saccharina japonica (Ninomiya, 1998; Blumenthal et al., 2009; Mouritsen et al., 2012). Secondly, 83

4
the experienced sensation of umami on the palate depends on the presence of other taste and aroma 84
compounds (Maga, 1983; Fuke, 1996), in particular certain free nucleotides such as inosinate. 85
86
In order to evaluate the umami potential of seaweeds for use in foodstuff it is therefore important to 87
have information about the actual chemical composition of the seaweeds as well data from a sensory 88
analysis. It turns out that surprisingly little information is available in the scientific literature on the 89
amino acid composition of seaweeds (Sánchez-Machado et al., 2004; Dawczynski et al., 2006; 90
MacArtain et al., 2007; Kurihara, 2009; Pereira, 2011; 2016; Pomin, 2012; Mouritsen et al., 2013; 91
Mouritsen, 2013) and even less when combined with quantitative sensory studies. Despite this lack 92
of information it is often stated quite generally among many chefs that seaweeds elicit umami taste. 93
The purpose of the present paper is to derive quantitative data for the chemical composition of a series 94
of brown seaweeds that are often used for foodstuff around the world and combining these data with 95
a sensory analysis, thereby unravelling the actual umami potential of the seaweeds. In addition, we 96
identify and quantitate volatile aroma compounds in some of the seaweeds and relate the intensity of 97
the perception of umami to the simultaneous presence of aroma compounds. With regard to the 98
umami potential of red seaweeds and a comparison with a few selected brown species, an earlier 99
study (Mouritsen et al., 2012; 2013) has investigated dulse (Palmaria palmata) and found that this 100
species has rather high levels of free glutamate that contribute to its sensorily perceived umami 101
potential. 102
103
We have selected a series of 20 different species of brown seaweeds used for human consumption 104
from around the word, belonging to the 12 genera Nereocystis, Macrocystis, Laminaria, Saccharina, 105
Undaria, Alaria, Postelsia, Himanthalia, Ecklonia (former Eisenia), Sargassum, Fucus, and Corda. 106
For some of the species we have used material sourced from different waters, making our comparative 107
analysis containing 36 samples of dry seaweed. We included a 37th sample in the analysis being a 108
special salt precipitate of bull kelp (Nereocystis leutkeana) produced during the drying process of the 109
freshly harvested seaweed. This special product has been included in order to evaluate its gastronomic 110
value and as a possible source of saltiness and umami taste. 111
Our study is aimed at investigating the umami potential of aqueous extracts (in the following just 112
termed dashi) of the different seaweeds since we focus on the use of these seaweeds as seasoning 113

5
agents in e.g., soups, marinating media, dressings, sauces, and simmering liquids. We have measured 114
the complete amino acid profile as well as the contents of sodium, potassium, and of iodine. Based 115
on the compositional profile, 16 samples were specifically selected and investigated in order to 116
identify characteristic volatile compounds. The same 16 samples were subsequently subjected to a 117
sensory analysis from which we have determined the influence of free amino acids, mineral content, 118
iodine, as well as various aroma compounds on the perceived sensation of umami in aqueous extracts 119
of the seaweeds. 120
121
2. Materials and Methods 122
2.1 Seaweeds and extraction methods 123
The various seaweed materials investigated have been either purchased commercially or obtained 124
directly from harvesters. The 37 different seaweed samples are listed in Table 1, along with an 125
indication of their origin. 126
127
The taste and aroma compounds were extracted in tap water according to a previously described 128
procedure (Mouritsen et al., 2012). Ordinary, non-filtered tap water (Odense, Denmark; water 129
hardness = 15°dH) was used. All extractions were based on 5 g of dry seaweed in 250 ml of water 130
placed in a plastic bag sealed under vacuum pressure (sous-vide) and immersed over a period of 45 131
minutes in a water bath at 60ºC. All extractions were performed in duplicate by taking two 132
independent samples from the same batch of material. The seaweed salt precipitate, which is a white 133
crystalline powder with a few pieces of dried bull kelp, is subjected to the same extraction procedure 134
as the dry seaweed samples. 135
136
It has earlier been shown (Mouritsen et al., 2012) for dulse (Palmaria palmata), sugar kelp 137
(Saccharina latissima), and konbu (Saccharina japonica) that the use of well-controlled extraction 138
techniques as applied here, in contrast to traditional recipes using open pans and near-water boiling 139
conditions, improves the extraction efficiency for free amino acids from seaweeds without 140
compromising the flavour. Whereas the extraction temperature has a definite influence on the overall 141
taste of the extract, in particular the bitter notes developed at the higher temperatures, the amounts of 142
free amino acids appear to be little sensitive to whether the extraction temperature is 60°C or 100°C. 143
6
Similarly, the earlier work (Mouritsen et al., 2012) did not detect any significant dependence of water 144
hardness on the amount of released umami-flavouring free amino acids. The extracts were cooled and 145
frozen immediately after extraction and only thawed just before analysis and tasting. 146
147
For convenience, the contents of free amino acids, sodium, potassium, and iodine are given in unit 148
per 100 mL extract since the use of the data will predominantly be in the context of evaluating the 149
contents in liquid solutions (dashi). Assuming that the seaweeds swell approximately a factor of eight 150
in water and that their density after complete swelling is approximately the same as that for water, 151
the data given for contents per 100 mL extract can be converted to contents per gram dry material by 152
multiplying by a factor 255/[(255-40)×5]=0.24. 153
154
2.2 Chemicals 155
Acetonitrile was from VWR (Ratnor, PA). Formic acid and NH4HCO2 were from Sigma Aldrich (St. 156
Luis, MO). Amino acid and aroma standards were from Sigma-Aldrich. Trace-metal grade HNO3 157
was from Normatom, VWR. Trace-metal standard was from Traceselect, Sigma Aldrich. 158
159
2.3 Amino acid analysis 160
Detection and quantification of free amino acids was performed by HPLC-MS as described in 161
Mouritsen et al. (2017) using a Shimadzu LCMS 2020 MS equipped with an electrospray interface 162
(ESI). The HPLC consisted of a DGU20-A5 on-line degasser, two LC-20 AD pumps, a high-pressure 163
mixer, an SIL20A- HT autosampler, a CTO 10 Column oven, and an SPD-20A UV detector, all from 164
Shimadzu (Holm & Halby Brøndby, Denmark). The separation of the 17 different free amino acids 165
was performed on a 75x3mm Imtak Intrada amino acid column (Imtakt Corporation, Kyoto, Japan) 166
by a gradient of acetonitrile with 0.1% formic acid and 100 mM NH4HCO2 over a time course of 30 167
min. All analyses were carried out in duplicate. 168
169
The individual amino acids were detected by selected ion monitoring (SIM) at appropriate m/Z values 170
and were quantified by comparison with a standard curve prepared from a commercially available 171
7
amino acid standard. All samples were diluted ten times with 0.1 M HCl and filtered through a 0.2 172
µm RC syringe filter before analysis. Due to their similar mass, Ile and Leu are difficult to separate 173
in some samples and we have therefore for convenience only measured their sum. Cystine is measured 174
as a dimer Cys2 but all data reported labelled by Cys2 have been renormalized to monomer 175
concentration. All analyses were carried out in duplicate. 176
177
2.4 Volatile compound analysis 178
Analyses were carried out in duplicate. Twenty mL of sample was equilibrated to 37°C in gas washing 179
flasks in a circulating water bath and then purged with nitrogen (150 mL min-1) for 60 min with 180
magnetic stirring (200 rpm). Volatile compounds were collected on Tenax-TA traps. The traps 181
contained 200 mg of Tenax-TA with mesh size 60/80 (Markes International, Llantrisant, UK). After 182
purging, water was removed from the traps with a flow of dry nitrogen (150 mL min-1 for 20 min). 183
184
The trapped volatiles were desorbed using an automatic thermal desorption unit (TurboMatrix 350, 185
Perkin Elmer, Shelton, USA). Primary desorption was carried out by heating the trap to 250°C with 186
a flow (50 mL min-1) of carrier gas for 15.0 min. The stripped volatiles were trapped in a Tenax TA 187
cold trap (30 mg held at 5°C), which was subsequently heated at 300°C for 4 min (secondary 188
desorption, outlet split 1:10). This allowed for rapid transfer of volatiles to a gas chromatograph-mass 189
spectrometer (GC-MS, 7890A GC-system interfaced with a 5975C VL MSD with Triple-Axis 190
detector from Agilent Technologies, Palo Alto, California) through a heated (225°C) transfer line. 191
192
Separation of volatiles was carried out on a ZB-Wax capillary column 30 m long x 0.25 mm internal 193
diameter, 0.50 µm film thickness. The column pressure was held constant at 2.3 psi resulting in an 194
initial flow rate of 1.4 mL min-1 using hydrogen as carrier gas. The column temperature programme 195
was: 10 min at 30°C, from 30°C to 240°C at 8°C min-1, and finally 5 min at 240°C. The mass 196
spectrometer was operating in the electron ionisation mode at 70 eV. Mass-to-charge ratios between 197
15 and 300 were scanned. Peak areas and mass spectra were extracted from the chromatograms using 198
the PARAFAC2 based software PARADISe (University of Copenhagen, Copenhagen, Denmark) 199
(Johnsen et al., 2017) and mass spectra were identified using the NIST11 database. Peak areas were 200
used as relative measures of concentration. Volatile compound identification was confirmed by 201

8
comparison with retention indices (RI) of authentic reference compounds or retention indices reported 202
in the literature. 203
204
2.5 Sodium, potassium, and iodine analysis 205
Sodium and potassium contents were determined by flame atomic-absorbance spectroscopy (AAS) 206
on a Shimadzu AA7000 spectrometer equipped with an ASC-7000 auto-sampler (Holm & Halby 207
Brøndby, Denmark) as described in Mouritsen et al. (2017). Samples were diluted as needed with 208
trace-metal grade 1 M HNO3 before analysis. The concentrations were calculated from a standard 209
curve obtained from the analysis of a commercial standard. All analyses were carried out in duplicate. 210
211
Iodine was determined by a the Sandell-Kolhoff reaction in a 96 well plate version as described by 212
Strydom and Jooste (2011). All measurements where done in a BMG Labtech Fluostar Omega plate 213
reader (BMG Labtech GMBH, Ortenberg, Germany). Analyses were carried out in duplicate. 214
215
2.6 Sensory evaluation 216
Initially, potential panellists were screened for their sensitivity to monosodium glutamate (ISO, 217
2011). The purpose was to ascertain that they could perceive the compound and understand the 218
sensory descriptor. The sensory training consisted of two stages. The first stage was a descriptor-219
development session with a duration of approximately 2 hours. In the descriptor-development session, 220
the panellists came up with all the descriptors they could think of to describe the samples. The panel 221
leader chose the descriptors to use for the training based on consensus among the panellists. In the 222
second stage (2 sessions of 1½-2 hours) the panellists were trained for the assessment of dashi. In 223
each session a subset of the samples presented in the evaluations were used. 23 descriptors were 224
chosen for the final evaluation (Table 4). These included descriptors for appearance, aroma, flavour, 225
mouthfeel, and taste. 226
227
The training was realized with panellists seated at individual tables and not disturbing each other 228
during tastings. The sensory evaluations were performed in a sensory test facility, with panellists 229
seated at individual booths and not disturbing each other during tastings. The descriptive sensory 230

9
analysis was conducted with 8 paid external panellists in 6 sessions. The analysis was carried out in 231
two different conditions – with and without olfactory input, three sessions of each variant. In each 232
session, 16 samples were served (i.e., three sensory replicates under each of the two conditions). Prior 233
to serving, the samples were heated for 15 minutes in a steam oven (Rational, Bent Brandt, Denmark) 234
and kept at a serving temperature of 60°C in a thermostat (Termaks KB8182, Nino Lab, Denmark). 235
The purpose of intentionally omitting olfactory input in half of the sensory tests was to evaluate its 236
effect on central sensory properties such as umami. This part of the analysis is treated in a separate 237
article focusing on multi-modal interactions (Frøst et al., in preparation). 238
239
2.8 Data analysis 240
Data were scrutinized by analysis of variance (ANOVA) and multivariate data analysis (ANOVA–241
partial least squares regression (A–PLSR), and PLSR). For chemical analysis, fixed factor analysis 242
was performed with samples as fixed factors. For data obtained by HPLC, n=37, and for GC, n=16. 243
The samples subjected to GC and sensory analysis were the same. For sensory analysis, mixed model 244
ANOVA for individual descriptors was performed with samples (n=16) as fixed factors and panellists 245
(n=8) as random factors. This method is commonly applied to data from descriptive analysis (Lawless 246
& Heymann, 2010; Næs & Langsrud, 1998). Least significant differences at 5% level (LSD 5%) were 247
estimated based on Mean Square Error. Mean ratings over panellists from each replicate was used for 248
A–PLSR. 249
250
A–PLSR is a multivariate regression method where the effect of design factors on the response 251
variables (here, the physico-chemical and sensory descriptors, respectively) is evaluated (Martens 252
and Næs, 1989; Martens and Martens, 2001). The method avoids multi-collinearity problems by 253
modelling latent variables representing the main variance common for the variables. The method 254
evaluates effects of the experimental design variables on physico-chemical characterisations and 255
sensory properties. Here it is used as a graphical alternative to one-way ANOVA. Mean ratings over 256
panellists from each replicate were used for A–PLSR. For all physico-chemical analysis, individual 257
data from each of the 3 or 4 replicates was used. For multivariate analyses, cross-validation was 258
performed, leaving out one replicate at a time (Martens and Næs, 1989). Jack-knifing with replicates 259
served as the validation tool for all A-PLSR, comparing the perturbed model parameter estimates 260

10
from cross-validation with the estimates for the full model (Martens and Martens, 2000). For sensory 261
data, mean over panellists in each replicate was used for cross validation (see e.g. Johansen et al. 262
(2008) for advantages of this approach). 263
264
The relationship between physico-chemical characteristics and sensory properties of the dashis is 265
analysed by PLSR regression carried out on mean data. For physico-chemical measurements mean 266
data are means over replicates of measurements (3 or 4) replicates unless otherwise stated). For 267
sensory data mean data are averaged over panellists (n=8) and replicates (n=3). 268
269
3. Results and discussion 270
Some caution should be exercised when comparing data for both different and the same seaweed 271
species from different sources, because the sample material can vary depending on the growing 272
conditions and the time of harvest. Furthermore, in the case of the amino acid analysis the methods 273
reported in the literature can differ as well. The latter can be particularly troublesome for analysis of 274
extracts of glutamate from brown seaweeds, because it is known that their alginate and salt contents 275
can interfere with the derivation of the amino acids when using classic HPLC methods (Bergeron & 276
Jolivet, 1991). Moreover, different workers have used different amounts of seaweed for their 277
extractions, and the extraction efficiency may depend on the relative amount of water used. In the 278
present work, we used about twice the amount of dry seaweed per litre of water compared with many 279
classic Japanese dashi recipes. 280
281
From the data in Table 2 it is found that the contents of all amino acids except cysteine varied 282
significantly between the 37 samples. The contents of iodine, sodium, and potassium also vary 283
substantially across the samples. Scrutiny of the table and the confidence intervals shows that all 284
samples are significantly different from each other. 285
286
In order to further investigate in which sense the different samples are significantly different we 287
present in Fig. 1 correlation loading plots of dimensions 1 and 2 (Fig. 1a) and dimensions 3 and 4 288
(Fig. 1b) for all 37 samples using the concentrations in Table 2 as variables. The plot gives an 289
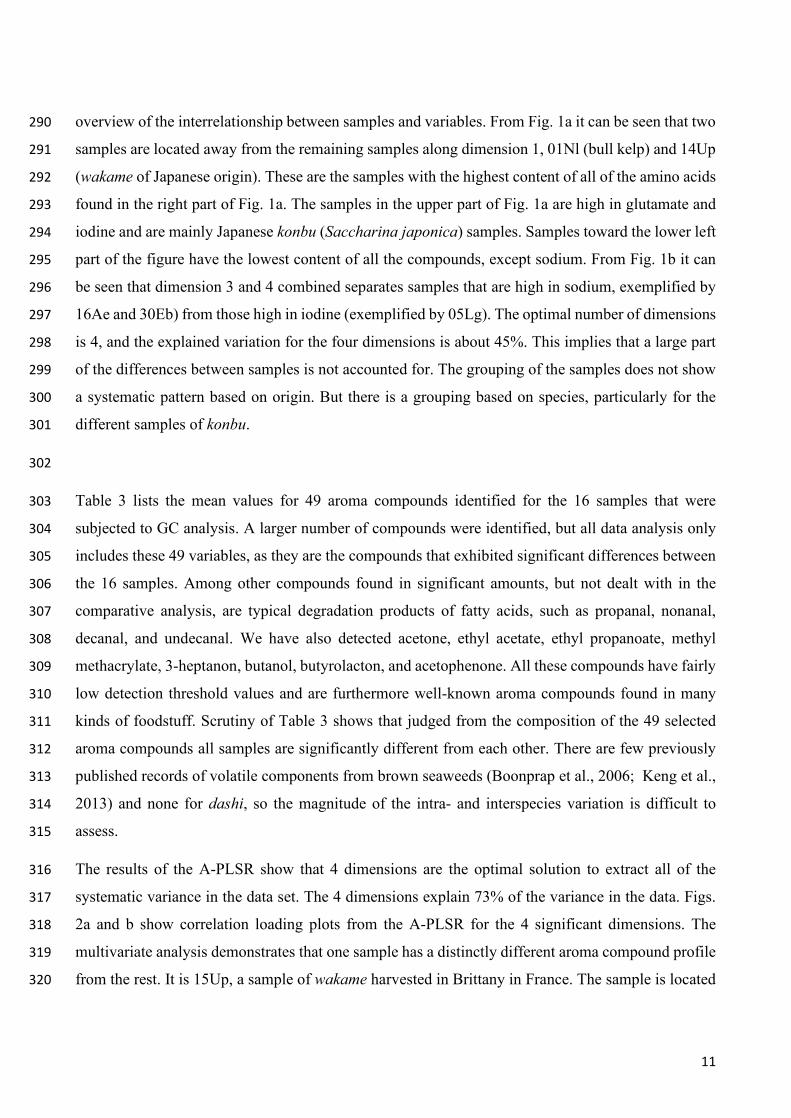
11
overview of the interrelationship between samples and variables. From Fig. 1a it can be seen that two 290
samples are located away from the remaining samples along dimension 1, 01Nl (bull kelp) and 14Up 291
(wakame of Japanese origin). These are the samples with the highest content of all of the amino acids 292
found in the right part of Fig. 1a. The samples in the upper part of Fig. 1a are high in glutamate and 293
iodine and are mainly Japanese konbu (Saccharina japonica) samples. Samples toward the lower left 294
part of the figure have the lowest content of all the compounds, except sodium. From Fig. 1b it can 295
be seen that dimension 3 and 4 combined separates samples that are high in sodium, exemplified by 296
16Ae and 30Eb) from those high in iodine (exemplified by 05Lg). The optimal number of dimensions 297
is 4, and the explained variation for the four dimensions is about 45%. This implies that a large part 298
of the differences between samples is not accounted for. The grouping of the samples does not show 299
a systematic pattern based on origin. But there is a grouping based on species, particularly for the 300
different samples of konbu. 301
302
Table 3 lists the mean values for 49 aroma compounds identified for the 16 samples that were 303
subjected to GC analysis. A larger number of compounds were identified, but all data analysis only 304
includes these 49 variables, as they are the compounds that exhibited significant differences between 305
the 16 samples. Among other compounds found in significant amounts, but not dealt with in the 306
comparative analysis, are typical degradation products of fatty acids, such as propanal, nonanal, 307
decanal, and undecanal. We have also detected acetone, ethyl acetate, ethyl propanoate, methyl 308
methacrylate, 3-heptanon, butanol, butyrolacton, and acetophenone. All these compounds have fairly 309
low detection threshold values and are furthermore well-known aroma compounds found in many 310
kinds of foodstuff. Scrutiny of Table 3 shows that judged from the composition of the 49 selected 311
aroma compounds all samples are significantly different from each other. There are few previously 312
published records of volatile components from brown seaweeds (Boonprap et al., 2006; Keng et al., 313
2013) and none for dashi, so the magnitude of the intra- and interspecies variation is difficult to 314
assess. 315
The results of the A-PLSR show that 4 dimensions are the optimal solution to extract all of the 316
systematic variance in the data set. The 4 dimensions explain 73% of the variance in the data. Figs. 317
2a and b show correlation loading plots from the A-PLSR for the 4 significant dimensions. The 318
multivariate analysis demonstrates that one sample has a distinctly different aroma compound profile 319
from the rest. It is 15Up, a sample of wakame harvested in Brittany in France. The sample is located 320
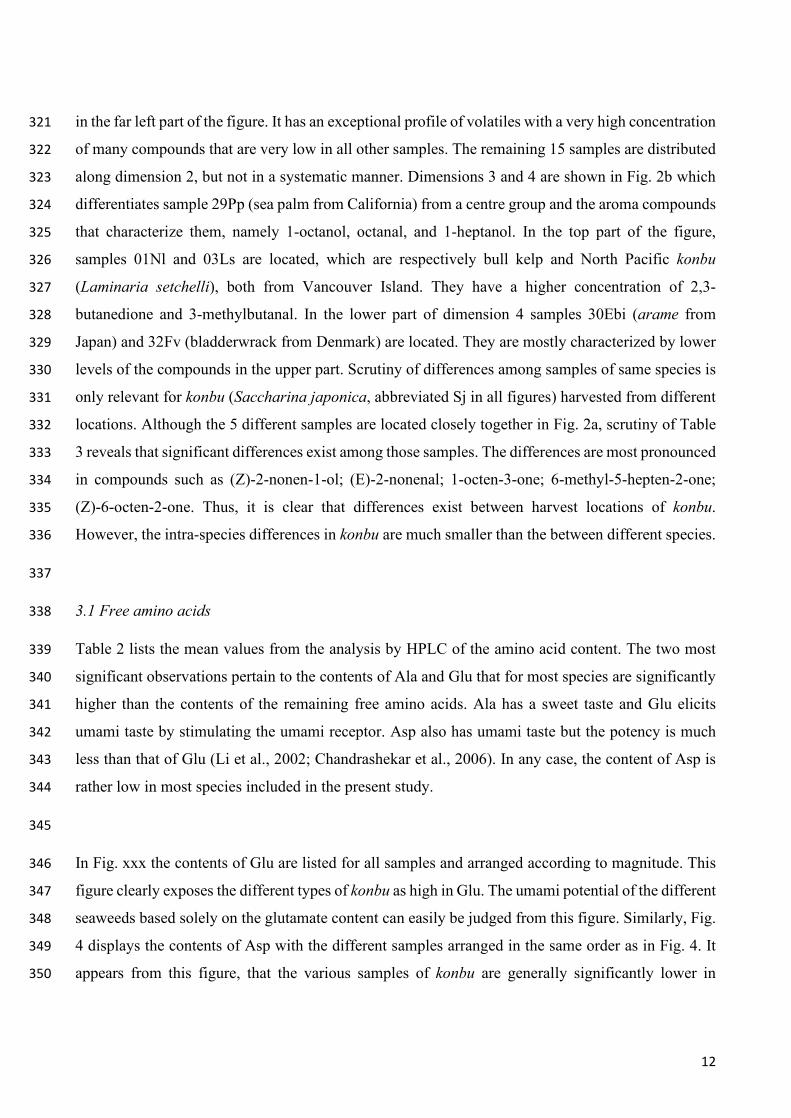
12
in the far left part of the figure. It has an exceptional profile of volatiles with a very high concentration 321
of many compounds that are very low in all other samples. The remaining 15 samples are distributed 322
along dimension 2, but not in a systematic manner. Dimensions 3 and 4 are shown in Fig. 2b which 323
differentiates sample 29Pp (sea palm from California) from a centre group and the aroma compounds 324
that characterize them, namely 1-octanol, octanal, and 1-heptanol. In the top part of the figure, 325
samples 01Nl and 03Ls are located, which are respectively bull kelp and North Pacific konbu 326
(Laminaria setchelli), both from Vancouver Island. They have a higher concentration of 2,3-327
butanedione and 3-methylbutanal. In the lower part of dimension 4 samples 30Ebi (arame from 328
Japan) and 32Fv (bladderwrack from Denmark) are located. They are mostly characterized by lower 329
levels of the compounds in the upper part. Scrutiny of differences among samples of same species is 330
only relevant for konbu (Saccharina japonica, abbreviated Sj in all figures) harvested from different 331
locations. Although the 5 different samples are located closely together in Fig. 2a, scrutiny of Table 332
3 reveals that significant differences exist among those samples. The differences are most pronounced 333
in compounds such as (Z)-2-nonen-1-ol; (E)-2-nonenal; 1-octen-3-one; 6-methyl-5-hepten-2-one; 334
(Z)-6-octen-2-one. Thus, it is clear that differences exist between harvest locations of konbu. 335
However, the intra-species differences in konbu are much smaller than the between different species. 336
337
3.1 Free amino acids 338
Table 2 lists the mean values from the analysis by HPLC of the amino acid content. The two most 339
significant observations pertain to the contents of Ala and Glu that for most species are significantly 340
higher than the contents of the remaining free amino acids. Ala has a sweet taste and Glu elicits 341
umami taste by stimulating the umami receptor. Asp also has umami taste but the potency is much 342
less than that of Glu (Li et al., 2002; Chandrashekar et al., 2006). In any case, the content of Asp is 343
rather low in most species included in the present study. 344
345
In Fig. xxx the contents of Glu are listed for all samples and arranged according to magnitude. This 346
figure clearly exposes the different types of konbu as high in Glu. The umami potential of the different 347
seaweeds based solely on the glutamate content can easily be judged from this figure. Similarly, Fig. 348
4 displays the contents of Asp with the different samples arranged in the same order as in Fig. 4. It 349
appears from this figure, that the various samples of konbu are generally significantly lower in 350
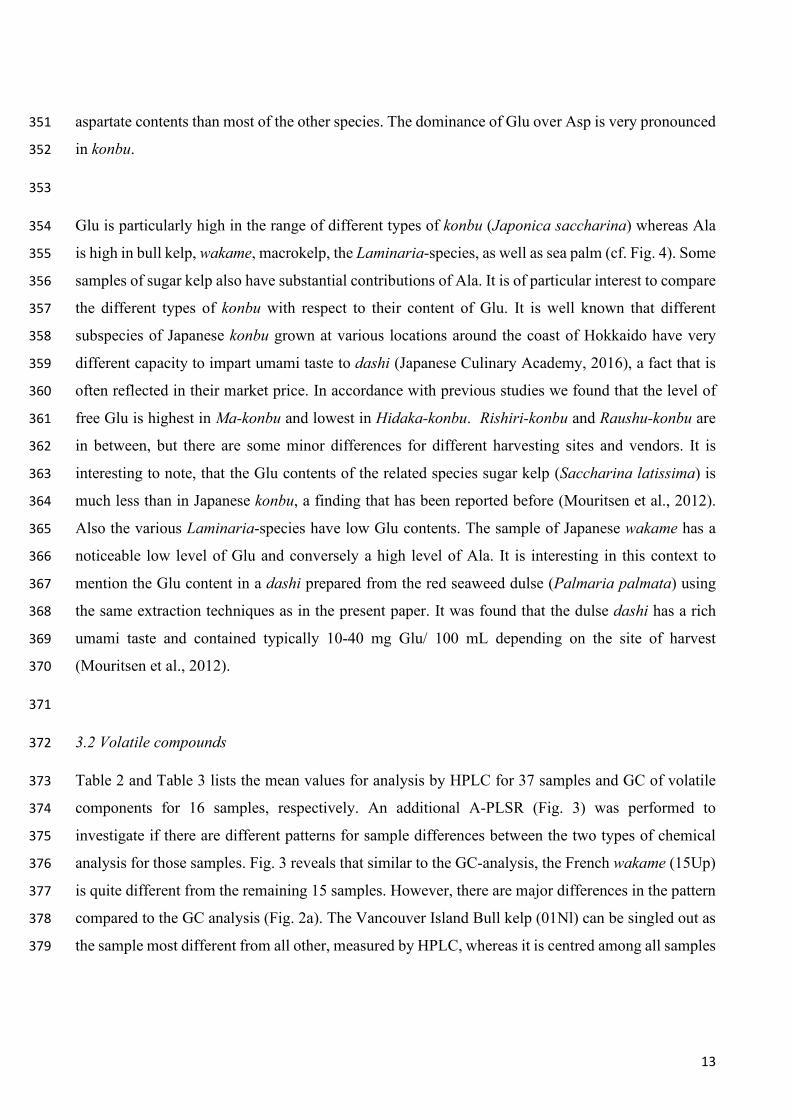
13
aspartate contents than most of the other species. The dominance of Glu over Asp is very pronounced 351
in konbu. 352
353
Glu is particularly high in the range of different types of konbu (Japonica saccharina) whereas Ala 354
is high in bull kelp, wakame, macrokelp, the Laminaria-species, as well as sea palm (cf. Fig. 4). Some 355
samples of sugar kelp also have substantial contributions of Ala. It is of particular interest to compare 356
the different types of konbu with respect to their content of Glu. It is well known that different 357
subspecies of Japanese konbu grown at various locations around the coast of Hokkaido have very 358
different capacity to impart umami taste to dashi (Japanese Culinary Academy, 2016), a fact that is 359
often reflected in their market price. In accordance with previous studies we found that the level of 360
free Glu is highest in Ma-konbu and lowest in Hidaka-konbu. Rishiri-konbu and Raushu-konbu are 361
in between, but there are some minor differences for different harvesting sites and vendors. It is 362
interesting to note, that the Glu contents of the related species sugar kelp (Saccharina latissima) is 363
much less than in Japanese konbu, a finding that has been reported before (Mouritsen et al., 2012). 364
Also the various Laminaria-species have low Glu contents. The sample of Japanese wakame has a 365
noticeable low level of Glu and conversely a high level of Ala. It is interesting in this context to 366
mention the Glu content in a dashi prepared from the red seaweed dulse (Palmaria palmata) using 367
the same extraction techniques as in the present paper. It was found that the dulse dashi has a rich 368
umami taste and contained typically 10-40 mg Glu/ 100 mL depending on the site of harvest 369
(Mouritsen et al., 2012). 370
371
3.2 Volatile compounds 372
Table 2 and Table 3 lists the mean values for analysis by HPLC for 37 samples and GC of volatile 373
components for 16 samples, respectively. An additional A-PLSR (Fig. 3) was performed to 374
investigate if there are different patterns for sample differences between the two types of chemical 375
analysis for those samples. Fig. 3 reveals that similar to the GC-analysis, the French wakame (15Up) 376
is quite different from the remaining 15 samples. However, there are major differences in the pattern 377
compared to the GC analysis (Fig. 2a). The Vancouver Island Bull kelp (01Nl) can be singled out as 378
the sample most different from all other, measured by HPLC, whereas it is centred among all samples 379

14
when analysed by GC. Hence, already from this analysis we can concur that there are major 380
differences in the characterization of samples using HPLC and GC. 381
382
3.3 Sodium, potassium, and iodine 383
Table 2 lists the mean values from the AAS-analysis for the contents of sodium and potassium in the 384
different samples. The data reflects a general finding with most seaweeds (Mouritsen, 2013) that 385
potassium salts outbalance sodium salts, often with a factor 2-3 in concentration. Species with very 386
high potassium contents include bull kelp, macrokelp, tangleweed, oarweed, thongweed, arame, and 387
some samples of sugar kelp as well as konbu. The set of data in Table 2 has an outlier with very low 388
levels of potassium, 15Up, which is a wakame sample from Brittany. We have no explanation for this 389
anomalies and since the extractions and HPLC measurements have been done repeatedly on different 390
samples of the same batch it is conceivable that the low values are correct. 391
392
The analysis for iodine only accounts for the sum of the water-soluble, inorganic forms such as iodide 393
and iodate. Any organically bound iodine is expected to remain in the seaweed tissue. The contents 394
of iodine in the different samples are as shown in Table 2 varying by more than a factor of 300 going 395
from very low contents (41 μg/100 mL) in some wakame samples to very high (2.000-13.000 μg/100 396
mL) for samples in the Laminariales order (the so-called kelps, such as konbu, sugar kelp, tangleweed, 397
and oarweed). Macrokelp (02Mp) is in the same tier as the Laminariales with regard to iodine content. 398
399
The data for the iodine contents is displayed in Fig. xxx where the samples are ordered with respect 400
to iodine concentration. The dashis from winged kelp, arame, hijiki, thongweed, and wakame are 401
fairly low in iodine, whereas for bull kelp, sea lace, sea palm, and the various wracks (Fucales) they 402
are a somewhat higher. As mentioned above, the kelps are very high in iodine. The data reported here 403
is generally in accordance with findings in the literature (Arasaki & Arazaki, 1983; Mabeau & 404
Fleurence, 1993; Rupérez, 2002; Teas et al., 2004; Holdt & Kraan, 2011), although there are 405
variations as expected, considering the fact that the levels of accumulated iodine is dependent on 406
growing conditions. 407
408
15
Iodine is an essential element for the synthesis of the thyroid hormones triiodothyronine and thyroxine 409
(Braverman, 1994) and this is the only known functional purpose iodine serves in the humane body. 410
The daily requirement is about 2 μg per kilo of body weight, i.e. about 140 μg for a normal adult. A 411
diet deficient in iodine can lead to adverse hormonal, hypothyroidal effects such as goiter and 412
cretinism, and in rare cases excessive amounts of iodine in the diet can cause hyperthyroidal effects 413
such as anxiety and heart palpitations. Hence, health authorities recommend a diet balanced in iodine. 414
Therefore concerns are often raised when seaweeds are included in the diet. The variation in the 415
iodine content in dietary seaweeds is, however, extremely large and can vary three orders of 416
magnitude. The red seaweed laver (Pyropia spp.) used for making nori is a low as 1 μg/g whereas 417
konbu (Saccharina japonica) ranges up to 5,000 μg/g (van Netten et al., 2000; Teas et al., 2004; Holdt 418
& Kraan, 2011), all numbers referring to dry weight. Another popular seaweed dulse (Palmaria 419
palmata) is also very low in iodine, about 5 μg/g (Mouritsen et al., 2013). 420
421
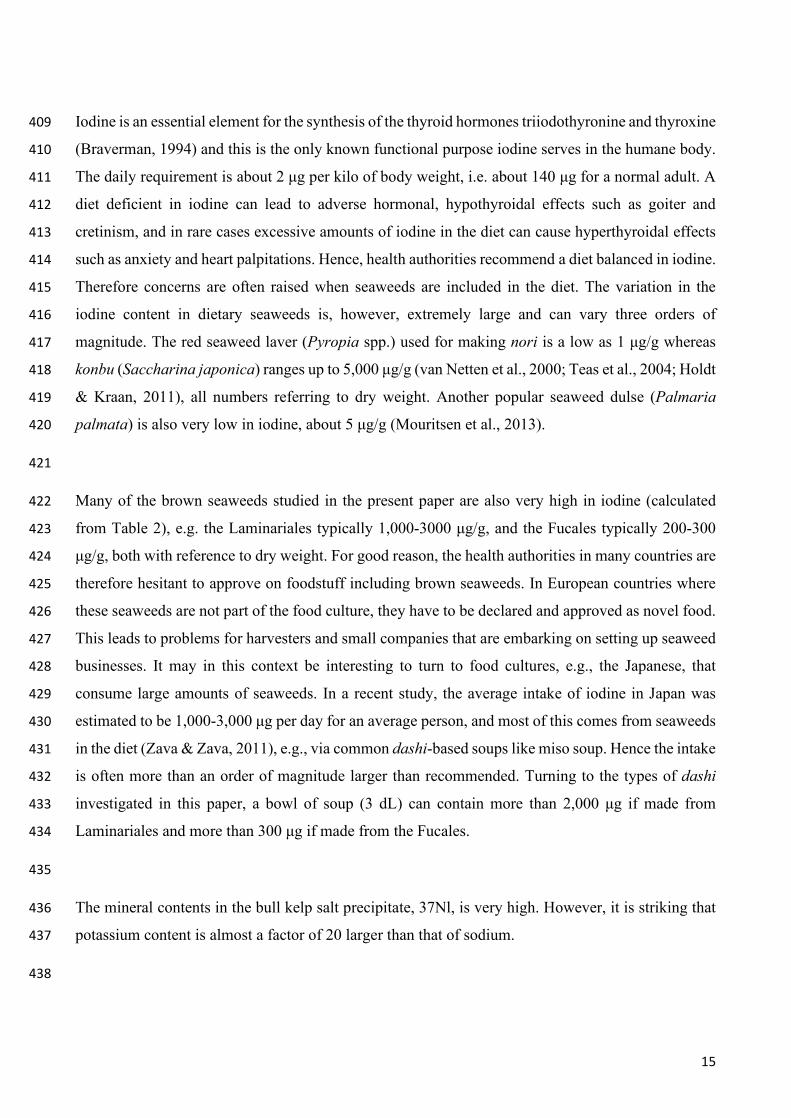
Many of the brown seaweeds studied in the present paper are also very high in iodine (calculated 422
from Table 2), e.g. the Laminariales typically 1,000-3000 μg/g, and the Fucales typically 200-300 423
μg/g, both with reference to dry weight. For good reason, the health authorities in many countries are 424
therefore hesitant to approve on foodstuff including brown seaweeds. In European countries where 425
these seaweeds are not part of the food culture, they have to be declared and approved as novel food. 426
This leads to problems for harvesters and small companies that are embarking on setting up seaweed 427
businesses. It may in this context be interesting to turn to food cultures, e.g., the Japanese, that 428
consume large amounts of seaweeds. In a recent study, the average intake of iodine in Japan was 429
estimated to be 1,000-3,000 μg per day for an average person, and most of this comes from seaweeds 430
in the diet (Zava & Zava, 2011), e.g., via common dashi-based soups like miso soup. Hence the intake 431
is often more than an order of magnitude larger than recommended. Turning to the types of dashi 432
investigated in this paper, a bowl of soup (3 dL) can contain more than 2,000 μg if made from 433
Laminariales and more than 300 μg if made from the Fucales. 434
435
The mineral contents in the bull kelp salt precipitate, 37Nl, is very high. However, it is striking that 436
potassium content is almost a factor of 20 larger than that of sodium. 437
438

16
439
3.4 Sensory characteristics 440
Table 4 lists the mean values for the 16 samples that were subjected to sensory analysis. The ANOVA 441
show that 18 of the 23 descriptors varied significantly across the 16 samples. The mean values for 442
the 5 descriptors (white fish (O and F), rubber (O), crab-like (F), raw potato (F)) that did not contribute 443
to discriminate samples are not reported in Table 4, and they are omitted from further analysis. Close 444
scrutiny of the mean values and confidence intervals reveals that all 16 samples are significantly 445
different from each other based on the sensory descriptors. The results of the A-PLSR show that 5 446
dimensions are the optimal solution to extract all of the systematic variance in the data set. The 5 447
dimensions explain 73% of the variance in the data. An evaluation of the stability and the precision 448
in prediction of the individual descriptors is obtained from the A-PLSR by extracting the Root Mean 449
Square Error of Calibration (RMSEC) at the optimal number of dimensions. Those are listed in Table 450
4 in the penultimate row. RMSEC and confidence intervals from uni-variate ANOVA are not directly 451
mathematically related (Johansen et al., 2008). RMSEC is a good measure for predictive ability of 452
the independent variables and will be used for this purpose in Sec. 3.5. Here it suffices to state that 453
colour intensity and fatty after mouthfeel are the two descriptors that are least stable in prediction. 454
Figs. 9a and b show correlation loading plots from the A-PLSR. 455
456
Based on the correlation plots in Figs. 9a and b we have made the following more remarkable 457
observations. The different types of konbu are grouped together on the right-hand side of Fig. 9 along 458
dimension 1. They are distinguished by the highest perceived umami intensity. The bull kelp salt 459
precipitate (37Nl) is located in the lower part of dimension 2 and characterized as the most salty, sour, 460
and viscous dashi sample. In the left part of Fig. 9a along dimension 1 are samples that are perceived 461
high in roasted, bitter, astringent, and with the highest colour intensity. The two samples that are 462
distinct along dimension 2 are 13Sl, sugar kelp and 32Fv bladder wrack, both from Lillebælt in 463
Danmark, and the two only Danish seaweeds. They are characterized by having the lowest umami 464
taste among the tested dashis (cf. Table 4). 15Up, the wakame from Brittany, is separated from the 465
others in dimension 3 (Fig. 9b). It is characterized by being fishy. The bull kelp sample (01Nl) is the 466
most turbid sample, which is separated out in dimension 4. 467
468

17
Sensory characteristics was investigated by PLSR. The results of the PLSR shows that 5 dimensions 469
is the optimal solution to extract all of the systematic variance in the data set. The 5 dimensions 470
explain 54% of the variance in the data. That is a substantial decrease in explained variance, compared 471
to the 74%, when considering the sensory data alone. 472
473
Initially RMSEC was calculated for sensory variables in the A-PLSR analysis based on the design 474
matrix. To characterize all the systematic variance in the sensory data, 5 dimension were necessary. 475
Table 4 lists the RSMEC in the penultimate line, using sensory replicates as cross-validation segments 476
with the optimal number of dimensions. In the last line the RMSEC for prediction of sensory variables 477
from the chemical measurements are listed. Scrutiny of the RMSEC for the two different models 478
reveals that the sensory variables that are less well predicted from the analysis by HPLC and GC are 479
colour intensity, salty taste, astringent and bitter taste. The remainder of the sensory descriptors are 480
well predicted by HPLC and GC measurements. It is surprising that salty taste is not well predicted, 481
as it should arise mainly from sodium and potassium. Odour-induced saltiness enhancement 482
(Lawrence et al., 2011) is a possible reason for the poor prediction of salty taste. The likely origin of 483
the sensory properties of colour intensity, astringent and bitter are all compounds or physical 484
phenomena that were not directly measured by the chosen methods. 485
486
The distribution of samples and variables is show in Figs. 10a and b. Surprisingly, dimensions 1 487
explains less variance (9%) in the sensory data compared to dimension 2 (19%), see Fig. 10a. The 488
majority of the reason for this lies in large differences in the chemical measurements for particularly 489
sample 15Up, the wakame from France, whereas that sample does not distinguish itself in the sensory 490
measurement (see Fig. 9a). The first dimension largely separates this sample from the other 15. It is 491
characterized by strong fishy taste, that may be linked to the high concentration of the many aroma 492
compounds in the right part of dimension 1. 493
494
Dimension 2 groups the Japanese konbu in the lower part, characterized by high umami, sweetness, 495
and high viscosity. That must be linked to high glutamate. To some degree the konbu samples also 496
have mushroom aroma above average. Table 4 shows that sample 25Sj in particular has the highest 497
mushroom aroma. The konbu samples have a high concentration of 1-octen-3-one, a compound with 498
18
a distinct mushroom taste (cf. also Table 3 for verification). The upper part of dimension 2 contain 499
the two Danish seaweeds 32Fv (bladderwrack) and 13Sl (sugar kelp). Both are low in umami, but 500
high in roasted taste and aroma, and has an above average intensity of bitterness and astringency. The 501
roasted notes arise from beta-cyclocitral, 2- and 3-methylbutanal, and beta-ionone, even though the 502
compounds alone do not possess these properties on (cf. Table 3). Dimensions 3 and 4 (Fig. 10b) 503
separate the samples 01Nl, bull kelp, and 37Nl, the bull kelp salt. Both of them have a high turbidity, 504
but also high concentration of (E)-3-octen-2-one. The bull kelp salt is also characterized by high 505
concentration of 1-heptanol, 1-octanol, and 1-heptanol, and an extremely high concentration of 506
potassium (cf. also Table 2).Dimension 5 (not shown) indicates a group of compounds 2,3-507
butanedione, 2-pentanone, 3 and 2-methylbutanal, that are high in three of the samples originating 508
from Vancouver Island, not only the bull kelp (01Nl) but also the North Pacific konbu, Laminaria 509
setchelli (03Ls), and to a lesser degree the macro kelp (02Mp) also has some content of these 510
compounds. 511
512
4. Conclusion 513
The primary aim of the present study was to investigate the umami potential of a series of brown 514
seaweeds that are commonly used as foodstuff around the world. The umami taste is elicited by free 515
Glu (and to some extent of free Asp). Synergy in the umami taste can be induced by the simultaneous 516
presence of free nucleotides, such as inosinate. We did not measure free nucleotides in the present 517
study but it is known that only few seaweeds contain any appreciable amounts of inosinate, with laver 518
(Pyropia spp.) used for nori being a notorious exception (Ninomiya, 2002). We have found that konbu 519
has the largest contents of free Glu, with an appreciable variation over the various Japanese 520
subspecies of Saccharina japonica. The related species sugar kelp (Saccharina latissimi) together 521
with other members of the Laminariales have low levels of free Glu, but in comparison to konbu 522
fairly high levels of the sweet, free amino acid Ala. 523
524
The perception of umami does, however, not only depend on the glutamate content but also on how 525
other tastes and volatile aroma compounds influence the taste experience. This is indirectly 526
demonstrated in Fig. xxx where the perceived intensity of umami is plotted against the measured 527
contents of glutamate. In addition, the sensory data are substantially worse predicted by the chemical 528

19
measurements compared to the systematic variance that is extracted when analysing the sensory data 529
alone. This indicates that there are compounds that we have not analysed for that cause bitterness, 530
colour, and astringency. 531
532
The results presented in the present paper can form a basis for a more informed use of brown seaweeds 533
as a flavour-giver to foodstuff and to which extent the different species can contribute to umami taste, 534
e.g., in a soup broth and as a cooking or marinating medium for other ingredients, in particular 535
vegetables, that have very little umami on their own (Maga, 1983; Mouritsen and Styrbæk, 2014). 536
The use of brown seaweeds to flavour food may therefore, via the rising phycogastronomy (Mouritsen 537
et al., 2018), possibly help to encourage a larger intake of greens, stimulate appetite, regulate food 538
intake, and hence improve nutrition and health (Kondoh et al., 2009; Mouritsen, 2012; Cornish et al., 539
2015). The results of the paper may also be used to evaluate iodine load of seaweed products and act 540
as a guide in the use of different seaweeds as a salt substitute with a high K/Na ratio (Yamaguchi and 541
Takahashi, 1984). The particular salt precipitate from the brown seaweed bull kelp mentioned and 542
studied in this paper is of particular interest as a salt substitute with a very low Na/K-ratio and a sour, 543
salty, and bitter taste. 544
545
Acknowledgements 546
The work by OGM, ALH, and MBF is supported by the Nordea-fonden via a centre grant to Taste 547
for Life. Louis Druehl is thanked for a generous gift of a salt precipitate from Nereocystis leutkeana 548
and samples of Macrocystis, Nereocystis, and Laminaria harvested in Barkley Sound, Vancouver 549
Island. Anita Dietz is acknowledged for providing samples of Danish seaweeds. Koji Kinoshita is 550
thanked for interpretation of the Japanese description on the package of some commercial seaweeds. 551
552
References 553
Antony M, Blumenthal H, Bourdas A, Kinch D, Martinez V., … Schiaffino PM (2014) Umami: The 554
Fifth Taste. Japan Publ. Trading Co, Tokyo 555
Arasaki S, Arasaki T (1983) Low Calorie, High Nutrition Vegetables From the Sea. Japan 556
Publications, Inc, Tokyo 557

20
Bergeron E, Jolivet P (1991) Quantitative determination of glutamate in Rhodophyceae (Chondrus 558
crispus) and four Phaeophyceae (Fucus vesiculosos, Fucus serratus, Cystoseira elegans, 559
Cystoseira barbata). J Appl Phycol 33:115-120 560
Bird F (2015). Seaweed in the Kitchen. Prospect Books, London 561
Blumenthal H, Barbot P, Matsushisa N, Mikuni K (2009) Dashi and Umami: The Heart of Japanese 562
Cuisine. Cross Media Ltd, London 563
Boonprab K, Matsui K, Akakabe Y, Yoshida M, Yotsukura N, Chirapart A, Kajiwara T (2006) 564
Formation of aldehyde flavor (n-hexanal, 3Z-nonenal and 2E-nonenal) in the brown alga, 565
Laminaria angustata. J Appl Phycol 18:409-412 566
Braverman LE (1994) Iodine and the thyroid—33 years of study. Thyroid 4:351-356 567
Chandrashekar J, Hoon MA, Ryba NJ, Zucker CA (2006) The receptors and cells 568
for mammalian taste. Nature 444:288-294 569
Cornish ML, Critchley AT, Mouritsen OG (2015) A role for dietary macroalgae in the amelioration 570
of certain risk factors associated with cardiovascular disease. Phycologia 54:649-666 571
Dawczynski C, Schubert R, Jahreis G (2006) Amino acids, fatty acids, and dietary fiber in edible 572
seaweed products. Food Chem103:891-899 573
Fujii M (2005) The Enlightened Kitchen. Kodansha International, Tokyo 574
Holdt S, Kraan S (2011) Bioactive compounds in seaweed; functional food applications and 575
legislation. J Appl Phycol 23:543-597 576
Fuke S, & Ueda Y (1996) Interactions between umami and other flavor characteristics. Trends Food 577
Sci Technol 7:407-411 578
Ikeda I (2002) New seasonings. Chem Senses 27:847–849 [Translation from the original article in J 579
Chem Soc Japan 30:820–836 (1909)] 580
ISO (2011) Sensory analysis –Methodology – Method of investigating sensitivity of taste. ISO 581
3972:2011(en) 582
Japanese Culinary Academy (2016). Flavor and Seasonings: Dashi, Umami, and fermented Foods. 583
Shuhari Initiative Ltd, Tokyo 584
21
Johansen SMB, Laugesen JL, Janhøj T, Ipsen RH Frøst MB (2008) Prediction of sensory properties 585
of low-fat yoghurt and cream cheese from surface images. Food Qual Pref 19:232-246 586
Johnsen LG, Skou PB, Khakimov B Bro R (2017) Gas chromatography–mass spectrometry data 587
processing made easy. J Chromat A 1503:57–64 588
Keng FS-L, Phang S-M, Rahman NA, Leedham EC, Hughes C, Robinson AD, Harris NRP, Pyle 589
JA, Sturges WT (2013) Volatile halocarbon emissions by three tropical brown seaweeds under 590
different irradiances. J Appl Phycol 25:1377-1386 591
592
Kondoh T, Mallick HN, Torii K (2009) Activation of the gut-brain axis by dietary glutamate and 593
physiologic significance in energy homeostasis. Am J Clin Nutr 90:832S–837S 594
Kurihara K (2009) Glutamate: from discovery as a food flavor to role as a basic taste. Am J Clin Nutr 595
90:719S-722S 596
Lawrence G, Salles C, Palicki O, Septier C, Busch J, Thomas-Danguin T (2011) Using cross-modal 597
interactions to counterbalance salt reduction in solid foods. Int Dairy J 21:103–110 598
Li X, Staszewski L, Xu H, Durick K, Zoller M, Adler E (2002) Human receptors for sweet and 599
umami taste. Proc Natl Acad Sci USA 99:4692–4696 600
Mabeau S, Fleurence J (1993) Seaweed in food products: biochemical and nutritional aspects. Trends 601
Food Sci Technol 4:103-107 602
MacArtain P, Gill CIR, Brooks M, Campbell R Rowland IR (2007) Nutritional value of edible 603
seaweeds. Nutr Rev 65:535-543 604
Maga JA (1983) Flavor potentiators. CRC Crit Rev Food Sci Nutr 18:231-312 605
Martens H, Martens M (2000) Modified jack-knife estimation of parameter uncertainty in bilinear 606
modelling by partial least squares regression (PLSR). Food Qual Pref 11:5-16 607
Martens H, Martens M (2001) Multivariate Analysis of Quality: An Introduction 1. Wiley & Sons 608
Ltd, Chichester 609
Martens H, Næs T (1989) Multivariate Calibration. Wiley & Sons Ltd, Chichester 610
Mouritsen OG (2012) Umami flavour as a means to regulate food intake and to improve nutrition and 611
health. Nutr Health 21:56-75 612

22
Mouritsen OG, Khandelia H (2012) Molecular mechanism of the allosteric enhancement of the 613
umami taste sensation. FEBS J 279:3112-3120 614
Mouritsen OG, Williams L, Bjerregaard R, Duelund L (2012) Seaweeds for umami flavor in the New 615
Nordic Cuisine. Flavour 1:4 616
Mouritsen OG (2013) Seaweeds. Edible, Available & Sustainable. Chicago University Press, Chicago 617
Mouritsen OG, Dawczynski C, Duelund L, Jahreis G, Vetter W Schroder M (2013) On the human 618
consumption of the red seaweed dulse (Palmaria palmata (L.) Weber & Mohr) J Appl Phycol 619
25:1777-1791 620
Mouritsen OG, Styrbæk K (2014) Umami: Unlocking the Secrets of the Fifth Taste. Columbia 621
University Press, New York 622
Mouritsen O G (2017) Those taste weeds. J Appl Phycol 29:2159-2164 623
Mouritsen OG, Calleja G, Duelund L, Frøst MB (2017) Flavour of fermented fish, insect, game, and 624
pea sauces: Garum revisited. Int J Gast Food Sci 9:16-28 625
Mouritsen OG, Styrbæk K 2017 Mouthfeel: How Texture Makes Taste. Columbia University Press, 626
New York 627
Mouritsen OG, Rhatigan P, Lloréns JLP (2018) The rise of seaweed gastronomy: phycogastronomy. 628
Bot Mar (in press) 629
Ninomiya K (1998) Natural occurrence. Food Rev Int 14:177-211 630
Ninomiya K (2002) Umami: A universal taste. Food Rev Int 18:23-38. 631
O’Connor K (2017) Seaweed: A Global History. Reaction Books, London 632
Pereira L (2011) A review of the nutrient composition of selected edible seaweeds. In VH Pomin 633
(Ed) Seaweed: Ecology, Nutrient Composition and Medical Uses (pp. 1-47) Nova Science 634
Publishers, New York 635
Pereira L (2016) Edible Seaweeds of the World. CRC Press, Boca Raton. 636
Pérez-Lloréns J L, Hernández I, Vergara JJ, Brun FG, León À (2018) Those Curious and Delicious 637
Seaweeds. A Fascinating Voyage from Biology to Gastronomy. Servicio de Publicaciones de la 638
Universidad de Cádiz, Cádiz 639

23
Pomin VH (Ed) (2012). Seaweed: Ecology, Nutrient Composition, and Medical Uses. Nova Sci Publ, 640
Inc, New York 641
Rupérez P (2002) Mineral content of edible marine seaweeds. Food Chem 79:23-26 642
Sánchez-Machado DI, Lopez-Cervantes J, López-Hernández J, Paseiro-Losada P (2004) Fatty acids, 643
total lipid, protein, and ash contents of processed edible seaweeds. Food Chem 85:439-444, 644
Strydom E, Jooste P (2011) Modified microplate method for the determination of urinary iodine 645
concentration. In AA. Makhmudov and KL Caldwell (Eds) The Challenge of Iodine Deficiency 646
Disorder. A Decade of CDC’s Ensuring the Quality of Urinary Iodine Procedures Program (pp. 647
39-60) Centers for Disease Control and Prevention, Atlanta 648
Teas J, Pino S, Critchley AT, Braverman LE (2004) Variability of iodine content in common 649
commercially available edible seaweeds. Thyroid 14:836-841 650
van Netten C, Hoption Cann S A, Morley DR, van Netten JP (2000) Elemental and radioactive 651
analysis of commercially available seaweed. Sci Tot Environ 255:169-175 652
Li X, Staszewski L, Xu H, Durick K, Zoller M, Adler E (2002) Human receptors for 653
sweet and umami taste. Proc Natl Acad Sci USA 99:4692-4696. 654
Yamaguchi S, Takahashi C (1984) Interactions of monosodium glutamate and sodium chloride on 655
saltiness and palatability of a clear soup. J Food Sci 49:82-85 656
Zava TT, Zava DT (2011) Assessment of Japanese iodine intake based on seaweed consumption in 657
Japan: A literature-based analysis. Thyroid Res 4:14 658
Zhang FB, Klebansky B, Fine RM, Xu H, Pronin A, Liu H, Tachdjian C, Li X (2008). Molecular 659
mechanism for the umami taste synergism. Proc Natl Acad Sci USA 105:20930-20934 660
661
Tables 662
Table 1 663
Samples investigated in the present study and their origin. 664
665
Table 2 666

24
Concentrations of free amino acids, iodine, sodium, and potassium in 3 dried seaweed samples 667
extracted in dashi (Cf. Table 1). 668
Footnote: 669
Free amino acids in units of mg/100mL; iodine in units of μg/L; sodium and potassium in units of 670
mg/L. The uncertainty in the measured values is typically 15%. Analysis were carried out in 671
quadruplicates. p-values and 95% confidence intervals (CI95%) are from ANOVA. Ala: alanine; Arg: 672
arginine; Asn: asparagine; Asp: aspartic acid (aspartate); Cys: cysteine, Gln: glutamine; Glu: glutamic 673
acid (glutamate); Gly: glycine; His: histidine; Ile+Leu: isoleucine+leucine; Lys: lysine; Met: 674
methionine; Phe: phenylalanine; Pro: proline; Ser: serine; Thr: threonine; Trp: tryptophan; Tyr: 675
tyrosine; Val: valine. 676
677
Table 3 678
Contents of identified volatile compounds (relative concentrations) in dashies extracted from 16 679
selected dried seaweed samples (cf. Table 1). 680
Footnote: 681
Values are means of triplicate determinations except for samples 23Sj, 25Sj, and 26Sj (duplicate). 682
Only volatiles with significant differences between samples (determined via ANOVA) are included. 683
684
Table 4 685
Sensory characteristics of of dashies extracted from 16 selected dried seaweed samples (cf. Table 1). 686
Footnote: 687
Mean rating on a scale 1-10 (over panellists and replicates) of intensity for all significant sensory 688
descriptors for the 16 samples of dashis subjected to descriptive analysis. p-values and 95% 689
confidence intervals (CI95%) are from ANOVA. Abbreviations in labels refer to: orthonasal odour 690
(O), turbidity/visual appearance (A), taste (T), flavour i.e., retronasal odour perception (F), mouthfeel 691
(M), and after mouthfeel (AF). 692
693

25
Figures 694
Fig. 1. A-PLSR analysis of HPLC data. (a): Correlation loading plot of dimensions 1 (25%) and 2 695
(10%). (b): Correlation loading plot of dimensions 3 (6%) and 4 (5%). The plots reveal the 696
interrelationship between variables and samples; dashi samples (in blue) and AA/ions (in red). For 697
clarity of the figure, labels for less important samples are abbreviated or omitted. Confer table 1 for 698
sample names. 699
700
Fig. 2. A-PLSR analysis of GC data. (a): Correlation loading plot of dimensions 1 (58%) and 2 (9%). 701
(b): Correlation loading plot of dimensions 3 (4%) and 4 (3%). The plots reveal the interrelationship 702
between variables and samples; dashi samples (in blue) and aroma compounds (in red). For clarity 703
of the figure, labels for less important compounds and samples are abbreviated or omitted. Confer 704
table 3 for compound names. 705
706
Fig. 3. A-PLSR analysis of HPLC data, limited to the samples that were also subjected to GC and 707
sensory analysis. Correlation loading plot of dimensions 1 (24%) and 2 (10%); dashi samples (in 708
blue) and AA/ions (in red). 709
710
Fig. xxx. Contents of free glutamate (xxx), free aspartate (xxx), and alanine (xxx) for all samples 711
arranged according to magnitude of free glutamate content. 712
713
Fig. xxx. Contents of iodine for all samples arranged according to magnitude of iodine contents. 714
715
Fig. 9. A-PLSR analysis based on sensory description. (a): Correlation loading plot of dimensions 1 716
(34%) and 4 (22%). (b): Correlation loading plot of dimensions 3 (11%) and 4 (6%); dashi samples 717
(in blue) and sensory descriptors (in green). 718
719
Fig. 10. A-PLSR analysis; X: HPLC; GC, Y: Sensory analysis. (a): Correlation loading plot of 720
dimensions 1 (9%) and 2 (19%). (b): Correlation loading plot of dimensions 3 (12%) and 4 (8%).; 721
dashi samples (in blue), aroma compounds/AA/ions (in two red colors) and sensory descriptors (in 722
green). Less relevant variables are omitted for clarity. 723
26
724
Fig. xxx. Plot of perceived umami intensity from the sensory analysis as a function of amount of free 725
glutamate measured by HPLC for all 16 dashi samples subjected to sensory analysis. 726
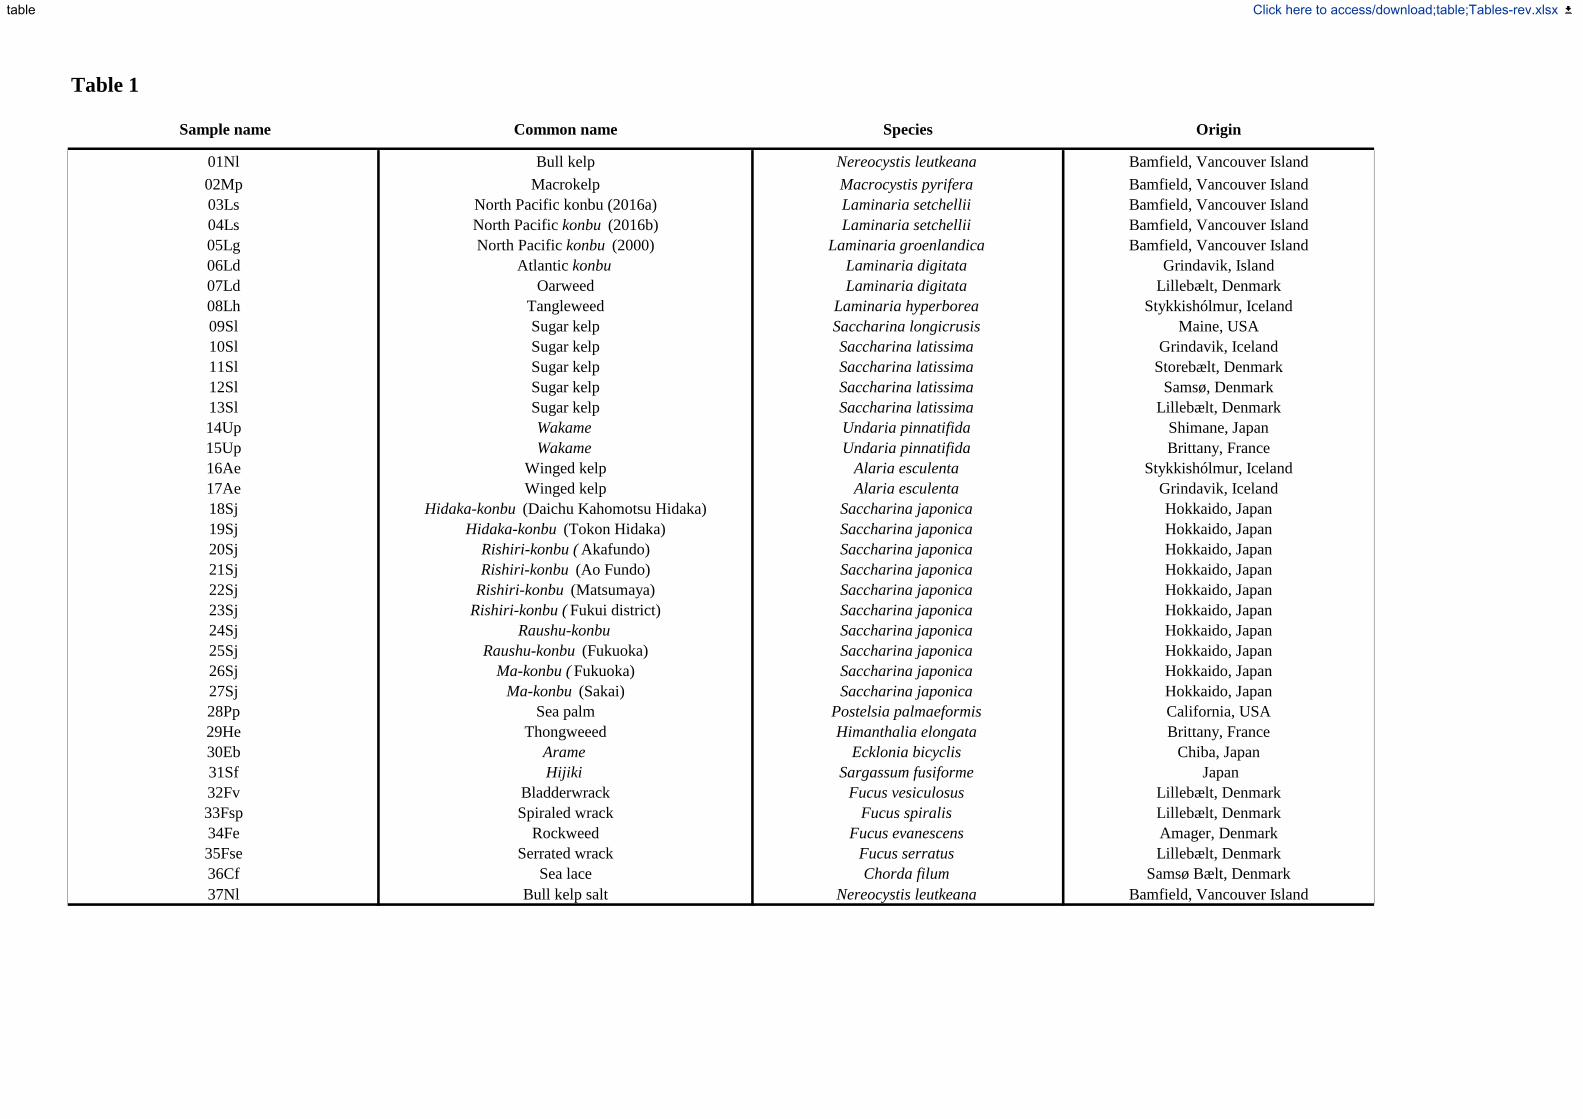
Table 1
Sample name Common name Species Origin
01Nl Bull kelp Nereocystis leutkeana Bamfield, Vancouver Island
02Mp Macrokelp Macrocystis pyrifera Bamfield, Vancouver Island
03Ls North Pacific konbu (2016a) Laminaria setchellii Bamfield, Vancouver Island
04Ls North Pacific konbu (2016b) Laminaria setchellii Bamfield, Vancouver Island
05Lg North Pacific konbu (2000) Laminaria groenlandica Bamfield, Vancouver Island
06Ld Atlantic konbu Laminaria digitata Grindavik, Island
07Ld Oarweed Laminaria digitata Lillebælt, Denmark
08Lh Tangleweed Laminaria hyperborea Stykkishólmur, Iceland
09Sl Sugar kelp Saccharina longicrusis Maine, USA
10Sl Sugar kelp Saccharina latissima Grindavik, Iceland
11Sl Sugar kelp Saccharina latissima Storebælt, Denmark
12Sl Sugar kelp Saccharina latissima Samsø, Denmark
13Sl Sugar kelp Saccharina latissima Lillebælt, Denmark
14Up Wakame Undaria pinnatifida Shimane, Japan
15Up Wakame Undaria pinnatifida Brittany, France
16Ae Winged kelp Alaria esculenta Stykkishólmur, Iceland
17Ae Winged kelp Alaria esculenta Grindavik, Iceland
18Sj Hidaka-konbu (Daichu Kahomotsu Hidaka) Saccharina japonica Hokkaido, Japan
19Sj Hidaka-konbu (Tokon Hidaka) Saccharina japonica Hokkaido, Japan
20Sj Rishiri-konbu ( Akafundo) Saccharina japonica Hokkaido, Japan
21Sj Rishiri-konbu (Ao Fundo) Saccharina japonica Hokkaido, Japan
22Sj Rishiri-konbu (Matsumaya) Saccharina japonica Hokkaido, Japan
23Sj Rishiri-konbu ( Fukui district) Saccharina japonica Hokkaido, Japan
24Sj Raushu-konbu Saccharina japonica Hokkaido, Japan
25Sj Raushu-konbu (Fukuoka) Saccharina japonica Hokkaido, Japan
26Sj Ma-konbu ( Fukuoka) Saccharina japonica Hokkaido, Japan
27Sj Ma-konbu (Sakai) Saccharina japonica Hokkaido, Japan
28Pp Sea palm Postelsia palmaeformis California, USA
29He Thongweeed Himanthalia elongata Brittany, France
30Eb Arame Ecklonia bicyclis Chiba, Japan
31Sf Hijiki Sargassum fusiforme Japan
32Fv Bladderwrack Fucus vesiculosus Lillebælt, Denmark
33Fsp Spiraled wrack Fucus spiralis Lillebælt, Denmark
34Fe Rockweed Fucus evanescens Amager, Denmark
35Fse Serrated wrack Fucus serratus Lillebælt, Denmark
36Cf Sea lace Chorda filum Samsø Bælt, Denmark
37Nl Bull kelp salt Nereocystis leutkeana Bamfield, Vancouver Island
table Click here to access/download;table;Tables-rev.xlsx

Table 2
Sample name
Subjected to GC
and sensory
analysisGly Ala Ser Pro Val Thr Asp Lys Glu Met His Phe Arg Tyr Cys2 Ile+Leu [I] [Na] [K]
01Nl yes 1.5 12 0.10 1.9 0.43 2.4 0.26 0.14 2.5 0 0.065 0.60 0.33 0.10 0.010 0.59 670 1000 1800
02Mp yes 0.22 8.3 0.0094 0.28 0.16 1.0 0.048 0.015 1.0 0 0.015 0.28 0.063 0.040 0.0025 0.30 3800 850 1800
03Ls yes 0.31 15 0.022 0.47 0.21 1.2 0.17 0.033 0.59 0.010 0.020 0.53 0.21 0.043 0.0050 0.27 2500 450 680
04Ls 0.35 11 0.018 0.44 0.23 1.2 0.13 0.023 0.49 0.0050 0.028 0.42 0.16 0.038 0 0.27 600 490 1000
05Lg 0.075 4.2 0.0085 0.10 0.040 0.90 0.065 0.015 0.31 0.015 0.0050 0.14 0.083 0.013 0 0.050 13000 520 670
06Ld 0.38 11 0.018 0.49 0.15 1.3 0.10 0.025 1.1 0.0050 0.025 0.27 0.12 0.035 0.0075 0.19 4400 940 1300
07Ld 0.54 14 0.019 0.70 0.22 2.3 0.060 0.025 0.56 0 0.020 0.35 0.078 0.063 0.015 0.25 3100 620 1400
08Lh 1.0 12 0.011 1.3 0.063 1.7 0.25 0.015 1.5 0.010 0.020 0.25 0.30 0.018 0 0.045 6800 1000 1800
09Sl 0.68 8.9 0.0064 0.87 0.070 0.91 0.050 0.008 1.8 0 0 0.18 0.063 0.005 0 0.035 2600 1000 2100
10Sl yes 0.39 3.9 0.0037 0.49 0.29 0.62 0.055 0.010 0.86 0 0.0075 0.14 0.068 0.015 0.0050 0.19 4400 690 290
11Sl 0.070 1.2 0.0030 0.085 0.038 0.08 0.023 0.008 0.19 0 0.0025 0.13 0.025 0 0.0075 0.020 2400 440 500
12Sl 0.081 0.64 0.0031 0.10 0.045 0.043 0.028 0.005 0.12 0 0.013 0.14 0.033 0.008 0.0075 0.020 480 480 220
13Sl yes 0.37 8.8 0.013 0.47 0.36 1.0 0.055 0.020 1.1 0.020 0.028 0.49 0.073 0.048 0.010 0.26 1600 460 690
14Up 0.77 15 0.055 1.0 0.12 3.1 0.28 0.078 3.9 0.040 0.045 0.70 0.34 0.070 0.0050 0.62 110 620 1500
15Up yes 0 0 0.0064 0.010 0 0 0.005 0.005 0.015 0 0 0 0.005 0 0 0 60 1200 42
16Ae yes 1.1 7.8 0.0077 1.4 0.088 0.67 0.068 0.013 0.33 0 0.0050 0.35 0.083 0.078 0.0050 0.11 160 1600 340
17Ae 0.24 7.4 0.014 0.24 0.065 1.2 0.090 0.015 1.2 0 0.010 0.15 0.12 0.008 0.0075 0.045 300 920 1000
18Sj yes 0.84 1.0 0.011 1.0 0.043 0.13 0.058 0.013 18 0 0.010 0.12 0.075 0 0.018 0.050 5400 710 720
19Sj 0.77 1.5 0.010 1.0 0.045 0.18 0.055 0.013 4.3 0 0.010 0.11 0.070 0.005 0.0075 0.040 1700 690 1300
20Sj 0.92 0.38 0.014 1.2 0.087 0 0.018 0.015 28 0 0.0050 0.49 0.023 0.43 0.27 0.060 6200 630 2000
21Sj 0.69 0.53 0.012 0.87 0.055 0.12 0.048 0.018 31 0 0.0050 0.20 0.055 0.020 0.0075 0.085 3100 540 970
22Sj 0.31 0.18 0.011 0.42 0.010 0.040 0.018 0.013 11 0 0.0075 0.30 0.020 0.005 0.015 0.055 4100 600 980
23Sj yes 0.87 0.35 0.033 1.1 0.043 0.090 0.025 0.045 23 0 0.015 0.78 0.028 0.040 0 0.075 4200 480 960
24Sj 0.84 0.42 0.034 1.0 0.050 0.090 0.030 0.048 27 0.010 0.030 1.2 0.035 0.053 0 0.085 2600 530 1700
25Sj yes 0.57 0.37 0.012 0.72 0.038 0 0.020 0.015 23 0.010 0.0050 0.28 0.020 0.030 0.0050 0.030 4300 530 1900
26Sj yes 1.4 0.47 0.011 1.78 0.050 0.093 0.030 0.013 37 0.015 0.010 0.23 0.035 0.0025 0 0.11 5700 560 1400
27Sj yes 0.33 0.42 0.0071 0.42 0.053 0.040 0.023 0.010 28 0 0.010 0.19 0.028 0.0050 0.0025 0.075 5100 800 1900
28Pp yes 0.45 5.7 0.016 0.57 0.085 1.0 0.13 0.020 2.2 0 0.015 0.20 0.16 0.0325 0.018 0.045 1100 1100 820
29He 0.12 1.3 0.0066 0.15 0.10 0.34 0.023 0.010 0.55 0 0.0025 0.10 0.02 0.0275 0.0050 0.035 110 1300 2600
30Eb yes 1.1 5.5 0.0041 1.3 0.028 0.56 0.063 0.008 0.81 0 0.0025 0.10 0.08 0.0025 0.010 0.030 3000 890 3200
31Sf 0.048 0.12 0.0044 0.053 0.015 0 0.010 0.0067 0.073 0 0.030 0.030 0.018 0 0 0 490 210 680
32Fv yes 0.14 2.0 0.012 0.18 0.078 1.1 0.16 0.015 1.4 0 0.048 0.37 0.20 0.025 0 0.060 950 720 650
33Fsp 0.21 0.8 0.013 0.25 0.070 0.77 0.19 0.018 3.1 0 0.028 0.33 0.24 0.040 0 0.10 240 710 650
34Fe 0.073 1.9 0.011 0.088 0.073 0.89 0.16 0.015 1.8 0 0.020 0.25 0.19 0.030 0.0025 0.060 1700 480 570
35Fse 0.24 1.4 0.010 0.30 0.068 0.79 0.14 0.010 1.4 0 0.023 0.34 0.18 0.033 0.010 0.070 580 510 1000
36Cf 0.10 0.59 0.0029 0.11 0.033 0.54 0.033 0.005 0.14 0 0.0025 0.060 0.038 0.010 0.013 0.020 1400 320 590
37Nl yes 0.49 3.5 0.025 0.64 0.14 0.70 0.16 0.033 0.84 0 0.0075 0.13 0.20 0.038 0 0.16 1400 470 7900
p-value 1E-08 7E-34 2E-05 4E-10 3E-11 3E-14 1E-03 3E-06 5E-32 4E-12 2E-06 2E-05 8E-04 4E-15 7E-01 4E-22 9E-40 3E-23 6E-32
Significance level *** *** *** *** *** *** ** *** *** *** *** *** *** *** NS *** *** *** ***
Confidence intervals 0.39 2.2 0.021 0.47 0.086 0.59 0.10 0.028 5.1 0.0069 0.016 0.28 0.12 0.018 n/a 0.088 1000 210 620
RMSEC - 4reps HPLC from design three
factors - 38 samples 0.48 3.7 0.025 0.58 0.11 0.72 0.11 0.033 7.0 0.0092 0.019 0.34 0.13 0.025 n/a 0.12 2300 340 1300RMSEC - 4reps HPLC from design three
factors 16 samples 0.62 3.6 0.039 0.73 0.15 0.75 0.12 0.051 7.2 0.0098 0.023 0.33 0.15 0.03 n/a 0.16 1400 270 1900
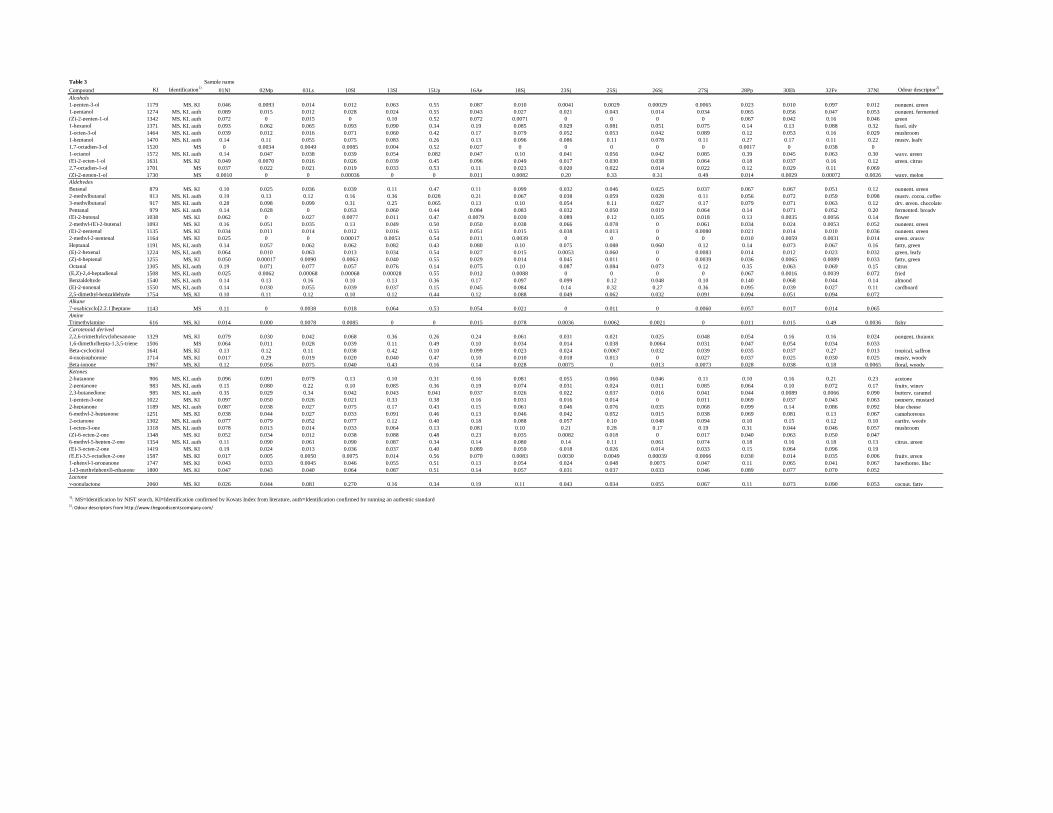
Table 3 Sample name
Compound KI Identification1)
01Nl 02Mp 03Ls 10Sl 13Sl 15Up 16Ae 18Sj 23Sj 25Sj 26Sj 27Sj 28Pp 30Eb 32Fv 37Nl Odour descriptor2)
Alcohols
1-penten-3-ol 1179 MS, KI 0.046 0.0093 0.014 0.012 0.063 0.55 0.087 0.010 0.0041 0.0029 0.00029 0.0065 0.023 0.010 0.097 0.012 pungent, green
1-pentanol 1274 MS, KI, auth 0.089 0.015 0.012 0.028 0.024 0.55 0.043 0.027 0.021 0.043 0.014 0.034 0.065 0.056 0.047 0.053 pungent, fermented
(Z)-2-penten-1-ol 1342 MS, KI, auth 0.072 0 0.015 0 0.10 0.52 0.072 0.0071 0 0 0 0 0.067 0.042 0.16 0.046 green
1-hexanol 1371 MS, KI, auth 0.093 0.062 0.065 0.093 0.090 0.34 0.19 0.085 0.029 0.081 0.051 0.075 0.14 0.13 0.088 0.32 fusel, oily
1-octen-3-ol 1464 MS, KI, auth 0.039 0.012 0.016 0.071 0.060 0.42 0.17 0.079 0.052 0.053 0.042 0.089 0.12 0.053 0.16 0.029 mushroom
1-heptanol 1470 MS, KI, auth 0.14 0.11 0.055 0.075 0.083 0.26 0.13 0.096 0.086 0.11 0.078 0.11 0.27 0.17 0.11 0.22 musty, leafy
1,7-octadien-3-ol 1520 MS 0 0.0034 0.0049 0.0085 0.004 0.52 0.027 0 0 0 0 0 0.0017 0 0.038 0
1-octanol 1572 MS, KI, auth 0.14 0.047 0.038 0.039 0.054 0.082 0.047 0.10 0.041 0.056 0.042 0.085 0.39 0.045 0.063 0.30 waxy, green
(E)-2-octen-1-ol 1631 MS, KI 0.049 0.0070 0.016 0.026 0.039 0.45 0.096 0.049 0.017 0.030 0.038 0.064 0.18 0.037 0.16 0.12 green, citrus
2,7-octadien-1-ol 1701 MS 0.037 0.022 0.021 0.019 0.033 0.53 0.11 0.023 0.020 0.022 0.014 0.022 0.12 0.029 0.11 0.069
(Z)-2-nonen-1-ol 1730 MS 0.0010 0 0 0.00036 0 0 0.011 0.0082 0.20 0.33 0.31 0.49 0.014 0.0029 0.00072 0.0026 waxy, melon
Aldehydes
Butanal 879 MS, KI 0.10 0.025 0.036 0.039 0.11 0.47 0.11 0.099 0.032 0.046 0.025 0.037 0.067 0.067 0.051 0.12 pungent, green
2-methylbutanal 913 MS, KI, auth 0.19 0.13 0.12 0.16 0.36 0.028 0.21 0.067 0.038 0.059 0.028 0.11 0.056 0.072 0.059 0.098 musty, cocoa, coffee
3-methylbutanal 917 MS, KI, auth 0.28 0.098 0.099 0.31 0.25 0.065 0.13 0.10 0.054 0.11 0.027 0.17 0.079 0.071 0.063 0.12 dry, green, chocolate
Pentanal 979 MS, KI, auth 0.14 0.028 0 0.053 0.060 0.44 0.084 0.083 0.032 0.050 0.019 0.064 0.14 0.071 0.052 0.20 fermented, bready
(E)-2-butenal 1038 MS, KI 0.062 0 0.027 0.0077 0.011 0.47 0.0079 0.039 0.089 0.12 0.105 0.018 0.13 0.0035 0.0056 0.14 flower
2-methyl-(E)-2-butenal 1093 MS, KI 0.16 0.051 0.035 0.13 0.049 0.50 0.050 0.038 0.066 0.078 0 0.061 0.034 0.024 0.0053 0.052 pungent, green
(E)-2-pentenal 1135 MS, KI 0.034 0.011 0.014 0.012 0.016 0.55 0.051 0.015 0.038 0.013 0 0.0080 0.021 0.014 0.010 0.036 pungent, green
2-methyl-2-pentenal 1164 MS, KI 0.025 0 0 0.00017 0.0053 0.54 0.011 0.0039 0 0 0 0 0.010 0.0059 0.0031 0.014 green, grassy
Heptanal 1191 MS, KI, auth 0.14 0.057 0.062 0.062 0.082 0.43 0.080 0.10 0.075 0.088 0.060 0.12 0.14 0.073 0.067 0.16 fatty, green
(E)-2-hexenal 1224 MS, KI, auth 0.064 0.010 0.063 0.013 0.034 0.54 0.027 0.015 0.0053 0.060 0 0.0083 0.014 0.012 0.023 0.032 green, leafy
(Z)-4-heptenal 1255 MS, KI 0.050 0.00017 0.0090 0.0063 0.040 0.55 0.029 0.014 0.045 0.011 0 0.0039 0.036 0.0065 0.0089 0.033 fatty, green
Octanal 1305 MS, KI, auth 0.19 0.071 0.077 0.057 0.076 0.14 0.075 0.10 0.087 0.084 0.073 0.12 0.35 0.063 0.069 0.15 citrus
(E,Z)-2,4-heptadienal 1508 MS, KI, auth 0.025 0.0062 0.00068 0.00068 0.00028 0.55 0.012 0.0088 0 0 0 0 0.067 0.0016 0.0039 0.072 fried
Benzaldehyde 1540 MS, KI, auth 0.14 0.13 0.16 0.10 0.13 0.36 0.17 0.097 0.099 0.12 0.048 0.10 0.140 0.068 0.044 0.14 almond
(E)-2-nonenal 1550 MS, KI, auth 0.14 0.030 0.055 0.039 0.037 0.15 0.045 0.084 0.14 0.32 0.27 0.36 0.095 0.039 0.027 0.11 cardboard
2,5-dimethyl-benzaldehyde 1754 MS, KI 0.10 0.11 0.12 0.10 0.12 0.44 0.12 0.088 0.049 0.062 0.032 0.091 0.094 0.051 0.094 0.072
Alkane
7-oxabicyclo[2.2.1]heptane 1143 MS 0.11 0 0.0038 0.018 0.064 0.53 0.054 0.021 0 0.011 0 0.0060 0.057 0.017 0.014 0.065
Amine
Trimethylamine 616 MS, KI 0.014 0.000 0.0078 0.0085 0 0 0.015 0.078 0.0036 0.0062 0.0021 0 0.011 0.015 0.49 0.0036 fishy
Carotenoid derived
2,2,6-trimethylcyclohexanone 1329 MS, KI 0.079 0.030 0.042 0.068 0.36 0.26 0.24 0.061 0.031 0.021 0.025 0.048 0.054 0.16 0.16 0.024 pungent, thujonic
1,6-dimethylhepta-1,3,5-triene 1506 MS 0.064 0.011 0.028 0.039 0.11 0.49 0.10 0.034 0.014 0.038 0.0064 0.031 0.047 0.054 0.034 0.033
Beta-cyclocitral 1641 MS, KI 0.13 0.12 0.11 0.038 0.42 0.10 0.099 0.023 0.024 0.0067 0.032 0.039 0.035 0.037 0.27 0.013 tropical, saffron
4-oxoisophorone 1714 MS, KI 0.017 0.29 0.019 0.020 0.040 0.47 0.10 0.010 0.018 0.013 0 0.027 0.037 0.025 0.030 0.025 musty, woody
Beta-ionone 1967 MS, KI 0.12 0.056 0.075 0.040 0.43 0.16 0.14 0.028 0.0075 0 0.013 0.0073 0.028 0.038 0.18 0.0065 floral, woody
Ketones
2-butanone 906 MS, KI, auth 0.096 0.091 0.079 0.13 0.10 0.31 0.16 0.081 0.055 0.066 0.046 0.11 0.10 0.16 0.21 0.23 acetone
2-pentanone 983 MS, KI, auth 0.15 0.080 0.22 0.10 0.085 0.36 0.19 0.074 0.031 0.024 0.011 0.085 0.064 0.10 0.072 0.17 fruity, winey
2,3-butanedione 985 MS, KI, auth 0.35 0.029 0.34 0.042 0.043 0.041 0.037 0.026 0.022 0.037 0.016 0.041 0.044 0.0089 0.0066 0.090 buttery, caramel
1-penten-3-one 1022 MS, KI 0.097 0.050 0.026 0.021 0.33 0.38 0.16 0.031 0.016 0.014 0 0.011 0.069 0.037 0.043 0.063 peppery, mustard
2-heptanone 1189 MS, KI, auth 0.087 0.038 0.027 0.075 0.17 0.43 0.15 0.061 0.046 0.076 0.035 0.068 0.099 0.14 0.086 0.092 blue cheese
6-methyl-2-heptanone 1251 MS, KI 0.038 0.044 0.027 0.033 0.091 0.46 0.13 0.046 0.042 0.052 0.015 0.038 0.069 0.081 0.13 0.067 camphoreous
2-octanone 1302 MS, KI, auth 0.077 0.079 0.052 0.077 0.12 0.40 0.18 0.088 0.057 0.10 0.048 0.094 0.10 0.15 0.12 0.10 earthy, weedy
1-octen-3-one 1318 MS, KI, auth 0.078 0.013 0.014 0.033 0.064 0.13 0.081 0.10 0.21 0.28 0.17 0.19 0.31 0.044 0.046 0.057 mushroom
(Z)-6-octen-2-one 1348 MS, KI 0.052 0.034 0.012 0.038 0.088 0.48 0.23 0.035 0.0082 0.018 0 0.017 0.040 0.063 0.050 0.047
6-methyl-5-hepten-2-one 1354 MS, KI, auth 0.11 0.090 0.061 0.090 0.087 0.34 0.14 0.080 0.14 0.11 0.061 0.074 0.18 0.16 0.18 0.13 citrus, green
(E)-3-octen-2-one 1419 MS, KI 0.19 0.024 0.013 0.036 0.037 0.40 0.089 0.059 0.018 0.026 0.014 0.033 0.15 0.064 0.096 0.19
(E,E)-3,5-octadien-2-one 1587 MS, KI 0.017 0.005 0.0050 0.0075 0.014 0.56 0.070 0.0083 0.0030 0.0049 0.00039 0.0066 0.030 0.014 0.035 0.006 fruity, green
1-phenyl-1-propanone 1747 MS, KI 0.043 0.033 0.0045 0.046 0.055 0.51 0.13 0.054 0.024 0.048 0.0075 0.047 0.11 0.065 0.041 0.067 hawthorne, lilac
1-(3-methylphenyl)-ethanone 1800 MS, KI 0.047 0.043 0.040 0.064 0.087 0.51 0.14 0.057 0.031 0.037 0.033 0.046 0.089 0.077 0.070 0.052
Lactone
γ-nonalactone 2060 MS, KI 0.026 0.044 0.081 0.270 0.16 0.34 0.19 0.11 0.043 0.034 0.055 0.067 0.11 0.073 0.090 0.053 cocnut, fatty
1): MS=Identification by NIST search, KI=Identification confirmed by Kovats Index from literature, auth=Identification confirmed by running an authentic standard
2): Odour descriptors from http://www.thegoodscentscompany.com/

Table 4
Sample name Turbidity (A) Color Intensity (A) Seaweed (O) Mushroom (O) Fishy (O) Tea (O) Roasted (O) Roasted (F) Fishy (F) Salty (T)Umami
(T)Sour (T) Bitter (T) Sweet (T)
Viscosity
(M)
Astringent
(AF)Fatty (AF)
Metallic
(AF)
01Nl 6.8 2.9 5.7 5.5 4.0 2.8 2.4 4.2 2.0 6.4 6.5 2.1 2.4 3.4 5.1 3.6 4.0 3.6
02Mp 4.1 7.4 4.6 4.3 2.7 6.2 3.9 5.3 1.8 6.9 5.9 2.3 3.6 2.9 4.8 4.7 3.8 4.3
03Ls 4.4 0.6 5.7 4.7 3.3 2.4 2.7 2.8 1.4 1.7 5.0 0.9 1.9 2.9 3.2 2.7 2.1 3.4
10Sl 3.6 2.5 5.5 5.4 3.6 3.2 4.8 4.5 1.1 1.8 5.5 1.1 2.6 1.9 3.7 3.4 2.5 3.3
13Sl 1.4 4.9 6.7 4.5 4.5 3.8 3.7 4.0 1.5 1.5 4.5 0.8 4.3 2.5 3.1 4.5 2.4 3.6
15Up 1.9 1.3 7.5 3.2 6.3 4.0 2.5 3.5 4.0 6.0 4.8 2.5 3.2 2.0 4.4 4.8 2.8 4.5
16Ae 2.4 2.8 7.3 4.0 4.6 3.4 3.6 3.7 2.6 7.7 5.6 2.2 2.2 2.7 4.4 4.1 4.1 3.8
18Sj 3.9 0.3 6.4 5.2 4.5 2.8 2.2 3.6 1.1 3.2 6.9 1.4 1.8 2.4 4.3 3.1 3.2 3.8
23Sj 1.9 0.3 4.2 5.2 2.7 2.5 2.7 3.4 1.2 2.7 6.9 1.2 1.3 4.3 4.6 3.2 4.2 3.6
25Sj 2.4 0.6 4.8 6.3 1.8 2.9 2.6 3.5 1.1 5.9 7.7 2.1 2.1 3.7 4.3 3.1 3.5 3.9
26Sj 2.3 0.3 3.3 4.9 1.7 2.3 2.4 3.2 1.0 3.9 7.9 1.7 1.4 4.0 4.5 3.2 3.8 3.7
27Sj 2.7 1.4 4.9 5.2 3.2 2.6 2.9 3.8 1.8 6.8 8.0 2.4 2.0 3.2 4.9 3.2 4.1 4.1
28Pp 4.6 5.8 7.5 4.4 5.2 4.0 2.9 4.3 3.1 5.5 5.7 1.8 3.8 2.8 4.2 5.1 3.4 4.5
30Eb 2.2 8.6 6.1 5.8 3.6 3.8 4.8 6.3 2.3 5.9 6.2 2.0 6.7 2.4 4.4 6.0 3.8 4.7
32Fv 1.4 7.8 6.1 4.7 7.2 3.3 3.8 4.1 2.9 2.0 4.6 1.0 2.6 1.6 3.8 4.3 2.8 3.6
37Nl 4.6 1.4 6.5 5.6 4.0 3.2 3.1 3.0 2.8 9.4 6.2 3.8 4.8 2.1 5.4 5.7 4.3 5.8
p-value p<0.0001 p<0.0001 p<0.0001 p=0.002 p<0.0001 p<0.0001 p<0.0001 p=0.002 p=0.001 p<0.0001 p<0.0001 p<0.0001 p<0.0001 p<0.0001 p=0.037 p<0.0001 P=0.018 p=0.019
CI95% 0.7 0.4 0.6 0.8 0.8 0.7 0.7 0.7 0.6 0.6 0.7 0.6 0.7 0.6 0.6 0.7 0.8 0.8
RMSEC - Sensory from
design 5 factors1.14 0.45 0.81 0.91 1.12 1.00 0.73 0.74 0.73 0.62 0.89 0.51 0.69 0.72 0.62 0.48 1.11 0.75
RMSEC - Sensory from
chemical measurements
5 factors
1.19 2.00 0.99 0.84 1.33 1.04 0.87 0.89 0.69 1.69 0.84 0.64 1.19 0.72 0.63 0.99 1.03 0.79
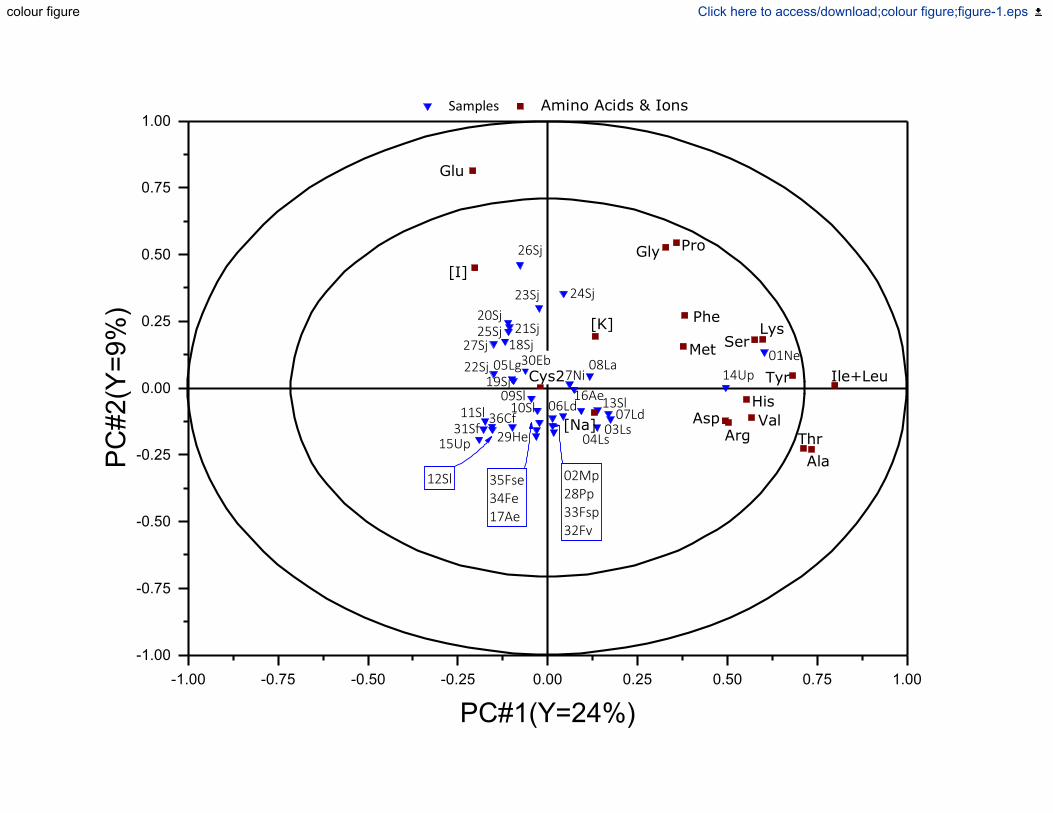
-1.00 -0.75 -0.50 -0.25 0.00 0.25 0.50 0.75 1.00-1.00
-0.75
-0.50
-0.25
0.00
0.25
0.50
0.75
1.00
12Sl 02Mp28Pp33Fsp32Fv
06Ld 13Sl07Ld
03Ls04Ls
35Fse34Fe17Ae
16Ae37Ni
08La
29He36Cf
10Sl09Sl
11Sl31Sf
15Up
05Lg30Eb19Sj
22Sj
26Sj
24Sj23Sj
25Sj 21Sj27Sj
20Sj
18Sj
14Up
[Na]
[K]
Cys2
AlaThrArg
Asp ValHis
Ile+LeuTyr
LysSerMet
Phe
Gly Pro
[I]
Samples Amino Acids & Ions PC
#2(Y=9%)
PC#1(Y=24%)
Glu
01Ne
colour figure Click here to access/download;colour figure;figure-1.eps

-1.00 -0.75 -0.50 -0.25 0.00 0.25 0.50 0.75 1.00-1.00
-0.75
-0.50
-0.25
0.00
0.25
0.50
0.75
1.00
[48], [28], [40], [41],[21], [07], [10]
[12]
[02] [24]
[15] [44] [09]
[39]
[04] 1-hexanol
[43]
[45]
[06] 1-heptanol
[01] [36] 2-pentanone
[35] 2-butanone
[20] Heptanal
[23] Octanal[16] (E)-2-butenal
[33] 4-oxoisophorone [37] 2,3-butanedione
[14] 3-methyl-butanal
[38] 1-penten-3-one
[49] -nonalactone
[30] 2,2,6-trimethyl-cyclohexanone
[34] Beta-ionone
37Nl
03Ls02Mp
30Eb
28Pp
25Sj26Sj
23Sj
27Sj
01Nl
13Sl
10Sl
18Sj
[11] (Z)-2-nonen-1-ol
[42] 1-octen-3-one
[26] (E)-2-nonenal
[13] 2-methyl-butanal
[08] 1-octanol
[32] Beta-cyclocitral
15Up
32Fv
16Ae
[29], [ 46], [18], [22], [47], [19], [17]
Samples Aroma compounds PC
#2(Y=9%)
PC#1(Y=58%)
colour figure Click here to access/download;colour figure;figure-2.eps
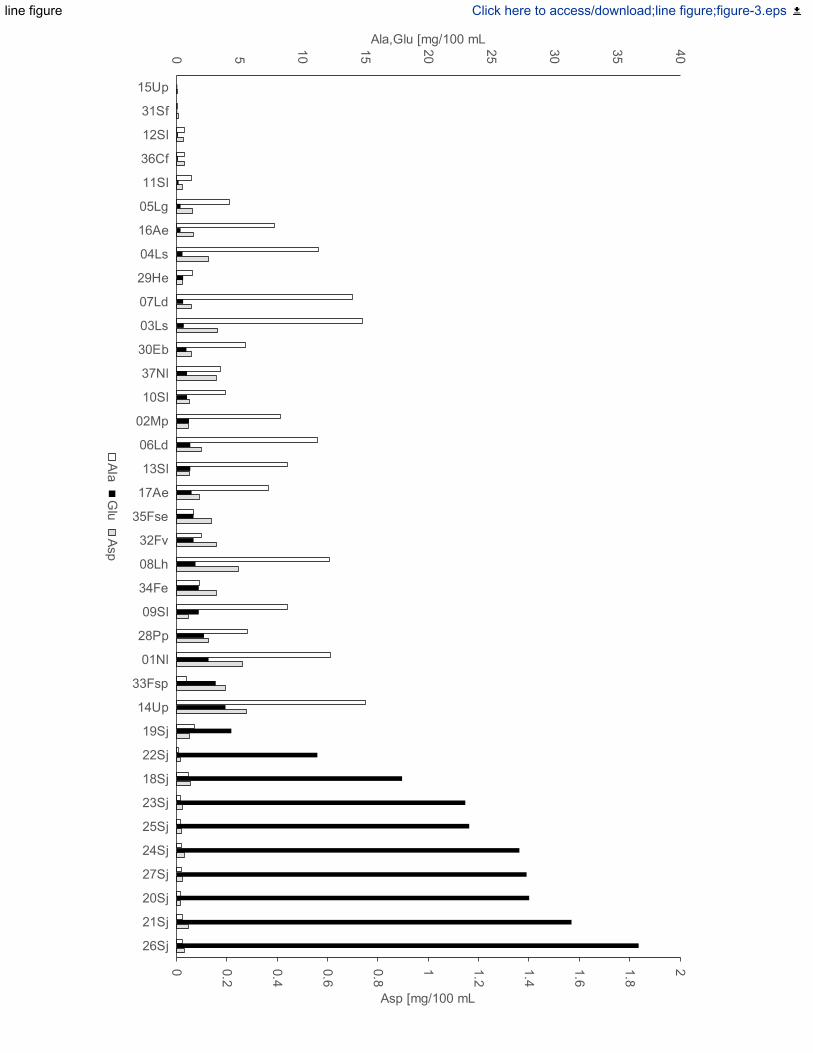
0 0.2
0.4
0.6
0.8
1 1.2
1.4
1.6
1.8
2
0 5
10
15
20
25
30
35
40
15Up
31Sf
12Sl
36Cf
11Sl
05Lg
16Ae
04Ls
29He
07Ld
03Ls
30Eb
37Nl
10Sl
02Mp
06Ld
13Sl
17Ae
35Fse
32Fv
08Lh
34Fe
09Sl
28Pp
01Nl
33Fsp
14Up
19Sj
22Sj
18Sj
23Sj
25Sj
24Sj
27Sj
20Sj
21Sj
26Sj
Asp [mg/100 mL
Ala,Glu [mg/100 mL
Ala
Glu
Asp
line figure Click here to access/download;line figure;figure-3.eps

-1.00 -0.75 -0.50 -0.25 0.00 0.25 0.50 0.75 1.00-1.00
-0.75
-0.50
-0.25
0.00
0.25
0.50
0.75
1.00
16Ae
02Mp
14Up
37NI
Cys2
[K]
23Sj
27Sj
10SI
26Sj
30Eb
Glu
Tyr
Met
His
Ile+Leu
Thr
Ala
Phe
[Na]
25Sj18Sj
13Sl
01Nl
03Ls
32Fv28Pp
ProGly
Arg
Ser
Samples Amino Acids and Ions PC
#2(Y=10%
)
PC#1(Y=28%)
Asp
Lys
[I]
Val
colour figure Click here to access/download;colour figure;figure-4.eps

0
20
00
40
00
60
00
80
00
10
00
0
12
00
0
14
00
0
15Up
14Up
29He
16Ae
33Fsp
17Ae
12Sl
31Sf
35Fse
04Ls
01Nl
32Fv
28Pp
36Cf
37Nl
13Sl
19Sj
34Fe
11Sl
03Ls
09Sl
24Sj
30Eb
07Ld
21Sj
02Mp
22Sj
23Sj
25Sj
06Ld
10Sl
27Sj
18Sj
26Sj
20Sj
08Lh
05Lg
iodine [mg/100 mL]line figure Click here to access/download;line figure;figure-5.eps

-1.00 -0.75 -0.50 -0.25 0.00 0.25 0.50 0.75 1.00-1.00
-0.75
-0.50
-0.25
0.00
0.25
0.50
0.75
1.00
Fatty(AF)
28Pp
37NI
15Up30Eb
16Ae02Mp
01NI 27Sj25Sj
26Sj
18Sj23Sj
10SI 03Ls
13SI
Sweet(T)Mushroom(O)
Umami(T)
Color Intensity(A)
Salty(T)
Turbidity (A)
Sour(T)Viscosity(M)
Fishy(F)
Roasted(F)
Bitter(T)
Astringency(AF)
Tea (O)
Seaweed(O)
Roasted(O)
Metallic (AF)
Samples Sensory attributesPC
#2(Y=23%
)
PC#1(Y=36%)
32Fv
Fishy(O)
colour figure Click here to access/download;colour figure;figure-6.eps

-1.0 -0.8 -0.6 -0.4 -0.2 0.0 0.2 0.4 0.6 0.8 1.0-1.0
-0.8
-0.6
-0.4
-0.2
0.0
0.2
0.4
0.6
0.8
1.0
[48], [29], [31], [12],[10], [28],[10],[47],[46],[2],[21],[22],[19],[18],[24]
[05]
Sour(T)
Samples Amino Acids & Ions Aroma compounds Sensory attributes
(PC
#2 X
=9%
;Y=1
9%)
(PC#1 X=45%;Y=9%)
16Ae
28Pp
32Fv
18Sj
27Sj25Sj
23Sj
26Sj
13Sl
37NI
15Up
10Sl, 30Eb, 01Nl, 02Mp, 03Ls
[Na]
[K]
[I]
Glu
Gly Pro
Met
Phe
ValThr
Ala
Salty(T)
Viscosity(M)
Metallic (AF)
Fatty(AF)
Umami(T)
Sweet(T)
Mushroom(O)
Fishy(F)Astringency (AF)
Bitter(T)
Tea(O)
Roasted(O)Seaweed(O)
Fishy(O)
Color Intensity(A)
[16] (E)-2-butenal
[20] Heptanal
[04]
[49]
[35] 2-butanone
[03], [43], [39], [27],[44], [40], [41],[1]
[06] 1-heptanol
[38] 1-penten-3-one
[30] 2,2,6-trimethyl-cyclohexanone
[34] Beta-ionone
[32] Beta-cyclocitral
[13] 2-methyl-butanal
[14]
[42] 1-octen-3-one
[26] (E)-2-nonenal
[23]
[08]
[11] (Z)-2-nonen-1-ol
[37] 2,3-butanedione[36]
colour figure Click here to access/download;colour figure;figure-7a.eps

-1.0 -0.8 -0.6 -0.4 -0.2 0.0 0.2 0.4 0.6 0.8 1.0-1.0
-0.8
-0.6
-0.4
-0.2
0.0
0.2
0.4
0.6
0.8
1.0
(PC#3 X=9%;Y=12%)
[14] 3-methylbutanal
[23] Octanal
[6] 1-heptanol[8] 1-octanol
Turbidity (A)
32Fv
03Ls
LysSerIle+Leu
TyrHis
Gly
Sour(T)
Samples Amino Acids & Ions Aroma compounds Sensory attributes
(PC
#4 X
=10%
;Y=8
%)
16Ae
28Pp
18Sj27Sj
30Eb
13Sl
37NI
01Nl
[Na][K]
[I]
Glu
Pro
Met
Phe
Val
ThrAsp,Arg
Ala
Salty(T)
Viscosity(M)
Metallic (AF)
Umami(T)Mushroom(O)
Astringency (AF)Bitter(T)Tea(O)
Roasted(O)
Seaweed(O)
[38]
[30] 2,2,6-trimethyl-cyclohexanone
[34] Beta-ionone[32] Beta-cyclocitral
[13] 2-methyl-butanal
[15] Pentanal[45] (E)-3-octen-2-one
[26] (E)-2-nonenal[37] 2,3-butanedione
colour figure Click here to access/download;colour figure;figure-7b.eps

0 10 20 30 400
1
2
3
4
5
6
7
8
9
10
16Ae10Sl
28Pp02Mp
03Ls15Up 32Fv
13Sl
30Eb37Nl
01Nl
18Sj 23Sj
25Sj27Sj
Um
ami (
T)
Glu [mg/100 mL]
26Sj
line figure Click here to access/download;line figure;figure-8.eps