Embed Size (px)
Citation preview
Ultrasound contrast agents:Ultrasound contrast agents:From imaging to therapyFrom imaging to therapy
Ayache BOUAKAZAyache BOUAKAZAyache BOUAKAZAyache BOUAKAZ
‐ UMR Imagerie et cerveau
‐ Inserm U930 – FRE CNRS 2448
‐Université François RabelaisUniversité François Rabelais
Tours, France
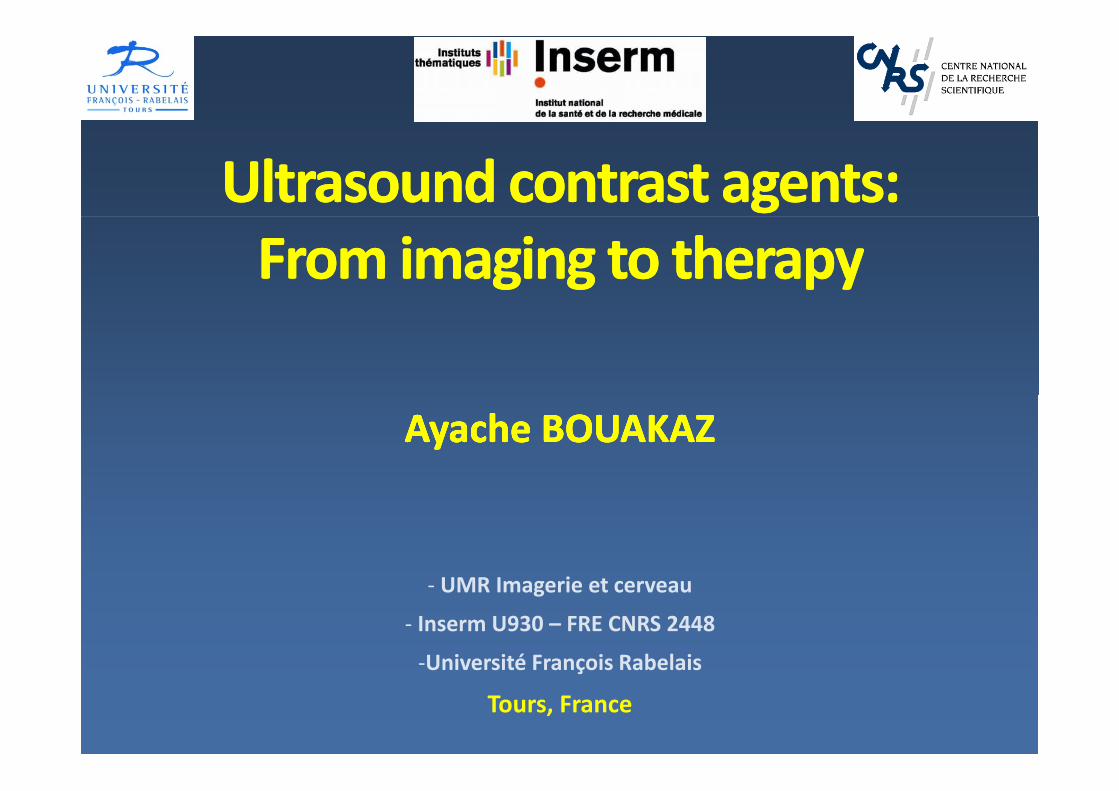
Contrast agent for ultrasound
UCA : Suspensions of tiny gas microbubbles for intravenous injection
Cross the capillary bedCross the capillary bed
• Diameter 1‐10 μm (Φ=3 μm)shell
Diameter 1 10 μm (Φ 3 μm)• Persistence: minutes to hours
• Gas: air or high molecular weight gas Gas• Shell: albumin/lipid/polymer
• Shell thickness 5 ‐ 500 nm
C i 1 5 108 b bbl / l• Concentration 1‐5 x 10⁸ bubbles/ml• Sonovue Europe 2001
• Definity USA & Europe (Luminity 2007)Definity USA & Europe (Luminity 2007)
• Sonazoid Japan 2007
RBC6–8 µm

Contrast agent for ultrasound
What do we need contrast agent for?
• “Boost” image quality
• Enhance diagnostic confidence
Principle :‐ Amplify the amplitude of backscattered signal (echo)G i b bbl
• Clinical applications
‐ Gas microbubbles
Clinical applications– Estimation of myocardial perfusion– Detection and characterization of tumors– Amplification of Doppler signal
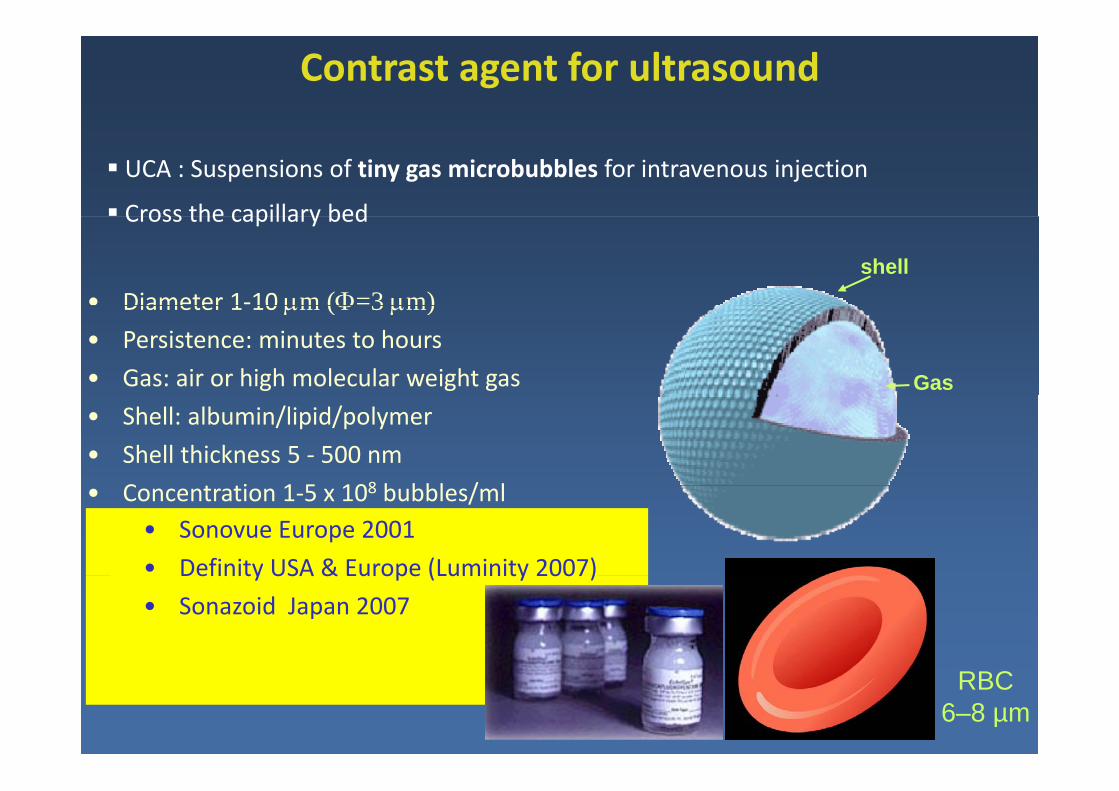
Microbubble – Ultrasound interaction
Linear resonator (harmonic oscillator)Linear resonator (harmonic oscillator)
Incident acoustic pressurePositive pressure
Negative pressure
Bubble size changes with acoustic pressurepressure
0 1 100.1 – 10 μs
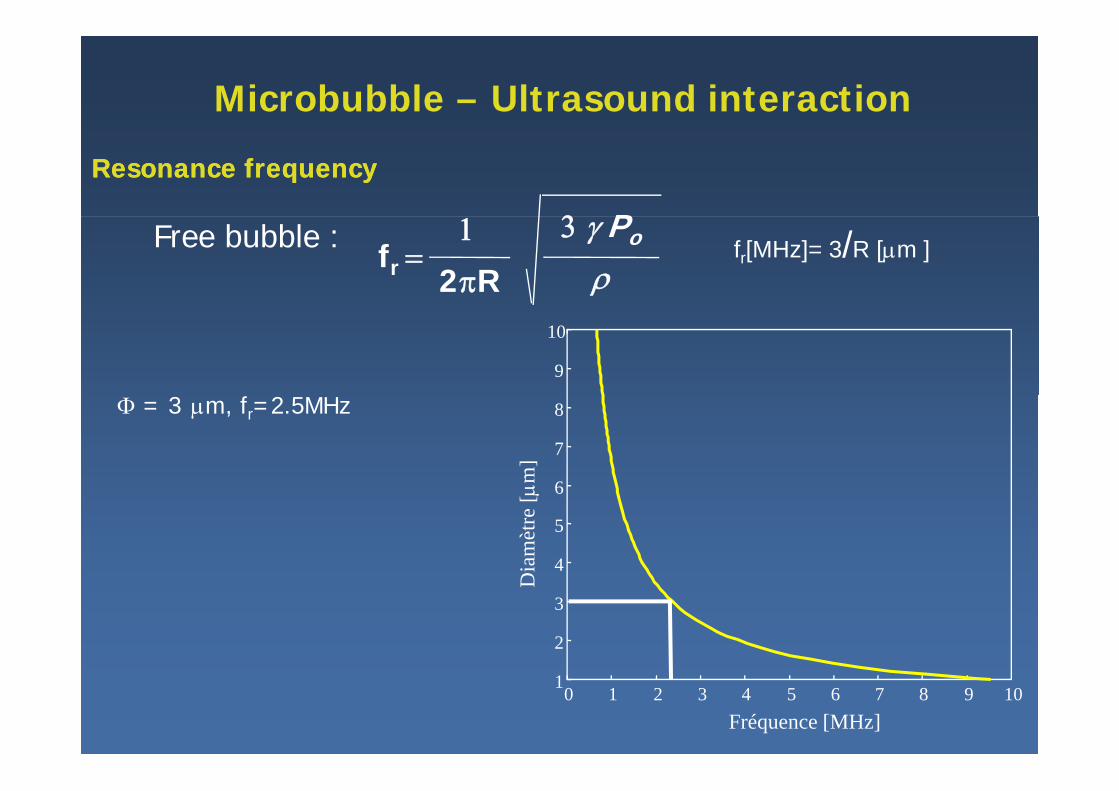
Microbubble – Ultrasound interaction
3 P
Resonance frequencyResonance frequency
fr =1
2πR
3 γ Po
ρFree bubble : fr[MHz]= 3/R [μm ]
9
10
f
μm]
6
7
8Φ = 3 μm, fr=2.5MHz
Dia
mèt
re [μ
4
5
6
D
2
3
0 1 2 3 4 5 6 7 8 9 10Fréquence [MHz]
1
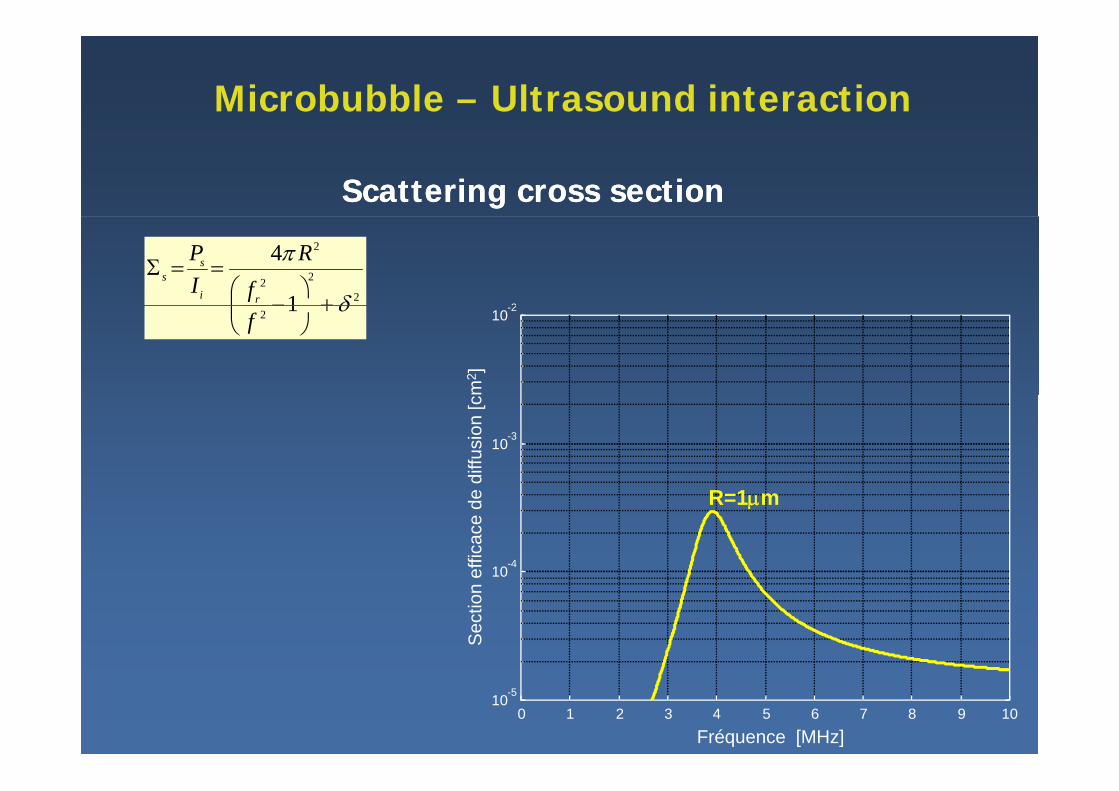
Microbubble – Ultrasound interaction
Scattering cross sectionScattering cross section
22
22
2
1
4
δ
π
+⎟⎟⎞
⎜⎜⎛
−
==Σf
RIP
ri
ss
10-2
m2 ]
2 1 δ+⎟⎟⎠
⎜⎜⎝ f
10-3
diffu
sion
[c
10-4effic
ace
de
R=1μm
10
Sec
tion
e
0 1 2 3 4 5 6 7 8 9 1010-5
Fréquence [MHz]
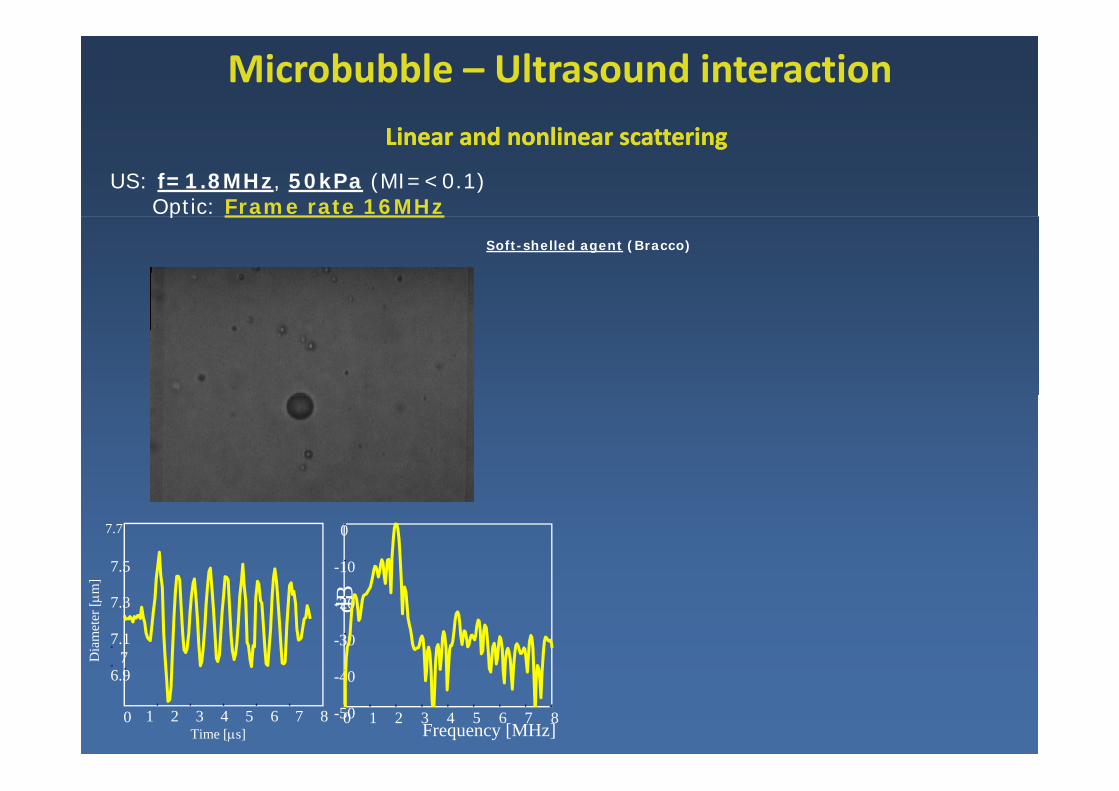
Microbubble – Ultrasound interaction
US: f=1.8MHz, 50kPa (MI=<0.1)Optic: Frame rate 16MHz
Linear and nonlinear scatteringLinear and nonlinear scattering
Soft-shelled agent (Bracco)
p
-10
0
7.5
7.7
dB
-30
-20
77.1
7.3
Dia
met
er [μ
m]
Frequency [MHz]0 1 2 3 4 5 6 7 8-50
-40
0
6.9
1 2 3 4 5 6 7 8Time [μs]

Microbubble – Ultrasound interaction
US: f=1.8MHz, 50kPa (MI=<0.1)Optic: Frame rate 16MHz
US: f=1MHz, 200kPaOptic: Frame rate 16MHz
Linear and nonlinear scatteringLinear and nonlinear scattering
Soft-shelled agent (Bracco)
p Optic: Frame rate 16MHz
4 5
5
10
0fondamentale
d
Harmonic Imaging
3.5
4
4.5
Dia
met
er [μ
m]
-30
-20
-10
dB
2nd H3rd HH
0 1 2 3 4 5 6 7 82.5
3
D
Time [μs]0 1 2 3 4 5 6-50
-40
Frequency [MHz]

Microbubble – Ultrasound interaction
MicrobubbleMicrobubble destruction (Triggered intermittent imaging)destruction (Triggered intermittent imaging)
PB127 (POINT Biomedical CA USA) Hard shelled agent
MI=1.3, f=1.7MHzOptic frame rate≈15Mfps
1st US pulse
PB127 (POINT Biomedical, CA, USA) Hard shelled agent
2nd US pulse (100ms later)
Ultrasound and Ultrasound and microbubblesmicrobubbles
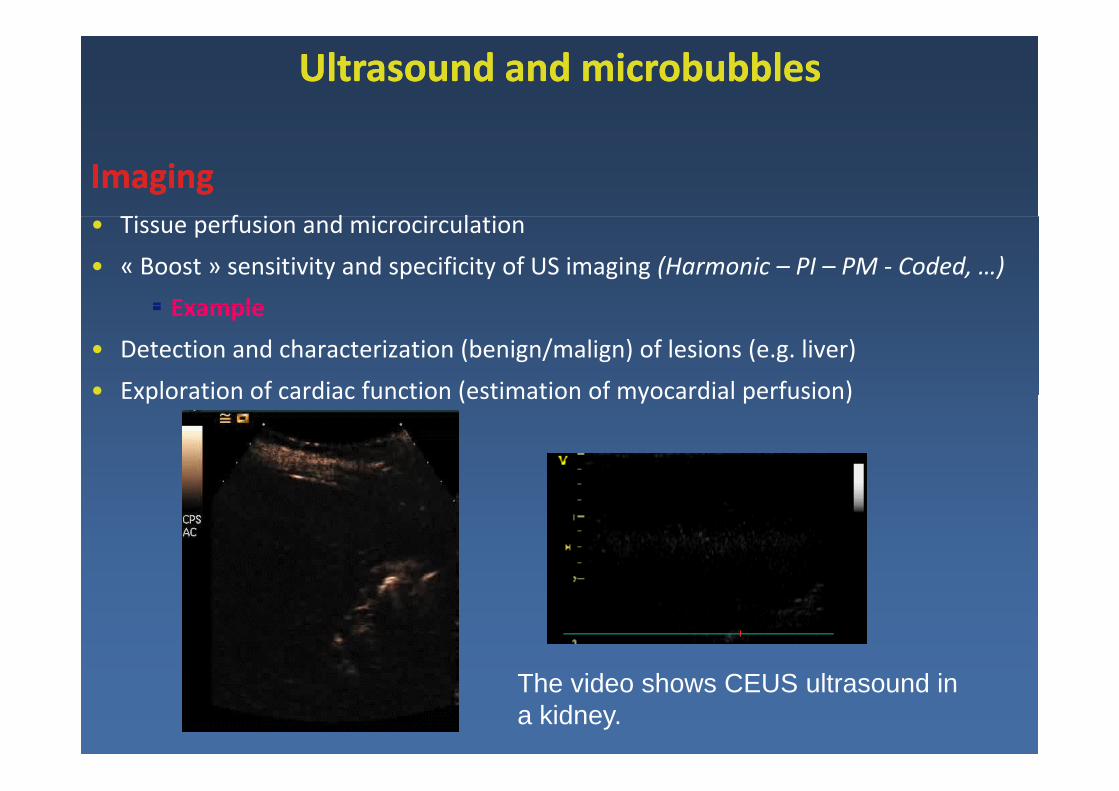
ImagingImagingi f i d i i l i• Tissue perfusion and microcirculation
• « Boost » sensitivity and specificity of US imaging (Harmonic – PI – PM ‐ Coded, …)
ExampleExample
• Detection and characterization (benign/malign) of lesions (e.g. liver)
• Exploration of cardiac function (estimation of myocardial perfusion)Exploration of cardiac function (estimation of myocardial perfusion)
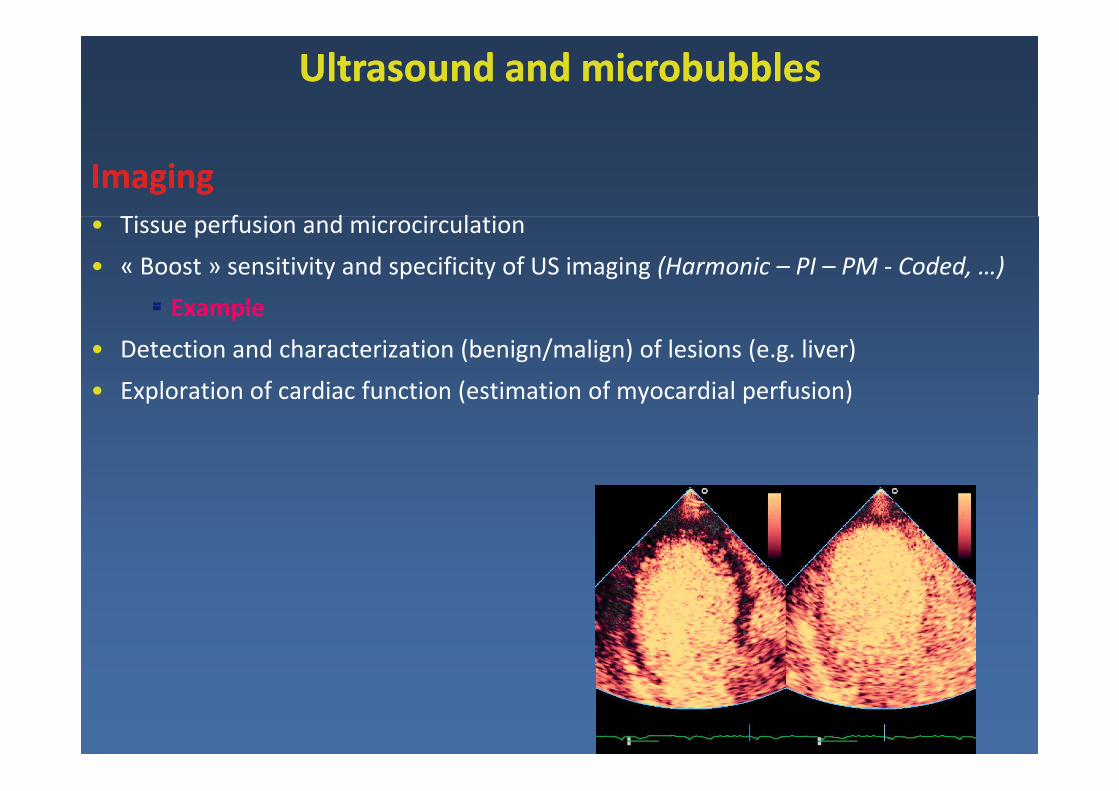
Ultrasound and Ultrasound and microbubblesmicrobubbles
ImagingImagingi f i d i i l i• Tissue perfusion and microcirculation
• « Boost » sensitivity and specificity of US imaging (Harmonic – PI – PM ‐ Coded, …)
ExampleExample
• Detection and characterization (benign/malign) of lesions (e.g. liver)
• Exploration of cardiac function (estimation of myocardial perfusion)Exploration of cardiac function (estimation of myocardial perfusion)
The video shows CEUS ultrasound in a kidney.
Ultrasound and Ultrasound and microbubblesmicrobubbles
ImagingImagingi f i d i i l i• Tissue perfusion and microcirculation
• « Boost » sensitivity and specificity of US imaging (Harmonic – PI – PM ‐ Coded, …)
ExampleExample
• Detection and characterization (benign/malign) of lesions (e.g. liver)
• Exploration of cardiac function (estimation of myocardial perfusion)Exploration of cardiac function (estimation of myocardial perfusion)
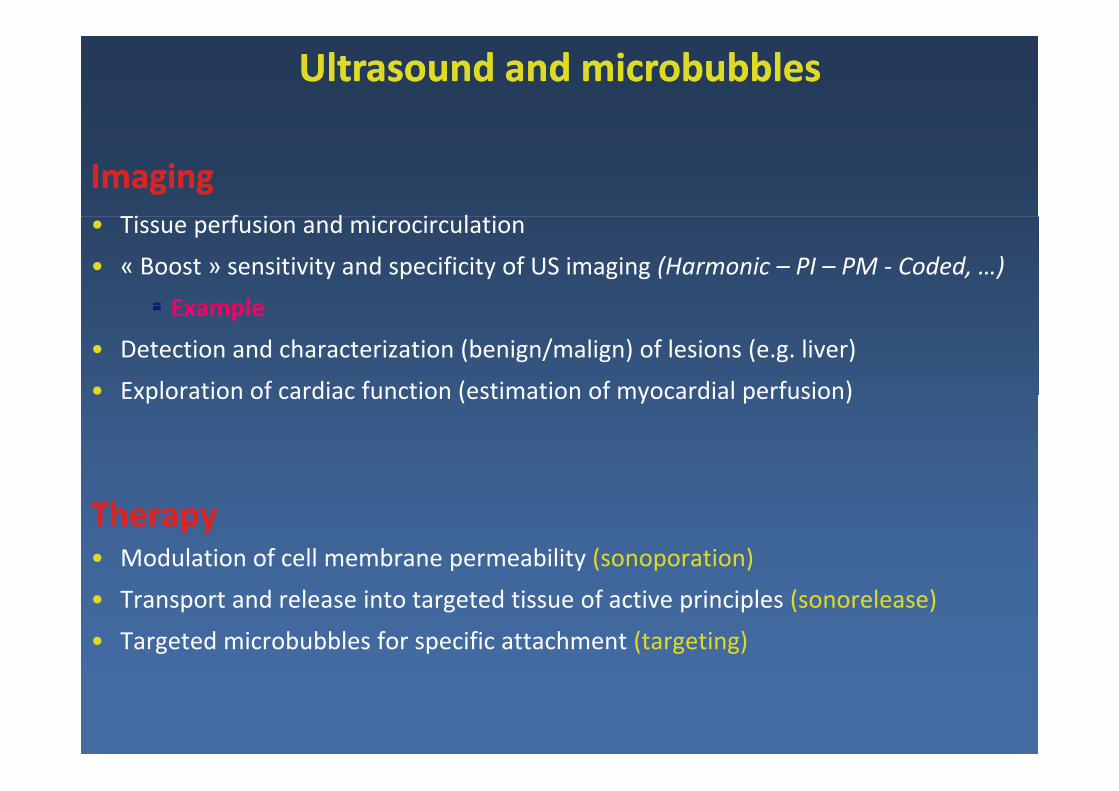
TherapyTherapy• Modulation of cell membrane permeability (sonoporation)
• Transport and release into targeted tissue of active principles (sonorelease)
• Targeted microbubbles for specific attachment (targeting)

Sonoporation
• Ultrasound creates transient permeabilization of cell membrane
in the presence of gas microbubbles

Sonoporation: In vitro
•• Experimental setExperimental set upup•• Experimental setExperimental set‐‐upup
Transducer Water (37°C)
5.105 cells
+ microbubbles+ microbubbles
DNADNA+ pDNA+ pDNAFocal distance
Magnetic stirrer
AmplifierWaveform generator

Confocal Fluorescent microscopy: In‐vitro
Transfection: Cy3Cy3-labelled DNA encoding for eGFPeGFPObservation T6H
Transmission eGFPExc laser: 488 nm en mode META, Obj x63, coupe optique de 0.8 µm d’épaisseur
%)
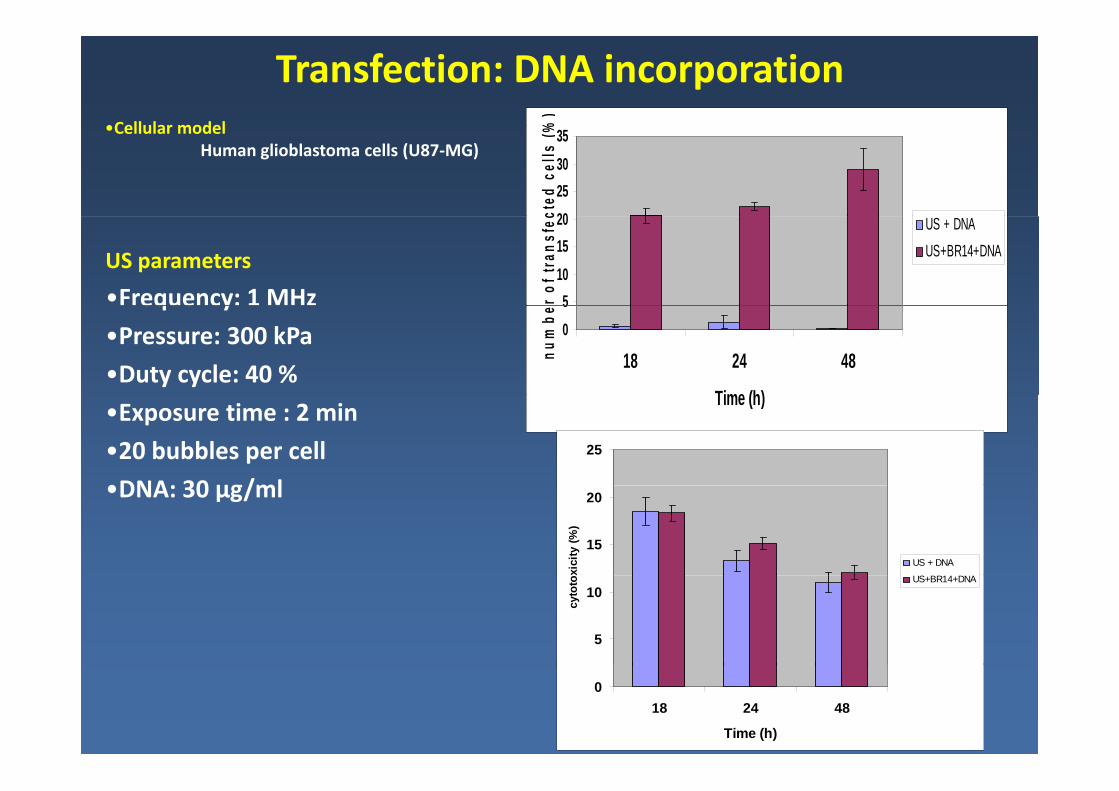
Transfection: DNA incorporation•Cellular model
20253035
cted
cel
ls (%•Cellular model
Human glioblastoma cells (U87‐MG)
5101520
r of
tran
sfec US + DNA
US+BR14+DNAUS parameters
•Frequency: 1 MHz05
18 24 48
Time (h)
num
be
eque cy:
•Pressure: 300 kPa
•Duty cycle: 40 % Time (h)
•Exposure time : 2 min
•20 bubbles per cell
•DNA: 30 μg/ml
25
•DNA: 30 μg/ml
15
20
xici
ty (%
)US + DNA
5
10cy
toto
xUS+BR14+DNA
018 24 48
Time (h)
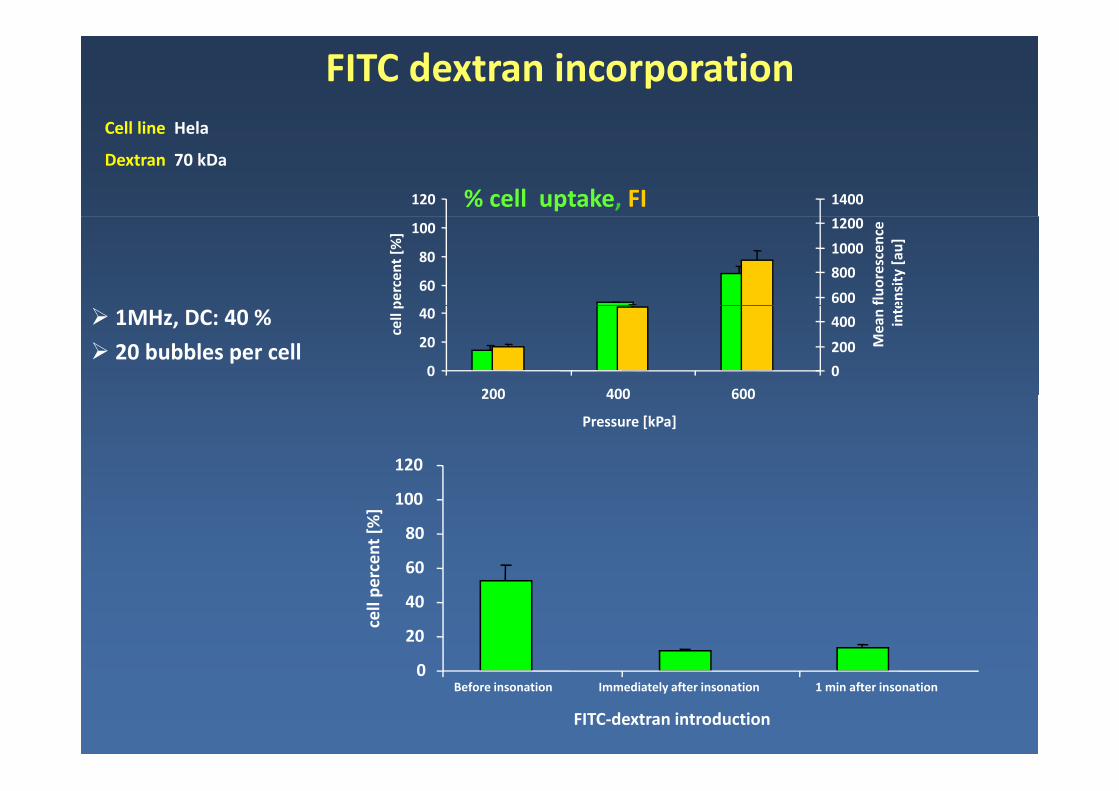
FITC dextran incorporationCell line Hela
% cell uptake, FI120 1400
Cell line Hela
Dextran 70 kDa
60
80
100
percen
t [%
]
600
800
1000
1200
fluorescence
ensity [a
u]
1MHz, DC: 40 %
20 bubbles per cell0
20
40
200 400 600cell p
0
200
400
Mean inte
200 400 600
Pressure [kPa]
120
60
80
100
rcen
t [%]
0
20
40
cell pe
r
FITC‐dextran introduction
0Before insonation Immediately after insonation 1 min after insonation
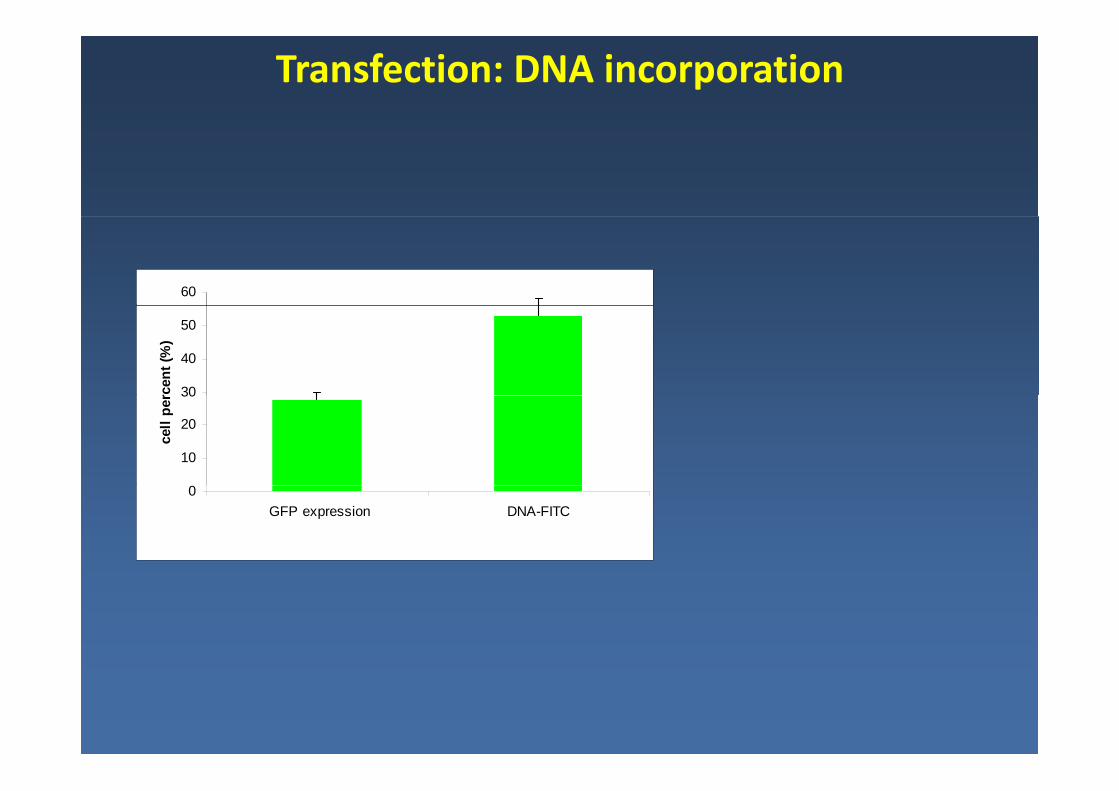
Transfection: DNA incorporation
60
30
40
50
rcen
t (%
)
10
20
30
cell
per
0 GFP expression DNA-FITC
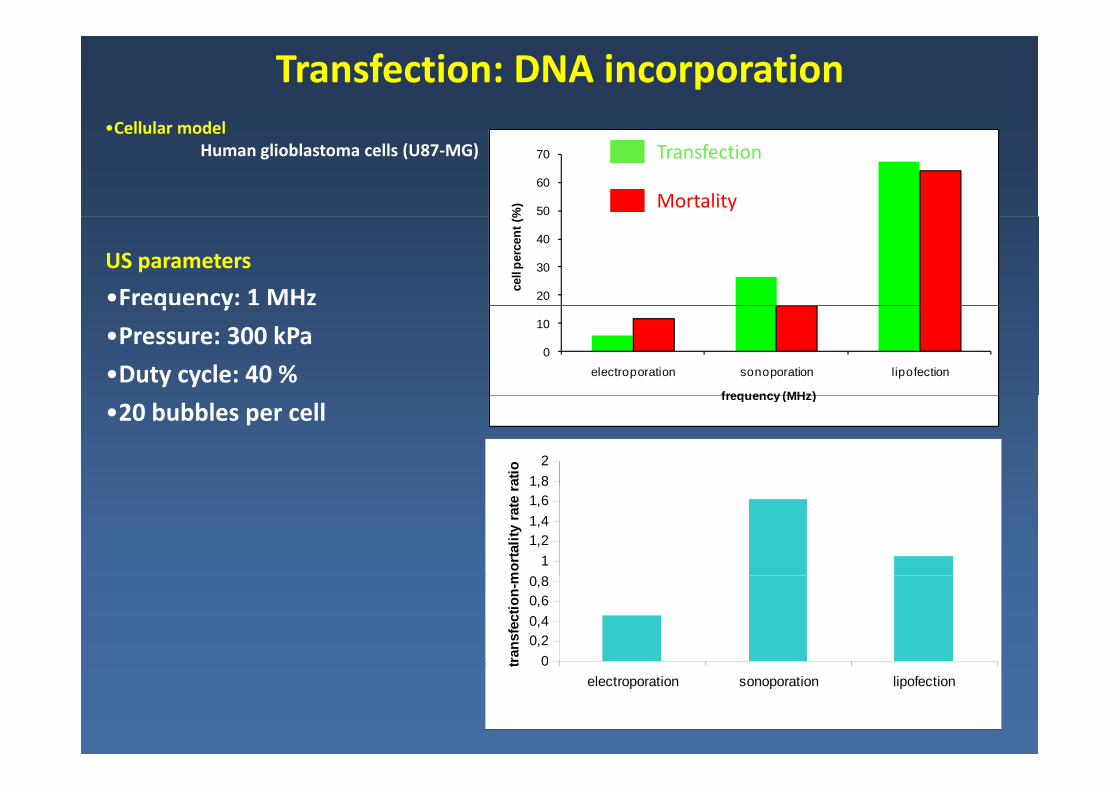
Transfection: DNA incorporation•Cellular model
50
60
70
%)
•Cellular modelHuman glioblastoma cells (U87‐MG) Transfection
Mortality
20
30
40
cell
perc
ent (
%
US parameters
•Frequency: 1 MHz
0
10
electroporation sonoporation lipofection
frequency (MHz)
eque cy:
•Pressure: 300 kPa
•Duty cycle: 40 % frequency (MHz)
1,82
atio
•20 bubbles per cell
11,21,41,61,8
mor
talit
y ra
te r
a
00,20,40,60,8
tran
sfec
tion-
m
0electroporation sonoporation lipofection
t
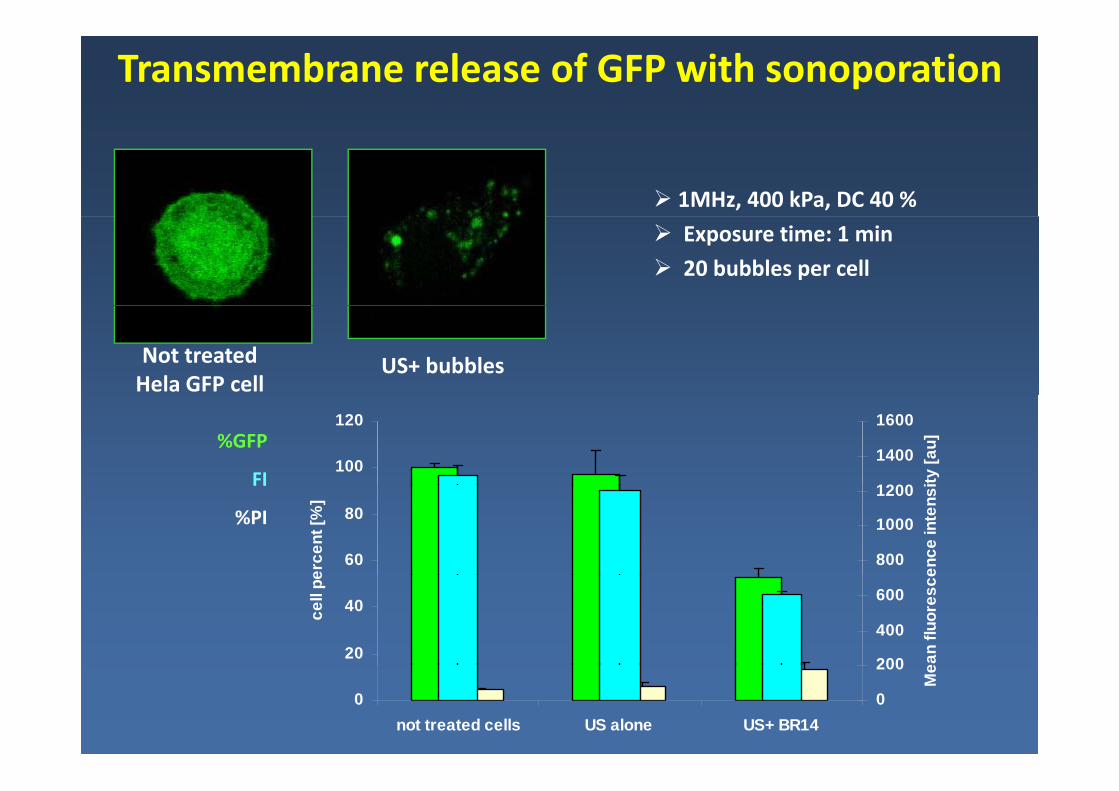
Transmembrane release of GFP with sonoporation
1MHz, 400 kPa, DC 40 %
Exposure time: 1 min
20 bubbles per cell
Not treatedHela GFP cell
US+ bubbles
%GFP
FI100
120
1200
1400
1600
ity [a
u]
FI
%PI
60
80
erce
nt [%
]
800
1000
1200
ence
inte
nsi
20
40cell
pe
200
400
600
ean
fluor
esce
0not treated cells US alone US+ BR14
0
200
Me

GFP recoveryGFP recovery
GFP %, FI120
1200
1400
e
Frequency: 1MHz
k60
80
100
P cell %
600800
1000
1200
luorescence
nsity [aU]
Pressure: 400 kPa
Duty cycle: 75 %
Exposure time: 2 min 0
20
40GFP
0
200
400
600
Mean f
inten
Nbr of bubbles per cell: 200
control T0 T4 T48TIme [hr]
0
152025
I %
PI %
120
140160
x vs
cont
rol
120
140160
x vs
cont
rol
05
10PI
2040
6080
100
olife
ratio
nin
dex
2040
6080
100
olife
ratio
nin
dex
control T0 T4H T48HTIme [hr]
020
Control US US+BR14
Pro
020
Control US US+BR14
Pro

In‐vivoIntramuscular transfectionf
Mouse (8w)Plasmid lucifirase
25000
Polymer/DNA complexesInjection: interior tibial muscle
20000
otei
n)
US1=400kPa, DC=40%
15000
(cps
/mg
pro
US2=500kPa, DC=40%US3=400kPa, DC=20%
US 00 a, C 0%
10000
ase
activ
ity (
5000
Luci
fera
0CTRL BR14+US1 BR14+US2 BR14+US3

ULTRASOUND ULTRASOUND ‐‐MICROBUBBLE MICROBUBBLE ‐‐ CELL INTERACTION CELL INTERACTION Optical observationsOptical observations
“Cellular Massage”“Cellular Massage”
Jet speeds V> 100’s m/s
http://www.scs.uiuc.edu
ll f dUS=0.5MHz, MI=0.9, Frame rate≈3Mfps
BR14
10 million frames per second
SonoVueTM, endothelial cell 1 burst 1 MHz Ultrasound MI 0.9
V<100m/s
Brandaris EMC Rotterdama b

Patch clamp technique“Whole cell” configuration
Seal Patch
Whole cell configuration
Em recordings- Seal - Patch - Em recordings
- A glass pipette gently pressed on the cell membrane (few microns)Electrical access « Seal » between the glass pipette and the membrane- Electrical access « Seal » between the glass pipette and the membrane
- Suction is applied to the pipette - Membrane breaks
C l d i l i i
- Measurement of cell membrane potential
- Cytoplasm and pipette solution mix up- Control of the intracellular medium
Measurement of cell membrane potential- Estimation of ion exchange through the cell membrane

ULTRASOUND ULTRASOUND ‐‐MICROBUBBLE MICROBUBBLE ‐‐ CELL INTERACTION CELL INTERACTION
Cell membrane potential
US alone US and Sonovue
iel [mV]
ne potent
Mem
bran
US=1MHz, 200kPa US 150kPa US 200kPa
Hyperpolarization of the cell membraneyp p

ULTRASOUND ULTRASOUND ‐‐MICROBUBBLE MICROBUBBLE ‐‐ CELL INTERACTION CELL INTERACTION
Cell membrane potential
US 0.2MPa, 1MHz

ULTRASOUND ULTRASOUND ‐‐MICROBUBBLE MICROBUBBLE ‐‐ CELL INTERACTION CELL INTERACTION
Cell membrane potential
US 0.2MPa, 1MHz

ULTRASOUND ULTRASOUND ‐‐MICROBUBBLE MICROBUBBLE ‐‐ CELL INTERACTION CELL INTERACTION
Cell membrane potential
US 0.2MPa, 1MHz
‐ Hyperpolarization: ‐ amplitude: 25 ± 1,4 mV (n=16)‐ function of the bubble‐cell adherence‐ function of ultrasound parameters
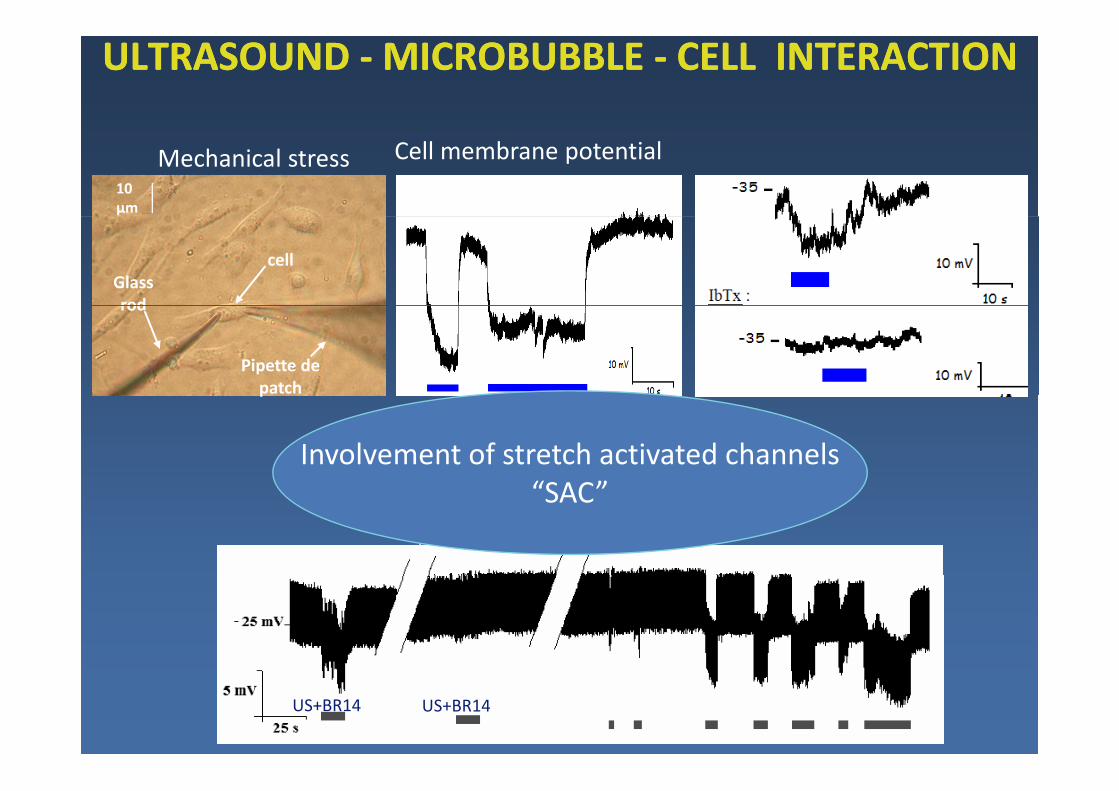
ULTRASOUND ULTRASOUND ‐‐MICROBUBBLE MICROBUBBLE ‐‐ CELL INTERACTION CELL INTERACTION
Mechanical stress10 μm
Cell membrane potential
Glass rod
cell
Pipette de patch
rod
p
Involvement of stretch activated channels“SAC”IbTx PSS 2PSS 1 “SAC”
US
US+BR14 US+BR14
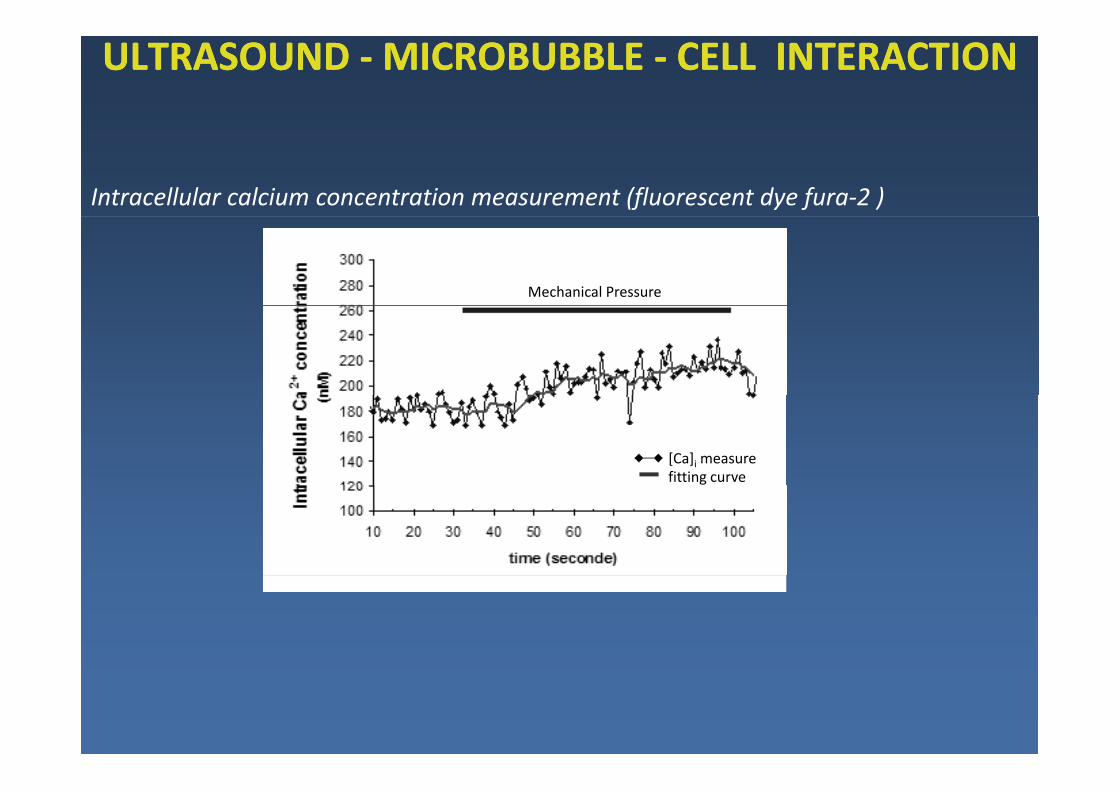
ULTRASOUND ULTRASOUND ‐‐MICROBUBBLE MICROBUBBLE ‐‐ CELL INTERACTION CELL INTERACTION
Intracellular calcium concentration measurement (fluorescent dye fura‐2 )
Mechanical Pressure
[Ca]i measurefitting curve
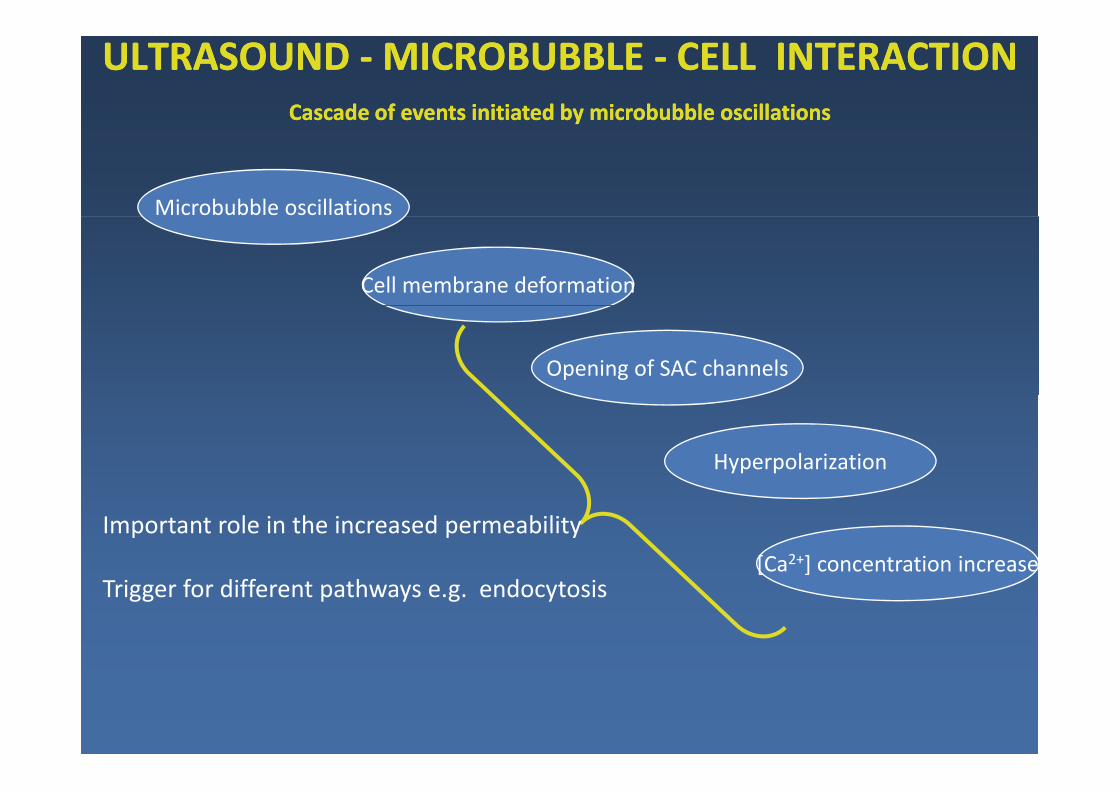
Cascade of events initiated by microbubble oscillationsCascade of events initiated by microbubble oscillations
ULTRASOUND ULTRASOUND ‐‐MICROBUBBLE MICROBUBBLE ‐‐ CELL INTERACTION CELL INTERACTION
Microbubble oscillations
Cell membrane deformation
Opening of SAC channels
Hyperpolarization
[Ca2+] concentration increase
Important role in the increased permeability
Trigger for different pathways e.g. endocytosis
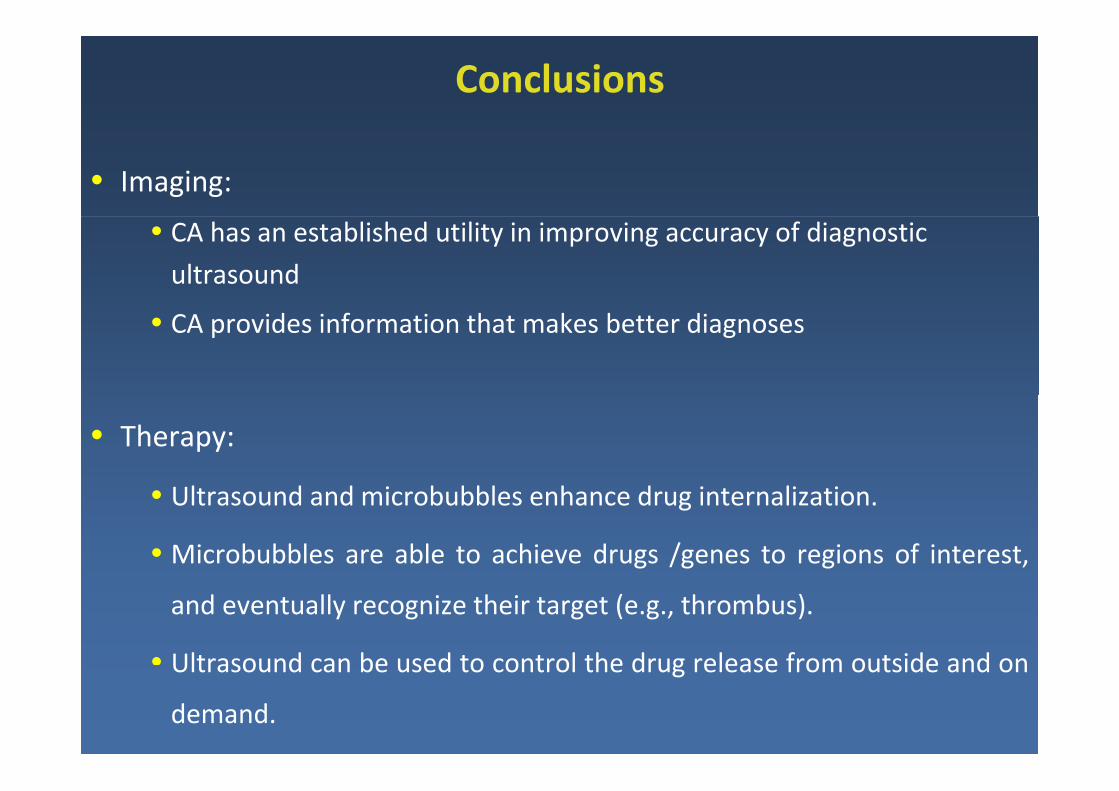
Conclusions
• Imaging:
• CA has an established utility in improving accuracy of diagnostic
ultrasound
• CA provides information that makes better diagnoses
• Therapy:
• Ultrasound and microbubbles enhance drug internalization.
• Microbubbles are able to achieve drugs /genes to regions of interest,
and eventually recognize their target (e.g., thrombus).
• Ultrasound can be used to control the drug release from outside and onUltrasound can be used to control the drug release from outside and on
demand.
Acknowledgments
• K Kaddur MSc (PhD program) (Biologist) • Prof C Pichon CBM Orléans
Research team:
• K. Kaddur, MSc (PhD program), (Biologist)
• T. Tran, MSc (PhD program), (Biologist)
• Dr. P. Palanchon, PhD (PostDoc)
• Prof. C. Pichon CBM Orléans
• A. Delalande, MSc (PhD program)
• Dr. P. Midoux, CBM OrléansDr. P. Palanchon, PhD (PostDoc)
• A. Novell, MSc (PhD program)
• Prof. F. Tranquart, MD – PhD
Dr. P. Midoux, CBM Orléans
• Dr. B. Pitard, Inserm Nantes
Financial support