Embed Size (px)
Citation preview

Ultrasonic spectroscopy of complex media
J. H. Page
Department of Physics and Astronomy
University of Manitoba
Winnipeg, MB Canada R3T 2N2
Summary. — Mesoscopic wave physics underpins many of the new developmentsin ultrasonic spectroscopy for probing the physical properties of complex heteroge-neous materials. In this paper, two examples of recent progress are summarized.The first is Diffusing Acoustic Wave Spectroscopy (DAWS), which is a powerfulapproach for investigating the dynamics of strongly scattering media, one examplebeing velocity fluctuations in fluidized suspensions of particles. Recent advances inusing phase statistics to probe the particle dynamics are shown to give increasedsensitivity in some situations; this work has also led to new insights into the mean-ing of phase for multiply scattered waves. The second topic is the spectroscopy ofsoft food biomaterials, illustrated by experimental studies of ultrasonic velocity andattenuation in bread dough. Since wheat flour dough contains one of the strongestscatterers of ultrasonic waves (bubbles) dispersed in a viscoelastic matrix that is alsovery dissipative, appropriate ultrasonic techniques provide an excellent means forinvestigating its structure and dynamics. In addition to fundamental studies, unrav-eling the contributions of bubbles and matrix to dough properties is relevant to thebaking industry, because the bubbles ultimately grow into the voids that determinethe structural integrity of bread – an important quality attribute. The interpreta-tion of ultrasonic experiments on bread dough over three decades in frequency isgiving new insights into this complex material, as well as providing the basis fornew non-destructive methods of evaluating both dough processing behaviour andthe breadmaking potential of different flours.
c© Societa Italiana di Fisica 1

2 J. H. Page
1. – Introduction
The fundamental studies of ultrasonic wave transport in strongly scattering randommedia, described in refs. [1, 2, 3, 4, 5], have facilitated the development of ultrasonictechniques for probing the physical properties of complex materials. Many such materi-als are mesoscopic, with internal structures on length scales comparable with ultrasonicwavelengths, and it is the structure and dynamics at this mesoscopic scale that determinetheir macroscopic physical properties. Familiar examples include foams, gels, slurries anda wide range of food biomaterials, all of which are playing an increasing important role inindustrial applications, and hence our prosperity. Mesoscopic structure, however, oftenleads to multiple scattering of ultrasound, making traditional imaging methods impos-sible and motivating the development and application of new approaches for extractinguseful information.
This paper reviews two examples of ultrasonic spectroscopy and their application tonovel materials characterization methods. The next section outlines Diffusing AcousticWave Spectroscopy (DAWS), a powerful technique in field fluctuation spectroscopy forinvestigating the dynamics of strongly scattering media. Differences with the comple-mentary technique of Diffusing Optical Wave Spectroscopy are discussed, highlightingthe advantages of DAWS in some contexts. DAWS is illustrated with experiments onsuspensions of particles and bubbles. Recent progress in probing dynamic propertiesusing the phase of multiply scattered waves, which can readily be measured for ultra-sound but less easily for light, is summarized. Diffusing Acoustic Wave Spectroscopy,introduced in 2000 [6] and described in detail in ref. [7], has also been reviewed in ref. [8],and more recently in a broader context in Physics Today [9]. The interested reader isencouraged to consult these references for additional information.
Section 3 illustrates the characterization of food materials using ultrasound. Manyfood materials are both strongly scattering and strongly absorbing for ultrasound, andin cases where the multiple scattering coda is suppressed by dissipation, it is not feasibleto use techniques such as DAWS to probe their evolution during processing. Nonethelessinformation on the mechanical properties of foods is important in the preparation andproduction of foods with appealing texture, which is crucial for making foods palatableto eat. This information can be obtained from spectroscopic techniques that rely onballistic propagation, and are especially valuable when data over a wide range of ultra-sonic frequencies are available. This approach is illustrated with experiments on breaddough [10, 11, 12, 13, 14, 15, 16, 17, 18, 19], where processing challenges encounteredwhen incorporating nutritional supplements may make ultrasonic monitoring techniquesof particular value to the functional foods industry.
(∗) Published in the Proceedings of the International School of Physics Enrico Fermi,Course CLXXIII, “Nano Optics and Atomics: Transport of Light and MatterWaves”, edited by R. Kaiser, D.S. Weirsma and L. Fallani (IOS, Amsterdam; SIF,Bologna, 2011) pp. 115-131. The original publication is available from SIF athttp://www.sif.it/SIF/en/portal/books/series/rendiconti fermi.

Ultrasonic spectroscopy of complex media 3
2. – Diffusing Acoustic Wave Spectroscopy
Diffusing Acoustic Wave Spectroscopy (DAWS) determines the dynamics of a stronglyscattering medium from the temporal fluctuations of ultrasonic waves that are scatteredmany times before leaving the medium [6, 7]. Because multiply scattered waves are used,the technique is extremely sensitive to the motion of the scatterers in the medium, or tothe evolution of the properties of the host material in which the scatterers are located;this sensitivity results from the large number of scattering events that are involved, lead-ing to long trajectories over which cumulative changes in the detected waves occur. Asthe name suggests, there is much in common with the analogous technique of DiffusingOptical Wave Spectroscopy (often simply abbreviated DWS) [20, 21], although there aredifferences in the way in which the measurements are made and in the range of appli-cations for which the two techniques are well suited. One advantage of DAWS is thatthe scattered wave field is measured, not the intensity, so that the field correlation func-tion g1(τ) is determined directly. Thus, there is no need to invoke the Siegert relationto interpret measurements of intensity correlation functions using models for the fieldcorrelation functions. Another advantage of detecting the wave field in DAWS is thatthe phase of the scattered fields can be exploited, offering the potential of better sensi-tivity in some cases. The other major technical difference is the ease with which pulsedmeasurements can be performed, enabling the detected changes to be monitored for afixed path length of the multiply scattered waves and therefore simplifying the analysis.Finally, since ultrasonic wavelengths and wave periods are both larger (typically ∼ 1 mmand 1 µs), DAWS is sensitive to dynamics on longer length scales than is possible withlight (or x rays), enabling different types of materials and phenomena to be investigated.By varying the frequency, this range of length scales can be extended significantly, andcan range up to kilometres for seismic applications.
Figure 1 shows two contrasting examples of evolving multiply scattered wave fieldsthat can be used to probe changes in the system under investigation. Figure 1(a) showsa typical experimental setup in DAWS, where a pulsed incident wave from a generatingtransducer propagates through a sample containing moving particles or bubbles (fig. 1(b))and is detected by a hydrophone. A typical multiple scattering path is indicated by thered arrows. Two segments of the transmitted field are shown in fig. 1(c), showing that atearly propagation times, almost no change in the transmitted field is seen, while at latertimes, the wave field changes significantly as the scatterers move. Note that there aretwo relevant times in this problem, the propagation time t of the waves in the medium,which sets the sensitivity, and the evolution time T , which sets the time scale over whichthe dynamics are recorded. In DAWS, the medium can be interrogated repeatedly on ascale set by the pulse repetition time ∆T , which can be varied over a wide range to matchthe rate at which the system is evolving; in this case, T = m∆T , where m is an integer.Figure 1(c) shows that the waves are decorrelated in both amplitude and phase as theevolution time increases, due to the motion of the bubbles in the suspension. Analysisof the detected field fluctuations can be used to probe the velocities of the bubbles.By contrast, the changes in the waveforms shown in fig. 1(d), which were detected on

4 J. H. Page
Ultrasonic
Transducer
Moving bubbles, or
fluidized particles
Hydrophone
Detector
2
Wav
e fi
eld
(ar
bit
rary
un
its)
1 2 3 4 11 12 13 14
-2
-1
0
1
2
-2
-1
0
1
2
Wav
e fi
eld (
arbit
rary
unit
s)
Propagation time, t (µs)
(b)
(a)
(d)
(c)
1.0 1.5 12.0 12.5 13.0
-2
0
Wav
e fi
eld
(ar
bit
rary
un
its)
Propagation time, t (s)
Fig. 1. – (a) Typical setup for measuring the dynamics of fluidized suspensions or bubbles us-ing Diffusing Acoustic Wave Spectroscopy. The red arrows indicate a multiple scatttering paththrough the sample. (b) Photograph of ∼ 20-µm-diameter bubbles generated by an electrolysistechnique. These small bubbles move in complex swirling patterns through water. (c) Two seg-ments of the scattered wave fields transmitted through a fluidized suspension of glass particles,observed at three evolution times separated by 60 ms. The waveforms are very similar at earlypropagation times, but exhibit large fluctuations in both phase and amplitude a later times.(d) Waveforms detected by a seismograph on Mount Merapi, the site of an active volcano inIndonesia, after an air gun was used to generate short low frequency pulses 2 km away. Theevolution time interval between the two recorded signals (red and blue traces) is two weeks. Theshift in the phase of the waves can be most simply measured from a windowed cross correlationfunction of the fields at the two times; this phase shift is related to a small change in the seismicvelocity, as explained in ref. [9].
Mount Merapi by a seismograph located 2 km away from the source, at evolution timesseparated by two weeks, are shifted in propagation time but remain similar otherwise.In this case, there is a uniform change in the medium, and the phase shift is related toa change in the seismic wave speed.
To determine the changes in the medium from the evolution of the scattered wavefields, it is helpful to describe the multiply scattered waves detected at propagation timet and evolution time T as the superposition of waves that have propagated along eachscattering path p. This can be shown explicitly by writing the measured field ψ(t, T ) as

Ultrasonic spectroscopy of complex media 5
the real part of a complex field (the complex analytic signal)
(1) Ψ(t, T ) = A(t, T )ei[ωt+Φ(t,T )] =∑
p
ap(t, T )ei[ωt+φp(t,T )] .
Here ω is the central frequency of the pulse, Φ(t, T ) is the total phase of the scatteredwaves at the detector and φp(t, T ) is the phase along a single multiple scattering path,which may be conveniently called the “path phase”. As the medium evolves in time, thewaves still propagate along these scattering paths, but the path lengths change, so that ψ
is a function of both propagation time t and evolution time T . One direct way of relatingthe changes in ψ(t, T ) to the dynamics of the medium is to take the autocorrelationfunction of the field at a fixed propagation time ts, thereby selecting multiple scatteringpaths with an average length s = ts/vE and a narrow path length range determined bythe source pulse width. The field autocorrelation function g1,ts(τ) is
(2) g1,ts (τ) =∫
ψ (T ) ψ (T + τ) dT∫ |ψ (T )|2dT'
⟨e−i ∆φp(τ)
⟩,
where ∆φp (τ) is the change in phase of a path containing n scattering events during theevolution time interval τ . Here n = vEts/l∗, where vE and l∗ are the transport velocityand mean free path of the multiply scattered waves. In general, the phase change for eachpath can be written as the sum of the ensemble average phase shift 〈∆φpath (τ)〉 and thedeviation from the average value δφpath (τ), enabling the autocorrelation function (2) tobe written as a product of two factors, involving the average phase shift and its variancerespectively:
(3) g1,ts (τ) ' cos (〈∆φpath (τ)〉) exp(−1
2⟨δφ2
path (τ)⟩)
.
To obtain this result, the contribution to g1 from the ensemble average of⟨e−i δφpath(τ)
⟩is obtained to leading order using a cumulant expansion [6, 7, 8], and the real part of g1
is taken, since this corresponds to the experimental situation.A nonzero average phase shift arises when there is a uniform dilation of the medium
seen by the waves, such as can occur if there is a change in wave velocity, which shifts thearrival time of all the scattered waves in the same way (e.g., see fig. 1(d)). In the case ofa small wave velocity change ∆v, 〈∆φ〉 = −ωt∆v/v, where ω is the angular frequency.
When the scatterers are moving, such as for the example of moving bubbles infig. 1(b),(c), the dominant contribution to the decay of g1 comes from the path phasevariance
⟨δφ2
path
⟩. In this case, the path phase variance can be related to the phase
fluctuations for each step j along a path, which are given by ~kj ·∆~rrel,j where ~kj is thewave vector of the wave scattered between the jth to the (j + 1)th scatterers, and ∆~rrel,j
is their relative displacement [6, 7, 8]. When the successive phase shifts along the paths,

6 J. H. Page
as well as the directions of ~kj and ∆~rrel,j , are uncorrelated, the field autocorrelationfunction is given by
(4) g1,ts (τ) ≈ exp[−nk2
6⟨∆r2
rel (τ, l∗)
⟩].
(Here the average phase shift in eq. 3 has been set to zero, as is observed for fluidizedparticles; then,
⟨δφ2
path
⟩=
⟨∆φ2
path
⟩). This equation shows that the decay of the corre-
lation function is determined by the relative mean square displacement of the scatterersthat are separated, on average, by the average step length of the multiply scatteredwaves, l∗. Measuring the field autocorrelation function thus enables the relative motionof the scatterers to be determined on a length scale that can be tuned by the ultrasonicfrequency.
Typical DAWS results for the dynamics of fluidized particles, suspended by flowingthe liquid upwards to counteract sedimentation, are shown in fig. 2. In this example,the scatterers are 1-mm-diameter glass spheres surrounded by a liquid mixture of waterand glycerol. At short evolution times, the motion of the particles is ballistic sincethe relative mean square displacement grows quadratically with time,
⟨∆r2
rel (τ, l∗)
⟩=⟨
∆V 2rel (l
∗)⟩τ2, allowing the variance in the relative particle velocities to be measured
directly from the slope of⟨∆r2
rel (τ, l∗)
⟩versus τ2. The root mean square relative velocity
∆Vrel =√〈∆V 2
rel〉 determines the characteristic time scale of the motion, τDAWS ≡1/[√
nk∆Vrel(l∗)], so that, with this definition, the field autocorrelation function can bewritten in a very simple way as g1(τ) = exp[− 1
6τ2/τDAWS].By varying the frequency, the scattering strength and hence also l∗ was varied (see, for
example, ref. [1]), enabling the relative particle velocity to be measured over a wide rangeof inter-particle distances R = l∗ inside the suspension. Figure 2(b) shows that at shortdistances, the relative particle velocity increases as the square root of distance, but that atlonger distances it levels off to the value
√2Vrms, where Vrms is the absolute rms particle
velocity that can be measured directly in the single scattering regime using DynamicSound Scattering [6]. The saturation value
√2Vrms is the relative velocity of particles
that move independently, indicating that all correlations in the motions become lost atlarge inter-particle separations. These observations can be summarized mathematicallyas follows:
(5)
⟨∆V 2
rel (l∗)⟩
=⟨(
∆~V (~r + l∗)−∆~V (~r))2
⟩
= 2⟨∆V 2
⟩− 2⟨∆~V (~r + l∗) ·∆~V (~r)
⟩
= 2 V 2rms (1− CV (l∗))
where
(6) CV (R) =
⟨∆~V
(~r + ~R
)·∆~V (~r)
⟩
〈∆V 2〉 = exp[−R/ξ]

Ultrasonic spectroscopy of complex media 7
1.0
rms
(a) (b)
(c)
1E-3
0.01
0.1 τ 2
r rel2
> (
mm
2 )
1 10 100 200
1
2
3
45
~ξ2
1/2 V
rms / V
f
φvf = 0.14
φvf = 0.39
∆Vre
l / V
f
l* / a
0.0 0.5 1.0 1.5 2.00.0
0.2
0.4
0.6
0.8
<∆V
(R)
∆V(0
)> /
V 2
rms
R / ξ
(c)
0.01 0.11E-6
1E-5
1E-4
L = 7.76 mm: L = 12.2 mm
φvf = 0.19
φvf = 0.30
φvf = 0.40
φvf = 0.50
<∆
r
Time (s)
Fig. 2. – (a) Mean square relative displacement of glass beads in a fluidized suspension measuredby Diffusing Acoustic Wave Spectroscopy. The data are plotted for several volume fractions ofbeads φvf , showing τ2 behaviour indicative of ballistic particle motion at short times. (b)Root mean square relative velocity, divided by the fluidization velocity Vf , as a function of theultrasound transport mean free path l∗ normalized by the bead radius a. The mean free pathl∗ determines the average particle separation at which the velocity fluctuations are measured.The solid curves are fits of eq. 5, with CV given by eq. 6, to the data for two volume fractions,enabling the particle velocity correlation length ξ to be measured at each volume fraction. (c)The particle velocity correlation function as a function of the average inter-particle separationsR = l∗ at which the relative velocities are measured. The data show a good fit to the exponentialfunction exp (−R/ξ), confirming the form of the correlation function that was assumed in (b).The different symbols represent data measured at different volume fractions of scatterers, withall the data collapsing onto a common curve when CV is plotted as a function of R/ξ.
is the particle velocity correlation function, whose decay rate is determined by the veloc-ity correlation length ξ. Equations 5-6 show how particle velocity correlation function canbe determined from the relative velocity fluctuations measured in DAWS experiments,yielding the experimental results shown in fig. 2(c). The data in figs. 2(b) and (c) showthat the assumed exponential decay of the velocity correlations with distance is consistentwith observations, and enable the correlation length to be measured over a wide range ofparticle concentrations (with φvf varying from 0.08 to 0.50 in this case). The correlationlength ξ measures the range of distances over which the particles move together, and
8 J. H. Page
0.00
0.05
0.10
0.15
0.20(d)
τ = 1 s
τ = 2 s
10-3
10-2
10-1
100
101
(c)
τ = 20 ms
0.01
0.1
1
(b)
P(∆
Φ)
τ = 100 ms
10-5
10-4
10-3
10-2
10-1
100
101
102
(a)
τ = 2 ms
10-7
10-6
10-5
10-4
10-3
10-2
.002 0.01 0.020.0110
-7
10-6
10-5
<
∆rre
l2( τ
)> (
mm
2 )
10-4
10-3
10-2
10-1
100
101
from fits to P(∆Φ)
from <∆Φ2>
from g1
~ τ 2
< ∆φ
path
2 >
(rad2)
(e)
-3 -2 -1 0 1 2 30.00
∆Φ (rad)
-3 -2 -1 0 1 2 30.01
10
-310
-210
-110
010
-7
τ (s)
10
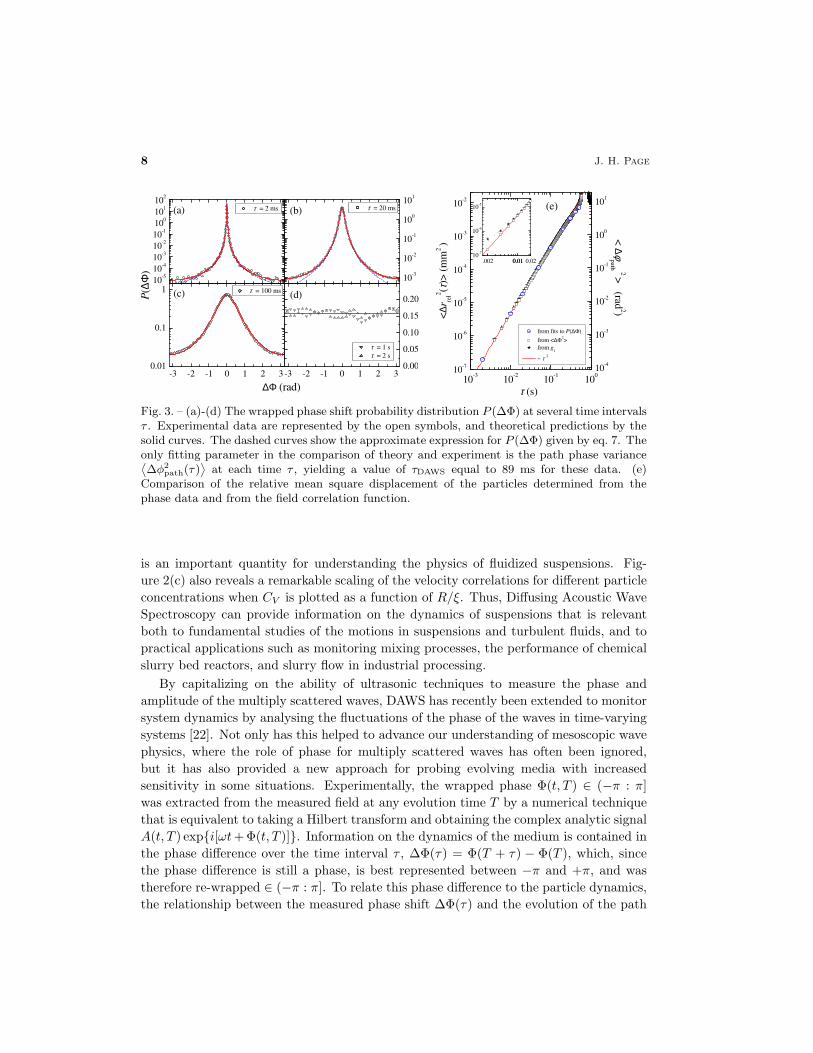
Fig. 3. – (a)-(d) The wrapped phase shift probability distribution P (∆Φ) at several time intervalsτ . Experimental data are represented by the open symbols, and theoretical predictions by thesolid curves. The dashed curves show the approximate expression for P (∆Φ) given by eq. 7. Theonly fitting parameter in the comparison of theory and experiment is the path phase variance⟨∆φ2
path(τ)⟩
at each time τ , yielding a value of τDAWS equal to 89 ms for these data. (e)Comparison of the relative mean square displacement of the particles determined from thephase data and from the field correlation function.
is an important quantity for understanding the physics of fluidized suspensions. Fig-ure 2(c) also reveals a remarkable scaling of the velocity correlations for different particleconcentrations when CV is plotted as a function of R/ξ. Thus, Diffusing Acoustic WaveSpectroscopy can provide information on the dynamics of suspensions that is relevantboth to fundamental studies of the motions in suspensions and turbulent fluids, and topractical applications such as monitoring mixing processes, the performance of chemicalslurry bed reactors, and slurry flow in industrial processing.
By capitalizing on the ability of ultrasonic techniques to measure the phase andamplitude of the multiply scattered waves, DAWS has recently been extended to monitorsystem dynamics by analysing the fluctuations of the phase of the waves in time-varyingsystems [22]. Not only has this helped to advance our understanding of mesoscopic wavephysics, where the role of phase for multiply scattered waves has often been ignored,but it has also provided a new approach for probing evolving media with increasedsensitivity in some situations. Experimentally, the wrapped phase Φ(t, T ) ∈ (−π : π]was extracted from the measured field at any evolution time T by a numerical techniquethat is equivalent to taking a Hilbert transform and obtaining the complex analytic signalA(t, T ) exp{i[ωt + Φ(t, T )]}. Information on the dynamics of the medium is contained inthe phase difference over the time interval τ , ∆Φ(τ) = Φ(T + τ) − Φ(T ), which, sincethe phase difference is still a phase, is best represented between −π and +π, and wastherefore re-wrapped ∈ (−π : π]. To relate this phase difference to the particle dynamics,the relationship between the measured phase shift ∆Φ(τ) and the evolution of the path

Ultrasonic spectroscopy of complex media 9
phase ∆φpath(τ) was established. The simplest way to do this is via the wrapped phasedifference probability distribution P (∆Φ(τ)), which can be calculated for random wavefields described by circular Gaussian statistics from the joint probability distribution ofthe fields at two times Ti and Tj = Ti +τ [22]. Results for the same fluidized suspensionsof glass particles used for the data in fig. 2 are compared with theory in fig. 3(a)-(d),showing how the statistics of the phase difference evolve as the scatterers move, with thedistribution becoming wider as the relative mean square displacement of the particlesincreases. At long times when the fields are no longer correlated, P (∆Φ(τ)) reaches aflat distribution. At short time intervals τ and small ∆Φ, P (∆Φ(τ)) has the simple form
(7) P (∆Φ) =12
〈∆φ2path〉[
〈∆φ2path〉+ ∆Φ2
]3/2,
showing explicitly how the distribution depends on the path phase variance⟨∆φ2
path(τ)⟩
and hence on the relative mean square displacement of the particles. While the generalexpression for P (∆Φ(τ)) is more complicated [22], it still only depends on one parameter,the path phase variance, allowing the excellent fits of theory and experiment shownin fig. 3 to accurately measure the mean square relative displacement of the particles.Figure 3(e) shows that measurements of
⟨∆r2
rel (τ)⟩
from P (∆Φ) and g1 are in superbagreement over a wide range of evolution time intervals τ , validating this phase method.The insert of this figure also shows an example where measurements of P (∆Φ) yields moreaccurate results. In this case, the presence of amplitude noise due to gain fluctuationsdegrades the field correlation measurements of the particle dynamics at short times, buthas little effect on the phase statistics, which still give an accurate measurement of theparticle motions.
Another way of characterizing the dynamics is to measure the variance of the wrappedphase difference
⟨∆Φ2(τ)
⟩. The variance of the measured phase shift is very different to
the path phase variance⟨∆φ2
path(τ)⟩, since the phase of the measured field is determined
by the superposition of waves along all paths reaching the detector, while the path phasevariance is determined by the fluctuations in the phase along a typical path (see eq. 1).Remarkably, a universal relation has been found between the wrapped phase varianceand the path phase variance, as shown in fig. 4(a) by the solid curve. This universalrelation means that the particle dynamics can be determined directly from the measuredphase variance (open squares in fig. 3) – a simpler procedure than fitting the theoreticalexpression for P (∆Φ) to experimental data. Both methods work well for evolution timesthat are short enough that
⟨∆Φ2(τ)
⟩is less than its upper limit of π2/3, which occurs
when P (∆Φ) has become flat.Information on the dynamics can be followed to longer times by unwrapping the phase,
removing the jumps of 2π to determine the evolution of the cumulative phase Φc(τ). Here,as an example, we consider the cumulative phase shift variance, which is plotted as afunction of τ/τDAWS in fig. 4(b). At early times, its increase with time is the same as the

10 J. H. Page
10-2
10-1
100
101
102
for <∆Φ2
c>, no crossover
for <∆Φ2
wrap>
< ∆
φ pat
h
2 >
(r
ad2)
0.1
1
10
(4/3)τ / τDAWS
<∆Φ
C
2>
(a)
(b)
1E-3 0.01 0.1 1 1010
-4
10-3
for <c>, no crossover
for <∆Φ2
c>, τ
c
= 7 τDAWS
for <∆Φ2
c>, τ
c
= 5 τDAWS
< ∆Φ 2 > (rad
2 )
0.1 1 10
0.01
EXPERIMENT
THEORY (no crossover)
THEORY (τc
= 7τDAWS
)
τ / τDAWS
Fig. 4. – (a) Relation between the measured phase shift variance⟨∆Φ2(τ)
⟩and the path phase
variance⟨∆φ2
path(τ)⟩. For the wrapped phase, this relationship is universal (solid curve), while
unwrapping the phase destroys the universality, giving the cumulative phase shift variance⟨∆Φ2
c(τ)⟩
greater sensitivity to the dynamics at long times. (b) The time dependence of the cu-mulative phase shift variance
⟨∆Φ2
c(τ)⟩, showing a cross over to phase diffusion for times longer
that τDAWS, with a phase diffusion coefficient that is influenced by the long-time dynamics.
.
wrapped phase variance, but at long times⟨∆Φ2
c(τ)⟩
becomes proportional to time, with⟨∆Φ2
c(τ)⟩
= DΦτ , enabling the phase diffusion coefficient DΦ to be measured. If theparticles continue to move in ballistic trajectories at long times, DΦ = 1/τDAWS, but ifthe relative motion slows down, due to deviations from ballistic particle trajectories dueto particle interactions, DΦ is reduced. The solid curve in fig.4(b) shows a fit to a simpleempirical crossover model [6], indicating that the characteristic time τc for such deviationsto set in is about 7τDAWS. An interesting general point to emerge from this analysis ofthe cumulative phase shift variance is that unwrapping the phase destroys the universalrelationship between the measured phase variance and the path phase variance; thisactually has a positive benefit since it gives the cumulative phase shift variance increasedsensitivity to details of the particle motions at long times. The behaviour is shown bythe dashed and dotted curves in fig. 4(a).
Another advantage of examining the phase statistics has been demonstrated by theoryand experiment for the probability distributions of the phase derivatives with evolutiontime. These distributions have been determined for Φ′, Φ′′, Φ′′′ and found to be re-markably sensitive to early time dynamics, allowing the relative particle motions to bedetermined up to the 6th power in time - something that simply could not be achievedfrom measurements of the field correlation function. Another interesting quantity is the

Ultrasonic spectroscopy of complex media 11
cumulative phase correlation function, where current work is showing that, for evolvingsystems such as the bubbly liquids, the phase correlation function can be used to in-vestigate motions at remarkably long times, beyond those accessible to field correlationmeasurements. Thus, progress in measuring and understanding the phase statistics andcorrelations of multiply scattered fields is continuing to advance the capabilities of Dif-fusing Acoustic Wave Spectroscopy for investigating the dynamics of strongly scatteringmaterials.
3. – Probing food biomaterials with ultrasound
Many foods are heterogeneous on length scales that are comparable with the wave-lengths of ultrasound in the 100 kHz to 10 MHz range, making ultrasonic spectroscopy offood materials a promising approach for investigating their mechanical properties, struc-ture and dynamics. Because both scattering and dissipation of ultrasound are generallystrong in such materials, most information on their properties comes from ballistic veloc-ity and attenuation measurements. In this section, I focus on one example, bread dough,which contains one of the strongest scatterers of ultrasound, namely bubbles, with thebubbles being dispersed in a viscoelastic matrix, which contributes to the ultrasonic ab-sorption. Thus, the physics of how ultrasound propagates in dough is remarkably rich.Understanding the effect of bubbles on the properties of dough is also critical to control-ling the texture of bread, and hence its quality. As a result, ultrasonic characterizationof bubbles in bread dough is potentially important to the food industry.
Ultrasonic experiments on bread dough reveal different properties as the frequencyis varied [10, 11, 12, 13, 14, 15, 16, 17, 18, 19]. Indeed, there are three important fre-quency regimes. These are identified in fig. 5, which shows experiment and theory forthe ultrasonic attenuation and phase velocity in bread dough over almost three decadesin frequency. At low frequencies, f < 100 kHz, bubbles in dough drastically reduce thesound velocity, due to the large compressibility of the bubbles. There is excellent sensi-tivity to the presence of bubbles but no information on their sizes. The attenuation isrelatively low in this frequency regime, making experiments easier. For frequencies be-tween 100 kHz and 8 MHz, there is a strong resonant interaction between the ultrasonicwaves and the bubbles, leading to a very large variation in the velocity and attenuation.Their frequency dependence at these intermediate frequencies depends on the bubblesizes, raising the interesting possibility of extracting information on the bubble size dis-tribution in this opaque medium from ultrasonic measurements. At high frequencies,f > 8 MHz, the ultrasonic attenuation and velocity depend on matrix properties only,enabling structural relaxations of the molecular ingredients of the matrix to be probed.
The sensitivity of ultrasound to the concentration of bubbles in the low frequencyregime (at f ∼ 50 kHz) is shown in fig. 6. The dough samples were prepared by mixingtogether a strong Canadian breadmaking flour (CWRS), salt and water, to producea lean-formula mechanically developed dough [23]. For these experiments, the bubbleconcentration was adjusted by varying the headspace pressure during mixing. As thebubble concentration is increased, the ultrasonic velocity drops dramatically, reaching

12 J. H. Page
I II III
frequency (MHz)
Fig. 5. – The ultrasonic attenuation and phase velocity as a function of frequency up to 10 MHzfor a typical dough sample with a bubble concentration of 12%. The roman numerals and boxesindicate the three frequency regimes, as discussed in the text.
values less than the velocity of sound in air for concentrations above 2%. This behaviourcan be understood qualitatively in the Wood’s approximation for the low frequencycompressibility of a bubbly liquid. In this approximation, the average compressibility ofthe sample κs is simply the volume-fraction-weighted average of the compressibilities ofthe bubble inclusions i and surrounding matrix m
(8) κs = φvfκi + (1− φvf)κm
where φvf is the volume fraction of bubbles. Thus, since phase velocity and compress-ibility are related by v =
√1/ρκ, where ρ is the density,
(9)1
ρsv2s
=φvf
ρiv2i
+1− φvf
ρmv2m
and the average sound velocity for concentrations of bubbles in this range reduces ap-proximately to
(10) vs ≈ vair
√ρair
ρsφvf.
The density ratio in the square root factor in this expression shows why the velocity

Ultrasonic spectroscopy of complex media 13
0.00 0.02 0.04 0.06 0.080
200
400
600
800
1000
1200
1400
1600
0.00 0.02 0.04 0.06 0.08 0.100.0
0.2
0.4
0.6
0.8
1.0
1.2(a)
Experiment Wood's approximation Effective medium model
(with constant m )
Vel
ocity
(m/s
)
Bubble volume fraction vf
(b)
(
mm
-1)
Bubble volume fraction vf
Fig. 6. – The ultrasonic velocity (a) and attenuation (b) in bread dough as a function of bubblevolume fraction at 50 kHz.
is so much less than the velocity in air (340 m/s); the effective medium behaves as amaterial with the low compressibility of air, but with a larger density. For dough, thisapproximation underestimates the velocity at all volume fractions because it neglects theshear modulus of the dough matrix, which can be included in a more complete (but alsomore complicated) effective medium model [24]. For the higher volume fractions, wherethe complex shear modulus µm = 0.39+ i0.14 MPa can be reasonably extrapolated fromexisting lower frequency shear rheology data on dough prepared at ambient pressure [14];this model gives excellent agreement with experiment. At lower concentrations, however,the measured velocities are larger than this prediction, suggesting that the shear modulusof the dough matrix increases at low volume fractions. Thus the presence of bubbles inthe dough enables the shear properties of the dough to be investigated using longitudinalwaves - a considerable advantage as longitudinal ultrasonic measurements are easier toperform in lossy materials such as dough.
As shown in fig. 6(b), the ultrasonic attenuation increases as the square root of thevolume fraction in this low frequency regime, a frequency dependence which is predictedby effective medium theories (solid line) [24, 16]. By treating the interaction of ultrasoundwith bubbles in a viscoelastic medium, it can be shown, at frequencies well below theresonance frequency ω0 of the bubbles, that the attenuation is predicted to have theform:
(11) α =
√3φvf
a2
ω2Γω3
0
Here a is the radius of the bubbles, and Γ is the damping rate, which at low frequen-cies depends on viscous losses and thermal dissipation. If viscous losses dominate, the

14 J. H. Page
(a1)
(c2) (b2) (a2)
(b1) (c1)
Fig. 7. – Frequency dependence of the ultrasonic attenuation (a1),(a2) and velocity (b1),(b2),showing the broad spectral features characteristic of resonant interactions with bubbles. Thegrey curves represent experimental data, and the solid black curves are theoretical predictionsof the model outlined in the text. (See ref. 16 for more information.) The numbers (1) and (2)identify the times after mixing at which the data were taken: 53 minutes for (1) and 90 minutesfor (2). The solid curves in (c1) and (c2) are the bubble size distributions inferred from theultrasonic data at these two times. The dotted curve in (c2) are the results of x-ray tomographymeasurements.
dependence of α on bubble size in eq. 11 cancels out, since Γviscous = 4µ′′/ρωa2 and theresonant frequency of the bubbles depends inversely on the bubble radius, ω0 ∝ a−1.Thus, in this regime, the attenuation is sensitive only to the amount of gas entrained inthe bubbles, and not on how the gas is distributed, providing a good indicator of theamount of gas entrained in the dough.
The sensitivity of these low-frequency measurements to bubble concentration is en-abling the ultrasonic velocity and attenuation to be used to monitor dough mixing, wherereliable methods of determining optimum mixing conditions are of considerable value [18].For doughs prepared with leavening agents, ultrasonic velocity and attenuation can beused to monitor the growth of the bubbles due to incorporation of CO2 [12]. Low fre-quency velocity measurements can also be used to assess dough quality [25], and sincethese ultrasonic measurements can be performed on small samples, such measurementsare potentially very useful in wheat breeding programs.
At intermediate frequencies, the resonant coupling of ultrasound with the bubblescauses the attenuation and phase velocity to exhibit a large frequency dependence, withbroad peaks that contain information on the bubble size distribution (fig. 7). To inter-pret the experimental data, Leroy et al. [16] have used a model that extends the well-established model for the resonant interactions of sound with bubbles in liquids [26, 27, 28]to viscoelastic materials, by incorporating a simple correction to the resonant frequencyproposed by Alekseev and Rybak [29]. Physically, the effects of finite shear rigidity are toshift the resonant frequency to higher frequencies and also to weaken the resonance. Thismodel has been tested on transparent agar gels, where the bubble sizes can be measured

Ultrasonic spectroscopy of complex media 15
optically, and found to describe the data well [16]. Applying the same model to dough,as described in ref. [16] and shown by the solid curves in figs. 7(a),(b), the bubble sizedistribution can be estimated. The inferred bubble size distributions at two times aftermixing are shown in fig. 7(c). At the later time, the evolution of the size distribution hadslowed down sufficiently to enable bench-top x-ray tomography measurements to inde-pendently measure the size distribution (dotted curve in fig. 7(c)) [15]. This comparisonindicates that the analysis of the ultrasonic data estimates smaller bubble sizes than thex-ray measurement, although comparison between results is not straightforward becausethe conditions of sample preparation were not the same in both cases. Work is continu-ing to understand the origin of this discrepancy, so that the ultrasonic technique can bedeveloped to unambiguously determine bubble sizes. Since ultrasonic measurements canbe performed quickly, potentially even online, this information has practical relevancefor monitoring dough quality during breadmaking. Even though questions remain tobe resolved concerning the absolute sizes of the bubbles determined from the ultrasonicvelocity and attenuation, the shift of the resonance features in the ultrasonic data tolower frequencies at the later observation time shows the effects of disproportionation inthe dough due to Ostwald ripening; this phenomenon leads to an increase in the aver-age size of the bubbles with time as gas diffuses from the smaller bubbles to the largerones [30]. Such information on the dynamics of the bubbles in bread dough is valuablefor understanding the evolution of the bubble structure.
Measurements of ultrasonic velocity and attenuation in dough in the high frequencyrange (above the bubble resonance regime, f > 8 MHz) reveal information on matrixproperties. The frequency dependence of the data show signatures of ultrasonic relaxationphenomena, which can be interpreted using a molecular relaxation model [33, 34]. Dif-ferent fast relaxation times were observed for ambient-mixed dough (5 ns) and vacuum-mixed dough (1 ns) [31]. These relaxation times may be associated with conformationalrearrangements in glutenin - the supermolecular structure of proteins in the gluten ma-trix - perhaps due to the loop-to-train transition that is thought to play a role in theelasticity of glutenin [32]. Thus data in this frequency range can probe ultrasonic stress-induced changes in the secondary structure of gluten proteins that are important forunderstanding the viscoelastic properties of this complex food material.
This example of ultrasonic spectroscopy shows that both ultrasonic velocity and at-tenuation are sensitive probes of the gas cell structure of bread dough, enabling newapproaches to optimizing loaf quality to be developed. Ultrasound can be used to followthe evolution of the gas cells (bubbles) throughout the entire breadmaking process, fromthe initial entrainment of gas bubbles in dough during mixing, though the expansion ofthe gas cells during proofing, all the way up to the final foam structure of bread. Ul-trasound can also be used to probe changes in the viscoelastic properties of the doughmatrix. Remarkably, despite the complexity of dough and bread as mesoscopic materials,their mechanical properties can be elucidated using relative simple physics models. Thiscombination of factors is leading to a new awareness of ultrasound’s potential to providenovel information on technical issues of importance to the cereals processing industry.

16 J. H. Page
4. – Conclusions
Ultrasonic spectroscopy is both contributing to and capitalizing on advances in thewave physics of complex mesoscopic materials. As a result, new approaches that ex-ploit the advantages of ultrasonic techniques are being developed to characterize thestructure and dynamics of this increasing important class of materials. This paper hasdiscussed two examples. The first was Diffusing Acoustic Wave Spectroscopy, which isa sensitive technique for monitoring changes in materials in which conventional imagingtechniques are impossible due to multiple scattering, and which is complementary to Dif-fusing Optical Wave Spectroscopy. DAWS is based on direct measurements of the fieldautocorrelation function, and has been extended recently to probe dynamics using thephase of multiply scattered waves. This approach has some advantages practically, aswell as being a way of advancing our understanding of phase in mesoscopic wave physics.In this paper, the application of this technique to the investigation of particulate andbubbly suspensions was demonstrated, but many more applications of this technique canbe envisaged (e.g., in process control).
The second example considered here was the characterization of biological materialsof importance in food science. Many such materials have internal length scales thatare comparable with the wavelength of ultrasound, making ultrasonic spectroscopy aparticularly relevant approach. The studies of bread dough that were summarized inthis paper demonstrate how advances in physics underpin practical applications. Thelatter are of considerable economic potential in the rapidly growing functional foods area,where the interaction of functional ingredients with the bubble structure can damage thetaste and appearance of food products unless remedial action is taken. By monitoringthe properties at an early stage in production and helping to understand the dynamicsof these interactions, ultrasonic techniques can help overcome such problems.
∗ ∗ ∗I would like to thank the many students and colleagues who have contributed to the
research that has been reviewed in this paper. Support from NSERC is also gratefullyacknowledged.
REFERENCES
[1] Page J.H., this volume, p. 75.[2] Page J.H., Schreimer H.P., Bailey A.E. and Weitz D.A., Phys. Rev. E, 52 (1995)
3106.[3] Page J.H., Sheng P., Schreimer H.P., Jones I., Jing X. and Weitz D.A., Science,
271 (1996) 634.[4] Schreimer H.P., Cowan M.L., Page J.H., Sheng P., Liu Z. and Weitz D.A., Phys.
Rev. Lett., 79 (1997) 3166.[5] Cowan M.L., Beaty K., Page J.H., Liu Z and Sheng P, Phys. Rev. E, 58 (1998) 6626.[6] Cowan M.L., Page J.H. and Weitz D.A., Phys. Rev. Lett., 85 (2000) 453.[7] Cowan M.L., Jones I.P., Page J.H. and Weitz D.A., Phys. Rev. E, 65 (2002) 066605.
Ultrasonic spectroscopy of complex media 17
[8] Cowan M.L., Page J.H., Weitz D.A. and van Tiggelen B.A., in Wave Scatteringin Complex Media: From Theory to Applications, edited by van Tiggelen B.A. andSkipetrov S.E. Kluwer Academic Publishers: NATO Science series, Amsterdam 2003,pp. 151-174.
[9] Snieder R. and Page J., Physics Today, 60(5) (2007) 49.[10] Letang C., Piau M., Verdier C., and Lefebvre L., Ultrasonics, 39 (2001) 133.[11] Elmehdi H.M., Ph.D. Thesis, University of Manitoba 2001.[12] Elmehdi H.M., Page J.H. and Scanlon M.G., Trans. Inst. Chem. Eng. Part C: Food
Bioprod. Proc., 81 (2003) 217.[13] Elmehdi H.M., Page J.H. and Scanlon M.G., J. Cereal Sci., 38 (2003) 33.[14] Elmehdi H.M., Page J.H. and Scanlon M.G., Cereal Chem., 81 (2004) 504.[15] Bellido G.G., Scanlon M.G., Page J.H. and Hallgrimsson B., Food Research
International, 39 (2006) 1058.[16] Leroy V., Fan Y., Strybulevych A.L., Bellido G.G., Page J.H.. and
Scanlon M.G., in Bubbles in Food 2: Novelty, Health and Luxury, edited byCampbell G.M., Scanlon M.G. and Pyle D.L., AACC Press, St Paul, MN 2008 pp.51-60.
[17] Scanlon M.G., Page J.H. and Elmehdi H.M., in Bubbles in Food 2: Novelty, Healthand Luxury, edited by Campbell G.M., Scanlon M.G. and Pyle D.L., AACC Press, StPaul, MN 2008 pp. 217-230.
[18] Mehta K.L., Scanlon M.G., Sapirstein H.D. and Page J.H., J. Food Science, 74(2009) E455.
[19] Leroy V, Pitura K.M., Scanlon M.G. and Page J.H., J. Non-Newtonian FluidMechanics, 165 (2010) 475.
[20] Maret G. and Wolf P.E., Z. Phys. B, 65 (1987) 409[21] Pine D.J., Weitz D.A., Chaikin P.M. and Herbolzheimer E., Phys. Rev. Lett., 60
(1988) 1134.[22] Cowan M.L., Anache-Menier D., Hildebrand W.K., Page J.H. and van
Tiggelen B.A., Phys. Rev. Lett., 99 (2007) 094301.[23] Preston K.R., Kilborn R.H. and Black H.C., Can. Inst. Food Sci. Technol. J., 15
(1982) 29.[24] Sheng P., in Homogenization and Effective Moduli of Materials and Media, edited by
Ericksen J.L., Kinderlehrer D., Kohn R. and Lions J.-L. Springer 1988 p. 196.[25] Scanlon M.G., Mehta K.L., Elmehdi H.M. and Page J.H., unpublished.[26] Foldy L.L., Phys. Rev., 67 (1945) 107.[27] Leighton T.G., The Acoustical Bubble Academic Press, London 1994.[28] Prosperetti A., J. Acoust. Soc. Am., 61 (1977) 17.[29] Alekseev V.N. and Rybak S.A., Acoustical Physics, 45 (1999) 535.[30] Van Vliet T., in Bubbles in Food, edited by Campbell G.M., Webb C., Pandiella S.S.
and Niranjan K. Eagan Press: St. Paul, MN. 1999, pp. 121-127.[31] Scanlon M.G., Page J.H., Leroy V., Fan Y. and Mehta K.L., in Proc. 5th
International Symposium on Food Rheology and Structure, edited by Fischer P.,Pollard M. and Windhab E.J. ETH Zurich 2009, pp. 378-381.
[32] Belton P. S., J. Cereal Sci., 29 (1999) 103.[33] Litovitz T.A., and Davis C.M., in Physical Acoustics, Vol IIA, edited by Mason W.P.
Academic Press, New York 1965 pp. 282-350.[34] Marvin R.S. and McKinney J.E., in Physical Acoustics, Vol IIB, edited by Mason W.P.
Academic Press, New York 1965 pp. 160-230.


![The incommensurate magnet iron monophosphide FeP ...nuclear magnetic resonance (NMR) spectroscopy, and X-ray photoemission spectroscopy [11-13]. The authors concluded that the complex](https://img.dokumen.tips/doc/110x75/60aa109ae11a811d365ae469/the-incommensurate-magnet-iron-monophosphide-fep-nuclear-magnetic-resonance.jpg)