Embed Size (px)
Citation preview
UKRAINE
UNFCCC. The First National Communication 1-1
Ukraine
The First NationalCommunication on Climate
Change
The United Nations Framework Convention on Climate Change
Kyiv 1998

UKRAINE
UNFCCC. The First National Communication 1-2
CONTENT1. EXECUTIVE SUMMARY....................................................................... 1-3
2. INTRODUCTION..................................................................................... 2-9
3. NATIONAL CIRCUMSTANCES.......................................................... 3-10
4. GREENHOUSE GAS INVENTORY ..................................................... 4-15
5. POLICIES AND MEASURES TO MITIGATE CLIMATE CHANGE 5-24
6. PROJECTIONS OF GREENHOUSE GAS EMISSIONS ANDREDUCTION POTENTIALS IN UKRAINE .................................... 6-31
7. VULNERABILITY AND ADAPTATION ASSESSMENT INUKRAINE ........................................................................................... 7-42
8. RESEARCH AND PUBLIC EDUCATION........................................... 8-48
9. THE FUTURE......................................................................................... 9-49

UKRAINE
UNFCCC. The First National Communication 1-3
1. EXECUTIVE SUMMARY1.1 IntroductionClimate change may be the most critical and complex environmental issue facing humanity in the last century.The United Nations Framework Convention on Climate Change (UN FCCC) is the first and major internationallegal instrument to address climate change issues at a global scale.The ultimate objective of the Convention is �stabilization of greenhouse gas concentrations in the atmosphere ata level that would prevent dangerous anthropogenic interference with the climate system�.Ukraine signed the Convention in June 1992, the Parliament ratified it in October 1996, and Ukraine became theParty in August 1997. In compliance with Article 4.2b Ukraine has adopted 1990 as a base year for theestimation of anthropogenic emissions of carbon dioxide and other greenhouse gases not controlled by theMontreal Protocol.Article 4.6 of the Convention gives countries with economies in transition to market economies �a certain degreeof flexibility� to meet their commitments in the frames of the FCCC. Due to the deep uncertainties related totransition period, futility of �business-as-usual� scenario development, there is a lack of sufficient quantitativeinformation about some of mitigation and adaptation measures, and future projections in Ukraine.This document is the First National Communication, by which Ukraine is complying with the obligation tocommunicate information to the Secretariat of the Intergovernmental Negotiating Committee for a UN FCCC,according to Article 4.2 and Article 12 of the Convention.The elaboration of Ukrainian First National Communication was supervised by the Ministry of EnvironmentalProtection and Nuclear Safety of Ukraine, relevant ministries, agencies and organizations taking an active part.The document was prepared by Agency for Rational Energy Use and Ecology.
1.2 National CircumstancesUkraine is the second largest country in Europe (after the Russia) with an area of 603.7 thousand km2. Thepopulation of the country (1995) is 51.7 million people.Climate of Ukraine is of moderate-continental type, except of narrow belt of Southern Coast of Crimea withfeatures of subtropics climate.Since 1990 the Ukrainian economy is facing a very deep crisis and it is expected that a recovering trend willbegin only after a period of depression and stagnation. The main reason is that Ukraine is not in the best positionfor a quick recovery because its limited energy resources and its obsolete and deformed industrial infrastructure.Since 1990 production has maintained a growing negative trend reaching up to 50% decrease in 1995 for theindustrial production (Table 1�1). Now the trend has been maintained and it is not foreseeable a change until theend of 1998.Ukraine is one of the least energy efficient countries in the world. Ukraine�s use of energy relative to GDP ismuch higher than in Western Europe and the USA. The worst is, that the trend toward growing energyconsumption per unit of GDP has also increased (Table 1�1).Table 1–1. GDP, Inflation, Unemployment and Energy Intensity Trends
1990 1991 1992 1993 1994 1995GDP, 109 $ 73.62 67.21 60.56 51.96 40.01 35.29Unemployment, thousand person - 9.8 128 180.9 216 126Inflation, % - - 1310 4830 990 420Energy Consumption, PJ 10342.9 10017.7 8907.2 7931.5 6900.2 6630.6Energy Intensity, PJ per billion $ 141 149 147 152 172 188
Ukrainian economy is in transition now. But Ukrainian Government pays much attention to the environmentalprotection. Many legislative documents have been adopted in the last time.
1.3 Inventory of greenhouse gas emissions and removals inUkraineThe Framework Convention on Climate Change calls upon Parties to: �periodically update, publish, and makeavailable to the Conference of Parties � national inventories of anthropogenic emissions by sources andremovals by sinks of all greenhouse gases not controlled by the Montreal Protocol, using comparablemethodologies to be agreed upon by the Conference of the Parties�. This commitment was included in theConvention because it was clear to all countries that any effective climate policy must begin with an accurateinventory of gases that may influence global warming.The GHG emissions presented here were calculated using the IPCC Guidelines for National Greenhouse GasInventories to ensure that the emission inventories submitted to the Framework Convention are consistent and

UKRAINE
UNFCCC. The First National Communication 1-4
comparable across sectors and among nations. Ukraine has followed these guidelines, except wheremore detailed data or methodologies were available for major sources of emissions.According to IPCC Methodology the Ukrainian inventory deals with the following five categories of GHGsources and sinks: energy systems (including transportation), industrial processes, agriculture, forestry and land-use change, and wastes.Greenhouse gases Inventory in Ukraine include carbon dioxide (CO2), methane (CH4), nitrous oxide (N2O)directly contributing to the greenhouse effect. In addition, indirect greenhouse gases, such as carbon monoxide(CO), oxides of nitrogen (NOx), and nonmethane volatile organic compounds (NMVOCs) were taken intoaccount. For the 1990 base year, total GHG emissions in Ukraine were 232 882 Gg of carbon equivalent. CO2 emissionswere partly offset by an uptake of carbon in Ukrainian forests of 14 175 Gg of carbon equivalent in 1990 (Table1�2).Table 1–2. Ukrainian Greenhouse Gas Emissions, 1990, Gg
Gas/Source Emissions(Full
MolecularWeight)
Emissions(Direct and
Indirect Effects;Carbon
Equivalent)Greenhouse Gases
Net Carbon Dioxide 648 131 176 763Fossil Fuel Combustion 668 332 182 272Industrial processes 31 775 8 666Total 700 107 190 938Forestry (sink) -51 976 -14 175
Methane 9 453 54 140Energy 6 265 35 881Agriculture 2 254 12 909Waste 934 5 349
Nitrous Oxide 23.412 1 979Energy 6.708 567Chemistry 6.160 521Waste 0.132 11Forest fires 0.175 15Agricultural soils 10.237 865
Photochemically Important GasesCarbon Monoxide (CO) 7 481 -Nitrogen Oxides (NOX) 1 243 -Nonmethane Volatile Organic Compounds (NMVOCs) 656 -Net Emissions 232 882Due largely to fossil fuel consumption, carbon dioxide emissions accounted for the largest share -approximately 76 percent. Methane accounted for 23 percent of total emissions, which included contributionsfrom agricultural activities and landfills, among others. The nitrous oxide emissions is less important comprising1 percent of total emissions.The relative and absolute contributions of indirect GHG to climate change is uncertain.
1.4 Policies and Measures to Mitigate Climate Change
1.4.1 Overall policy contextDuring the last years the whole number of programs for the economic development of Ukraine was
elaborated and adopted, the most important of them were as follows:1. Program of Restructuring of Ukrainian Economy, 1996;2. National Energy Program, 1996;3. Comprehensive State Energy Conservation Program of Ukraine, 1996;4. National Development Programs of Industrial Sectors.
Resolutions, presented in these documents, were assumed as a basis to form the baseline scenario of thedevelopment of economy and its sectors, to assess projected GHG emissions levels and mitigation measures.

UKRAINE
UNFCCC. The First National Communication 1-5
In correspondence with the baseline scenario of the economic development it is planned to provide mainindices of the socio-economic development of the country (Table 1�3) in the period considered, up to 2015.Table 1–3. The main features of socio-economic development of Ukraine up to 2015
Indices 1990 1995 2000 2005 2010 2015GDP, billion $ 73.62 35.26 41.30 58.82 84.07 97.17GDP, % 100.0 47.9 56.1 79.9 114.2 132.0Fuel combustion, PJ 9246.3 5531.5 6965.1 7557.7 8022.5 8551.9Population, million of people 51.9 51.5 50.2 51.0 51.5 51.8Housing fund, million of m3 922.1 978.5 1018.5 1169.6 1255.0 1360.5
Alongside with the baseline scenario the indices for the optimistic and pessimistic scenarios of the economicdevelopment were forecasted. The differences for pessimistic and optimistic scenarios are generally in volumesof energy saving, which in optimistic scenario will be approximately 10-12% higher, and in pessimistic one - 25-30% lower.
1.4.2 Overall mitigation potentialTwo groups of mitigation measures were considered in mitigation analyses: policy instruments and
technological options.All these measures have a high degree of a governmental support, since they are included in the programs of thedevelopment of the economy and its sectors in Ukraine, adopted by the administrative bodies of the state, as wellas in the draft documents, which at present are being under consideration of the Cabinet of Ministers, of theParliament and the administration of the President of the country. However the possibility of realization of thesemeasures will to a great extent depend on the investments.Realization of such options as implementation of energy efficiency technologies, machinery, equipment,appliances, pursuing an active energy saving policy and use of the additional renewable and nuclear energy willprovide the annual energy saving at a level of 2000 - 1000-1100 PJ, 2005 - 1950-2100 PJ, 2010 - 3100-3200 PJ,2015 - 4100-4200 PJ. These measures will require around $29-32 billion investments.The analysis of measures effectiveness, according to the criterion of a relative effectiveness, shows, thatmeasures, connected with the decrease of natural gas losses, with DSM, with the realization of cross-sectoralenergy saving programs, are the most effective ones.The implementation of non-traditional sources, optimization of the electric power and heat utilities, the sets forpure coal combustion, installation of constructions for the refining of wastewater silt at purification stations, arethe most expensive measures for GHG emissions decrease from the economic view point.However, it must be taken into consideration, that for a whole number of measures considered the GHGemissions decrease is an indirect effect. Expedience of their realization is conditioned, as a rule, by othereconomic and social factors.
1.5 Projections of Greenhouse Gas Emissions and ReductionPotentials in UkraineIn the future direct GHG emissions are projected to be lower than the emissions of 1990 in any scenario of theeconomic development, despite the essential growth of GDP in a baseline and especially in optimistic scenariosof the economic development of Ukraine. This is supposed to be achieved by the whole set of measures for GHGemissions decrease and the increase of CO2 uptakes in the Forestry.Summaries of projections of anthropogenic emissions of CO2, CH4, N2O and precursors are presented in theTable 1�4, Table 1�5, Table 1�6, Table 1�7.Estimates for direct GHG emissions are slightly different from the Ukrainian Inventory. The difference betweenthe assessments of indirect greenhouse gases is more essential.The largest difference is due to updating of recent Guidelines from the Intergovernmental Panel on ClimateChange. Other differences include updates in sources list (non-energy emissions in food sector, metallurgy,chemistry and construction).Table 1–4. Summary of projections of anthropogenic emissions of CO2 , Gg
1990 1995 2000 2005 2010 2015Fuel combustion: energy andtransformation industries
191296 135447 151037 173122 178539 189474
Fuel combustion: industry 220202 117182 149722 159284 168893 179562Fuel combustion: construction 3890 4615 3462 3646 3845 4431Fuel combustion: residential 97506 78860 91649 91317 96818 100047Fuel combustion: agriculture 35611 22721 32255 34044 36085 37908Fuel combustion: transport 49831 17922 41060 45985 52749 61866

UKRAINE
UNFCCC. The First National Communication 1-6
Fuel combustion: other 64296 25648 34343 34072 32861 31848Industrial processes 48815 22905 26514 27678 28225 29214Total 711447 425299 530042 569149 598016 634352Table 1–5. Summary of projections of anthropogenic emissions of CH4, Gg
1990 1995 2000 2005 2010 2015Fuel combustion 292 215 233 208 209 200Fugitive emissions from fuels 6227 4044 52737 4653 4107 3356Industrial processes: Iron and Steel 333 98 104 104 104 105Industrial processes: Food 68 71 57 58 57 58Industrial processes: Construction 5 3 4 5 5 6Livestock 2240 1700 1764 2001 2077 2154Rice cultivation 15 11 12 13 16 22Waste 934 1009 937 909 891 837Total 10115 7150 8383 7951 7467 6738
Table 1–6. Summary of projections of anthropogenic emissions of N2O, Gg1990 1995 2000 2005 2010 2015
Transport 0.4 0.2 0.2 0.2 0.2 0.2Other energy sources 4.5 3.3 4.0 4.2 4.3 4.6Industrial processes 23 7 22.5 25.8 26.0 26.1Agricultural soils 10.2 5.1 7.6 8.5 9.4 10.2Waste 0.1 0.1 0.4 0.6 0.9 1.2Total 38.2 15.7 34.7 39.3 40.8 42.3
Table 1–7. Summary of projections of anthropogenic emissions of precursors, Gg1990 1995 2000 2005 2010 2015
CO 7295 4046 5964 5958 6255 6607NO2 2043 1140 1564 1605 1613 1666NMVOCS 1007 471 844 884 949 1043
In the Forestry it is projected to provide the increase of CO2 uptakes Ukraine in 2015 approximately on 20800 Gg CE (Table 1�8).Table 1–8. Summary of projections of removals of CO2 by sinks and reservoirs, Gg
1990 1995 2000 2005 2010 2015Forestry -51555 -64490 -66265 -68189 -70361 -72461Land-use change -421 -396 -378 -359 -341 -323Total removals -51976 -64886 -66643 -68548 -70702 -72784
GHG emissions and removals in the considered period are given in Table 1�9 for the baseline scenario. Theoverall reduction potential of mitigation measures is approximately 100,000 Gg CE, and projected emissionsdecrease in 2015 is 45,889 Gg compared to 1990.Table 1–9. Total GHG emissions/removals in the baseline scenario
1990 1995 2000 2005 2010 2015Direct GHG emissions
CO2, Gg 711447 425299 530042 569149 598016 634352CO2, Gg CE 194031 115991 144557 155222 163095 173005CH4, Gg 10115 7150 8383 7951 7467 6738N2O, Gg 38.2 15.7 34.7 39.3 40.8 42.3Total, Gg CE 255192 158268 195503 204082 209310 215172Total, % compared to 1990 100 62.02 76.61 79.97 82.02 84.32
CO2 uptakes in forestryCO2 uptakes, Gg -51976 -64886 -66643 -68548 -70702 -72784
CO2 uptakes, Gg CE -14175 -17696 -18175 -18695 -19282 -19850Net
CO2, Gg 659471 360413 463399 500601 527314 561568

UKRAINE
UNFCCC. The First National Communication 1-7
Total, Gg CE 241017 140572 177328 185387 190028 195322CO2, % compared to 1990 100 58.32 73.57 76.92 78.84 81.04
In optimistic scenario of the economic development, the net GHG emission levels in 2015 will total above 220Tg CE, that is approximately 10.7% lower than in 1990.In pessimistic scenario net GHG emissions on the level of 2015 will total above 180 Tg CE or about 73% fromthe level of 1990.A very wide range of change of indices, characterizing the future economic development and expected emissionlevels, is connected with a very high grade of uncertainty of future development of Ukrainian economy (Table 1�10).Table 1–10. Ranges of fuel consumption and GHG emissions in 2015
Pessimisticscenario
Optimisticscenario
Range Averagedeviation, %
Fuel, PJ 7596.4 9787.2 2190.8 12.8Direct GHG Emissions, Tg CE 195.2 245.4 50. 2 11.5Sinks in Forestry, Tg CE -19.9 -23.9 -4.0 9.1Net GHG Emissions, Tg CE 175.3 221.5 46.2 11.6
1.6 Vulnerability and Adaptation Assessment in UkraineGiven the country�s unstable economy and critical ecological problems, the consequences of climate change inUkraine could be serious. The results of scientific research during the last few years show that climate change inUkraine has significant impacts on agriculture, forestry, water and coastal resources. It is highly probable thatcrop yields could be changed significantly. Transformation of types, species composition, productivity andstability of forests is likely to take place in the course of climate warming within the territory of Ukraine. Coastalzone vulnerability is already a reality: the Black Sea level is rising 1.5 mm per year.Thereby the following measures are to be realized in the nearest future:
� Optimization of current system of water resources management (for Dnieper basin, first andforemost), including increase of reservoirs usable storage, elevation of normal afflux horizons andlowering of drawdown level; alter regulations for runoff management through reservoirs;
� Providing alternative ways to cover peak loads in the power system in case of decrease of powerproduction by Cascade of Dnieper hydropower plants;
� Development of National Program of Agriculture Development in Ukraine, which will include set ofpolitical, economic and technical measures, that will enable to prevent negative climate changeimpact on agricultural production. Acceleration of the land reform in Ukraine could be the first stepin such direction;
� Promoting development of research programs to increase the genetic potential of domesticagricultural crops and animal breeds;
� Development of National Program on Coast Protection Measures that would include two main parts:scientific substantiation of trend and intensity of erosion processes within coastal zone of the Blackand Azov Seas; and detailed plan of adaptation measures considering the most �unfavorable� sea levelrise scenarios designed up to 2050;
� Facilitating implementation of technological, administrative and financial measures to supportforestry in climate change conditions, including measures on elongating timber stands life-time,forest protection against pests and diseases; introduction of stable wood species, which provide thebest productivity under climate conditions being formed; rise of responsibility level of forest users forforestry integrity and others.
1.7 Research and Public EducationParamount to successfully mitigating and adapting to climate change is an ability to understand,
monitor, and predict future changes. This, in turn, requires substantial research on the global climate system andthe dissemination of such information to better enable society to respond appropriately.Ukrainian Country Study in the frames of US Country Studies Program Support for Climate Change Studieswas the first large-scale program in such direction. This program is nationally integrated effort that seeks toexpand knowledge of these processes that affect climate change and to develop integrated models to predictthese effects.Ultimately, of course, the public is the true arbiter of national response strategies and policies. Thus, the publicmust have a solid understanding of global change science, particularly the consequences of policy options. To
UKRAINE
UNFCCC. The First National Communication 1-8
promote this understanding, relevant ministries and agencies direct efforts to general education,communication, and dissemination of climate change information.
1.8 The FutureUkraine is currently examining the question of its future participation in the intergovernmental activities relatingto the UN Framework Convention on Climate Change.National Action Plan for GHG emission reduction and adaptation options implementation will be developed andsubmitted to Government for consideration. Public education concerning climate change problems is theessential element of National Action Plan implementation. The different forms of public education will beused, for example, training courses, issues of brochures, TV-programs, articles, etc.Participation in U.S. Initiative on Joint Implementation (USIJI), which is a pilot program to reduce net GHGemissions and establish an empirical basis and framework for approaches to joint implementation, is envisaged.

UKRAINE
UNFCCC. The First National Communication 2-9
2. INTRODUCTIONClimate change may be the most critical and complex environmental issue facing humanity in the last century.There are many uncertainties about the effects of increasing concentrations of carbon dioxide and othergreenhouse gases (GHG) on temperatures; on the effects of temperature increases on other aspects of climate;and the causal effects on crops, rangelands, forests, and other parts of natural environment. But it is clear thatglobal warming entails risk, risk not only that the kind of changes described above will take place but of otherunexpected things. Small forcing can bring about changes in wind and ocean currents that greatly alter existingconditions. Strange and unforeseen effects can and probably will occur. With the carrying capacity of many partsof the world under stress from present level of population and economic activity, and the prospect of continuingand large increases in both in the decades immediately ahead, it might not take much more change to bring aboutthe gravest consequences for people and most of Earth�s present life systems.The United Nations Framework Convention on Climate Change (UN FCCC) is the first and major internationallegal instrument to address climate change issues at a global scale. In June 1992 the representatives of 176countries met at the highest level in Rio-de-Janeiro at the UN Conference to search for ways of joint activity forenvironmental protection. Signature of the UN FCCC by around 150 countries indicated that climate change ispotentially a major threat to the world�s ecology and economic development. 167 countries have ratified theConvention by September 1997.The ultimate objective of the Convention is �stabilization of greenhouse gas concentrations in the atmosphere ata level that would prevent dangerous anthropogenic interference with the climate system�.Ukraine signed the Convention in June 1992, the Parliament ratified it in October 1996 and became the Party inAugust 1997.Ukraine is included in Annex 1 of the Convention. All of Annex 1 Parties are obliged to present the FirstNational Communication composed of an inventory and projections of GHG emissions, national policies andmeasure to mitigate climate change, adaptation strategies within a six month period after it entering into force.In compliance with Article 4.2b Ukraine has adopted 1990 as a base year for the estimating of anthropogenicemissions of carbon dioxide and other greenhouse gases not controlled by the Montreal Protocol.Article 4.6 of the Convention gives countries with economies in transition to market economies �a certain degreeof flexibility� to meet their commitments in the frames of the FCCC. Due to the deep uncertainties related totransition period, futility of �business-as-usual� scenario development, there is a lack of sufficient quantitativeinformation about some of mitigation and adaptation measures, and future projections in Ukraine.This document is the First National Communication, by which Ukraine is complying with the obligation tocommunicate information to the Secretariat of the Intergovernmental Negotiating Committee for a UN FCCC,according to Article 4.2 and Article 12 of the Convention.The elaboration of Ukrainian First National Communication was supervised by the Ministry of EnvironmentalProtection and Nuclear Safety of Ukraine, relevant ministries, agencies and organizations taking an active part.The document was prepared by Agency for Rational Energy Use and Ecology.

UKRAINE
UNFCCC. The First National Communication 3-10
3. NATIONAL CIRCUMSTANCESUkraine is the second largest country in Europe (after the Russia) with an area of 603.7 thousand km2. Thepopulation of the country (1995) is 51.7 million people, including urban population - 35.1 million, and ruralpopulation - 16.6 million. Around 73% of the total population are of Ukrainian origin. The capital of Ukraineis Kyiv.Ukraine is situated in south-west of Eastern-European Plain. To the west of country Ukrainian Carpathians arelocated, to the south, along southern coast of the Black Sea - Crimean Mountains; from the south its coasts arewashed by Black and Azov Seas. From the north to the south territory of Ukraine stretches from 52°22�54�� to44°23�18��of n.l., almost for 900 km, and from the west to the east - from 22°08�42�� to 40°13�05�� of w.l., for1,300 km.Flat part of the territory of the country covers 95% of overall area (573.5 thousand km2). In the northern partPolissya is situated - swampy lowland; left-bank region of Dnieper is occupied with Prydneprovskaya Lowland.From extreme north-east spurs of Middle-Russian Hills penetrate into Ukraine. In south-east Donetsk Ridge andPryazovskaya Hills are situated. Central and western parts of right-bank of Dnieper are occupied withPrydneprovskaya, Volyn� and Podol�sk Hills.In the south of the country the Prychernomorskaya Lowland is located, which is connected with Northern-Crimean Plain through Perekop�s Isthmus.Within flat territory natural zones are rather clearly marked. In the north zone of mixed forests is situated (19%of the territory). Forest-Steppe zone occupies 34% of country territory. Steppe zone is situated to the south ofUkraine and occupies about 40% of the territory. Carpathian and Crimean Mountains are characterized withaltitudinal zonality of present landscapes.Ukraine has rather dense river system. Rivers mostly belong to basins of Black and Azov Seas. The largest riverof Ukraine is Dnieper, basin of which occupies a half of the country territory, and average runoff of which is53.3 km3.There are significant deposits of a number of treasures of the soil in Ukraine - coal, oil, gas, iron ore,manganese, titanium, uranium, bauxites, nephelines, alunites, kaolines, rock-salt, potassium sulfate, etc.Fertile soils are the most important resources for agriculture of the country. The most fertile soils in Ukraine arechernozems with humus content from 3 to 7% and with thickness of humus layer of 130 - 150 cm. They occupymore than 10% of territory. Besides, considerable areas are occupied with Grey Forest soils in Forest-Steppezone and with Chestnut ones - in Steppe zone, which are featured with high fertility as well.Table 3�1 presents general information on economical and natural potential of Ukraine.Table 3–1. General information on economical and natural potential of Ukraine (1995)Population, millions of persons 51.7Population increment, % 0.35Urban population, millions of persons 35.1Gross Domestic Product, billions of US dollars 35.3Income per capita, US dollars 657Share of industry in GDP, % 67.3Water consumption, including km3 (%) 26.93 (100)
agriculture 1.66 (6.2) irrigation 6.2 (23) industry 13.5 (50.1) drinking water demands 4.64 (17.2) other demands 0.93 (3.5)
Land fund, icluding million ha 36 crops under cultivation % 55.3 forested area % 15.4 pastures and hay-fields % 12.4 under water % 4.0 perennial plantations % 1.8 wood-bush plantations % 1.5 swamps % 1.5 other lands % 8.1

UKRAINE
UNFCCC. The First National Communication 3-11
3.1 ClimateClimate of Ukraine is of moderate-continental type, except of narrow belt of Southern Coast of Crimea withfeatures of subtropic climate. Rather important factor of Ukraine climate formation is atmospheric circulation:prevailing western direction of air transfer presumes inflow of Atlantic air masses, from time to time air massesinvade territory of the country from Asia continent, from northern latitudes, from Mediterranean Sea.Differences in circulation conditions of the west and the east are clearly manifested in increase of continentalityof climate from the west to the east. In regions of Carpathian and Crimean Mountains changes of climaticelements depend greatly upon altitude of region and exposure of mountainsides: with increase of altitudeatmospheric pressure and temperature are lowered, amount of precipitation is increased, period of time withsnow cover becomes longer, wind speed is increased. Influence of Volyn�-Podol�sk Plateau and Donetsk Ridgeupon climatic conditions is of less significance. It results mainly in small decrease of temperature, changes ofduration of snow cover laying.Black and Azov Seas influence climate of Ukraine significantly too. Increase of air humidity and smoothing ofdiurnal cycle of air temperature are marked in coastal regions.In Polissya region the climate is temperate, humid and is characterised with prevailing transfer of Atlantic air.Western part of Polissya is featured with increased cloudiness in summer season, relatively cool summer, softwinter and excessive precipitation. Average temperature in January is -4...-5°C, while in eastern part it reaches -7...-8°C. The most severe winters are in eastern part of Polissya, where their duration is 20 days longerapproximately. Spring and autumn in Polissya are protracted, since inflow of humid sea air is accompanied withsignificant cloudiness and precipitation, which hinder air from heating in spring and its cooling in autumn.During summer seasons the lowest temperatures are observed in western part of Polissya, where averagetemperature in July is 17...18°C; to the east it increases up to 19...20°C. Annual precipitation makes 500 - 600mm. During warm period about 70% of total precipitation falls, while 30% are referred to cold period.Sometimes droughts and dry winds are marked in Polissya.Climate of Forest-Steppe zone is temperate continental. The lowest average temperatures of January areobserved in eastern Forest-Steppe (-7...-8°C); to the west they increase to -4...-6°C. Summer is warm: averagetemperature in July to the west of the zone is 18...19°C, while to the east it equals to 19...21°C. Annual totals ofprecipitation are decreased from 700 - 550 mm in western region to 575 - 500 mm in eastern region. In Forest-Steppe zone number of days with hot dry winds is increased in comparison with Polissya zone. In eastern regionsit approaches 11 days, in western - from 1 to 8 days.Region of steppe atlantic-continental climate occupies whole Steppe zone of Ukraine, including steppe part ofthe Crimea. Climate there is featured with the most continentality and aridity, when compared with other zonesof Ukraine. Summers are hot, winters are cold, in most cases with poor snowing. Average temperatures ofJanuary vary from -7°C in north-east to -2°C in south-east of the zone. Winters here are characterized withstrong thaws, followed often by sharp cooling. Average monthly temperature in July is 21...30°C. Annual totalsof precipitation are decreased from the north to the south. In southern regions of the zone they amount to 250 -300 mm. Ukrainian Steppe is a region with the least relative air humidity, therefore droughts, dry winds anddusty storms are marked here most frequently.In Carpathian Mountains significant rising of terrain causes sharp vertical zonality in distribution of climaticelements.Lower in altitude Crimean Mountains are characterized with vertical zonality as well.
3.2 EconomicsThe economy of Ukraine, up to declaration of independence in 1991, was developing as a part of an economicsystem of the USSR under circumstances of both central planning system and practically insulated markets of theUSSR and Comecon countries. Structure and levels of prices of goods and services differed from those on the worldmarket highly. The regional and global ecological problems were practically ignored.Proceeding from general economical interests of the former USSR and available natural resources potential toppriority was given to the development of heavy industrial sectors (Fuel & Energy Complex, Metallurgy, Machinery &Equipment) and Agriculture.In 1991 Ukraine set about restructuring of the economy towards the market development and democratic stateformation. However, the transient period turned very painful, and the country entered serious and growing economiccrisis, which was featured by the following:• drop of industrial output, especially in industries of low energy intensity, and, as a consequence, GDP decrease
and its energy intensity growth;• swelling problems of payment for critical energy carriers import, that determines constant negative external trade
balance and problem energy supply in the country;• steady rising budget deficit;• high inflation rates;• abrupt standard of living decrease for the most part of population;

UKRAINE
UNFCCC. The First National Communication 3-12
• social tension growth (Table 3�2).Table 3–2. Economics. GDP, Inflation and Unemployment Trends
1990 1991 1992 1993 1994 1995GDP, 109 $ 73.62 67.21 60.56 51.96 40.01 35.29Unemployment, thousand person - 9.8 128 180.9 216 126Inflation, % - - 1310 4830 990 420Source: Ministry of EconomyAt present, the economy escape from the crisis is considered to be connected with the following: productionstabilization and its following progress, privatization passage, legislation settling, improvement of taxation sphere andcurrency regulations, restoration of economic contacts with CIS countries and support of developed ones.
3.3 Energy UseUkraine belongs to high energy intensity countries. In 1990 specific energy consumption per GDP unit producedexceeded that of developed countries. For the posterior years this index has been dropping back due toconsiderable production fall in the country (Table 3�3).Table 3–3. Energy Intensity
1990 1991 1992 1993 1994 1995GDP, 109 $ 73.62 67.21 60.56 51.96 40.01 35.29Energy Consumption, PJ 10342.9 10017.7 8907.2 7931.5 6900.2 6630.6Energy Intensity, PJ per billion $ 141 149 147 152 172 188
High level of outdated and outworn energy intensive production together with low privatization rates andabsence of bankruptcy mechanism, deficiency of domestic fuel and energy resources, not sufficient amount ofcapital stock at enterprises and environmental problems have led to high energy cost levels, low efficiency ofsocial production and energy crisis deepening.Production decrease and energy recession have resulted in balance of payments crisis, external indebtednessgrowth and nonpayment problems aggravation. According to the Government estimates (as for the fall 1995),energy supply matter has transformed into the national security problem. Ukrainian trade balance for 1996showed that costs for raw stuff and materials for Fuel and Energy Complex made up more than 50%. Energycarriers deficit is covered mainly by import from Russia, that leads to the necessity of diversification of energycarriers import sources. In 1995 Ukrainian total needs in primary domestic energy resources were met for 40-50%, including coal - for 83%, gas - for 21%, oil - for 16% (Table 3�4). For the latest years, production of maintypes of energy resources, mainly coal, tends to decrease.Table 3–4. Primary Energy Production and Consumption
1990 1991 1992 1993 1994 1995Production
Coal (mln t) 130.7 108.7 105.4 91.0 75.9 65.6Oil (mln t) 5.3 4.9 4.2 4.1 4.0 4.1Natural gas (bln m3) 28.1 24.3 20.9 19.2 18.3 18.2Biomass (mln t) 4.3 4.0 3.7 4.1 4.0 3.9
ImportCoal (mln t) 21.1 12.7 11.7 8.7 7.5 16.0Oil (mln t) 54.3 49.6 35.3 19.7 15.8 13.3Natural gas (bln m3) 87.3 89.5 89.1 79.8 69.1 66.3Oil products (mln t) 11.5 13.1 5.0 6.2 6.5 9.5
ExportCoal (mln t) 20.0 13.7 7.8 3.5 4.6 2.4Oil products (mln t) 11.3 8.4 6.4 1.1 1.7 1.4
ConsumptionCoal (mln t) 131.8 107.7 109.3 96.2 78.8 79.2Oil and oil products (mln t) 59.6 59.2 38.4 29.0 24.8 25.4Pure natural gas (bln m3) 118.7 118.2 114.1 102.799 92.5 85.4Biomass (mln t) 4.3 4 3.7 4.1 4 3.9Power production and consumption structure in Ukraine have undergone considerable transformation. Totalpower production decreased from 296.3 to 192.5 bln kWh between the years 1990 and 1995 (Table 3�5), thoughfixed capacity did not change and made about 54.6 GWt, from these - 66.5% of electricity was generated at TPP,25% - at NPP, 8.5% - at HPP and HPSP. The heat generation dropped from 68% in 1990 to 56% in 1995.

UKRAINE
UNFCCC. The First National Communication 3-13
Table 3–5. Electric Power Production Trends, billion kWh1990 1991 1992 1993 1994 1995
Thermal Power Plants 201.7 182.5 162.4 135.9 115.8 107.0Hydropower Plants 10.7 11.9 8.1 11.2 12.3 10.1Blockstations 7.7 7.2 6.8 6.0 4.6 4.9Nuclear Power Plants 76.2 75.1 73.7 75.2 68.8 70.5TOTAL 296.3 276.7 251.0 228.3 201.5 192.5Balance with CIS countries 0.16 1.14 1.12 1.56 0.57 1.27Export excluding CIS -28.13 -15.44 -5.77 -2.71 -1.59 -4.10Export Netto -27.97 -14.31 -4.65 -1.15 -1.02 -2.83Total Consumption 268.33 262.39 246.35 227.15 200.48 189.67In electricity consumption volume, industry�s share decreased from 64% in 1990 to 54% in 1995, whileresidential sector�s share grew up from 9% to 19% (Table 3�6).Table 3–6. Electric Power Consumption Trends, billion kWh
1990 1991 1992 1993 1994 1995Industry 146.2 137.7 126.3 108.0 88.6 81.1Agriculture 20.5 20.7 19.1 18.4 16.8 13.6Transport 14.4 13.6 12.5 12.1 10.8 10.3Service 17.6 17.8 17.2 16.7 15.7 14.8Others 7.5 7.5 6.1 5.8 4.9 4.5TOTAL 206.2 197.3 181.2 161.0 136.8 124.3Household 21.1 24.2 24.9 26.9 26.8 27.0
Urban 17.5 17.4 18.0Rural 9.4 9.3 9.0
Total Netto 227.3 221.5 206.1 187.9 163.6 151.3Total Brutto 268.3 262.4 246.3 227.2 200.6 189.8Since 1991, the state has been paying much attention to the energy sector development. In 1994 UkrainianParliament adopted the Concept on Fuel and Energy Complex Development up to 2010; based on whichNational Energy Program of Ukraine was developed in 1996.The Concept and the Program determine energy policy of the state, its main priorities: energy conservation,domestic energy resources use, renewable energy sources development, targeted investments into strategic fieldsof the economy.To fulfill national energy conservation policy Ukrainian Parliament adopted Law of Ukraine �On EnergyConservation�, and special state body - State Committee for Energy Conservation was formed. The Governmentof Ukraine elaborated Comprehensive National Program on Energy Conservation, which was approved by theParliament in 1996.In 1995 Parliament of Ukraine approved Program of Restructuring of Ukrainian Economy, which envisagedconsiderable decrease of energy intensive production processes.As energy sector is under reformation, the problem of development and adoption of general economicregulations becoming more actual. Such regulations are designed for the functioning of state monopoly andcompetition in energy sector, state regulation (role and terms of licensing, terms for granting subsidies,concessions, energy carriers exchange functioning), improving taxation and price policy.
3.4 EnvironmentIn the former Soviet Union the environmental legislation was very poor. The Law of the Parliament �OnEnvironmental Protection� was among the first legislation acts of the independent Ukraine. Later the followinglegal provision was adopted by the Parliament of Ukraine: Law of Ukraine �On Protection ofAtmosphere�(1992), Law of Ukraine �On Wildlife� (1994), Law of Ukraine �On Changes and Amendments tothe Code of Ukraine with concern to Administrative Infringements�(1993), which empowers the bodies of theMinistry for Environmental Protection and Nuclear Safety of Ukraine to take legal steps in the case ofadministrative infringements in the field of environmental safety, Resolution of the Parliament of Ukraine �Onthe Red Book of Ukraine� (1992), Resolution of the Parliament of Ukraine �On Adopted Terms and Conditionsof Restriction, Temporary Suspension (Stoppage), or Cessation of Activities of Enterprises, Institutions,Organizations and Projects in the Case of their Infringement of the Law on Environmental ProtectionProvisions� (1992), Resolution of the Parliament of Ukraine �On Conditions of Import (or Transit) of WasteProducts and Utility Waste on the Territory of Ukraine� (1993), Law of Ukraine �On Changes and Amendmentsto the Criminal Code and Criminal Procedure Code of Ukraine� (1994), which specify criminal and fiduciary
UKRAINE
UNFCCC. The First National Communication 3-14
responsibilities for infringement of conditions of import (or transit) of waste products and utility wasteon the territory of Ukraine, Law of Ukraine �On Ecological Examination� (1995).Besides, some Decrees of the President of Ukraine were enforced, namely: �On Protection and Development ofNatural Reserves of Ukraine� (1993), �On Wildlife Reserves in Ukraine� (1993).In 1997 the National Climate Program was adopted by the Cabinet of Ministries.

UKRAINE
UNFCCC. The First National Communication 4-15
4. GREENHOUSE GAS INVENTORYCentral to any study of climate change is the development of an emission inventory that identifies and quantifiesa country�s primary sources and sinks of GHG. The inventory process is important for two reasons: (1) itprovides a basis for the ongoing development of a comprehensive and detailed methodology for estimatingsources and sinks of greenhouse gases, and (2) it provides a common and consistent mechanism that enables allsignatory countries to the United Nations� Framework Convention on Climate Change to estimate emissions andto compare the relative contributions of different emission sources and greenhouse gases to climate change.Moreover, systematically and consistently estimating emissions at the national and international levels is aprerequisite for evaluating the cost-effectiveness and feasibility of pursuing possible mitigation strategies andadopting emission reduction technologies.This chapter summarizes the sources and sinks of Ukraine GHG emissions and uptakes. The emission estimatespresented here were calculated using the IPCC Guidelines for National Greenhouse Gas Inventories [6, 18], toensure that the emission inventories submitted to the Framework Convention are consistent and comparableacross sectors and among nations. Ukraine has followed these guidelines, except where more detailed data ormethodologies were available for major sources of emissions.
4.1 Ukrainian Greenhouse Gas EmissionsGreenhouse gases include carbon dioxide (CO2), methane (CH4), nitrous oxide (N2O), water vapor and ozone(O3) directly contributing to the greenhouse effect.Chlorofluorocarbons (CFCs), a family of human-made compounds, its substitute hydrofluorocarbons (HFCs),and other compounds, such as perfluorinated carbons (PFCs), are also greenhouse gases. In addition, there areother �photochemically important� gases, such as carbon monoxide (CO), oxides of nitrogen (NOx), andnonmethane volatile organic compounds (NMVOCs) that are not greenhouse gases, but contribute indirectly tothe greenhouse effect. These are commonly referred to as �tropospheric ozone precursors� because theyinfluence the rate at which ozone and other gases are created and destroyed in the atmosphere.Although carbon dioxide, methane, and nitrous oxide occur naturally in the atmosphere, their recent atmosphericbuild-up appears to be largely the result of human activities. This build-up has altered the composition of theEarth�s atmosphere and may affect future global climate. Since 1800, atmospheric concentrations of carbondioxide, methane and nitrous oxide have increased by 30, 145 and 15 percent respectively [18].Use of chlorofluorocarbons is phased out under the 1987 Montreal Protocol on Substances That Deplete theOzone Layer.Ukrainian Inventory carrying out in accordance with UN FCCC commitments, touches upon three direct GHG:carbon dioxide (CO2), methane (CH4), nitrous oxide (N2O) and three �photochemically important� gases: carbonmonoxide (CO), oxides of nitrogen (NOx), and nonmethane volatile organic compounds (NMVOCs).The concept of global warming potential (GWP) has been developed to compare the abilities of each greenhousegas to trap heat in the atmosphere. Carbon dioxide was chosen as the �reference� gas. Gases are presented inunits of gigagrams of carbon equivalent (Gg CE). Carbon comprises 12/44 of carbon dioxide by weight.The GWP of a greenhouse gas is a ratio of global warming - or radiative forcing (both direct and indirect) - fromone kilogram of a greenhouse gas to one kilogram of carbon dioxide over a period of time. This report uses the100-year GWPs recommended by the IPCC (Table 4�1).Table 4–1. Global Warming Potential of Greenhouse Gases, 100 Years
Gas GWPCarbon Dioxide 1Methane 21Nitrous Oxide 310The Ukrainian inventory deals with the following five categories of GHG sources and sinks: energy systems(including transportation), industrial processes, agriculture, forestry and land-use change, and wastes.The current Ukraine Greenhouse Gas Inventory for 1990 is summarized in Table 4�2. The totals presented in thesummary tables in this chapter may not equal the sum of the individual source categories due to rounding. Forthe base year total GHG emissions were 232 882 Gg of carbon equivalent. CO2 emissions were partly offset byan uptake of carbon in Ukrainian forests of 14 175 Gg of carbon equivalent in 1990.
Table 4–2. Ukrainian Greenhouse Gas Emissions, 1990, GgGas/Source Emissions
(FullMolecular
Emissions(Direct and
Indirect Effects;

UKRAINE
UNFCCC. The First National Communication 4-16
Weight) CarbonEquivalent)
Greenhouse GasesNet Carbon Dioxide 648 131 176 763
Fossil Fuel Combustion 668 332 182 272Industrial processes 31 775 8 666Total 700 107 190 938Forestry (sink) -51 976 -14 175
Methane 9 453 54 140Energy 6 265 35 881Agriculture 2 254 12 909Waste 934 5 349
Nitrous Oxide 23.412 1 979Energy 6.708 567Chemistry 6.160 521Waste 0.132 11Forest fires 0.175 15Agricultural soils 10.237 865
Photochemically Important GasesCarbon Monoxide (CO) 7 481 -Nitrogen Oxides (NOX) 1 243 -Nonmethane Volatile Organic Compounds (NMVOCs) 656 -Net Emissions 232 882Figure 4-1 illustrates the relative contribution of the primary greenhouse gases to Ukrainian emissions in 1990.The shares of different sectors in GHG emissions are presented at the Figure 4-2.
54140
700107
-14175
232882
1.06
-100000
0
100000
200000
300000
400000
500000
600000
700000
800000
Nitrous oxideMethaneCarbon dioxideCarbon dioxide sinksNet emissions
Figure 4-1. Greenhouse Gases emissions in 1990, Gg

UKRAINE
UNFCCC. The First National Communication 4-17
Carbon Dioxide
5%
95%
Fossil Fuel Combustion
Industrial processes
Methane
10%
66%24%
EnergyAgricultureW aste
Nitrous Oxide
29%44%
1% 1%26%
EnergyChemistryW asteForest firesAgricultural soils
Figure 4-2. Sources of Greenhouse Gases in 1990, %Due largely to fossil fuel consumption, carbon dioxide emissions accounted for the largest share -approximately 76 percent. Methane accounted for 23 percent of total emissions, which included contributionsfrom agricultural activities and landfills, among others. The nitrous oxide emissions are less importantcomprising 1 percent of total emissions.The emissions of the photochemically important gases CO, NOx, and NMVOCs are not included in Figure 4-2,because there is no agreed-upon method to estimate their contribution to climate change. These gases only affectradiative force indirectly.Statistical data for the development of the National GHG Emission Inventory for 1990 were collected andanalyzed according to the IPCC Methodology. Official statistical data from Ukrainian Ministries andDepartments were used. Information gaps in several emission source categories have produced a high level ofuncertainty in the results. All statistical data used and emission assessments have previously appeared in officialUkrainian publications [14].The following sections present the anthropogenic sources of greenhouse gas emissions, briefly discuss theemissions pathway, summarize the emissions estimates, and explain the relative importance of emissions fromeach source category.
4.2 Energy Sector and TransportationFuel combustion and fugitive emissions from fuels were considered in category �Energy sector andtransportation� as the main sources of greenhouse gases.After the disintegration of the Union of Soviet Socialist Republics (USSR), the most important problem forUkraine was dependence from energy import. However, for the last few years, domestic fossil fuel productionhas been diminishing steadily. Coal production decreased from 164.2 million metric tons (MMT) in 1990 to 130MMT in 1994; oil production decreased from 5.2 MMT in 1990 to 4.2 MMT in 1993; and natural gas productiondecreased from 19.8 billion m3 in 1990 to 19.4 billion m3 in 1993 [11,21]. Despite the low level of domestic oilproduction, Ukraine has large facilities for oil refining, which are capable of processing 60 MMT of oil per year[11,15]. Gas is transported from Russia to a number of European countries through the Ukrainian territory at arate of more than 100 billion m3 per year.In 1990 total fossil fuel consumption in Ukraine totaled 9,365.73 PJ (Table 4�3). The main consumers of fuelare electricity and heat production, and industry (Figure 4-3).Table 4–3. Fossil Fuel Consumption in Ukraine by Sectors
Sector PJ PercentEnergy 4,046.33 43.20Industry 2,834.39 30.26Transportation 791.78 8.45Agriculture 325.14 3.47Household & Services 1,263.31 13.49Others 104.78 1.12Total 9,365.73 100

UKRAINE
UNFCCC. The First National Communication 4-18
8%
3%
13%1%
43%
30%
EnergyIndustryTransportationAgricultureHousehold&ServicesOthers
Figure 4-3. Fossil Fuel Consumption by Sectors in UkraineThe 1990 Energy Balance of Ukraine [15] was the main source of statistical data of fuel consumption. However,the types of fuel and sectors included in this document differ from the IPCC Methodology. Therefore specialsoftware was designed to reformat the official statistical data according to the IPCC worksheets format; tocalculate fuel production, import, export, and other parameters; and to transform the data into the units used bythe IPCC.Carbon dioxide (CO2) emissions for 1990 were estimated according to both the "bottom-up" and "top-down"methods. The bottom-up method used data on fuel and energy resources consumed in seventeen sectors of theUkrainian economy. The top-down method used data on total values of fuel consumption. Carbon dioxideemission factors were taken from the IPCC Methodology [6].Estimates of emissions from fuel combustion are presented in Table 4�4. Non-CO2 emission assessments weretaken from national statistical information [13] for stationary sources.Table 4–4. GHG Emissions for Fossil Fuel Combustion for stationary sources, Gg
Source CO2 CH4 N20 CO NOx NMVOCsFuel Combustion 668,332.0 35.6 6.7 3,273.0 760.7 265.1Methane emission factors for fuel production, transportation, and primary processing were assessed according toUkrainian experts data and IPCC Guidelines. Table 4�5 presents CH4 emission estimates in Ukraine for 1990,and Table 4�6 - the corresponding emission factors. In order to account Ukrainian circumstances minimum andmaximum emissions and emission factors were calculated by national experts.
Table 4–5. CH4 Emissions for the Fuel Production, Transportation, Processing and Storage in Ukraine, GgSources Base Minimum Maximum
Coal 2,784.87 2,180.35 3,610.12Oil and gas 3,444.52 1,696.38 4,558.65Total 6,229.39 3,876.73 8,168.77Table 4–6. CH4 Emission Factors for the Production, Transportation, Processing, and Storage of Fossil Fuels inUkraine
Activity Units Emissions FactorUnderground mining
Coal mining (Donetsk Basin) m3 CH4/t 25.5Coal mining (Lviv-Volyn Basin) m3 CH4/t 12.8Postmining activity m3 CH4/t 2.0
Surface miningCoal mining m3 CH4/t 1.2Postmining activity m3 CH4/t 0.2
Oil-refining systemsProspecting and drilling kg CH4/drill-hole no dataProduction kg CH4/PJ 4,500Transportation kg CH4/PJ 745

UKRAINE
UNFCCC. The First National Communication 4-19
Activity Units Emissions FactorProcessing kg CH4/PJ 1,000Storage kg CH4/PJ 180
Natural gas systemsExtraction kg CH4/PJ 450,000Processing, distribution, and storage kg CH4/PJ 600,000Venting and Flaring kg CH4/PJ 14,000
There are no published statistical data on GHG emissions from mobile sources in Ukraine for 1990. The mainsource of emissions is road vehicles, which in 1990 consumed more than 10 MMT of petroleum, 14 MMT ofdiesel fuel, about 48 thousand metric tons of propane-butane, and 284 million m3 of natural gas [3]. Roadvehicles in Ukraine have a very low fuel efficiency; they use 1.4 to 1.5 times more fuel than similar automobilesand buses in developed countries. Consequently, GHG emissions per km are higher. Table 4�7 presentsestimates of GHG emissions from mobile sources.Table 4–7. GHG Emissions from Mobile Sources in Ukraine
Source Annual FuelConsumption
Aggregate EmissionFactors (g/kg)
Total Emissions (Gg)
(103 tons) CO NOx NMVOCs CO NOx NMVOCs
Heavy-Duty TrucksGasoline 5,184.00 400 40 36 2,073.60 207.36 186.62Diesel 2,560.00 20 20 5 51.20 51.20 12.80Butane 31.70 150 25 30 4.76 0.79 0.95Natural gas 162.40 140 22 25 22.74 3.57 4.06
CarsGasoline 3,800.00 400 40 36 1,520.00 152.00 136.80Natural gas 12.00 150 25 30 1.80 0.30 0.36
BusesGasoline 1,301.00 400 40 36 520.40 52.04 46.84Diesel 320.00 20 20 5 6.40 6.40 1.60Butane 4.40 150 25 30 0.66 0.11 0.13Natural gas 29.14 140 22 25 4.08 0.64 0.73Total 4,205.64 474.41 390.89
4.3 Industrial ProcessesGreenhouse gas emissions from industrial processes were calculated according to the IPCC Methodology [6, 18].The following industrial chemical processes were considered: nitric acid manufacture [2], adipic acidmanufacture [9], CO2 production and use (the main source is ammonia manufacture, the main consumer iscarbamide manufacturing), cement production (calculations were based on clinker production volume), limeproduction and use (the main consumers are the sugar industry and construction), limestone use (the mainconsumers are iron and steel production [20], and glass manufacture), and soda manufacture and use.Emission estimates for carbon dioxide and nitrogen oxides (Table 4�8 and Table 4�8) are based on statisticaldata on production volumes [14] and national emission factors obtained from stoichiometric equations forchemical reactions.Table 4–8. CO2 Emissions from Industrial Processes in Ukraine, Gg
Source EmissionsCement production 8,745.31Lime manufacture and use 4,531.40Soda manufacture and use 987.41Limestone and Dolomite use 10,968.95CO2 use and production 6,543.38Total 31,776.45
Table 4–9. NOx Emissions from Nitric and Adipic Acids Production in Ukraine, Gg
UKRAINE
UNFCCC. The First National Communication 4-20
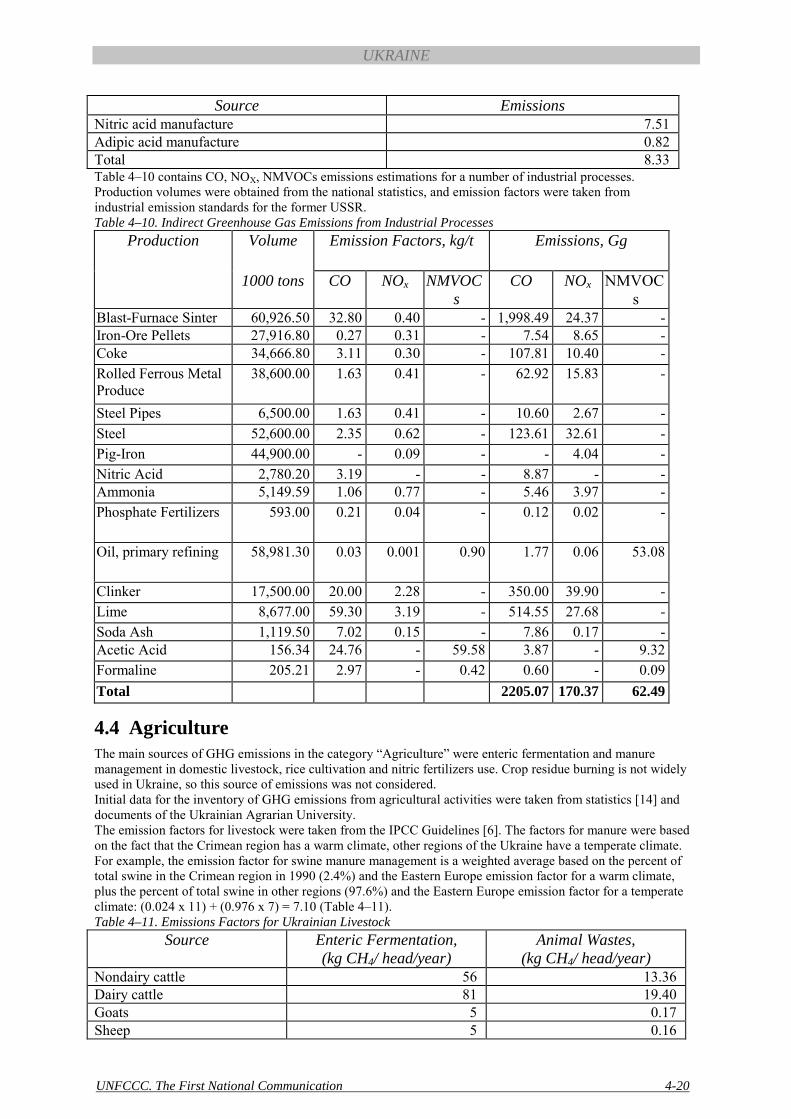
Source EmissionsNitric acid manufacture 7.51Adipic acid manufacture 0.82Total 8.33Table 4�10 contains CO, NOX, NMVOCs emissions estimations for a number of industrial processes.Production volumes were obtained from the national statistics, and emission factors were taken fromindustrial emission standards for the former USSR.Table 4–10. Indirect Greenhouse Gas Emissions from Industrial Processes
Production Volume Emission Factors, kg/t Emissions, Gg
1000 tons CO NOx NMVOCs
CO NOx NMVOCs
Blast-Furnace Sinter 60,926.50 32.80 0.40 - 1,998.49 24.37 -Iron-Ore Pellets 27,916.80 0.27 0.31 - 7.54 8.65 -Coke 34,666.80 3.11 0.30 - 107.81 10.40 -Rolled Ferrous MetalProduce
38,600.00 1.63 0.41 - 62.92 15.83 -
Steel Pipes 6,500.00 1.63 0.41 - 10.60 2.67 -Steel 52,600.00 2.35 0.62 - 123.61 32.61 -Pig-Iron 44,900.00 - 0.09 - - 4.04 -Nitric Acid 2,780.20 3.19 - - 8.87 - -Ammonia 5,149.59 1.06 0.77 - 5.46 3.97 -Phosphate Fertilizers 593.00 0.21 0.04 - 0.12 0.02 -
Oil, primary refining 58,981.30 0.03 0.001 0.90 1.77 0.06 53.08
Clinker 17,500.00 20.00 2.28 - 350.00 39.90 -Lime 8,677.00 59.30 3.19 - 514.55 27.68 -Soda Ash 1,119.50 7.02 0.15 - 7.86 0.17 -Acetic Acid 156.34 24.76 - 59.58 3.87 - 9.32Formaline 205.21 2.97 - 0.42 0.60 - 0.09Total 2205.07 170.37 62.49
4.4 AgricultureThe main sources of GHG emissions in the category �Agriculture� were enteric fermentation and manuremanagement in domestic livestock, rice cultivation and nitric fertilizers use. Crop residue burning is not widelyused in Ukraine, so this source of emissions was not considered.Initial data for the inventory of GHG emissions from agricultural activities were taken from statistics [14] anddocuments of the Ukrainian Agrarian University.The emission factors for livestock were taken from the IPCC Guidelines [6]. The factors for manure were basedon the fact that the Crimean region has a warm climate, other regions of the Ukraine have a temperate climate.For example, the emission factor for swine manure management is a weighted average based on the percent oftotal swine in the Crimean region in 1990 (2.4%) and the Eastern Europe emission factor for a warm climate,plus the percent of total swine in other regions (97.6%) and the Eastern Europe emission factor for a temperateclimate: (0.024 x 11) + (0.976 x 7) = 7.10 (Table 4�11).Table 4–11. Emissions Factors for Ukrainian Livestock
Source Enteric Fermentation,(kg CH4/ head/year)
Animal Wastes,(kg CH4/ head/year)
Nondairy cattle 56 13.36Dairy cattle 81 19.40Goats 5 0.17Sheep 5 0.16

UKRAINE
UNFCCC. The First National Communication 4-21
Swines 5 7.10Horses 5 0.61The IPCC Methodology was used for estimating GHG emissions from rice cultivation. Three regions in Ukraine(the Crimean, Herson, and Odessa regions), have small areas under rice cultivation. The total harvested area in1990 was 0.0281 Mha. The emission factor was defined using an average temperature of 25°C. The averagegrowing period is 103 days.Table 4�12 presents CH4 emissions from agriculture in Ukraine in 1990.Table 4–12. CH4 Emissions from Agriculture in Ukraine, 1990
Source CH4 Emissions, GgEnteric Fermentation 1,702.63Manure Management 536.40Rice Cultivation 15.17Total 551.570Assessments of N2O emissions from nitric fertilizers were based on the IPCC Methodology and nationalstatistics and totaled 10.237 Gg.
4.5 Forestry and Land-Use ChangeIn forestry and land-use change, CO2 is mainly emitted as a result of the decay of damaged aboveground biomassand the burning of biomass at harvesting; and forest fires. Forests also sequester carbon (C) in the process ofphotosynthesis.Several activities included in the IPCC Methodology for the forestry and land-use change category do not playany significant role in Ukraine. These include conversion of forest to agricultural land, conversion of grasslandsand pastures, and abandonment of managed lands, excluding the abandonment zone in the Chernobyl region.Emissions and uptake of CO2 from forest management and afforestation of Chernobyl zone were estimatedaccording to the IPCC Methodology [6]. For the calculation of the aboveground biomass growth rate, the C ratioin dry matter, and the wet-to-dry wood-weight ratio, data from national statistical publications were used [7, 8,10, 19].A method similar to the IPCC for forest clearing was used to estimate CO2 emissions from forest fires. The dif-ference between brush fires, which primarily destroy forest floor, and top fires, which destroy the tree layer, wastaken into account. Average CO2 emissions and uptake estimates were obtained for 1990 through an analysis offorest fires during a 9-year period (1986-1994).Table 4�13 shows the estimates of CO2 emissions and uptake from forestry and land-use management.Table 4–13. CO2 Emissions and Removals in the Category “Land Use Change and Forestry”
Source CO2 Emissions and Removals, GgForest Managed -72,321.3Harvests 20,683.7Forest Fires 81.8Abandonment of Lands -420.6Total -338.8
4.6 WasteThe IPCC Methodology [6] was used to determine CH4 emissions from solid and liquid wastes.One of the most important ecological problems in Ukraine is MSW management, annual increment of solidwastes totals 1.5 to 2% [16, 17]. According to national statistics, MSW was estimated to be 11 million tons in1990, about 8% of which was treated on incineration plants in Kyiv, Kharkov, and Sevastopol. Methane was notrecuperated from landfills in Ukraine in 1990 and CH4 emissions from MSW totaled 885.5 Gg.N2O emissions from solid waste incineration were estimated according to IPCC methodology. The volume ofincineration totaled 880 thousand tons, emission factor was taken as the average value of 26-270 grams of N2Oper ton of waste. N2O emissions from waste incineration totaled 0.13 Gg in 1990.Under Ukrainian conditions, rural wastewater decomposes under aerobic conditions. Therefore only urbanwastewater was taken into account. In 1990, 3,684 million m3 of municipal wastewater were made in Ukraine, ofwhich 3,597 million m3 (97%) were processed in sewage disposal facilities [12]. Wastewater treated underanaerobic conditions accounts for 15% of the total wastewater in Ukraine. To calculate CH4 emissions frommunicipal wastewater, biochemical oxygen demand (BOD) in municipal wastewater was defined as 0.05kg/person/ day. Applying the IPCC CH4 emission factor of 0.22 Gg CH4/Gg BOD, emissions from municipal
UKRAINE
UNFCCC. The First National Communication 4-22
wastewater were estimated as 40.7 Gg CH4. Taking into account recuperation of 6.24 Gg CH4 onsewage disposal facilities in Kyiv and Kharkov [4], methane emissions from liquid wastes totaled 34.46 Gg.Table 4�14 presents the results of the emissions assessment for industrial wastewater.Table 4–14. CH4 Emissions Assessment for Industrial Wastewater in Ukraine
Industry Annual Wastewater,million m3
Wastewater Treated atDisposal Facilities,
million m3
CH4 AnnualEmission, Gg
Iron and steel 1,790.0 755.0 1.08Nonferrous metals 25.9 11.1 0.02Fertilizer 537.5 320.1 1.94Food and beverages 197.4 68.7 5.08Pulp and paper 102.1 93.6 1.04Petrochemical 26.5 14.9 0.41Textiles 31.8 31.5 0.94Miscellaneous* 85.8 3.60Total 1,380.70 14.11* Microbiologic industry, transport, construction, and building materials production are accounted.
4.7 References1. Annual Report of the State Statistical Committee of Ukraine. 1993. Economy of Ukraine in 1992.
Kyiv.2. Atroshchenko, V. I., and S. I. Kargin. 1980. The Nitric Acid Technology. Chemistry, Moscow.3. Bykov, G. A., I. N. Karp, and A. I. Pyatnichko. 1993. The concept of balanced production and
liquid and gaseous hydrocarbonic motor fuels consumption in Ukraine. Journal of Ecotechnologiesand Resources Saving 4:9-13.
4. Horudgy, P. D. 1993. Exploitation of Water Supplying Systems and Sewer System. Science,Kyiv.
5. IPCC (Intergovernmental Panel on Climate Change). 1992. Climate Change 1992, TheSupplementary Report to the IPCC Scientific Assessment. Cambridge University Press, Cam-bridge. 200.
6. IPCC/OECD (Intergovernmental Panel on Climate Change/ Organization for EconomicCooperation and Development) Joint Programme. 1994. IPCC Draft Guidelines for NationalGreenhouse Gas Inventories. IPCC/OECD Joint Programme, Paris. 3 Volumes.
7. Ministry of Forestry. 1989. Forestry of Ukrainian SSR. Kyiv.8. Molchanov, A. A. 1971. Productivity of Forest Biomass for Different Zones. Science, Moscow.
276.9. Novitsky, V. S. 1994. The concept of Ukrainian chemical industry reconstruction with account of
its resource potential. Journal of Chemical Industry of Ukraine 1:4.10. Regulative and Reference Materials for Taxation of Forestry of Ukraine and Moldova. 1987.
Harvest, Kyiv.11. Shpack, P.P., and B.L. Krups'ky. 1995. Oil and gas supplying problems in Ukraine. Journal of
Energy Conservation Problems 1:15-20.12. State Committee For Water Resources of Ukraine. 1991. The Report on Water Resources in
Ukraine for 1990. Kyiv.13. State Statistical Committee of Ukraine. 1991a. Atmospheric Air Protection in Ukraine for 1990.
Kyiv.14. State Statistical Committee of Ukraine. 1991b. Economy of Ukraine in 1990. Kyiv.15. State Statistical Committee of Ukraine, 1991c. Energy Balance of Ukraine for 1990. Kyiv.16. State Statistical Committee of Ukraine. 1991d. The National Report on Environment of Ukraine.
Kyiv.17. State Statistical Committee of Ukraine. 1991e. Ukrainian Production. Kyiv.18. UNEP, OECD, IEA, IPCC (United Nations Environment Programme, Organization for Economic
Cooperation and Development, International Energy Agency, Intergovernmental Panel on ClimateChange). 1995. IPCC Guidelines for National Greenhouse Gas inventories. IPCC, Bracknell. 3Volumes.
19. Usol'tsev, V. A. 1985. Structure and Dynamic of Phytomass of Timber Stands. Forestry,Krasnoyarsk.
20. Vegmon, E.F. 1989. Metallurgy of Iron. Metallurgy, Moscow.

UKRAINE
UNFCCC. The First National Communication 4-23
21. Zabigajlo, V.E. 1995. Ukrainian coal industry development. Journal of EnergyConservation Problems 1:3-7.
22. Country study on Climate Change in Ukraine: Development of Greenhouse Gas EmissionsInventory. Final Report. Agency for Rational Energy Use and Ecology, Kyiv, 1995.
23. Country study on Climate Change in Ukraine: Development of Greenhouse Gas EmissionsInventory. Final Report. (Supplement). Agency for Rational Energy Use and Ecology, Kyiv, 1995.

UKRAINE
UNFCCC. The First National Communication 5-24
5. POLICIES AND MEASURES TO MITIGATECLIMATE CHANGE
5.1 Overall policy contextIn the last time the whole number of programs for the economic development of Ukraine was elaborated
and adopted, the most important of them were as follows:1. National Energy Program [1];2. Program of Restructuring of Ukrainian Economy [2];3. Comprehensive State Energy Conservation Program of Ukraine [3];4. National Development Programs of Industrial Sectors [4-9].
These documents were assumed as a basis for forming the baseline scenario of the development of economy andits sectors, for assessing projected GHG emissions and mitigation measures.In correspondence with the baseline scenario of the economic development it is planned to provide main indicesof the socio-economic development of the country (Table 5�1) in the period considered, up to 2015.Table 5–1. The main indices of socio-economic development of Ukraine till 2015
Indices 1990 1995 2000 2005 2010 2015GDP, billion $ 73.62 35.26 41.30 58.82 84.07 97.17GDP, % 100.0 47.9 56.1 79.9 114.2 132.0Fuel combustion, PJ 9246.3 5531.5 6965.1 7557.7 8022.5 8551.9Population, million 51.9 51.5 50.2 51.0 51.5 51.8Housing fund, million m3 922.1 978.5 1018.5 1169.6 1255.0 1360.5Alongside with the baseline scenario the indices for the optimistic and pessimistic scenarios of the economicdevelopment were forecasted. These scenarios differ in terms of crisis peak, duration of economic recovery andfurther rate of development.An active and consistent reformation and large-scale economic restructuring (firstly in high intensive industrialsectors) and the increase of its liquidity, considerable increase of Ukrainian goods competitiveness, promotion ofenergy saving problem in Ukraine are projected in the baseline scenario.The performance of a balanced financial policy is envisaged. Reforms towards simplifying taxation system,expansion of its base and achieving GDP re-distribution through the state budget up to an ultimate level of 40%of GDP is forecasted.The increase of budget expences effectiveness, the reduction of dotations and capital transfers structureoptimisation are envisaged in budget policy as well as the support of budget deficit at a minimal level (not morethan 3.5% from GDP). Realization of money-credit policy should provide the achievement of moneystabilization, support of credit system, stimulation of credits towards long-term investment as well as the supportof productions, which provide a deep transformation of national mineral-raw resources and build-up the outputof import replacing products and export potential of the country.In correspondence with the forecast of the development of material production sectors in 2001-2005 according tooptimistic assessment the accelerated development of metallurgy, chemical and petrochemical industry as well asmachine building is envisaged.Such character of structural shifts will be reflected to a certain extent on the increase of volumes andinfrastructure of energy consumption. The change of economic conditions for sectors functioning is alsoprojected, and first of all, the introduction of an active state regulation of energy resources consumption,realization of energy saving measures.Acceleration of service sector development, in the first turn, due to the development of paid services of thefinancial economic sector, the increase of a specific weight of paid services in socio-oriented economic sectors,appearence of new types of services, connected with the expansion of informational exchange, etc., areenvisaged.According to optimistic projections of the national economy development positive changes will take place in theperiod forecasted due to a relative reduction of energy resources import and increase of the Ukrainian coalexport. Under these conditions it is possible to achieve a positive net export (1% of GDP) till 2000 with itsfurther growth up to 2% in 2005.The performance of an active state policy regarding a stimulation of export production in Ukraine is forecasted.The analysis shows, that in the years of crisis the less production recession was marked in those sectors, whichhave an access to external trade markets. Under the limited domestic demand of some sectors� products it wasexport-oriented production which allowed to avoid their degradation. To regulate export production the forecastenvisages the revision of production structure, active search of new external markets and restitution of lost ones,structural and technological rehabilitation of production. Mutual coordination of scientific-technical policy withthe policy of currency, external economic and taxation-budget regulation should be provided.

UKRAINE
UNFCCC. The First National Communication 5-25
Forecast show, that in 1998-2010 a real achievement of economic stabilization with a furtherdevelopment of the country economy is possible. This conclusion is based on economic potential for thedevelopment of a number of sectors (agriculture, metallurgy, machinery and equipment, light industry) as well ason the possibility of a gradual solution of energy supply problem in the country.Activization of investment processes through the increase of a share of basic capital cumulation in a total volumeof capital creation should be important for a forecasted period.Country�s withdrawal from crisis is possible only in conditions of the activization of a positive state influence onthe production and social processes towards all-round stimulation of producers and strengthening a real socialdefence of population.
5.2 Overall mitigation potentialTwo groups of mitigation measures were considered in mitigation analyses: policy instruments and
technological options (Table 5�2).

UKRAINE
UNFCCC. The First National Communication 5-26
Table 5–2. The assessments of mitigation options till 2015Annual GHG emissions reduction, Gg Cost ratio of
the option(capital
investmentcumulative for
the period )/Direct Benefit
(annual)
Indirect economicimpacts
Consistency with nationalenvironmental goals
Potentialeffective-ness ofimple-
mentationpolicies
Sustain-ability ofoptions
Consistencywith nationaldevelopment
goals
Data availability forevaluation
Option CO2 CH4 N2O C thousanddollars USAper Tg-CE
Increasein
domesticemploy-
ment
Decreasein importpayments
Reducingemissions
of airpollutants
Effectivenessin limi-ting
otherenvironmen-tal impacts
Tecnologycharacte-rization
Cost ofimplemen-
tationprograms
Energy consumptionmeasurement
17114.3 0.383 0.161 4683.3 26.289 High High Medium Low High High High High Low
DSM 4315.78 0.097 0.041 1181.1 70.892 High Medium Medium Low High High High High LowIndustrial processes 1078 156 10.25 2054.0 100.553 Low High Medium Medium Medium High High High LowEnergy saving, 230671 5.167 2.17 63123.3 335.458 Low High High Medium Medium High High High Lowincludingcross sectoral: 59528 1.333 0.56 16289.9 120.934 Low High High Medium Medium High High High Lowefficiency lightingequipment
4836.65 0.108 0.046 1323.6 8.930 High High High Medium High High High High Low
motor drive systemsimprovement
26415.55 0.592 0.249 7228.7 17.305 High High High Medium High High High High Low
efficient combustionof poor fuel
1302.175 0.029 0.012 356.3 732.601 High High High Medium Low High High High Low
improvement of heatsupply systems
10789.45 0.242 0.102 2952.6 260.880 Low High High Medium Medium High High High Low
utilization ofsecondary energyresources
12649.7 0.283 0.119 3461.6 199.604 Low High High Medium Medium High High High Low
sectoral: 168724.7 3.779 1.587 46171.6 414.938 Low High High Medium Medium High High High Lowenergy saving inFuel&EnergyComplex,
35344.75 0.792 0.333 9672.2 581.395 Low High High Medium Low High High High Low
including:optimization ofstructure of
21578.9 0.483 0.203 5905.1 717.360 High High High Medium Low High High High Low

UKRAINE
UNFCCC. The First National Communication 5-27
Annual GHG emissions reduction, Gg Cost ratio ofthe option(capital
investmentcumulative for
the period )/Direct Benefit
(annual)
Indirect economicimpacts
Consistency with nationalenvironmental goals
Potentialeffective-ness ofimple-
mentationpolicies
Sustain-ability ofoptions
Consistencywith nationaldevelopment
goals
Data availability forevaluation
Option CO2 CH4 N2O C thousanddollars USAper Tg-CE
Increasein
domesticemploy-
ment
Decreasein importpayments
Reducingemissions
of airpollutants
Effectivenessin limi-ting
otherenvironmen-tal impacts
Tecnologycharacte-rization
Cost ofimplemen-
tationprograms
generating capacities,technologicalimprovementshigh efficiency gassupply system
2604.35 0.058 0.025 712.7 241.838 Low High High Medium Medium High High High Low
up-to-datetechnologies of coalproduction
2046.28 0.046 0.019 559.9 413.394 Low High High Medium Medium High High High Low
energy saving inindustry,
76642.3 1.717 0.721 20973.2 422.654 Low High High Medium Medium High High High Low
including:energy saving inmetallurgy
19346.6 0.433 0.182 5294.2 372.024 Low High High Medium Medium High High High Low
energy saving inmechanicalengineering
6324.85 0.142 0.060 1730.8 483.793 Low High High Medium Medium High High High Low
energy saving inchemical industry
8557.15 0.192 0.081 2341.7 368.053 Low High High Medium Medium High High High Low
energy saving inconstructing materialsindustry
6696.9 0.15 0.063 1832.6 180.050 Low High High Medium Medium High High High Low
energy saving in foodindustry
13393.8 0.3 0.126 3665.2 167.954 Low High High Medium Medium High High High Low
energy saving inothers industrialsectors
22323 0.5 0.21 6108.7 666.667 Low High High Medium Low High High High Low
Energy saving inconstructing sector
930.125 0.021 0.009 254.6 251.509 Low High High Medium Medium High High High Low

UKRAINE
UNFCCC. The First National Communication 5-28
Annual GHG emissions reduction, Gg Cost ratio ofthe option(capital
investmentcumulative for
the period )/Direct Benefit
(annual)
Indirect economicimpacts
Consistency with nationalenvironmental goals
Potentialeffective-ness ofimple-
mentationpolicies
Sustain-ability ofoptions
Consistencywith nationaldevelopment
goals
Data availability forevaluation
Option CO2 CH4 N2O C thousanddollars USAper Tg-CE
Increasein
domesticemploy-
ment
Decreasein importpayments
Reducingemissions
of airpollutants
Effectivenessin limi-ting
otherenvironmen-tal impacts
Tecnologycharacte-rization
Cost ofimplemen-
tationprograms
Energy saving inagriculture
11161.5 0.25 0.105 3054.4 370.920 Low High High Medium Medium High High High Low
Energy saving inresidential sector
24183.3 0.542 0.228 6617.8 115.354 Low High High Medium Medium High High High Low
Energy saving intransport sector
20462.8 0.458 0.193 5599.7 483.793 Low High High Medium Medium High High High Low
Implementation of 3GW at NPPs
14882 0.333 0.14 4072.5 Uncertain High High Low Low Low High High High Uncertain
Untraditionalresources
42785.8 0.958 0.403 11708.4 715.308 Medium High High Medium Low High High High Low
Reducing methaneemissions in coalmining
0 710 4066.4 82.163 Medium Medium Uncertain Uncertain High High High High Low
Shift from oil motorfuel to gas
1850 1.115 0.06 516.0 668.449 Low Medium High Uncertain Low High High High Low
Reduction of leaks ingas systems
0 1400 0 8018.2 0.595 Low Medium Medium Uncertain High High High High Low
Waste treatment 0 540 -0.9 3016.6 330.797 Medium Low Uncertain Medium Medium High High High LowInstallation ofequipment forprocessing of wastewater sediment
0 19 0 108.8 2985.075 Medium Low High High Low High High High Low
Set of measures forNOx abatement
Low Low Low Medium Uncertain High High High Low
Total 310241.3 2832.998 12.301 101876.6 312.5

UKRAINE
UNFCCC. The First National Communication 5-29
Policy instruments State regulation of rational energy use in all sectors, including:
• legislation, supporting energy saving and environmental protection policies;• standard regulations on fuel and energy consumption, GHG emissions etc.;• fees, taxes, subsidies, prices, stimulating implementation of efficiency technologies and equipment;• research, development and demonstration programs to improve and disseminate information;• energy and environmental audit, R&D centers, information and personnel training centers, energy management
at the enterprises, licensing requirements, patent rules, etc.;• demand side management;• energy consumption measurement.
This portfolio of policy instruments will promote sustainable development of Ukraine and lead to therestructuring of economy. A strong role of energy-intensive sectors (energy, metallurgy, heavy mechanicalengineering, etc.) will not be continued under market conditions. Low energy use sectors, services and agricultureare favourable.Technological optionsImplementation of energy efficient technologies are the most important for reducing GHG emissions.
Cross-sectoral energy saving options: implementation of efficiency lighting, motor drive systemsimprovement, more efficient poor fuel combustion, improvement of the heat supply systems, utilization ofsecondary energy resources etc. Energy conservation assessment is 800 PJ with an investment of $ 2 billion.
Sectoral energy saving options:The most effective measures are follows:Energy Supply: technological and efficiency improvements in power sector, high efficiency gas supplysystem etc. Energy conservation assessment is 450-500 PJ with an investment of $ 5-6 billion.Metallurgy: improvements in coke making, recycling of blast furnace, coke oven and converter gases, wideimplementation of electric arc furnaces, decrease of output of the most energy intensive production etc.Energy conservation assessment is 240-280 PJ with an investment of around $ 2 billion.Mechanical Engineering: implementation of efficiency technologies of metal processing, use of high qualityraw materials etc. Energy conservation assessment is 75-90 PJ with an investment of $ 800-900 mln.Chemical industry: improvement of the technologies of ammonia, calcium soda and phosphoric fertilizersproduction etc. Energy conservation assessment is 105-120 PJ with an investment of $ 825-925 mln.Building materials industry: improvement of technological processes of cement, glass, brick, wall materialsproduction, etc. Energy conservation assessment is 75-95 PJ with an investment of $ 320-350 mln.Food industry: improvement of technological processes of sugar, spirit, vegetable oil production, etc. Energyconservation assessment is 170-190 PJ with an investment of $ 600-650 mln.Construction sector: improvement of technological processes of concrete, cement, asphalt, brick productionetc. Energy conservation assessment is 10-15 PJ with an investment of $ 60-70 mln.Agriculture: reduction of a share of energy intensive plants, improvement of post-harvest drying and storage,switch to low carbon energy sources, etc. Energy conservation assessment is 140-160 PJ with an investmentof $ 1-1.3 billion.Residential sector: switch to energy sources/equipment with low-carbon emissions, improvement ofinsulation for existing and new building shells, shift to more efficiency household equipment, etc. Energyconservation assessment is 300-350 PJ with an investment of $ 750-850 mln.Transport: transport demand management, improvement of vehicle technical efficiency, fuel switch,improvement of traffic flow, etc. Energy conservation assessment is 250-300 PJ with investment of $ 2.5-3billion.Fuel substitution: Increase share of nuclear fuel, renewable, secondary and non-traditional energy
resources. Shift from coal and petroleum to natural gas, utilization of coalbed methane and biogas. Reduction of losses in gas supply system. Replacement of high-bleed devices with pneumatic, pipeline leakmitigation, improved maintenance. Methane reduction potential is 2-2.2 billion m3 with an investment of $ 4-6 mln. Improvement of industrial processes, not related to energy saving. Investment assessment is approximately $ 200mln. Improvement of waste treatment. The integrated management of the wastes and at first place their reduction andconstruction of regional centers for their treatment and detoxication would provide annual utilization of 5.8-6.2 mlntons of wastes and require investments of approximately $ 1-1.1 billion.Realization of such options will provide the annual energy saving at a level of 2000 - 1000-1100 PJ, 2005 - 1950-2100 PJ, 2010 - 3100-3200 PJ, 2015 - 4100-4200 PJ. These measures will require around $29-32 billioninvestments.The differences for pessimistic and optimistic scenarios are generally in volumes of energy saving, which inoptimistic variant will be approximately 10-12% higher, and in pessimistic one - 25-30% lower.All these measures have a high degree of a governmental support, since they are included in the programs of thedevelopment of the economy and its sectors in Ukraine, adopted by the administrative bodies of the state, as well as

UKRAINE
UNFCCC. The First National Communication 5-30
in the draft documents, which at present are being under consideration of the Cabinet of Ministers, of the Parliamentand the administration of the President of the country.However the possibility of realization of these measures will to a great extent depend on the investments. If until therecent time a state budget had been considered as a major source of investments, then today it is clear, that the statecan be not only a single source, but just a considerable source of investments. Therefore the problem of investmentsis being the main one.That is why the analysis of measures effectiveness, which was carried on according to some criteria, where thecriterion of a relative effectiveness played a major role, is of a considerable interest. It was determined as a relationof direct GHG emissions decrease to the necessary investments for their realization in particular measures. Theexecuted ranging of measures according to this criterion shows, that measures, connected with the decrease ofnatural gas losses, with DSM, with the realization of cross-sectoral energy saving programs, are the most effectiveones.The implementation of non-traditional sources, optimization of the electric power and heat utilities, the sets for poorcoal combustion, installation of constructions for the refining of wastewater silt at purification stations, are the mostexpensive measures for GHG emissions decrease from the economic view point.However, it must be taken into consideration, that for a whole number of measures given the GHG emissionsdecrease is an indirect effect. Expedience of their realization is conditioned, as a rule, by other factors.Realization of measures mentioned above will give a considerable social effect, first of all by the creation of newworking places, for example in machinery and equipment sector, construction, energy saving management, etc. Atotal number of new working places according to evaluations of national experts on the level of 2010-2015 can makeup to 250-300 thousand.
5.3 References1. National Energy Program, 1996.2. Program of Restructuring of Ukrainian Economy, 1995.3. Comprehensive State Energy Conservation Program of Ukraine, 1996.4. National Program of the Development of Mining and Smelting complex, 1995.5. National Program of the Ukrainian Motor-car-construction Development, 1993.6. National Program of Receptacles and Packing Materials Production, 1993.7. National Program of the Development of Aluminum Production, 1993.8. National Complex Program of the Development of Titanic Industry of Ukraine «Titanium of Ukraine»,
1994.9. Complex Program of the Development of Copper Production, its Alloys and Intermediate Goods
«Copper of Ukraine», 1995.

UKRAINE
UNFCCC. The First National Communication 6-31
6. PROJECTIONS OF GREENHOUSE GAS EMISSIONSAND REDUCTION POTENTIALS IN UKRAINE6.1 Energy sector
In order to assess GHG emissions and mitigation options the following sectors and subsectors of economywere considered:1) Fuel & Energy Complex (FEC) and subsectors:
• Electric Power & Heat Supply• Coal Industry• Oil & Gas Industry• Oil Refining
Electric Power & Heat Supply subsector fuel consumption was forecasted only for utilities supervised byMinistry of Energy of Ukraine. Heat and electric power generation by industrial and residential power unitswas taken into account in corresponding sectors, because of historical planning practice orientated not tofunctional but sectoral approach.
2) Industry and main subsectors:• Metallurgy• Chemical Industry• Machinery and Equipment• Building Materials Industry• Food Industry• Other Industrial Sectors
3) Construction Sector4) Agriculture5) Residential and Commercial Sector6) Transport7) Other Sectors of EconomyThese sectors are selected as a result of historical planning practice and economic development forecasting togetherwith the fact that these sectors are the main sources of GHG emissions.A deep crisis of Ukrainian economy considerably complicates the assessment of future GHG emissions. It isextremely difficult to project the terms of economy stabilization, directions and rates of further economicdevelopment, up-to-date technologies implementation and energy efficiency improvement.Also it is impossible to apply mathematical models and methodologies used in the developed countries and earlierused for planning development of Ukrainian economy including the regressive analysis, production functions andinput - output models.Accounting and iterative equilibrium models to forecast the development of economy and GHG emissions wereused. Optimization models were applied to develop mitigation scenarios and to estimate mitigation options.Coal, natural gas, coalbed methane, residual fuel oil, diesel oil, other oil products were considered as primary fuels.In metallurgy coke and coke gas, and in a residential sector coal briquettes and firewood, were taken into account.As a basis for forecasting fuel for combustion national experts used National Programs of the development ofUkrainian economy, FEC, some sectors adopted or being under consideration by the Ukrainian Government (seeChapter 5).While forecasting fuel combustion in sectors and subsectors (Table 6�1) mitigation options included in a baselinescenario were evaluated (see Chapter 5, [1]).Table 6–1. Fuel combustion in baseline scenario, PJ
Fuel 1990 2000 2005 2010 2015Gas* 4208 3099 3419 3727 4033Fuel oil 834 471 508 536 536Coal** 2634 2247 2348 2382 2508Gasoline 497 371 405 445 506Diesel oil 629 511 524 534 561Others 444 376 354 399 408Total 9246 6965 7558 8023 8552
* including natural, coke and oil refining gases etc.** including coal, coke, coal briquettes etc.
The study results of projected GHG emissions are summarized in Table 6�2 and Figure 6-1.Table 6–2. GHG emissions from fuel combustion in baseline scenario

UKRAINE
UNFCCC. The First National Communication 6-32
Gas 1990 1995 2000 2005 2010 2015CO2, Gg 662633 402394 503528 541471 569791 605138CO2, Gg CE 180718 109744 137326 147674 155398 165038CH4, Gg 291.7 215.0 233.1 207.5 209.3 200.0N2O, Gg 4.9 3.5 4.2 4.4 4.5 4.8Direct GHG emissions,Gg CE
182803 111271 139016 149234 156977 166589
Note: GWP factors for CO2 - 1, for CH4 - 21, for N2O - 310 (IPCC, 1995)
60
65
70
75
80
85
90
95
100
1990 1995 2000 2005 2010 2015
%
CO2
C
N2O
CH4
Figure 6-1. Trends of GHG emissions from fuel combustion in baseline scenarioAs Table 6�2 shows GHG emissions from fuel combustion in a baseline scenario during the considered period areexpected to be lower than levels of 1990.In order to estimate prospective GHG emissions from industrial processes, production trends for chemical industry,metallurgy, building materials industry and other industrial sectors were forecasted.GHG emissions trends from industrial processes are presented in Table 6�3.Table 6–3. GHG emissions trends from industrial processes
Gas 1990 1995 2000 2005 2010 2015CO2, Gg 48815 22905 26514 27678 28225 29214CO2, Gg CE 13313 6247 7231 7549 7698 7967CH4, Gg 406.5 172.7 164.7 166.4 166.5 168.5N2O, Gg 23.0 7.1 22.5 25.8 25.9 26.0Direct GHG emissions, Gg CE 17586 7836 10077 10683 10841 11130
Summary of projections of anthropogenic emissions of precursors is given at the Table 6�4.Table 6–4. Summary of projections of anthropogenic emissions of precursors, Gg
1990 1995 2000 2005 2010 2015CO 7295 4046 5964 5958 6255 6607NO2 2043 1140 1564 1605 1613 1666NMVOCs 1007 471 844 884 949 1043
6.2 ForestryUkraine is a country with a forestry deficit. Forest land fund totals 10 million hectares, 8.6 million hectares
being covered by afforestation, which makes 14.3% of a country area (this is the forested lands index). For Ukrainethe 20% average level is regarded as the optimal forested lands index (that is such one, when forests influence on theenvironment the most favorably, fulfill their functions effectively).

UKRAINE
UNFCCC. The First National Communication 6-33
Total timber stock of Ukraine is estimated in 1.3 billion m3. Evergreen plantations occupy 45% of a totalarea, including pine (Pinus silvestris L.) - 36%. Hard deciduous plantations total 41%, including oak (Quercus roburL.) and beech (Fagus sylvatica L.) - 33%.Average growing-stock volume of forested area totals 4.0 m3/hectar/yr and varies from 5.0 m3/hectar/yr in theUkrainian Carpathians up to 2.5 m3/hectar/yr in steppe zone.
It is determined in the Ukrainian legislation (Forest Code), that forests of Ukraine carry out ecologicalfunctions predominantly and as a consequence have a limited exploitation importance.
According to the economic destination, sites and functions carried out, Ukrainian forests are divided into twogroups.
The first group includes forests carrying out predominantly defense functions, forest reserves, plantations,having scientific and historical importance (including genetic reserves, etc.). The second group includes forests,having defense and limited exploitation importance. The area of the first group forests totals 5.1 million hectares or52% of a forest fund.
All forests are a state property. 72% of them are in a constant use of state forestry enterprises, the rest beingtransferred to agricultural enterprises for use (24%), residential and other organizations (4%).
Five natural zones are distinguished in Ukraine, each of them having its own peculiarities in forestry (Figure6-2).
Zakarpatskaya
Volynskaya
Lvovskaya
Ivano-Frankovskaya
Ternopolskaya
Rovenskaya
Khmelnitskaya
Chernovitskaya
Zhitomirskaya
Vinnitskaya
Kievskaya
Odesskaya
Cherkasskaya
Chernigovskaya
Nikolaevskaya
Kirovogradskaya
Poltavskaya
Sumskaya
Dnepropetrovskaya
CrimeaRepublic
Khersonskaya
Zaporozhskaya
Kharkovskaya
Donetskaya
Luganskaya
Zones:Carpathians
Forest-Steppe (Left Dnieper Side)Forest-Steppe (Right Dnieper Side)
Crimean Forests
Mixed ForestsSteppe
Natural Zones of Ukraine
Figure 6-2. Natural zones in UkraineThe increase of forested lands of Ukraine will allow to improve in general the unfavorable ecological
situation, since a forest is a powerful natural factor, which influences the climate, soils, surface drainage forming,produces oxygen, filtrates air and water, prevents floods, etc.
Ukraine has land areas not used in agriculture and available for afforestation (not less than 500 thousandshectares). Shelterbelts plantations were created only for 50% of agricultural areas. Intensity of erosion processesstill remains a considerable one. Today legislation does not stimulate wide croplands shelterbelts planting. Besidesthe importance of agroforest-melioration effect of shelterbelts is misjudged by farmers.
Plantations� withering is one of the serious problems, essentially influencing on forests productivity for thelast decade. Any scientific conception to explain the decrease of forest plantations sustainability to unfavorablefactors does not exist yet. The withering of oak, pine and other plantations is periodically marked in variousregions of Ukraine.
Methods, proposed by IPCC and national experts [2, 3], were used for the assessment of GHG emissions inforestry.
Baseline and mitigation scenarios of the forestry development in Ukraine were developed.�Program of the Development of Forestry and Forest Industry in Ukraine for the Period till 2015� and
�National Program of the Development of Agricultural Production in Ukraine for 1996-2005� were put into thebasis of a baseline scenario. The extensive development (increasing forest plantations) and only inconsiderablyqualitative improvement of forests, are established in this scenario, taking into account a difficult financial

UKRAINE
UNFCCC. The First National Communication 6-34
situation of the state. Fire control measures and measures of fight with forest vermin and diseases are planned withinconsiderable qualitative and quantitative shifts.
In baseline scenario natural process of a slow reforestation without creating artificial plantations is envisagedon lands in the abandonment zone of the Chernobyl NPP.
The data of the National Academy of Sciences of Ukraine, given in the �Program of the Development ofForestry and Forest Industry in Ukraine for the Period till 2015�, taking into account not only the extensiveincrease of forest plantations areas, but a considerable qualitative improvement of a forest fund, were put into thebasis of a mitigation scenario. In this scenario the indices, put in the project of «Program of Liquidation of ChNPPAccident Consequences for 1996-2000» and scientific elaboration of the Ukrainian Research Institute of Forestryand Agrosilviculture (UkrRIFA) and the Ukrainian Scientific-Research Institute of Mountain Forestry (UkrSRIMF),were used.
Compared to the baseline scenario the mitigation scenario takes into account the following factors:� Scientific optimization of volumes and structure of forest harvesting.� Afforestation of eroded lands in ravines, washes, sands.� The increase of plantations of shelterbelts forests.� The creation of plantations of forest species (including fast growing) to receive forest products of long-
term use.� Afforestation of lands, contaminated as a result of accident at the Chernobyl NPP and not used in
agriculture.� The increase of forest plantations biomass productivity due to the use of a genetically improved species
in forest plantations.� The optimal increase of regions under forests in Ukraine.� Improvement of forests protection from fires (gradual 70% decrease of average annual level of fires from
the level of 1986-1994), the increase of forests protection effectiveness from vermin and diseases(resulted in the growth of biomass increment).
Initial data and balance of carbon dioxide emissions/uptakes in scenarios are given in Table 6�5. Factorspresented in Table 6�5 are aggregated ones. For the forest plantations, managed forest and urban forests thesefactors are calculated by multiplying annual growth rate in dry matter, carbon fraction in dry matter and CO2/C ratiowith account of shares of different species groups [2, 3]. Methodology of other factors estimation is developed bynational experts and explained in details in Ukrainian Country Study on Climate Change [2, 3].Table 6–5. Carbon Dioxide Emissions/Uptakes in Forestry in Ukraine
Baseline scenario Mitigation scenario 1995 2000 2005 2010 2015 2000 2005 2010 2015
Forest plantations,thousand hectares
42.5 45.3 46.3 50.0 53.0 80.0 101.0 117.0 129.0
Factor, t C/hectare 2.31 2.31 2.31 2.31 2.31 2.33 2.37 2.43 2.53CO2 Uptake, Gg 359 385 392 425 447 682 879 1041 1195Managed forest, millionhectares
8.78 8.868 8.98 9.106 9.261 9.0 9.32 9.77 10.31
Factor, t C/hectare 2.37 2.40 2.44 2.47 2.51 2.44 2.53 2.65 2.80CO2 Uptake, Gg 76298 78038 80341 82470 85232 80520 86460 94930 105849Urban forests, thousandhectares
95 96 97 98 99 97.5 100 104 108
Factor, t C/hectare 2.70 2.70 2.70 2.70 2.70 2.70 2.70 2.70 2.70CO2 Uptake, Gg 941 950 960 970 979 964 990 1030 1071Forest harvests, millionm3
13.1 13.1 13.5 13.5 14.2 15.1 17.0 19.0 21.0
Factor, t C/m3 0.27 0.27 0.27 0.27 0.27 0.27 0.27 0.27 0.27CO2 Emissions, Gg 12969 12969 13365 13365 14058 14949 16830 18810 20790Abandonment of lands,thousand hectares
54.0 51.5 49.0 46.5 44.0 50.0 30.0 5.0 0
Factor, t C/hectare 2.0 2.0 2.0 2.0 2.0 2.0 2.0 2.0 2.0CO2 Uptake, Gg 396 378 359 341 323 367 220 37 0Forest fires, thousandhectares
4.2 4.2 4.2 4.2 4.2 2.1 1.8 1.5 1.2
Factor, t C/hectare 9.16 9.16 9.16 9.16 9.16 9.16 9.16 9.16 9.16CO2 Emissions, Gg 139 139 139 139 139 70 59 51 40Forest rate 14.5 14.7 14.9 15.1 15.3 14.9 15.4 16.2 17.1Net CO2 Uptake, Gg 64886 66643 68548 70702 72784 67514 71660 78177 87285

UKRAINE
UNFCCC. The First National Communication 6-35
Comparison of emissions/uptakes balances in baseline and mitigation scenarios (Figure 6-3) evidences that theincrease of CO2 uptakes makes about 11 800 Gg in 2015, additional expenses in the mitigation scenario of about$1220 million taking place.
-90-80-70-60-50-40-30-20-10
01995 2000 2005 2010 2015
Tg
Baseline scenarioMitigation scenario
Figure 6-3.Emissions/removals balances in baseline and mitigation scenarios
6.3 Carbon dioxide emissions assessmentProjections of anthropogenic emissions/uptakes of CO2 from fuel combustion, industrial processes and in forestrywere considered in previous subchapters.Summary of CO2 emissions is presented in the Table 6�6.Table 6–6. Summary of projections of anthropogenic emissions of CO2, Gg
1990 1995 2000 2005 2010 2015Fuel combustion: energy andtransformation industries
191296 135447 151037 173122 178539 189474
Fuel combustion: industry 220202 117182 149722 159284 168893 179562Fuel combustion: construction 3890 4615 3462 3646 3845 4431Fuel combustion: residential 97506 78860 91649 91317 96818 100047Fuel combustion: agriculture 35611 22721 32255 34044 36085 37908Fuel combustion: transport 49831 17922 41060 45985 52749 61866
Fuel combustion: other 64296 25648 34343 34072 32861 31848Industrial processes 48815 22905 26514 27678 28225 29214Total 711447 425300 530042 569148 598015 634350The high level of uncertainty of the future economic development and its functioning is essential note of allcountries with the transition economy including Ukraine. Consequently the projected fuel combustion, industrialproduction and, hence, emissions vary considerably.Therefore side by side with the baseline scenario pessimistic and optimistic scenarios have been developed.Variations of CO2 emissions in these scenarios determine the uncertainty range (Table 6�7).Table 6–7. The projected CO2 emissions in the various scenarios of economic development, Gg
Scenario/Category 1990 1995 2000 2005 2010 2015Baseline
Fuel combustion 662632 402394 503528 541471 569791 605138Industrial processes 48815 22905 26514 27678 28225 29214Total 711447 425299 530042 569149 598016 634352
PessimisticFuel combustion 662632 402394 466207 494388 517417 541348Industrial processes 48815 22905 25359 26092 26622 27778Total 711447 425299 491566 520480 544039 569126

UKRAINE
UNFCCC. The First National Communication 6-36
OptimisticFuel combustion 662632 402394 541725 599926 649712 692425Industrial processes 48815 22905 27360 30708 31602 32107Total 711447 425299 569085 630634 681314 724532As a Table 6�7 shows the future direct CO2 emissions are expected to exceed the 1990 level only in optimisticscenario in 2015 and this excess will total approximately 1%.
6.4 AgricultureLivestock, rice cultivation and the use of nitric fertilizers were considered as the emissions sources in the Ukrainianagriculture. GHG emissions factors were taken in correspondence with IPCC recommendations. Emissionsassessment was carried out for three scenarios of the economic development of Ukraine - optimistic, pessimistic andbaseline. Officially ratified documents, where the problems of the economic and agricultural development of thecountry are considered, were used to form these scenarios.In accordance with the baseline forecast, livestock and poultry trends in the country, and rice cultivation areas aregiven in Table 6�8. GHG emissions in agriculture in the baseline scenario are presented in Table 6�9.
Table 6–8. Livestock and poultry trends, and rice cultivation areas in Ukraine1990 1995 2000 2005 2010 2015
Dairy cattle, thousand ofheads
8 528 7 818 6 800 6 600 6 400 6 200
Beef cattle, thousand of heads 16 667 11 152 13 200 16 400 17 599 18 800Sheep and goats, thousand ofheads
9 003 3 200 4 000 5 010 5 996 7 000
Horses, thousand of heads 754 740 800 897 999 1 300Swine, thousand of heads 19 950 13 250 15 500 19 000 19 667 20 000Poultry, million of heads 255 146 190 205 215 230Rice cultivation areas,hectares
0.0281 0.02 0.023 0.025 0.030 0.040
Table 6–9. Projected methane and nitrous oxide emissions in agricultureEmission sources 1990 1995 2000 2005 2010 2015
CH4 emissions, GgLivestock 2240 1698 1763 2001 2077 2154Rice 15.17 10.79 12.41 13.51 16.19 21.59Total 2255.17 1708.79 1775.41 2014.51 2093.19 2175.59
N2O emissions, GgNitric fertilizers 10.2 5.12 7.6 8.5 9.4 10.15Direct GHG emission , Gg CE 13777 10227 10814 12259 12782 13321
As it is seen from Table 6�9, future GHG emissions in agriculture in the baseline scenario are expected to be lower,than the emission levels of 1990.Uncertainty analysis in this category was carried out on the basis of forecasting cattle, poultry, areas under rice andnitric fertilizers use in pessimistic and optimistic scenarios of the economic development. Variations of methane andnitrous oxide emissions in these scenarios determine the uncertainty range (Table 6�10).As it is seen from Table 6�10, the emission levels in 2015 are expected to exceed the level of 1990 only in theoptimistic scenario of the economic development. However, this excess is comparatively small and totalsapproximately 1.33% for CH4 and 8.3% for N2O.Table 6–10. Projected methane and nitrous oxide emissions in agriculture in various scenarios
Scenario 1990 1995 2000 2005 2010 2015CH4 emissions, Gg
Pessimistic 2255 1709 1771 1848 1924 2008Baseline 2255 1709 1775 2014 2093 2175Optimistic 2255 1709 1801 1981 2135 2285
N2O emissions, GgPessimistic 10.2 5.12 6.2 7.1 7.9 8.5Baseline 10.2 5.12 7.6 8.5 9.4 10.15Optimistic 10.2 5.12 8.0 9.1 10.1 11.05

UKRAINE
UNFCCC. The First National Communication 6-37
The assessment of mitigation options in agriculture are carried on by national and US experts. It is one of series ofcountry studies funded by the United States Environmental Protection Agency (EPA), and was prepared by WinrockInternational Institute for Agricultural Development for the Global Change Division of EPA. The main attention ispaid to the livestock production, especially to cattle industry in Ukraine, a major livestock-producing country. Thefirst steps of this work were reflected in Report [4]. The objectives of the study were to compile information andprepare recommendations regarding the livestock of Ukraine and the potential for reducing methane emissions to:(1) sensitize decision-makers in government, science and agriculture; (2) prepare for a pilot program to demonstratestrategies to reduce the methane emissions; (3) demonstrate the need to increase livestock productivity in Ukraine;and (4) stimulate development of the livestock sector in Ukraine.The results of this study and interactions with Ukrainian institutions and individuals clearly identify concepts andideas to reduce methane emissions in cattle while also increasing product output per feed resource input. Most ofthese have been previously discussed by scientists (World Bank, 1993), including Ukrainian and Russian experts.The economic structure driving producer decisions is changing, and are expected to allow and encourageeconomically sound and efficient resource use for milk and meat production.The core of recommendations for mitigating methane emissions in Ukraine is as follows:1. Improve production efficiency. Efficiency is achieved by increasing milk and meat production per cow, whichrequires better quality feeds and often more feed per cow. However, the amount of feed units needed to produce agiven amount of milk can be reduced as fewer cows are necessary. Meeting the maintenance requirement of the totalherd will require a smaller proportion of feed in relation to that needed for milk production. Increasing theproduction efficiency would result in fewer cows, requiring less total feed to produce the same amount of milk.Increasing the daily weight gain decreases the time needed to bring animals to slaughter weight. Reducing thenumber of cows and the feed requirement would make more land area available to produce food crops forconsumption and export, reduce the labor required per kg of milk and meat produced, and reduce capitalexpenditures for buildings, equipment, and so forth, while increasing profit.2. Improve forage quality. Grasses and legumes should be harvested at early bloom stage, thus increasing digestibleenergy by 10% to 15% and digestible protein by 30% to 50%.3. Improve crop production. High yielding and drought resistant varieties of maize, soybean, rapeseed, lucerne, andother crops for livestock feed should be developed to produce under Ukrainian conditions. Modern harvestingmachines and repair parts are necessary for timely harvest of forages and grains. Storage losses of hay and grain canbe reduced by providing adequate on-farm storage facilities.4. Improve pastures. Improved pastures and pasture rotation practices are not used extensively in Ukraine. Manypastures are overgrazed. Pastures seeded to a mixture of grass and legumes and properly managed and fertilizedcould provide high quality feed for dairy cows and heifers during about 5 month of the year.5. Provide adequate protein, minerals, and vitamines. Improving the quality of forages could be one of the mostcost-effective ways to increase protein. An adequate supply of minerals and vitamins is also needed to balance thediets. If domestic sources are not available, these nutrients should be imported.6. Reduce milk fed to calves. If the price of milk increases and it becomes more economic to feed grain, dry calfstarter should replace milk at an earlier age.7. Provide veterinary supplies. Since few pharmaceuticals are produced in Ukraine, arrangements should be made toimport vaccines, antibiotics, and other drugs needed to treat and prevent diseases and parasites of livestock.8. Install modern milking equipment.9. Increase the genetic potential. Better methods of production record keeping and sire selection are necessary sothat genetically superior animals are used by the artificial insemination centers.10. Assist private farmers. There is general agreement that independent, privately owned and operated farms aremore efficient than state and collective farms.11. Use of bovine somatotropin. Approximately 12% increased milk production and a 9% decrease in methaneoutput can be immediately achieved by the use of bovine somatotropin.12. Increase research and education.
6.5 Methane Emissions AssessmentMethane emissions and the analysis of mitigation measures were estimated for the production, transportation,refining and storage of fossil fuel, for solid wastes and wastewater. Emissions from fuel combustion and inagriculture were considered in corresponding categories.In order to assess fugitive emissions from fuels, production, storage, refining, transportation of fossil fuels andemission factors for three scenarios of the economic development were forecasted.Fuel production, storage, refining and transportation for the baseline scenario were projected on the basis ofNational Energy Program of Ukraine and the programs of the development of separate FEC sectors.While projecting methane emission factors the following matters, caused their considerable future decrease, weretaken into account in this category of emission sources.A considerable share of CH4 emission is connected with the extremely unsatisfactory exploitation of gas sector,especially in end-use consumers. The reduction of gas losses does not require considerable investment and in theprospective emissions factors are expected to decrease essentially.

UKRAINE
UNFCCC. The First National Communication 6-38
Side by side with this, the introduction of up-to-date technologies of oil and gas production should provide thedecrease of emission factors to the level of the developed countries.One of the main tasks, which is put by the Government, is to increase the share of utilized methane on existingmines and to implement preliminary degasation of mine fields, destined for a new construction and reconstruction.This will allow to decrease methane emission factors per ton of produced coal. Hence the emissions in new mineswill be considerably lower, than in the old ones.Methane emission factors in this category are given in Table 6�11, and projections of fuel production,transportation, refining and storage for the baseline scenario - in Table 6�12.Table 6–11. Methane emission factors trends
Category 1990 1995 2000 2005 2010 2015Gas production, Gg/billion m3 25.7 25 20 15 12.5 10Gas transportation and storage,Gg/billion m3
18.12 18.12 18 15 12 8
Coal mining and Post-miningactivity (new mines), Gg/million t
- - 12.5 10 9 8.5
Coal mining and Post-mining (oldmines), Gg/million t
17 16.9 16 15.5 14.5 13.5
Oil production, Gg/million t 0.1868 0.1868 0.186 0.175 0.17 0.15Oil refining, Gg/million t 0.04146 0.04146 0.04146 0.04146 0.04146 0.04146Oil storage, Gg/million t 0.00746 0.00746 0.00746 0.00746 0.00746 0.00746
Table 6–12. Fuel production, transportation, refining, storage and methane emissions trends1990 1995 2000 2005 2010 2015
Gas production, billion m3 28.1 18.2 22 33.55 35.3 35Gas transportation and storage,billion m3
149 120 135 125 120 115
Coal mining and Post-miningactivity (new mines), million t
0 0 10.155 30.86 44.06 62.66
Coal mining and Post-miningactivity (old mines), million t
164.8 83.6 142.045 126.64 125.94 114.84
Oil production, million t 5.3 4.03 4.04 5.7 6.6 6.6Oil refining, million t 58.1 15.7 47 47 47 49Oil storage, million t 58.1 15.7 47 47 47 49Methane emissions, Gg 6227 4044 5273 4653 4107 3356
Methane emissions in this category are projected to considerably decrease and in 2015 total 54% compared to 1990.In the category �Wastes� municipal solid waste (MSW), municipal and industrial wastewater were taken intoaccount.To assess methane emissions from MSW the volumes of their generation, processing at waste incineration plantsand storage on landfills (see Table 6�13) were forecasted, and to assess emissions from wastewater a number ofpopulation and wastewater in industrial sectors were projected.Table 6–13. Municipal Solid Waste generation, storage and incineration trends, million t
1990 1995 2000 2005 2010 2015Annual MSW generation 11 11.8 12.87 14.04 15.31 16.69MSW landfilled 10.12 11 10.17 9.84 9.61 8.99MSW incinerated 0.88 0.8 2.7 4.2 5.7 7.7
The implementation of new solid waste treating facilities is the main mitigation measure, allowing to reduce thestorage of MSW on landfills and methane emissions, approximately by 530-550 Gg.The enlarged introduction of technologies (capacity is above 100 thousand of m3 of wastewater per day) of sedimentanaerobic fermentation in methane tanks is planned, that will allow to increase methane recuperation duringwastewater refining from 6.24 Gg in 1990 up to 17.5-18.9 Gg in 2015. Methane emissions trends from municipaland industrial wastewater are presented in Table 6�14. Table 6–14. Methane emissions trends from municipal and industrial wastewater, Gg
1990 1995 2000 2005 2010 2015Municipal wastewater 34.46 34.34 31.71 30.85 29.89 28.16Industrial wastewater 14.07 11.67 14.94 17.44 20.22 22.32Total 48.53 46.01 46.65 48.29 50.11 50.48
Total methane emissions (Table 6�15) are expected to considerably decrease and on the level of 2015 are 34% lowerthan the level of 1990.

UKRAINE
UNFCCC. The First National Communication 6-39
Table 6–15. Summary of projections of anthropogenic emissions of CH4,Gg1990 1995 2000 2005 2010 2015
Fuel combustion 292 215 233 208 209 200Fugitive emissions from fuels 6227 4044 5273 4653 4107 3356Industrial processes: Iron and Steel 333 98 104 104 104 105Industrial processes: Food 68 71 57 58 57 58Industrial processes: Construction 5 3 4 5 5 6Livestock 2240 1700 1764 2001 2077 2154Rice cultivation 15 11 12 13 16 22Waste 934 1009 937 909 891 837Total 10115 7150 8383 7951 7467 6738
Variations of nitrous oxide emissions in optimistic and pessimistic scenarios determine the uncertainty range (Table6�16). In each scenario of the economic development nitrous oxide emissions are projected to be higher comparedto 1990 due to increasing nitric and adipic acids production.
Table 6–16. Nitrous oxide emissions in various scenarios, GgSource 1990 1995 2000 2005 2010 2015
BaselineFuel combustion 4.9 3.5 4.0 4.4 4.5 4.8Industrial processes 23.0 7.1 22.5 25.8 26.0 26.1Agriculture 10.2 5.1 7.6 8.5 9.4 10.2Waste 0.13 0.12 0.41 0.63 0.86 1.2Total 38.23 15.82 34.51 39.33 40.76 42.3
PessimisticFuel combustion 4.9 3.5 3.9 4.1 4.2 4.4Industrial processes 23.0 7.1 22.3 24.0 24.2 24.4Agriculture 10.2 5.1 6.2 7.1 7.9 8.5Waste 0.13 0.12 0.33 0.48 0.78 1.01Total 38.23 15.82 32.73 35.68 37.08 38.31
OptimisticFuel combustion 4.9 3.5 4.4 4.9 5.1 5.4Industrial processes 23.0 7.1 24.1 27.4 27.6 27.7Agriculture 10.2 5.1 8.0 9.1 10.1 11.1Waste 0.13 0.12 0.48 0.71 1.01 1.31Total 38.23 15.82 36.98 42.11 43.81 45.51
6.6 Nitrous oxide emissions assessmentProjections of anthropogenic N2O emissions from fuel combustion, industrial processes and agriculture wereconsidered in previous subchapters. The IPCC Methodology [6, 18] and waste incineration forecast were used toassess N2O emissions in the category �Waste�.Summary of projections of anthropogenic emissions of N2O is presented in the Table 6�17. The increase of relativeshare of category �Waste� in the total emissions is caused by implementation of new waste incinerated facilities.Table 6–17. Summary of projections of anthropogenic emissions of N2O, Gg
1990 1995 2000 2005 2010 2015Transport 0.4 0.2 0.2 0.2 0.2 0.2Other energy sources 4.5 3.3 4.0 4.2 4.3 4.6Industrial processes 23 7 22.5 25.8 26.0 26.1Agricultural soils 10.2 5.1 7.6 8.5 9.4 10.2Waste 0.1 0.1 0.4 0.6 0.9 1.2Total 38.2 15.7 34.7 39.3 40.8 42.3
Variations of nitrous oxide emissions in optimistic and pessimistic scenarios determine the uncertainty range (Table6�18). In each scenario of the economic development nitrous oxide emissions are projected to be higher comparedto 1990 largely due to increasing nitric and adipic acids production.

UKRAINE
UNFCCC. The First National Communication 6-40
Table 6–19. Nitrous oxide emissions in various scenarios, GgSource 1990 1995 2000 2005 2010 2015
BaselineFuel combustion 4.9 3.5 4.0 4.4 4.5 4.8Industrial processes 23.0 7.1 22.5 25.8 26.0 26.1Agriculture 10.2 5.1 7.6 8.5 9.4 10.2Waste 0.13 0.12 0.41 0.63 0.86 1.20Total 38.23 15.82 34.51 39.33 40.76 42.30
PessimisticFuel combustion 4.9 3.5 3.9 4.1 4.2 4.4Industrial processes 23.0 7.1 22.3 24.0 24.2 24.4Agriculture 10.2 5.1 6.2 7.1 7.9 8.5Waste 0.13 0.12 0.33 0.48 0.78 1.01Total 38.23 15.82 32.73 35.68 37.08 38.31
OptimisticFuel combustion 4.9 3.5 4.4 4.9 5.1 5.4Industrial processes 23.0 7.1 24.1 27.4 27.6 27.7Agriculture 10.2 5.1 8.0 9.1 10.1 11.1Waste 0.13 0.12 0.48 0.71 1.01 1.31Total 38.23 15.82 36.98 42.11 43.81 45.51
6.7 Differences between Estimates in the Mitigation MeasuresAnalysis and InventoryEstimates for direct GHG emissions are slightly different from the National Inventory reported in Chapter 4 of thisreport. The difference between the assessments of indirect greenhouse gases is more essential.The largest difference is due to updating of recent Guidelines from the Intergovernmental Panel on Climate Change.Other differences not reflected in Chapter 4 include updates in sources list (non-energy emissions in food sector,metallurgy, chemistry and construction), and improvements in fossil fuel emission coefficients.Because of these differences, the 1990 Inventory values reported in Chapter 4 cannot be compared to projections offuture Ukrainian emissions presented in this chapter to estimate changes in emission levels over time. However,each chapter is internally consistent.
6.8 Summary of GHG Emissions ProjectionsIn the future direct GHG emissions are projected to be lower than the emissions of 1990 in any scenario of theeconomic development, despite the essential growth of GDP in a baseline and especially in optimistic scenarios ofthe economic development of Ukraine. This is supposed to be achieved by the whole set of measures for GHGemissions decrease and the increase of CO2 uptakes in the Forestry.In the baseline scenario it is projected to implement mitigation measures with overall potential of 100 000 Gg CEand therefore emissions at the level of 2015 will be 45889 Gg CE less than in 1990.GHG emissions and removals trends are given in Table 6�20 for the baseline scenario.Table 6–20. Total GHG emissions/removals in the baseline scenario
1990 1995 2000 2005 2010 2015Direct GHG emissions
CO2, Gg 711447 425299 530042 569149 598016 634352CO2, Gg CE 194031 115991 144557 155222 163095 173005CH4, Gg 10115 7150 8383 7951 7467 6738N2O, Gg 38.2 15.7 34.7 39.3 40.8 42.3Total, Gg CE 255192 158268 195503 204082 209310 215172Total, % compared to 1990 100 62.02 76.61 79.97 82.02 84.32
CO2 uptakes in forestryCO2 uptakes, Gg -51976 -64886 -66643 -68548 -70702 -72784
CO2 uptakes, Gg CE -14175 -17696 -18175 -18695 -19282 -19850

UKRAINE
UNFCCC. The First National Communication 6-41
NetCO2, Gg 659471 360413 463399 500601 527314 561568Total, Gg CE 241017 140572 177328 185387 190028 195322CO2, % compared to 1990 100 58.32 73.57 76.92 78.84 81.04
In optimistic scenario of the economic development, the net GHG emission levels in 2015 will total above 220 TgCE, that is approximately 10.7% lower than in 1990.In pessimistic scenario net GHG emissions on the level of 2015 will total above 180 Tg CE or about 73% from thelevel of 1990.A very wide range of change of indices, characterizing the future economic development and expected emissionlevels is connected with a very high grade of uncertainty of future development of Ukrainian economy (Table 6�21).Table 6–22. Ranges of fuel consumption and GHG emissions in 2015
Pessimisticscenario
Optimisticscenario
Range Averagedeviation, %
Fuel, PJ 7596.4 9787.2 2190.8 12.8Direct GHG Emissions, Tg CE 195.2 245.4 50. 2 11.5Sinks in Forestry, Tg CE -19.9 -23.9 -4.0 9.1Net GHG Emissions, Tg CE 175.3 221.5 46.2 11.6
6.9 References1. Country study on Climate Change in Ukraine: Greenhouse Gas Mitigation Options Analysis. Final
Report, Agency for Rational Energy Use and Ecology, Kyiv,1996.2. Country study on Climate Change in Ukraine: Development of Greenhouse Gas Emissions Inventory.
Final Report. Agency for Rational Energy Use and Ecology, Kyiv,1995.3. Country study on Climate Change in Ukraine: Development of Greenhouse Gas Emissions Inventory.
Final Report. (Supplement). Agency for Rational Energy Use and Ecology, Kyiv,1995.4. Reducing Methane Emissions from Ruminant Livestock: Ukraine Prefeasibility Study. Final Report.
Winrock International Institute for Agricultural Development, Morrilton, Arcansas, 1995.5. Country study on Climate Change in Ukraine. Final Report, Agency for Rational Energy Use and
Ecology, Kyiv,1997.

UKRAINE
UNFCCC. The First National Communication 7-42
7. VULNERABILITY AND ADAPTATION ASSESSMENT INUKRAINE
It is a matter of common knowledge that climate conditions have influenced human life and activity fromthe mankind�s early days. It is evident that understanding of climate change system and its interaction with humanactivities can result in more efficient economic and social decision.Given the country�s unstable economy and critical ecological problems, the consequences of climate change inUkraine could be serious. The results of scientific research during the last few years show that climate change inUkraine has significant impacts on agriculture, forestry, water and coastal resources.
7.1 Climate change scenariosTo assess vulnerability of Ukrainian natural resources and economic sectors General Circulation Models
(GCMs) outputs submitted by National Center for Atmospheric Research (NCAR) were used. There wereconsidered the following models: the Goddard Institute for Space Studies (GISS) model, the Geophysical FluidDynamics Laboratory (GFDL) model, the Canadian Climate Center Model (CCCM), the United KingdomMeteorological Office (UKMO) model [1]. These outputs are related to equilibrium conditions, that is they describeclimate conditions at effective doubling of CO2 in the atmosphere. Transient simulation represent climateconditions more realistically. These scenarios are run by assuming a steady increase in CO2 concentrations (by 1%per year). In such conditions there is a possibility to trace climate system inertia, that is a natural lag of its reactionbehind a change of greenhouse gases concentration in the atmosphere. Considering the above, an attempt was madeto use GFDL and Max-Plank Institute in Hamburg (MPI) models outputs for transient condition.
Since no one of the considered models reflects regional climate features, the approach including thefollowing steps was used to create climate change scenarios for Ukraine:
• interpolation of models outputs obtained for grid boxes into grid points, that is meteorological stationssites;
• evaluation of differences between temperatures under 2xCO2 and 1xCO2 conditions for each grid pointand their addition to actual temperatures;
• assessment of ratios of precipitation under 2xCO2 and 1xCO2 conditions for each grid point and theirmultiplication by actual precipitation [2].
7.2 Water Resources SectorDnieper is the main water thoroughfare of Ukraine. At present, management of water resources of Dnieper basin asa main basin in Ukraine is implemented through numerous ponds and water reservoirs, located at its inflows andwithin river-bed, as well as through network of canals through which Dnieper water is fed to draught regions ofUkraine.Observance of interests of all water consumers and rational use of water resources is stipulated by the Regulations ofOperation for Dnieper Cascade Water Reservoirs (RODCWR) (Ministry for Water Management of Ukraine, 1981,Kyiv), as well as by Interagency Commission on Establishment of Water Reservoirs Operating Regimes.In dependence on state of water reservoir filling, schedules of operating foresee 4 zones.1st zone — zone of full provision. All consumers are provided with water without restrictions.2nd zone — zone of economic consumption. All water consumers are provided with water in accordance with norms.Restrictions of auxiliary needs are introduced.3d zone — zone of strict water saving, when water reservoirs are being drawn down below navigation drawdownlevel not more that 1 m. Restriction for irrigation systems and for auxiliary needs of industry are introduced. Rivertransportation is put into navigation duty with draught that does not exceed 2.6 m. Ecological passing may becurtailed to 300 m3/s for short periods. Upon that everyday inspection of water quality is established.4th zone — zone of all consumers’ restriction. To provide for needs of inhabitants, limits and schedules for strictwater supply are established.Analysis of existing policy of water resource management gives all reasons to assume that under all consideredscenarios of future climate change existing RODCWR may be used, since these Regulations were elaborated forvarious states of Dnieper water content [3,6]. With that, needs of various sectors of the national economy arearranged to be met together, and the Interagency Commission may promptly correct operating regime of waterreservoir in each particular case.In cases of extreme water level lowering the following measures could be considered as adaptation ones:• an increase of reservoirs usable storage, that is elevation of normal afflux horizons and lowering of drawdown
level;• construction of Dnieper-Bug hydro-junction in the Dnieper mouth.However, the measures above are rather expensive, and there will be need in water use restriction when water levelis low.

UKRAINE
UNFCCC. The First National Communication 7-43
Decrease of power production by Cascade of Dnieper HPPs will lead to the necessity of searching alternative waysto cover peak loads in the power system.Adaptation measures of river transportation to insufficient provision of necessary navigable depths in Dnieper forthe most �unfavorable� climate change scenario may be as follows:
� 1st version - transferring all passengers and load traffics to railway transport. This way, however, is notbeneficial, since it is rather expensive and, besides, it �paralyses� tremendous capital investments intonavigation, harbors and distorts seriously infrastructure formed to date.
� 2nd version - renewal of navigation on account of creation of necessary navigable depths (3.2-3.9 m). Inthis case, bottom-deepening works are necessary to be carried out. Overall cost of works to be fulfilledfor guaranteed navigation will be $140-160 million.
For �unfavorable� climate change scenario, when water content of Dnieper may be insufficient to meet demands forirrigation, it may be advised to reduce areas of irrigated land and, consequently, change structure of crop areas infavor of drought-resistant crops.Under climate change scenarios leading to decreased Dnieper water content, quality deterioration of surface watersmay become possible. Therefore, bearing in mind present high level of Dnieper water contamination, it isrecommended to use in the nearest future underground waters of deep water horizons to meet demands for drinkingwater.
7.3 Coastal Resources SectorErosion of coast of the Black and Azov Seas causes serious social problems in coastal regions due to destruction ofhousings, numerous resort bases, sanatorium, mud hospitals, industrial enterprises and arable lands.Table 7�1 presents data on land losses under different scenarios of sea level rise.Table 7–1. Land losses under various sea level rise scenarios
Coastal 2050 2100zone 22 cm 46 cm 66 cm 115 cm
Prychernomorje (Black Sea side)Erosion 780 1110 1340 2360Flooding - 270 410 1600FirthsErosion 365 585 660 1580Flooding - 900 1750 4800
Pryazovje (Azov Sea side)Erosion 1400 1800 2300 3500Flooding - - 30 100
CrimeaErosion 1350 1730 2100 2800Flooding - 110 3800 12500
TOTALErosion 3895 5225 6400 9840Flooding - 2270 5990 19000
The most �favorable� scenario is that of sea level rise for 22 cm by 2050. Under this scenario, coastal zone,experiencing erosion intensification, nevertheless will almost retain existing form. Firths, deltas, interspersions, spitswill not disappear.To decrease losses from coast erosion to the minimum, it is necessary to conduct coast-reinforcing works, stipulatedby the General Plan of anti-slump and coast-reinforcing measures. Such works for Odessa region are to beperformed along 32-km of shoreline (costing about $11 million), for Nikolayev region � 11-km of shoreline ($33million), for Crimea � 141-km of shoreline ($550 million). At Azov coastal line, 170 km of eroded cliffs need to beprotected, that will cost not less than $250 million. Delivery of considerable volumes of sand to the coastal areasshould be considered as an addition to coast fortification measures. Taking into account this measure, expenses forregions will amount: Odessa - $211 million, Nikolayev - $93 million, Kherson - $39 million, Crimea - $872 million.Total expenses will make $1208 million. With that, existing coast protection constructions (under conditions of theirintegrity) in regions of Odessa, Crimea will be sufficient measure to protect coasts under 22-cm sea level risescenario by 2050. If the sea level rise will be pertained up to 2100, level elevation over present one will be 41 cm,which will already need additional expenses for modernization of coast protection, and implementation of newmeasures in certain cases.The most �unfavorable� scenario predicts sea level rise for 115 cm by 2100. Taking into account dynamics of sealevel rise, elevation rate by 2050 may approach value of 10 mm per year. At any case, large-scale measures for

UKRAINE
UNFCCC. The First National Communication 7-44
protection of coastal resources will be needed by 2050 and, especially and for sure, by 2100. Otherwise, deltas ofDnieper, Danube and Dniester will degrade, 9840 hectares of land fund will be destroyed and 19,000 hectares oflow-lying sections of the coastlines will be flooded; many health resort villages will be destroyed completely, spitsand interspersions will be disintegrated, all firths of Prychernomorje and Azov Sea will become salinized; thousandshectares of arable lands will be salinized, slumps in Prychernomorje and in Crimea will be activated.All that needs special study to elaborate National Program for Coast Protection. At present, it is obvious that thewhole coastal zone needs protection � from active cliffs to meadows. The latter, likely, ought to be fenced from thesea by artificial dams. It is quite clear that coast protection measures will require considerable investments.Thus, to ensure an effective adaptation, the following steps will be necessary to take:
� To take as a basis the General Plan of anti-slump and coast-reinforcing measures with additionsconcerning fortification of free beaches by transferring of large volumes of beach-forming materials tocoastal zone. This plan has no alternative for scenario of sea level rise for 22 cm by 2050.
� To develop National Program on Coast Protection Measures that would include two main parts: a)scientific substantiation of trend and intensity of erosion processes within coastal zone of the Black andAzov Seas; and b) specific plan of measures up to 2050, proceeding from 46-cm scenario by 2050 and115-cm one by 2100.
� To create models of probable soil salinization of low-lying sections of coastal zone under variousscenarios of sea level rise.
7.4 Forest Resources SectorPublic opinion in Ukraine for the recent years is slowly transforming to the understanding of the fact that importanceof forests as raw materials in Ukraine is lagging behind that of their environment-forming functions essentially. Atthe same time, legislation base of Ukraine is changing towards substitution of priorities in forestry. So, Forest Codeof Ukraine, adopted in 1994 [4], states that �forests in Ukraine are major means to preserve favorable for human lifeconditions of environment. They have restricted operational meaning and perform not so much raw materialssupply, as environment-forming and environment-protective functions: water-protective, sanitary-hygienic,recreation, aesthetic, educational and others�.To assess integrally the impact of global climate changes on forestry, simulation model of functional response offorestry to change of indices of forestry conditions in Ukraine was elaborated. This model allows to combine use ofstatistical data on forestry conditions with experts� assessments of significance and interaction of primary functionsof forests [5].Comparison of aftereffects of various climate change scenarios realization for forestry have showed that the mostunfavorable changes will take place according to GFDL scenario, and the most favorable ones � according to GISSone (Figure 7-1).
-60% -40% -20% 0% 20% 40% 60%
CCC
GFDL
GISS
UKM
Changes with respect to current levelMitigation of global consequences of Chernobyl’ accidentSupport of other socio-economic functions of forestsSupport of productive functions of forestsPreservation of environment-forming functions of forests

UKRAINE
UNFCCC. The First National Communication 7-45
Figure 7-1. Comparative analysis of functional response of the forestry sector for equilibrium conditions underdiscussed scenariosThe most vulnerable forest functions under CCCM scenario are those providing recreation, preservation ofbiodiversity of ecosystems and social protection of the population (that one involved into timber industry), whichwill be reduced for 62%, 60% and 56%, respectively, as compared with current conditions. The least vulnerableforest functions under implementation of CCCM scenario are: possibility of transfer of agricultural lands to forestuse within contaminated zones (this possibility may be improved for more than 40% as compared with currentconditions); as well as those providing supply of timber industry and contribution to global carbon circulation (thesewill be shortened for 11% and 15%, respectively, as compared with current conditions).The most vulnerable forest functions under GFDL scenario are those preventing migration of radionuclides andproviding social protection of the population, which will be shortened for 87% and 80%, respectively, as comparedwith current conditions. The least vulnerable forest functions under GFDL scenario are those providing water andsoil protection, as well as contribution of forests into global carbon circulation, which will be shortened for 31%,44% and 47%, respectively.According to GISS scenario certain recession of forest functions that provide recreation and preservation ofbiodiversity of ecosystems that could be shortened for 11% and 13%, respectively.In general, forecast for UKMO scenario is similar to that for GISS one with exception of the fact that socialprotection of population, involved into timber industry, is expected to be reduced by 10% under UKMO scenario.Consideration of potential ways of forestry adaptation to climate changes shows that main directions are following:reduction of significance of the most vulnerable forestry functions for the society (exogenous approach), andintroduction of measures to mitigate damages that may be inflicted to the forests directly (endogenous approach).For adaptation strategies development the combined approach is most effective one.For adaptation period of forest ecosystems to climate changes according to the most �favorable� scenario, twofollowing strategies will be the most efficient.Strategy 1. Reduction of significance of forest functions for protection of atmosphere and provision of favorableconditions for agriculture and other sectors of the economy in conjunction with endogenous measures oncompensation of changes in stocks, area, increment, biomass, age structure and diversity of wood speciescomposition of forests; accessibility of forests for population recreation purposes; fire control in forests,contaminated with radionuclides; preservation of historically formed forest types, fundamental types of forest-forming species, protective forest stands and shelter-belt forest stands.Strategy 2. Reduction of significance of forest functions on wood production, atmosphere protection and provisionof favorable conditions for agriculture and other sectors of the economy in conjunction with endogenous measureson compensation of changes in area, age structure and diversity of wood species composition of forests.From general point of view, the first strategy may be characterized as endogenous one with exogenouscompensation of detriment, for which reduction by endogenous methods is of low efficiency. The second strategymay be characterized as exogenous one with endogenous compensation of detriment of the most vulnerable indicesof forest conditions.For forest ecosystems adaptation period to climate change, envisaged by the most �unfavorable� scenario, thestrategies given below will be the most effective ones.Strategy 1. Reduction of significance of forest functions on protection of soils and atmosphere, wood production,provision of favorable conditions for agriculture and other sectors of the economy, as well as prevention of erosivemigration of radionuclides in conjunction with endogenous measures on compensation of changes in area coveredwith forest and maintenance of age structure of forests.Strategy 2. Reduction of significance of forest functions on provision of favorable conditions for agriculture andother sectors of the economy, as well as prevention of erosive migration of radionuclides in conjunction withendogenous measures on compensation of changes in area, biomass and age structure of forests.The first strategy may be characterized as based on endogenous approach with compensation of detriment by forest-growing methods, since adaptation to this detriment with endogenous methods is of low efficiency. The secondstrategy could be characterized as the most exogenous one with endogenous compensation of detriment of the mostvulnerable indices of forest conditions.For all adaptation strategies, the implementation of following measures is necessary:FOREST-GROWING
� enhancement of measures on forest protection against pests and diseases;� implementation of resistant wood species which provide the best productivity under climate conditions
being formed;SCIENTIFIC
� development of methods of monitoring and forecasting of forest conditions;� development of methods of information support of decision-making process for forestry;� development of methodology of forest protection against pests and diseases;� extension of researches on selection and introduction of new species;
POLICY� elaboration of legislation on criteria of forestry;

UKRAINE
UNFCCC. The First National Communication 7-46
� rise of responsibility level of forest users and objects for forestry integrity;� provision of financial privileges for those who use forests in accordance with socially stipulated criteria;
FINANCIAL� creation of insurance and reserve funds to compensate expenses, related to works on maintenance of
sanitary conditions of forests, for relevant organizations.
7.5 Agricultural SectorWinter wheat is the main crop in Ukraine. Its share in total crop production makes 50% [7]. Zone of assured winterwheat cultivation in climate change conditions will, likely, move in the direction of northern latitudes, on theterritories of western Polyssia and right-bank Forest-steppe. According to preliminary assessments, its share ingrain-crops structure could decrease and make 20-25%. At the same time will be formed favorable conditions forenlarging area under other crops: barley, oat, corn, legumes (to 20%) as well as for areas under green fodder, forperennials sowings. Such a situation will forward the forming of intensive dairy cattle production zone on westernPolyssia and right-bank Forest-Steppe; and meat livestock production - steppe regions of Ukraine.It should be noted, that about 5.1-5.3 mln tons of grain are to be set apart for the population nutrition. So, hard grainproduction demand will grow.Thus, potential climate change will impact agricultural production greatly. At the same time the sector�s readinessto implement adaptation measures to meet expected climate change is rather low. One of important factors, affectingagriculture, is the reform of ownership relations in agriculture.Shift in agro-technical cultivation of winter wheat, including scarifying, sowing terms, depth of sowing, seedmaterial amount, predecessors rotation, chemical processing of the soil, agricultural implements does not provide forsufficient crop production level and reduction of its prime cost. Positive effect, that is, production growth is possibleto obtain only under increased amount of chemical fertilizers applied.According to CCCM scenario the steppe crop yield in and its quality could be raised by 10-20% compared to indicesobtained under changed meteorological conditions only. For that the amount of chemical fertilizers (nitrogenous,phosphoric, potassium) applied should be increased. As result expected, stalk�s productivity and grain mass in an earwill grow due to forming more grains in an ear, furthermore the grain quality will improve. It should be noted also,that the main yield increment (by 7-15%) is gained on account of increased amount of nitric fertilizers.Under climate conditions projected by UKMO scenario, the winter wheat yield could be raised up by applyingincreased dosage of chemical fertilizers, in the main, those nitric. In such a case nitric fertilizers applied will causethe crop yield growth by 300-600 kg/ha (1-6%).Thus, crops� adaptation options rise under optimal applying of complex chemical fertilizers, while domestic cropsand up-to-date cultivation technologies are used. However, increased applying of complex chemical fertilizers willlead to rise of prime cost of 100 kg of winter wheat by $20-30, according to preliminary assessments, if compare tocurrent level [8].To maintain a stable level of crop production and reduce its prime cost under climate changed in Ukraine, newdomestic crops with high adaptation abilities are to be created.The basic principles of the state regulation in agriculture in Ukraine have just started being formed. Foremost itrelates to the creation of legislation for the land reform, development of economically well-grounded measures onoptimum structure of arable land forming, implementation of national inventory and land monitoring, privatizationprogram in agriculture.Since climate changes could affect the structure of Ukrainian agriculture greatly, a National Program of AgricultureDevelopment in Ukraine is to be developed. Such program should include set of political, economic and technicalmeasures, that will enable to mitigate climate change impact on formed geographical, social and economicconditions of agricultural production. An adaptation policy realization in Ukraine may start with the acceleration ofthe land reform in Ukraine. One of premises of successful adaptation policy is increase of the genetic potential of domestic agricultural cropsand animal breeds, that requires implementation of appropriate research programs.Educational programs for experts in agriculture, particularly agronomists, specialists on plants protection,agronomists-chemists, veterinary surgeons should be amended.
7.6 References1. Benioff, R., S. Guill, and J.Lee (eds.) (In press). Guidance for Assessing Vulnerability and Adaptation.
Dordrecht, The Netherlands: Kluwer Academic Publishers.2. Country Studies Program, 1994. Guidance for Vulnerability and Adaptation Assessment. Version 1.0.
Washington. D.C.3. Кузьменко Ю.И., Ткалич П.В., Железняк М.И. ВОТОКС - система поддержки принятия решенийдля управления водохранилищем на основе критериев охраны окружающей среды. Сборникинститута кибернетики им.Глушкова "Системы поддержки принятия решений в экологии", Киев,1992. Стр. 66-78.
UKRAINE
UNFCCC. The First National Communication 7-47
4. Лісовий кодекс України. Київ, 1994, 55 с.5. Мигунова Е.С. Леса и лесные земли (количественная оценка взаимосвязей). М.: Экология, 1993. -
364 с.6. Шерешевский А.И., Железняк И.А., Бышовец Л.Б. Оценка изменений режима стока Днепра подвлиянием каскада водохранилищ. Доклады Международного симпозиума по специфическимаспектам гидрологических расчетов для целей водохозяйственного проектирования, Ленинград,1979 г.
7. Пшеница/ Под редакцией Л.А. Животкова. - К. Урожай, 1989.- 320 с.8. Методика определения экономической эффективности использования в сельском хозяйстверезультатов научно-исследовательских и опытно-конструкторских работ, новой техники,изобретений и рационализаторских предложений /Зав. ред. И.И. Оржеховской. - К. Урожай, 1986. -117 с.

UKRAINE
UNFCCC. The First National Communication 8-48
8. RESEARCH AND PUBLIC EDUCATIONKey to successfully mitigating and adapting to climate change is a better understanding of the global climate systemand the deleterious impacts human activities have on it. Besides requiring further study of the magnitude, timing,and regional and local impacts of climate change, acquiring this understanding also involves substantial additionalresearch on and dissemination of information to enable society to better prevent or - as some change is unavoidable -to accommodate climate change. In short, it calls for programs in both research and public education.Ukrainian Country Study in the frames of US Country Studies Program Support for Climate Change Studies wasthe first large-scale program in such direction. This program is nationally integrated effort that seeks to expandknowledge of this processes that affect climate change and to develop integrated models to predict these effects.Ukraine also participates in USA program to offer financial and technical support to qualified countries for thedevelopment of national climate change action plans. The support for national plans will help countries prepare tomeet their obligations under the UNFCCC and will also help them to conduct in-depth assessments of opportunitiesto promote technology transfer.Ultimately, of course, the public is the true arbiter of national response strategies and policies. Thus, the public musthave a solid understanding of global change science, particularly the consequences of policy options. To promotethis understanding, Ukrainian Country Study Team direct efforts to general education, communication, anddissemination of climate change information.The publication of four volumes on Country Study in Ukraine is envisaged. For the past period the work over thefirst volume, reflecting the results of the inventory on GHG emissions in Ukraine, was finished.

UKRAINE
UNFCCC. The First National Communication 9-49
9. THE FUTUREUkraine is currently examining the question of its future participation in the intergovernmental activitiesrelating to the UN Framework Convention on Climate Change.Participation in U.S. Initiative on Joint Implementation (USIJI), which is a pilot program to reduce netGHG emissions and establish an empirical basis and framework for approaches to joint implementation,is envisaged.
The UN Framework Convention on Climate Change commits Parties to the Convention todevelop national programs, plans and measures to respond to climate change. One of the key responsesthat countries can make is to prepare a national action plan and to adopt measures to mitigate of climatechange by reducing GHG emissions and enhancing sinks of greenhouse gases.The further researches are necessary because uncertainties in meeting commitments to future levels ofgreenhouse gas emissions and sequestration arise from several sources:
� The actual impact of measures may differ from their projected effects - some measures notcurrently scored at all may yield significant reductions, while some measures may yield lower-than-expected returns because they are not fully funded or are not fully effective for otherreasons.
� Future legislative and administrative options that address environmental, energy, agricultural,and forest concerns could significantly increase or decrease net greenhouse gas emissions.
� Changes in the scientific understanding of the relative global warming potentials of differentgases could change the estimates of the effectiveness of the measures in terms of carbon-equivalent emissions.
� Improvements in the understanding and management of agricultural and forest soil carbon asthey relate to the domestic carbon sink could change the net emissions baseline and theeffectiveness of measures.
Financial resources for Ukraine to conduct the in-depth climate change research are limited. Therefore, itis necessary to get additional funds for conducting the technology assessments for mitigation andadaptation measures, and for promoting the diffusion of technologies.The National Action Plan is not a one-policy development exercise, but it rather begins a process ofcontinual improvement in energy, environmental, and economic policy. In developing future steps,Ukraine will continue to seek out opportunities for emission reduction that provide for economic growthand job creation.


![Communication%20 climate[1]](https://img.dokumen.tips/doc/110x75/547a4d1cb4af9f206f8b4699/communication20-climate1.jpg)
