Embed Size (px)
Citation preview

UK Card Payments 2016

UK Card Payments 2016 provides a comprehensive summary of howand where cards were used in 2015. This includes data on how manycards consumers hold and what they bought with them, both in thehigh street and online. It also includes details of personal card spend-ing habits, and forecasts how our use of cards is expected to changeover the next ten years.
Sources of data
The data in this report, unless otherwise stated, are compiled from information gathered from The UK Cards Association members: UK-based issuers and institutions which process payment cardtransactions on behalf of UK-based merchants, retailers and other service providers.
All data, unless otherwise stated, cover annual figures as at 31 December 2015.
For queries about the data in this publication please contact Information Management:
David Obuwa/Nigel Burt/Silvija KrupenaTel 020 3217 8421/8244/8460Email [email protected]
For member enquiries relating to users and holders of cards, and forecasts, please contact Research and Customer Policy:
Email [email protected]
For membership information or further details about The UK Cards Association please contact:
Tel 020 3217 8200Email [email protected]
THE UK CARDS ASSOCIATION
A glossary of terms used in this publication canbe found at:
www.theukcardsassociation.org.uk
2
Cards are the most popular payment method in the UK by value. They allow cardholders to pay for goods and services easily, convenientlyand securely. Card spending accounted for 35% of GDP in 2015 and is critical for the economy. Card spending is expected to continue togrow over the next decade and to overtake cash as the predominant way to pay in volume as it already is in value.
Cards are issued by a variety of organisations such as banks, building societies and other financial services companies. The types of cardsissued and their level of functionality vary from card issuer to card issuer and between the different card schemes. The major cardschemes include American Express, Diners Club, JCB International, MasterCard and Visa. These schemes are the operators of the cardsystems that set the rules under which transactions occur, process transactions and provide a settlement function. This report looks in detail at how cards are held and used, and includes summary tables on cards in issue, the number and value of transactions, and point-of-sale terminals.
Other publications from The UK Cards Association are available by contacting: [email protected]
For more information please visit our website: www.theukcardsassociation.org.uk

The UK Cards Association is the trade body for the card payments industry in the UK, representing financial institutions which act as card issuers and acquirers. Members of the Association account forthe vast majority of debit and credit cards issued in the UK – issuing in excess of 58 million credit cardsand 98 million debit cards – and cover the whole of the payment card acquiring market.
The Association promotes co-operation between industry participants in order to progress non-competitive matters of mutual interest; informs and
engages with stakeholders to shape legal and regulatory developments; develops industry best practice; safeguards the integrity of the card payments
industry by tackling card fraud; develops industry standards; and co-ordinates other industry-wide initiatives such as those aiming to deliver innovation.
As an Association we are committed to delivering a card payments industry that is constantly focused on improved outcomes for the customer.
More information about The UK Cards Association is available at: www.theukcardsassociation.org.uk
UK CARD PAYMENTS 2016
3
Table of Contents
1 Overview of the UK Card Payments Market 51.1 Economic background 5 1.2 Number of cards in issue and holdings 51.3 Card transactions in 2015 71.4 Card acceptance in 2015 81.5 Credit card borrowings 91.6 The future 9
Key Statistics 2015 12
2 Payment Cards 142.1 Credit cards 142.2 Debit cards 252.3 Contactless cards 312.4 Other cards 34
3 Card Acceptance and E-commerce 363.1 Merchant acquiring 363.2 Card spending patterns 373.3 E-commerce 43
4 Card Fraud 464.1 UK Card fraud – overview 46 4.2 Fraud-to-turnover ratios 474.3 Remote purchase (CNP) fraud environment 474.4 Fraud in the face-to-face environment 47 4.5 Cross border fraud losses 47
5 Recent Regulatory Developments 485.1 FCA Credit Card Market Study 485.2 Payment Systems Regulator 485.3 Interchange Fee Regulation 495.4 Other developments 49
6 The Future of UK Card Industry 506.1 Forecasts 506.2 Card technology developments 53
7 International Comparisons 557.1 Number of cards in issue 557.2 Card usage 58
8 Summary Tables 608.1 Cards in issue 608.2 Transaction volumes 618.3 Transaction values 638.4 Point-of-sale terminals 65
BoxesCredit card profiles 19 Understanding credit card borrowings 21Online spending 24Debit cards for the visually impaired 25Consumer spending patterns online 45Research and analysis 48 Biometric technology 54
UK Card Payments 2016
Charts
THE UK CARDS ASSOCIATION
4
1 Overview of the UK Card Payments Market 51.1 Number of cards at year-end 61.2 Number of credit and charge card and debit card holders 61.3 Number of credit and debit card purchases 71.4 Value of credit and debit card purchases 71.5 Credit and debit card payment volume forecasts 11
2 Payment Cards 142.1 Number of credit and charge cards in issue 142.2 Number of credit and charge card holders 152.3 Proportion of credit card holders holding a given number
of cards in 2015 152.4 Number of credit card holders using their credit cards
at least once a month to make purchases 162.5 Comparison between credit card spending and lending 172.6 Volume and value of credit card transactions 172.7 Personal credit and charge cards: card types as a percentage
of total 182.8 Credit card borrowings (as a proportion of household income
and GDP) 212.9 Monthly gross credit card lending and repayments 222.10 Write-offs as a percentage of credit card borrowings 222.11 Quoted rates on unsecured consumer credit 2005-2015 232.12 Number of debit cards in issue by card types 262.13 Number of debit card holders 262.14 Debit card holding by demographic group 2015 272.15 Multiple debit card holding 2015 272.16 Adults using only debit cards or debit and credit cards 282.17 Debit card purchases 292.18 Debit card cash acquisition 302.19 Contactless cards in issue 312.20 Number of contactless terminals 322.21 Contactless card transactions in 2015 332.22 Cards with ATM functionality 34
3 Card Acceptance and E-commerce 363.1 Number of outlets and terminals accepting payment cards 363.2 Average number and value of transactions per terminal 373.3 Annual expenditure on credit and debit cards 383.4 Retail Sales: proportions using debit cards, credit and
charge cards, cash and cheques 383.5 Spending on payment cards by merchant sector 2015 393.6 Number of purchases by merchant sector 2015 393.7 Largest changes in card spending by merchant categories
between 2014 and 2015 403.8 Face-to-face and online spending by merchant sectors in 2015 433.9 Proportion of online purchases and spending by merchant
sectors 2015 443.10 Comparison of face-to-face and online ATVs by merchant
sectors 2015 44
4 Card Fraud 464.1 Fraud losses on UK payment cards 464.2 Fraud-to-turnover ratios 47
6 The Future of UK Card Industry 506.1 Debit cards: UK purchase forecasts 506.2 Credit and charge cards: UK purchase forecasts 52
7 International Comparisons 557.1 Number of debit and credit cards per capita,
2005 and 2014, Europe 567.2 Number of debit and credit cards per capita,
2005 and 2014, Rest of the world 577.3 Credit and debit card payments per capita,
2005 and 2014, Europe 587.4 Credit and debit card payments per capita,
2005 and 2014, Rest of the world 597.5 Proportion of card purchases and cash acquisition,
2005 and 2014, Europe 597.6 Proportion of card purchases and cash acquisition,
2005 and 2014, Rest of the world 59
Tables
3 Card Acceptance and E-commerce 363.1 Comparing top ten merchant categories for payment card
usage in 2015 and 2014 – based on number of purchases 413.2 Comparing top ten merchant categories for payment card
usage in 2015 and 2014 – based on value of purchases 413.3 Comparing top ten merchant categories for payment card
usage in 2015 and 2014 – based on average value of purchases 42

1. Overview of the UK Card Payments Market
5
1.1 Economic background
Card spending has increased consistently since payment cards were first introducedas a payment mechanism. The growth has been mainly the result of a long termshift away from other types of payment (typically cash and cheques) to paymentcards. This well established trend is probably the main reason why payment cardspending continues to be buoyant, while some parts of the economy might be experiencing somewhat different trends.
This growth has been consistent regardless of what else might be happening inthe wider economy, such as consumer booms, recessions or changes of economicpolicy, although in periods where consumers have benefitted from the benign performance of some economic indicators, this may also have contributed to theunderlying growth of spending on payment cards.
Having said this, in many ways, in 2015 the economic environment in the UKwas broadly favourable for consumers. Some of the highlights1 are as follows:
• Gross domestic product has grown in each of the last three years, and the country has been out of recession since 2009;
• Inflation is low;
• Employment is higher than it has ever been;
• Unemployment has been declining for more than four years;
• The cost of borrowing continues to be very low.
Conversely:
• Average earnings growth, although it recovered a little in 2015, is still lower than pre ‘credit crunch’ levels;
• House price inflation has risen sharply, especially in London and the South East;
• Rising house prices and tighter mortgage lending criteria since the recession are the main factors behind falling home ownership, rising rentals and fewer younger home owners.
With this somewhat mixed picture it is not surprising that products like paymentcards, which offer convenience to consumers, should continue to see growth at theexpense of cash and cheques. And this convenience is often at no cost. Lookinginto the future, as mobile internet browsing becomes ever more prevalent, thelikelihood is that these trends will continue for a considerable number of years.
Meanwhile, interest rates have operated at their current level of 0.5% since March 20092. This is a historically low level and such is the post-financial crashenvironment that it is unclear when interest rates will rise to more conventionallevels. Low interest rates are generally good for the economy if they encouragethe cycle of bank lending, investment, jobs, employment and growth; but the persistent low level of the interest rate indicates that the level of economic activity is not yet at an optimum level. However, low interest rates have coincidedwith low mortgage and consumer credit rates, although much of this owes tocompetition in these markets, driving lending in both.
1.2 Number of cards in issue and holdings
Cards continue to play a crucial role in everyday life. This is evident in their holdings,which have increased consistently over the past decade. Additionally, cards havebeen instrumental in the ongoing transition to a digital economy. There is alsosome evidence3 that shows card payments help stimulate economic growth, byboosting consumption, production and employment. In 2015 the total number of payment cards in issue increased by 2.3% to 163 million. Payment cards aredefined as debit, credit and charge cards and can be used to make payments and withdraw cash.
The highlight of the year was the exceptional growth in the circulation and use ofcontactless payment cards. Contactless cards have the same level of protectionas traditional Chip & PIN cards, and contain multiple layers of security. Therewere 79 million of these cards in circulation at the end of 2015, representing anincrease of 37% during the year. Most of this growth was from the debit cardproduct, which grew by 49% to 55 million cards in circulation.
With ATM-only cards included, the total number of cards in circulation at the endof the year totalled 176 million. ATM-only cards can only be used to withdrawcash, and only from cash machines. The number of these cards decreased significantly during the year, driven by the consolidation and closure of dormantcards and upgrades to debit cards.
Within the payment card market, credit and charge cards rose by 2.1% to 65 million. There was some consolidation of portfolios in 2015 which resulted in a rise in the number of gold cards. The number of platinum cards was also up modestly (1.2%), totalling 18 million at the end of the year. Meanwhile, thenumber of affinity credit cards amounted to 1.3 million, following a decrease of1.3% during the year, with the number of co-branded credit cards (cards typicallyoffered by an issuer and a retail merchant) down by 45% to 3.3 million.
UK CARD PAYMENTS 2016
1 Source: Office for National Statistics2 Source: Bank of England3 More details at: https://usa.visa.com/visa-everywhere/global-impact/moodys-analytics-study-the-global-impact-of-electronic-payments.html
Number of contactless cards:
24%*36%* 49%*
2014201379 million
*of all cards
38 million 58 million2015

THE UK CARDS ASSOCIATION
6
Card
hold
ers
mill
ions
Credit and charge cards Debit cards
2005 2006 2007 2008 2009 2010 2011 2012 2013 2014 2015
60
50
40
30
20
10
0
Chart 1.2Number of credit and charge card and debit card holders
Mill
ions
Credit Charge
2005 2006 2007 2008 2009 2010 2011 2012 2013 2014 2015
120
100
80
60
40
20
0
ATM-onlyDebit
Chart 1.1Number of cards at year-end
Source: The UK Cards Association
Source: Payments UK
The number of debit cards increased by 2.5% to 99 million; some of which wasdriven by organic growth in the number of current accounts. Visa Debit cards accounted for 96% of all debit cards and grew by 2.8% to reach 94.7 million. The number of Debit MasterCard cards fell by 5.4% to 3.2 million.
The last decade has seen increased debit card holding whilst credit card holdinghas been largely stable. In 2015 there were 49.1 million debit card holders, anincrease of 0.3 million from 2014. More than nine in ten UK adults have debitcards in their wallets and purses. Increasing debit card holding over the past fewyears is attributed to both population growth, as well as the proliferation of bankaccounts issuing a debit card as standard to the account holder.
Cardholding is not distributed uniformly amongst all parts of society with somegroups much more likely to hold either debit or credit cards compared to othergroups. Full-time employees are much more likely to hold both debit and creditcards than other groups. This is also true for those in the higher income bracketscompared to lower income brackets. Card use also follows similar trends withthose with higher incomes and in full-time employment, on average making morepayments using their cards than those who may be unemployed and/or withlower levels of income. Debit card holding and usage is also more commonamong younger people than older.
Future debit card holding growth is expected to be largely driven by populationgrowth. Adults expect debit cards to be issued as standard when opening newbank accounts. Young account holders in particular will expect debit cards withnew accounts as they grow up using this payment method.
There were 31.8 million people in the UK with a credit or charge card in 2015.This equates to around six in ten adults aged over 18 years holding a credit orcharge card. The total for 2015 was a slight increase on the previous year’s figures and in line with the trend from the past couple of years. Income is one ofthe strongest determinants of credit and charge cardholding. Over three quartersof people in households with annual incomes over £50,000 have a credit cardcompared to less than a quarter of people in households where the annual income is less than £10,000.
Age is another indicator which affects the propensity to hold credit cards with lessthan a fifth of those in the youngest age bracket holding a credit card in 2015. Thiscompares to at least half of those in all other age groups holding a credit card.
The number of credit cards per holder in 2015 was similar to the previous year,at 1.94 credit cards per holder. Just over half of all cardholders had only onecredit or charge card in their wallet in 2015 which was similar to the previousyear. Only 10% of cardholders had four or more cards in 2015.
Cardholders
CRED
IT
DEBI
T
MILLION49.1
MILLION31.8
UK CARD PAYMENTS 2016
7
1.3 Card transactions in 2015
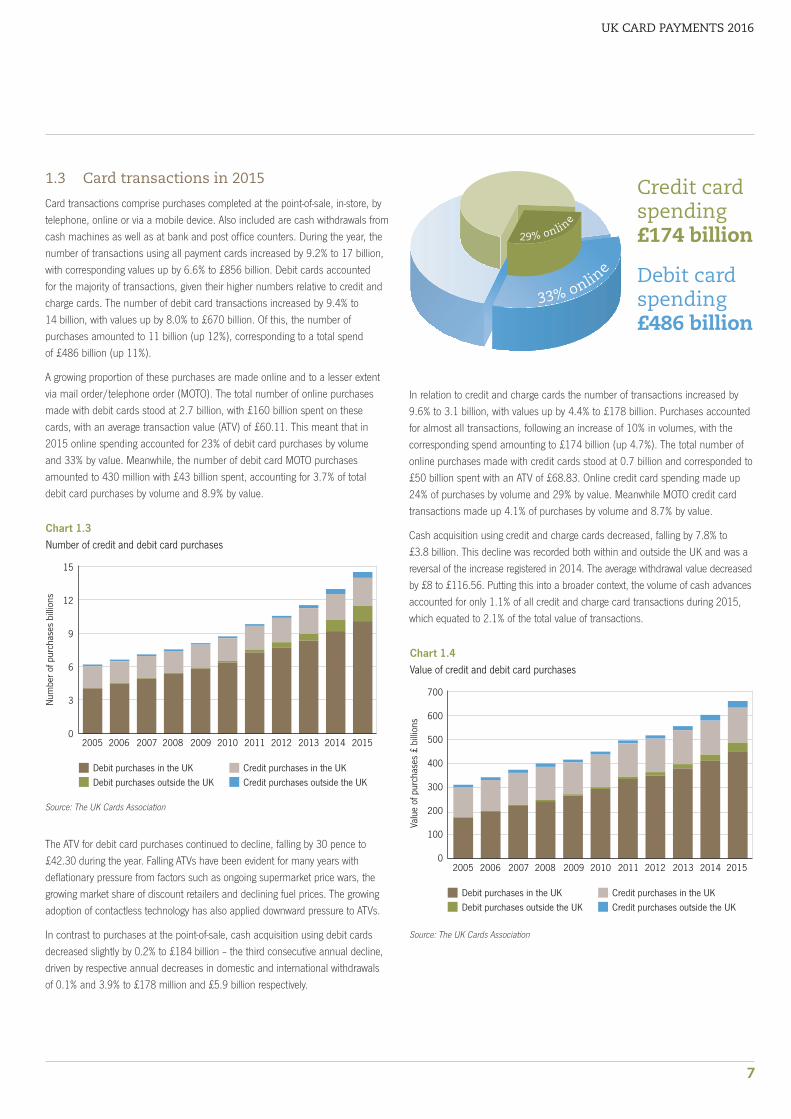
Card transactions comprise purchases completed at the point-of-sale, in-store, bytelephone, online or via a mobile device. Also included are cash withdrawals fromcash machines as well as at bank and post office counters. During the year, thenumber of transactions using all payment cards increased by 9.2% to 17 billion,with corresponding values up by 6.6% to £856 billion. Debit cards accounted for the majority of transactions, given their higher numbers relative to credit andcharge cards. The number of debit card transactions increased by 9.4% to 14 billion, with values up by 8.0% to £670 billion. Of this, the number of purchases amounted to 11 billion (up 12%), corresponding to a total spend of £486 billion (up 11%).
A growing proportion of these purchases are made online and to a lesser extentvia mail order/telephone order (MOTO). The total number of online purchasesmade with debit cards stood at 2.7 billion, with £160 billion spent on thesecards, with an average transaction value (ATV) of £60.11. This meant that in2015 online spending accounted for 23% of debit card purchases by volume and 33% by value. Meanwhile, the number of debit card MOTO purchasesamounted to 430 million with £43 billion spent, accounting for 3.7% of total debit card purchases by volume and 8.9% by value.
The ATV for debit card purchases continued to decline, falling by 30 pence to£42.30 during the year. Falling ATVs have been evident for many years with deflationary pressure from factors such as ongoing supermarket price wars, thegrowing market share of discount retailers and declining fuel prices. The growingadoption of contactless technology has also applied downward pressure to ATVs.
In contrast to purchases at the point-of-sale, cash acquisition using debit cards decreased slightly by 0.2% to £184 billion – the third consecutive annual decline,driven by respective annual decreases in domestic and international withdrawals of 0.1% and 3.9% to £178 million and £5.9 billion respectively.
In relation to credit and charge cards the number of transactions increased by9.6% to 3.1 billion, with values up by 4.4% to £178 billion. Purchases accountedfor almost all transactions, following an increase of 10% in volumes, with the corresponding spend amounting to £174 billion (up 4.7%). The total number ofonline purchases made with credit cards stood at 0.7 billion and corresponded to£50 billion spent with an ATV of £68.83. Online credit card spending made up24% of purchases by volume and 29% by value. Meanwhile MOTO credit cardtransactions made up 4.1% of purchases by volume and 8.7% by value.
Cash acquisition using credit and charge cards decreased, falling by 7.8% to £3.8 billion. This decline was recorded both within and outside the UK and was areversal of the increase registered in 2014. The average withdrawal value decreasedby £8 to £116.56. Putting this into a broader context, the volume of cash advancesaccounted for only 1.1% of all credit and charge card transactions during 2015,which equated to 2.1% of the total value of transactions.
Valu
e of
pur
chas
es £
bill
ions
Debit purchases in the UKDebit purchases outside the UK
2005 2006 2007 2008 2009 2010 2011 2012 2013 2014 2015
Credit purchases in the UKCredit purchases outside the UK
700
600
500
400
300
200
100
0
Chart 1.4Value of credit and debit card purchases
Num
ber o
f pur
chas
es b
illio
ns
Debit purchases in the UKDebit purchases outside the UK
2005 2006 2007 2008 2009 2010 2011 2012 2013 2014 2015
Credit purchases in the UKCredit purchases outside the UK
15
12
9
6
3
0
Chart 1.3Number of credit and debit card purchases
Source: The UK Cards Association
Source: The UK Cards Association
Debit cardspending£486 billion
Credit card spending £174 billion 29% onlin
e
33% onlin
e

While the majority of card payments still take place at POS terminals in the face-to-face environment, the industry is witnessing a continued growth in e-commerceand m-commerce as more people choose to shop online and on-the-go. Thistrend will likely lead to an increasing number of merchants offering their goodsand services online.
THE UK CARDS ASSOCIATION
8
The strong adoption of contactless technology during 2015 was evident with significant increases in transactions and values. The number of transactions and the total amount spent both tripled, with just over one billion contactlesstransactions recorded last year. This equated to £7.75 billion in spending, of which £6.78 billion was on contactless debit cards with an ATV of £7.44.
1.4 Card acceptance in 2015
The merchant acquiring industry has undergone a great deal of change in 2015,developing different propositions and competing across an increasing range ofbusiness models from multi-channel sales formats through to discount retailersand online businesses. As card acceptance has proven to provide significant benefits to businesses, the number of merchants accepting cards continued to increase and reached 1.0 million, while the number of outlets amounted to 1.2 million.
The total number of point-of-sale (POS) terminals in the UK rose by 10% to almost 2 million. The number of acquirer owned terminals increased by 3.8%to just above 0.7 million, while the number of retailer owned terminals grew by14% to 1.2 million. The continuing roll out of contactless acceptance may havecontributed to this growth and by the end of the year 43% of all acquirer ownedterminals were contactless. Also, the adoption of mobile POS (mPOS) terminalsincreased among sole traders and small businesses.
Data collected from UK merchant acquirers showed the total number of card purchases rose by over 11% to reach 13 billion, while the value spent increased by8.3% to £622 billion. It is likely that this increase has been driven by favourableeconomic conditions and consumer confidence alongside the expansion in online and contactless payments. The number of card payments made via the internet amounted to 1.6 billion, representing 12% of total card purchases at UK merchants. Corresponding online spending amounted to £145 billion accountingfor 23% of total card expenditure. Meanwhile, contactless transactions at UK retailers reached 1.05 billion, amounting to £7.75 billion.
1 million merchants
2 million POS terminals
23% of card spending at UK merchants was online in 2015, up from 21% in 2014
23%2015
21%2014
UK CARD PAYMENTS 2016
9
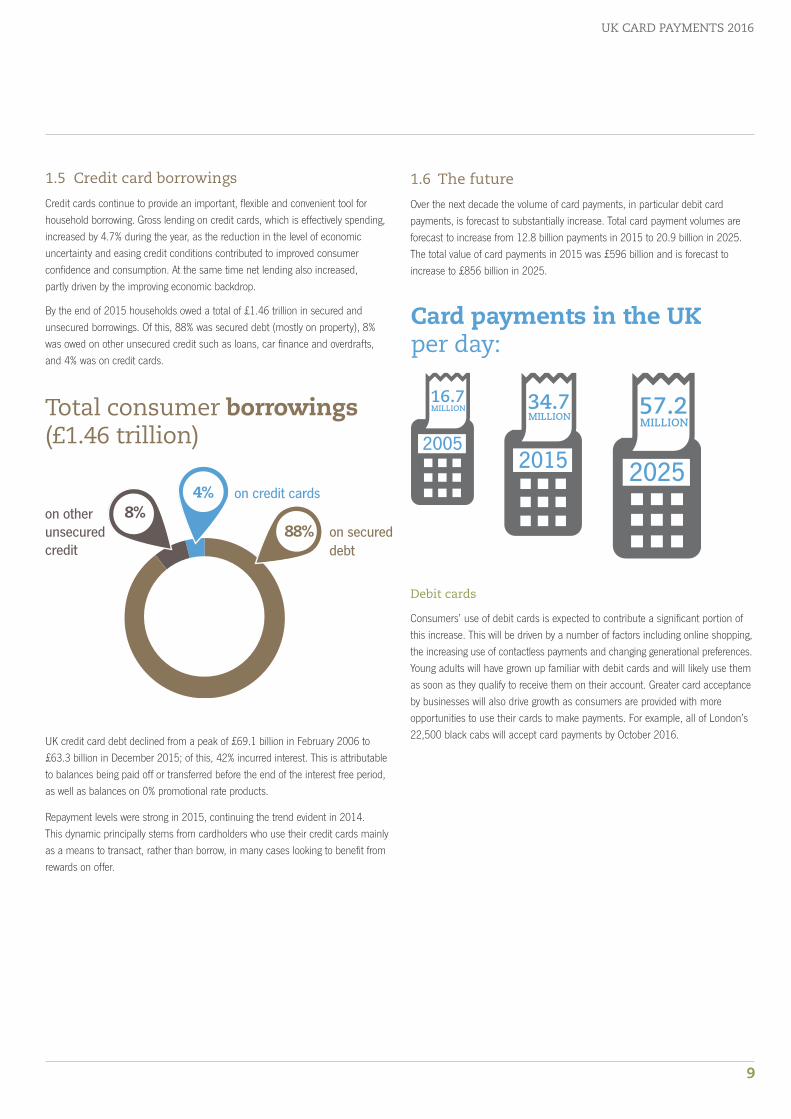
Card payments in the UKper day:
20052015 2025
16.7MILLION 34.7
MILLION57.2MILLION
1.5 Credit card borrowings
Credit cards continue to provide an important, flexible and convenient tool forhousehold borrowing. Gross lending on credit cards, which is effectively spending,increased by 4.7% during the year, as the reduction in the level of economic uncertainty and easing credit conditions contributed to improved consumer confidence and consumption. At the same time net lending also increased, partly driven by the improving economic backdrop.
By the end of 2015 households owed a total of £1.46 trillion in secured and unsecured borrowings. Of this, 88% was secured debt (mostly on property), 8%was owed on other unsecured credit such as loans, car finance and overdrafts,and 4% was on credit cards.
Total consumer borrowings(£1.46 trillion)
on other unsecured credit
on secured debt
on credit cards4%
88%8%
1.6 The future
Over the next decade the volume of card payments, in particular debit card payments, is forecast to substantially increase. Total card payment volumes areforecast to increase from 12.8 billion payments in 2015 to 20.9 billion in 2025.The total value of card payments in 2015 was £596 billion and is forecast to increase to £856 billion in 2025.
UK credit card debt declined from a peak of £69.1 billion in February 2006 to£63.3 billion in December 2015; of this, 42% incurred interest. This is attributableto balances being paid off or transferred before the end of the interest free period,as well as balances on 0% promotional rate products.
Repayment levels were strong in 2015, continuing the trend evident in 2014. This dynamic principally stems from cardholders who use their credit cards mainlyas a means to transact, rather than borrow, in many cases looking to benefit fromrewards on offer.
Debit cards
Consumers’ use of debit cards is expected to contribute a significant portion ofthis increase. This will be driven by a number of factors including online shopping,the increasing use of contactless payments and changing generational preferences.Young adults will have grown up familiar with debit cards and will likely use themas soon as they qualify to receive them on their account. Greater card acceptanceby businesses will also drive growth as consumers are provided with more opportunities to use their cards to make payments. For example, all of London’s22,500 black cabs will accept card payments by October 2016.

THE UK CARDS ASSOCIATION
10
The growing importance of debit cards has been reinforced over the last couple of years by the increasing popularity of contactless payments in the UK. Roll outof contactless cards to cardholders is forecast to continue, and customers will become more accustomed to using the contactless functionality on their cards to make payments. Contactless payments have resulted in consumers becomingincreasingly willing to make low value payments by card. At the same time, smallbusinesses in particular are becoming increasingly willing to accept cards for lowvalue payments. This is forecast to result in migration away from cash towardscontactless cards. Contactless payment volumes will also rise as a result of migration of transactions that are currently made using Chip & PIN, although this will not increase the overall share of debit cards as a proportion of total payments in the UK. The higher contactless limit will increase the volume of contactless payments in the future; however most of this will be migration fromexisting Chip & PIN transactions. By 2025 contactless debit card payments areforecast to account for 47% of all debit card payments.
Technological change may see a large number of future debit card transactionstaking place without a physical payment card. For example, transactions may becompleted by using a mobile phone with NFC capabilities, rather than an actualdebit card. New mobile payment technologies such as Apple Pay are expected to be embraced in particular by the younger generation. Mobile payments areforecast to grow in popularity over the coming decade, further increasing the volume of contactless card payments.
Increasing debit card acceptance, especially among small businesses, is also expected to grow debit card payments over time. Card acceptance is expected tobecome more cost effective for smaller businesses as more solutions are developedthat specifically target SMEs. This will increase the opportunities available to consumers to use their debit cards, whereas previously they may have used alternative payment methods such as cash. Increasingly, consumers are expectingto be able to pay by card when shopping at retailers of all sizes.
Debit card payments
£450 billionpayments worth
2015
10.1 BILLION
£672 billionpayments worth
2025
17.3 BILLION
Debit card use is also likely to increase among small businesses as card issuanceto these businesses increases. As a result these businesses are anticipated tomake more payments by debit card. As the number of businesses that acceptcard payments continues to increase, there will be an ever-greater number of opportunities for businesses to use debit cards to pay their suppliers. These maybe used as an alternative to paying using other methods such as cheques orBacs Direct Credit.
Another major driver increasing debit card payment volumes over the next decadewill come from online shopping. This includes not only e-commerce, but also therapidly growing m-commerce sector, as rapid adoption of both smartphones andtablets by consumers has increased the methods available to them for accessingthe internet and shopping online. The growth in online shopping has seen manytraditional high street retailers increasing their online presence as they seek tocapitalise on the potential for making sales via the internet. This may be seen as a substitute for in-store purchases, form part of a new store experience (e.g. ‘click and collect’) or generate completely new purchases from customers who otherwise would not have easy access to a store. This assumes that debit cards(and credit cards) will remain the principal payment method in which consumerspay for online purchases. Therefore growth in online shopping translates togrowth in debit card payments. It should be noted that implementation of thePayments Services Directive II (PSD2) could result in third party providers offering account-to-account transfers in the online space. This may affect the future volume of online debit card payments, as account-to-account transferswould offer a new alternative method for consumers to pay for goods and servicesonline. Having said this, these new services would have to provide an advantageto consumers over paying by card in order to influence them to change their established payment habits and switch from using cards for online shopping.
By 2025 the volume of debit card purchases in the UK is forecast to grow to over17 billion payments. This represents a 70% increase compared to the number ofpayments in 2015, and is more than four times the number of payments madein 2005. The total value of debit card purchases in 2025 is expected to reach£672 billion.
Share of non-cash payments in the UK made using cards:
2005
2015
2025
46%
61%
69%
UK CARD PAYMENTS 2016
11
Credit cards
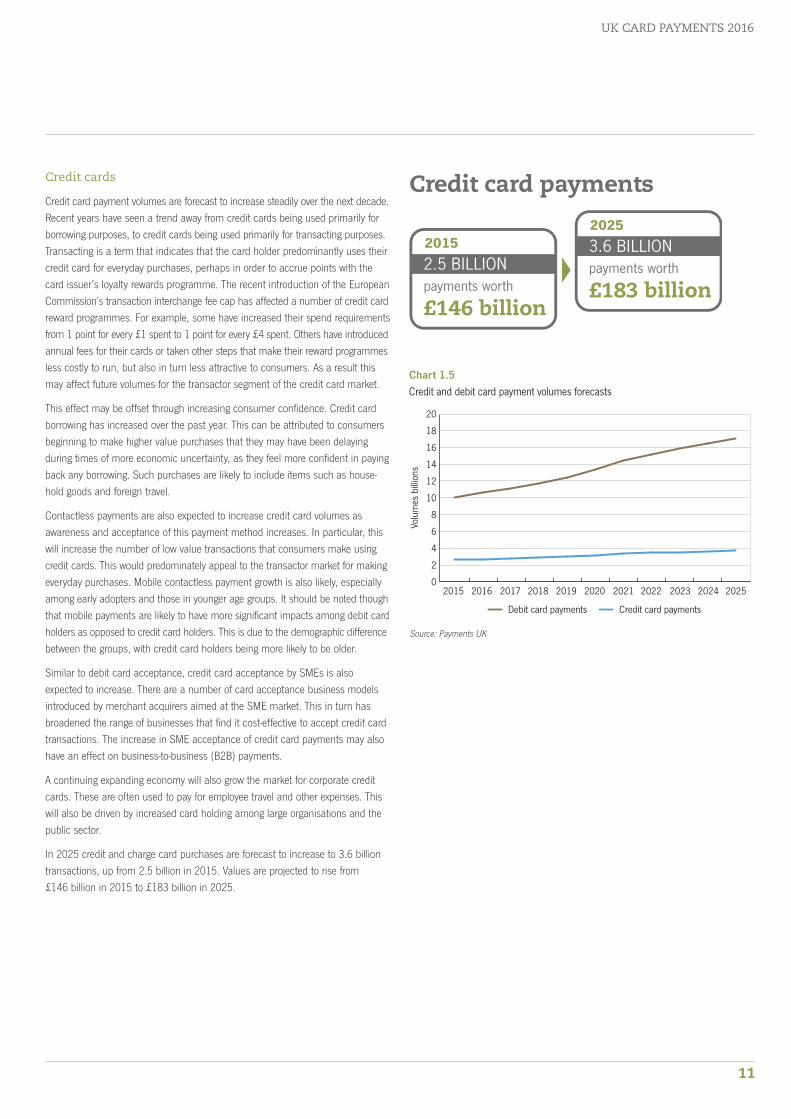
Credit card payment volumes are forecast to increase steadily over the next decade.Recent years have seen a trend away from credit cards being used primarily forborrowing purposes, to credit cards being used primarily for transacting purposes.Transacting is a term that indicates that the card holder predominantly uses theircredit card for everyday purchases, perhaps in order to accrue points with thecard issuer’s loyalty rewards programme. The recent introduction of the EuropeanCommission’s transaction interchange fee cap has affected a number of credit cardreward programmes. For example, some have increased their spend requirementsfrom 1 point for every £1 spent to 1 point for every £4 spent. Others have introducedannual fees for their cards or taken other steps that make their reward programmesless costly to run, but also in turn less attractive to consumers. As a result thismay affect future volumes for the transactor segment of the credit card market.
This effect may be offset through increasing consumer confidence. Credit cardborrowing has increased over the past year. This can be attributed to consumersbeginning to make higher value purchases that they may have been delaying during times of more economic uncertainty, as they feel more confident in payingback any borrowing. Such purchases are likely to include items such as house-hold goods and foreign travel.
Contactless payments are also expected to increase credit card volumes asawareness and acceptance of this payment method increases. In particular, thiswill increase the number of low value transactions that consumers make usingcredit cards. This would predominately appeal to the transactor market for makingeveryday purchases. Mobile contactless payment growth is also likely, especiallyamong early adopters and those in younger age groups. It should be noted thoughthat mobile payments are likely to have more significant impacts among debit cardholders as opposed to credit card holders. This is due to the demographic differencebetween the groups, with credit card holders being more likely to be older.
Similar to debit card acceptance, credit card acceptance by SMEs is also expected to increase. There are a number of card acceptance business modelsintroduced by merchant acquirers aimed at the SME market. This in turn hasbroadened the range of businesses that find it cost-effective to accept credit cardtransactions. The increase in SME acceptance of credit card payments may alsohave an effect on business-to-business (B2B) payments.
A continuing expanding economy will also grow the market for corporate creditcards. These are often used to pay for employee travel and other expenses. Thiswill also be driven by increased card holding among large organisations and thepublic sector.
In 2025 credit and charge card purchases are forecast to increase to 3.6 billiontransactions, up from 2.5 billion in 2015. Values are projected to rise from £146 billion in 2015 to £183 billion in 2025.
Volu
mes
bill
ions
Credit card paymentsDebit card payments
2015 2016 2017 2018 2019 2020 2021 2022 2023 2024 2025
20
18
16
14
12
10
8
6
4
2
0
Chart 1.5Credit and debit card payment volumes forecasts
Source: Payments UK
Credit card payments
£146 billionpayments worth
2015
2.5 BILLION
£183 billionpayments worth
2025
3.6 BILLION
THE UK CARDS ASSOCIATION
12
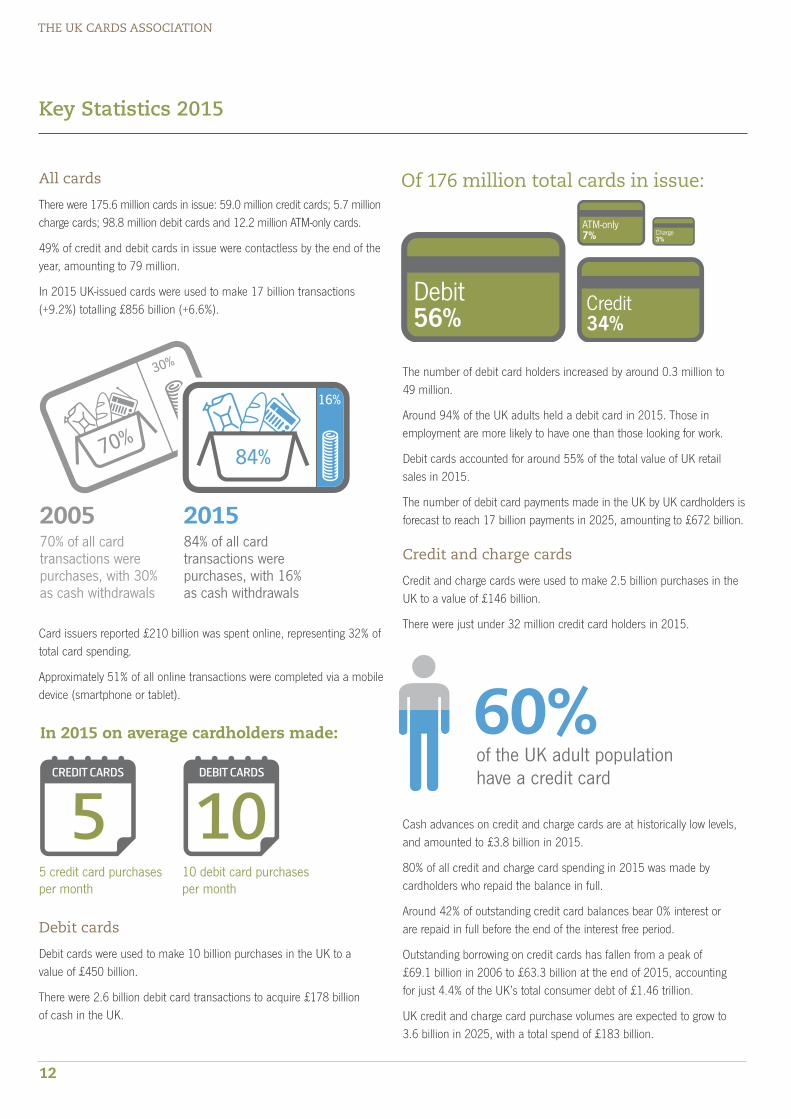
All cards
There were 175.6 million cards in issue: 59.0 million credit cards; 5.7 millioncharge cards; 98.8 million debit cards and 12.2 million ATM-only cards.
49% of credit and debit cards in issue were contactless by the end of theyear, amounting to 79 million.
In 2015 UK-issued cards were used to make 17 billion transactions(+9.2%) totalling £856 billion (+6.6%).
Card issuers reported £210 billion was spent online, representing 32% oftotal card spending.
Approximately 51% of all online transactions were completed via a mobiledevice (smartphone or tablet).
Debit cards
Debit cards were used to make 10 billion purchases in the UK to a value of £450 billion.
There were 2.6 billion debit card transactions to acquire £178 billion of cash in the UK.
The number of debit card holders increased by around 0.3 million to 49 million.
Around 94% of the UK adults held a debit card in 2015. Those in employment are more likely to have one than those looking for work.
Debit cards accounted for around 55% of the total value of UK retailsales in 2015.
The number of debit card payments made in the UK by UK cardholders isforecast to reach 17 billion payments in 2025, amounting to £672 billion.
Credit and charge cards
Credit and charge cards were used to make 2.5 billion purchases in theUK to a value of £146 billion.
There were just under 32 million credit card holders in 2015.
Cash advances on credit and charge cards are at historically low levels,and amounted to £3.8 billion in 2015.
80% of all credit and charge card spending in 2015 was made by cardholders who repaid the balance in full.
Around 42% of outstanding credit card balances bear 0% interest or are repaid in full before the end of the interest free period.
Outstanding borrowing on credit cards has fallen from a peak of £69.1 billion in 2006 to £63.3 billion at the end of 2015, accounting for just 4.4% of the UK’s total consumer debt of £1.46 trillion.
UK credit and charge card purchase volumes are expected to grow to 3.6 billion in 2025, with a total spend of £183 billion.
Key Statistics 2015
70% of all cardtransactions werepurchases, with 30%as cash withdrawals
84% of all cardtransactions werepurchases, with 16%as cash withdrawals
7
2005 2015
84%
16%
70%
30%
In 2015 on average cardholders made:
5 credit card purchasesper month
10 debit card purchasesper month
5 10CREDIT CARDS DEBIT CARDS
Of 176 million total cards in issue:
Debit56%
ATM-only7% Charge
3%
Credit34%
of the UK adult population have a credit card
60%

UK CARD PAYMENTS 2016
13
In 2015 for every £100 spent 8.3p was fraudulent
£100
Card acceptance
In 2015 UK businesses accepted 13 billion card payments totalling £622 billion (including foreign-issued cards).
was made via cards
78% of all UKretail spending
w
ATV in-store ATV online ATV contactless ATV cash withdrawal
7
Card average transaction valuesat UK businesses in 2015:
@£40.84
£88.70
£7.41£69.46
£
34% of allcard paymentsin the UKwere made insupermarkets
34%
The number of contactless POS terminals in the UK surpassed 0.3 million,up by 44% on 2014.
Online spending represented £23 of every £100 spent on cards at UK businesses.
Payment card fraud
Fraud losses on UK-issued payment cards increased by 18% to £568 millionin 2015. This represented an increase of £89 million; of which 70% wasfraud in the remote purchase (online, telephone and mail order) channels.
In January 2015 card expenditure at UK merchants surpassed a milestoneof £50 billion within a single month.
77% of card purchases at UK merchants are made using debit cards.