Embed Size (px)
Citation preview

May 2016
PRIVILEGED AND CONFIDENTIAL
1
Disclaimer
This presentation is confidential and may not be copied, published, distributed or transmitted. The information in this presentation is being provided by Ujjivan Financial Services Limited (also referred to as ‘Company’). By attending a meeting where this presentation is made, or by reading this presentation material, you agree to be bound by following limitations:
The information in this presentation has been prepared for use in presentations by Company for information purposes only and does not constitute, or should be regarded as, or form part of any offer, invitation, inducement or advertisement to sell or issue, or any solicitation or any offer to purchase or subscribe for, any securities of the Company in any jurisdiction, including the United States and India, nor shall it, or the fact of its distribution form the basis of, or be relied on in connection with, any investment decision or any contract or commitment to purchase or subscribe for any securities of the Company in any jurisdiction, including the United States and India. This presentation does not constitute a recommendation by the Company or any other party to sell or buy any securities of the Company.
This presentation and its contents are not and should not be construed as a prospectus or an offer document, including as defined under the Companies Act, 2013, to the extent notified and in force or an offer document under the Securities and Exchange Board of India (Issue of Capital and Disclosure Requirements) Regulations, 2009 as amended.
The Company may alter, modify, or otherwise change in any manner the contents of this presentation without obligation to modify any person of such change or changes.
No representation warranty implied as to and reliance or warranty, express or implied, is made to, no should be placed on, the fairness, accuracy, completeness or correctness of the information or opinions contained in this presentation. Neither Company nor any of its affiliates, advisors or representatives shall have any responsibility or liability whatsoever (for negligence or otherwise) for any loss howsoever arising from any use of this presentation or its contents or otherwise arising in connection with this presentation. The information set out herein may be subject to updating, completion, revision, verification and amendment and such information may change materially. This presentation is based on the economic, regulatory, market and other conditions as in effect on the date hereof. It should be understood that subsequent developments may affect the information contained in this presentation, which neither Company nor its affiliates, advisors or representatives are under an obligation to update, revise or affirm.
This presentation contains certain supplemental measures of performance and liquidity that are not required by or presented in accordance with Indian GAAP, and should not be considered as an alternative to profit, operating revenue or any other performance measures derived in accordance with Indian GAAP or an alternative to cash flow from operations as a measure of liquidity of the Company.
You must make your own assessment of the relevance, accuracy and adequacy of the information contained in this presentation and must make independent analysis as you may consider necessary or appropriate for such purpose. Any opinions expressed in this presentation are subject to change without notice and past performance is not indicative of future results. By attending this presentation you acknowledge that you will be solely responsible for your own assessment of the market position of the Company and that you will conduct your own analysis and be solely responsible for forming your own view of the potential future performance of the Company’s business.
This presentation contains forward‐looking statements based on the currently held beliefs and assumptions of the management of the Company, which are expressed in good faith and, in their opinion, reasonable. Forward‐looking statements involve known and unknown risks, uncertainties and other factors, which may cause the actual results, financial condition, performance, or achievements of the Company or industry results, to differ materially from the results, financial condition, performance or achievements expressed or implied by such forward‐looking statements. The risks and uncertainties relating to these statements include, but are not limited to, risks and uncertainties regarding expansion plans and the benefits there from, fluctuations in our earnings, our ability to manage growth and implement strategies, competition in our business including those factors which may affect our cost advantage, wage increases in India, our ability to attract and retain highly skilled professionals, our ability to win new contracts, changes in technology, availability of financing, our ability to successfully complete and integrate our expansion plans, liabilities, political instability and general economic conditions affecting our industry. Unless otherwise indicated, the information contained herein is preliminary and indicative and is based on management information, current plans and estimates. Industry and market‐related information is obtained or derived from industry publications and other sources and has not been verified by us. Given these risks, uncertainties and other factors, recipients of this document are cautioned not to place undue reliance on these forward‐looking statements. The Company disclaims any obligation to update these forward‐looking statements to reflect future events or developments.
This presentation is not an offer for sale of securities in the UNITED STATES or elsewhere.
2
Agenda
Overview of Ujjivan
Industry Growth Opportunities
Key Competitive Strengths
Proposed SFB and Growth Strategies
Financials

Overview of Ujjivan
4
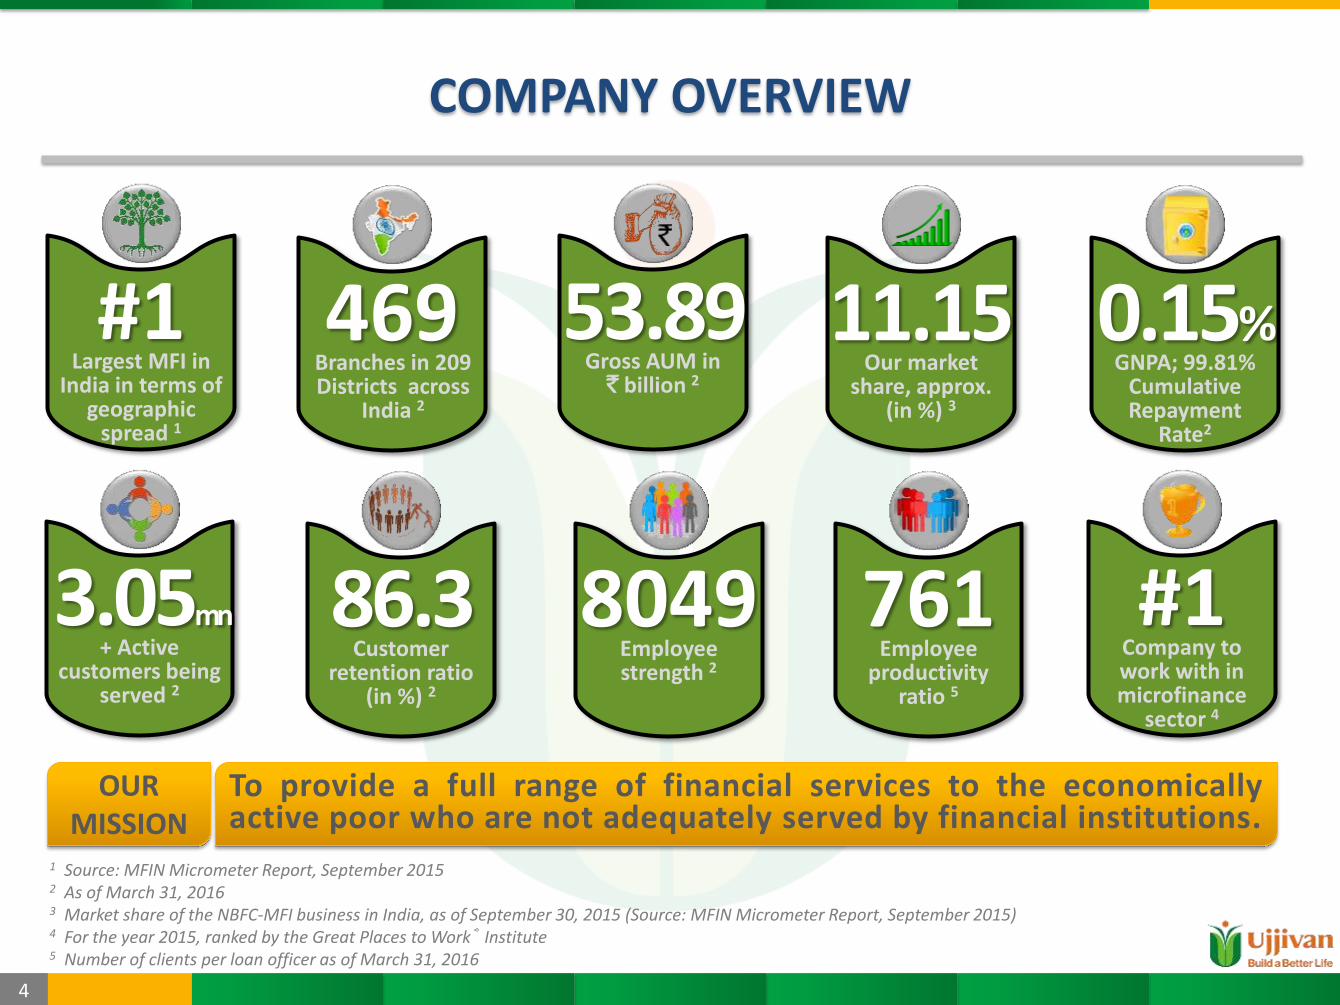
COMPANY OVERVIEW
1 Source: MFIN Micrometer Report, September 2015 2 As of March 31, 2016 3 Market share of the NBFC-MFI business in India, as of September 30, 2015 (Source: MFIN Micrometer Report, September 2015) 4 For the year 2015, ranked by the Great Places to Work® Institute 5 Number of clients per loan officer as of March 31, 2016
To provide a full range of financial services to the economically active poor who are not adequately served by financial institutions.
OUR MISSION
86.3 Customer
retention ratio (in %) 2
#1 Largest MFI in
India in terms of geographic
spread 1
469 Branches in 209 Districts across
India 2
11.15 Our market
share, approx. (in %) 3
#1 Company to work with in microfinance
sector 4
53.89 Gross AUM in
` billion 2
8049 Employee strength 2
761 Employee
productivity ratio 5
3.05mn + Active
customers being served 2
0.15% GNPA; 99.81%
Cumulative Repayment
Rate2
5
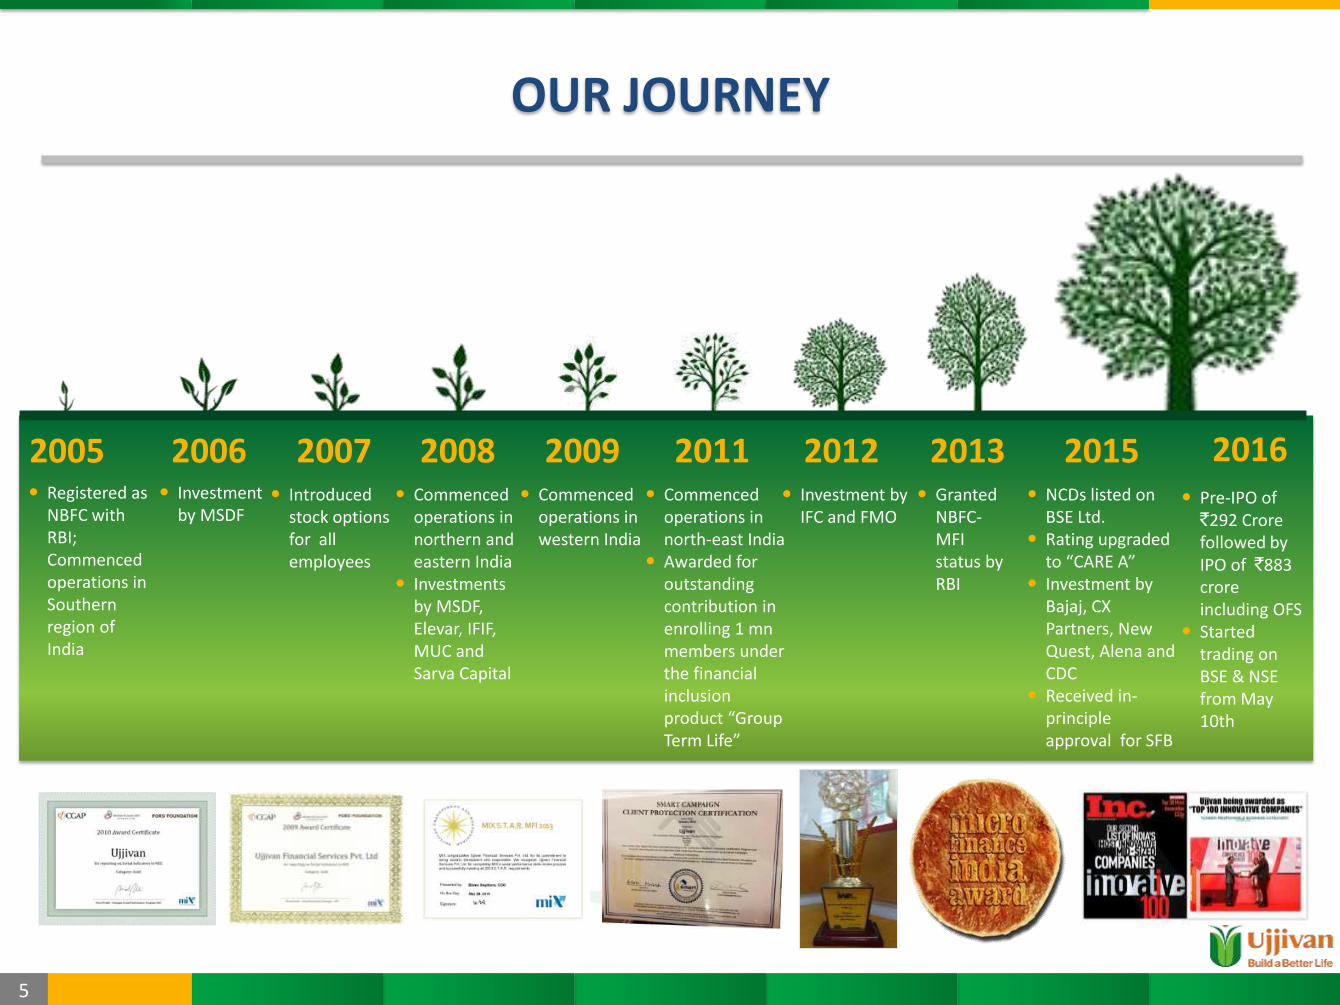
OUR JOURNEY
2005 2006 2007 2008 2009 2011 2012 2013 2015 Registered as
NBFC with RBI; Commenced operations in Southern region of India
Investment by MSDF
Introduced stock options for all employees
Commenced operations in northern and eastern India
Investments by MSDF, Elevar, IFIF, MUC and Sarva Capital
Commenced operations in western India
Commenced operations in north-east India
Awarded for outstanding contribution in enrolling 1 mn members under the financial inclusion product “Group Term Life”
Investment by IFC and FMO
Granted NBFC-MFI status by RBI
NCDs listed on BSE Ltd.
Rating upgraded to “CARE A”
Investment by Bajaj, CX Partners, New Quest, Alena and CDC
Received in-principle approval for SFB
2016 Pre-IPO of
`292 Crore followed by IPO of `883 crore including OFS
Started trading on BSE & NSE from May 10th

6
CUSTOMIZED PRODUCT OFFERINGS
CREDIT OFFERINGS
NON-CREDIT OFFERINGS
In the event of death of our customer or their spouse, insurance amount helps the beneficiary cover the existing loan and receive the benefits of a life cover.
MSE
Group
Housing
Individual Basis Range : `31K to 10L Existing and Open Market Interest Rate- 20% - 24% Purpose • Business • Agriculture • Livestock Secured/ Unsecured Tenure- 6-84 months
JLG Mode Range : `6K to 50K Interest Rate – 22% Purpose • Business loan • Consumption • Education Tenure – 12-24 months
Individual Basis Range : `51K to 10L Existing and Open market customers Interest Rate- 15.75% -24% Purpose • Housing & Home Improvement Secured/ Unsecured Tenure- 12-120 months

7
TARGET CUSTOMER SEGMENT
Monthly Household Income Level
< `5,000
`5,000- `10,000
`10,000 - `25,000
> `25,000
Largely Women
Age: 18 - 59 years
Annual Income:
- Urban - < `1.60L
- Rural - < `1.0 L
Salaried/ Self-Employed
Major Occupations
Micro entrepreneurs Fruits/ vegetable vendors Shop keepers House maids Marginal farmers

8
OUR GROWTH
1 22 68296 621
9921,041 1,104
1,386
2,316
3,244
1 8 37169
370625
703
1,126
1,617
3,274
5,389
Mar-06 Mar-07 Mar-08 Mar-09 Mar-10 Mar-11 Mar-12 Mar-13 Mar-14 Mar-15 Mar-16
Customers ('000) Gross AUM (Rs in Crore)
Pilot Phase Growth Phase
Industry Crisis Phase
Post Crisis Phase
Increased growth momentum since last few years; both in terms of customers & AUM

Industry Growth Opportunities

10
SFB OPPORTUNITY – BANKING FOR THE UN(DER)BANKED
Opportunity at the bottom of the pyramid India has 21% of the world’s unbanked adults
Source: Global Finolex database
While the RBI granted only 12 bank licenses in the last
two decades, it granted 10 in-principle approvals for
SFBs. This indicates RBI’s focus on financial inclusion and
providing banking services to the un-banked and under-
banked. Also indicates market-size and opportunity.
India is home to 21% of the world’s unbanked adults
and about two-thirds of South Asia’s.
Branch per 100,000 adults in India stands at 747
compared to 1,065 for Brazil and 2,063 for Malaysia.
Loans-to-GDP ratio is low (62%) relative to many of our
emerging markets peers as well as the US and UK.
The real annual disposable household income in rural
India forecasted to grow at CAGR of 3.6% over the next
15 years - rising incomes expected to enhance need for
banking services in rural areas.
India’s total banking sector credit expected to increase
at a CAGR of 18.1% to USD 2.4 trillion by 2017.
Population in 15-64 age group is expected to grow
strongly going ahead, giving further push to the number
of customers in banking sector.
Favourable demographics to propel growth
21%
12%
6%
61%
India
China
Indonesia
RoW
1,875 2,167
2,667 3,229
2010 2015 2020 2025
Source: McKinsey estimates, TechSci Research Notes : Data of GDP is from June ’07 – June ‘13
Real disposable household income in rural India (USD)
Adults without an account (%), 2014
11
8% 7%
5% 2% 2% 1%
0.5% 0.4%
20%
54%
Janalakshmi
Ujjivan
Equitas
ESAF
Utkarsh
Suryoday
RGVN
Disha
Bandhan
Others
MFIS – SIGNIFICANT FOR THE INDIAN BANKING LANDSCAPE
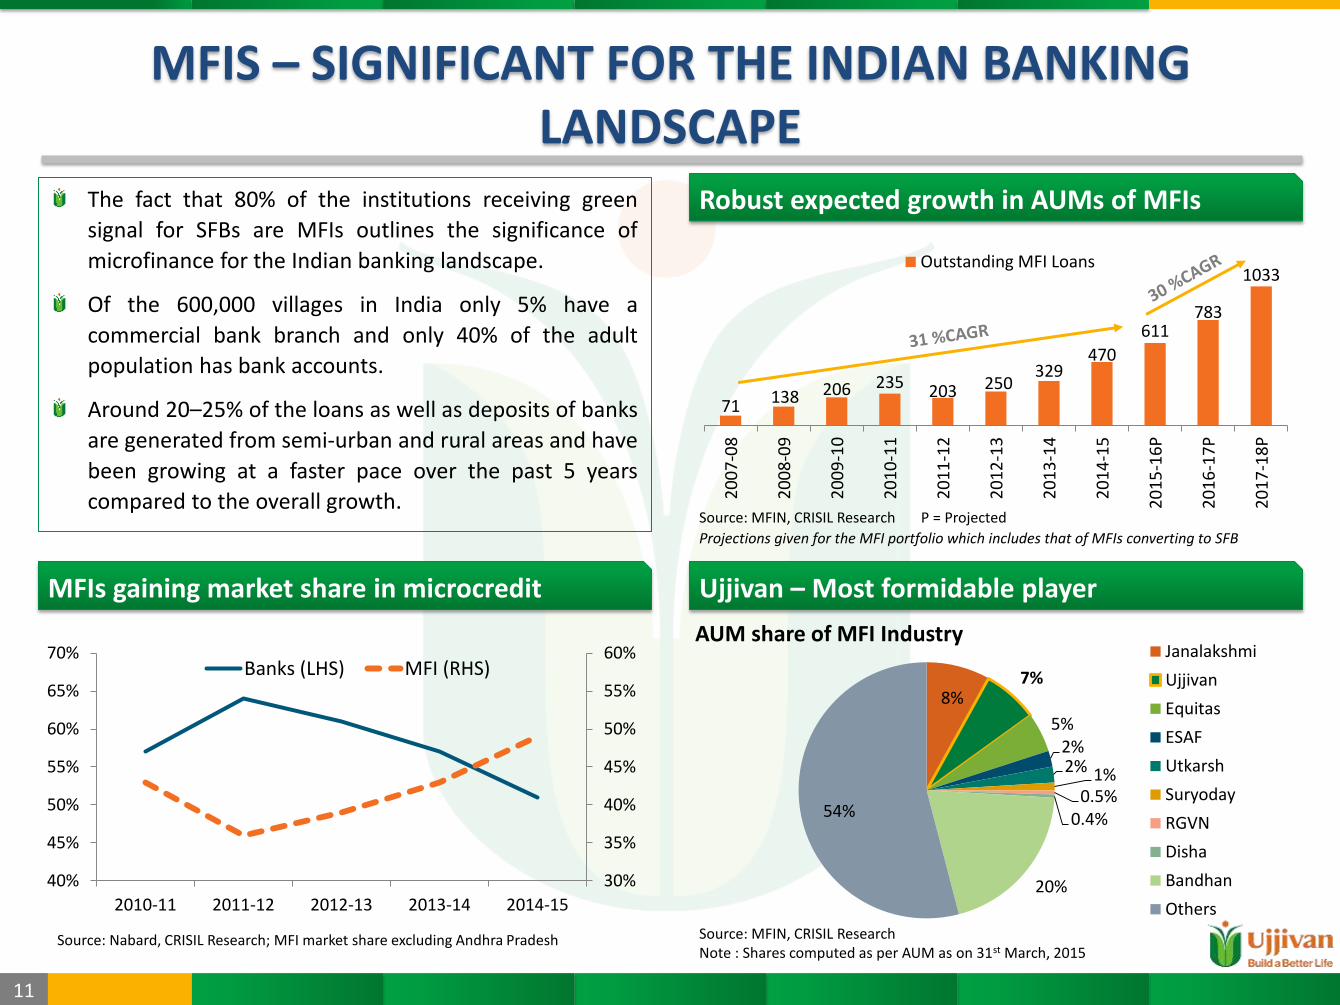
Source: MFIN, CRISIL Research P = Projected
Source: Nabard, CRISIL Research; MFI market share excluding Andhra Pradesh
71 138 206 235 203 250 329
470
611 783
1033
20
07
-08
20
08
-09
20
09
-10
20
10
-11
20
11
-12
20
12
-13
20
13
-14
20
14
-15
20
15
-16
P
20
16
-17
P
20
17
-18
P
Outstanding MFI Loans
30%
35%
40%
45%
50%
55%
60%
40%
45%
50%
55%
60%
65%
70%
2010-11 2011-12 2012-13 2013-14 2014-15
Banks (LHS) MFI (RHS)
The fact that 80% of the institutions receiving green
signal for SFBs are MFIs outlines the significance of
microfinance for the Indian banking landscape.
Of the 600,000 villages in India only 5% have a
commercial bank branch and only 40% of the adult
population has bank accounts.
Around 20–25% of the loans as well as deposits of banks
are generated from semi-urban and rural areas and have
been growing at a faster pace over the past 5 years
compared to the overall growth.
Source: MFIN, CRISIL Research Note : Shares computed as per AUM as on 31st March, 2015
AUM share of MFI Industry
Robust expected growth in AUMs of MFIs
MFIs gaining market share in microcredit Ujjivan – Most formidable player
Projections given for the MFI portfolio which includes that of MFIs converting to SFB

Key Competitive Strengths
13
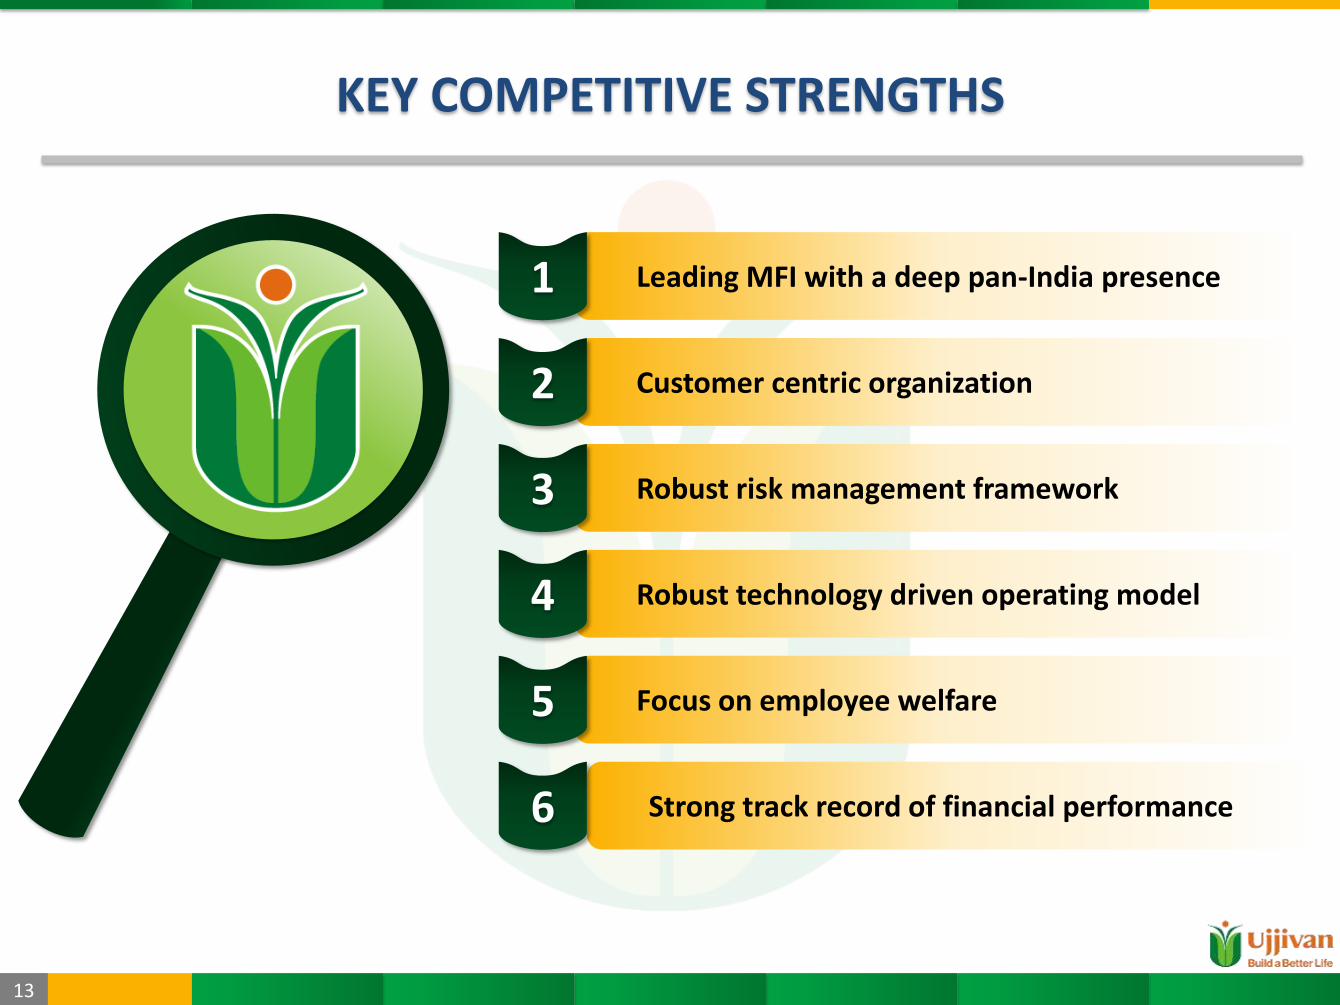
KEY COMPETITIVE STRENGTHS
Leading MFI with a deep pan-India presence
Customer centric organization
Robust risk management framework
Robust technology driven operating model
Focus on employee welfare
Strong track record of financial performance
1
2
3
4
5
6
14
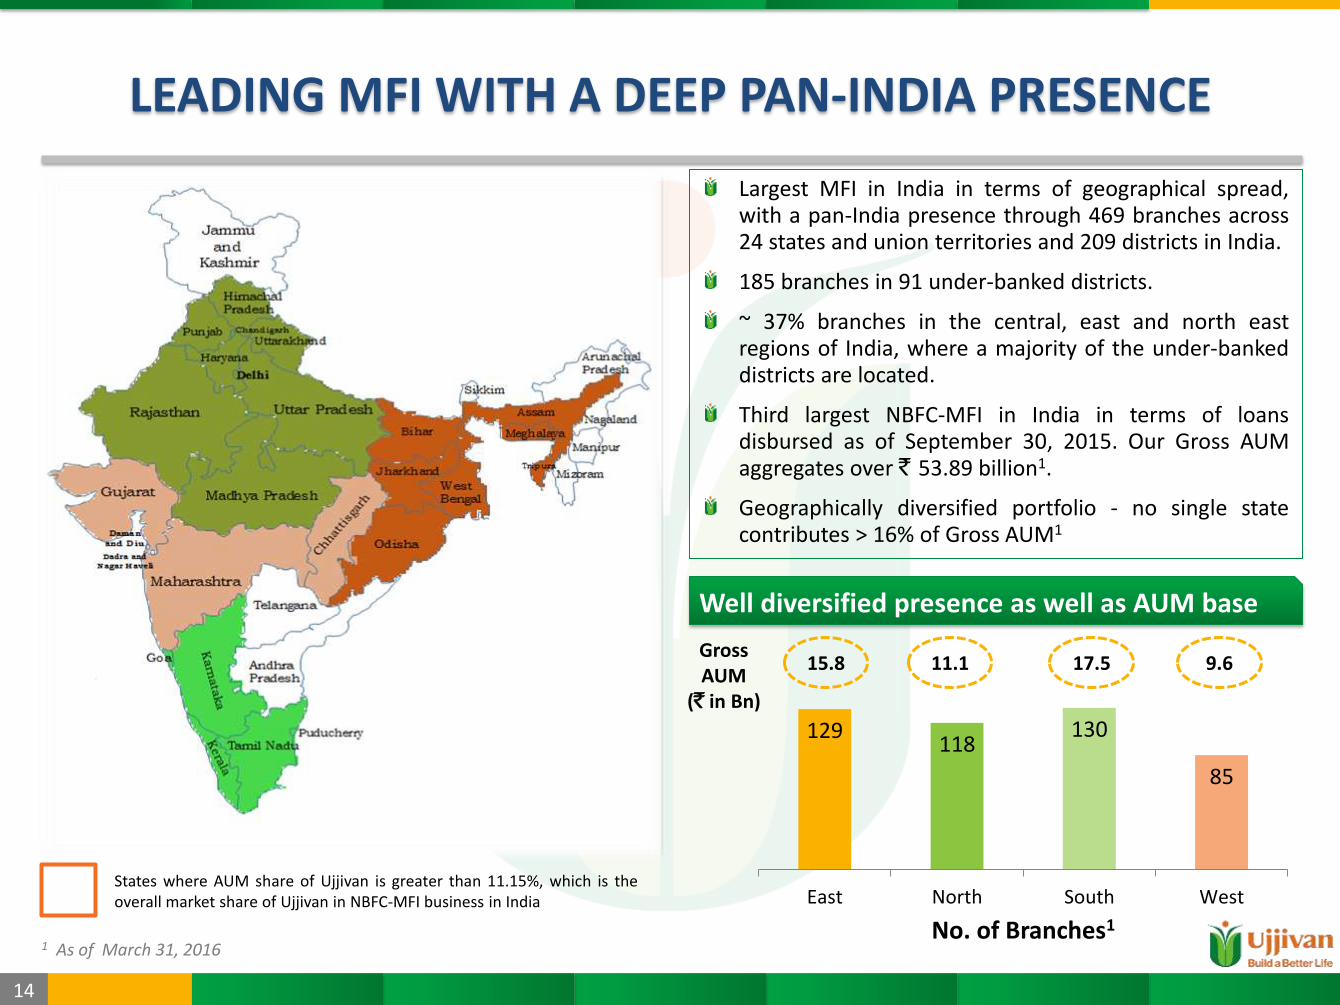
LEADING MFI WITH A DEEP PAN-INDIA PRESENCE
Largest MFI in India in terms of geographical spread, with a pan-India presence through 469 branches across 24 states and union territories and 209 districts in India.
185 branches in 91 under-banked districts.
~ 37% branches in the central, east and north east regions of India, where a majority of the under-banked districts are located.
Third largest NBFC-MFI in India in terms of loans disbursed as of September 30, 2015. Our Gross AUM aggregates over ` 53.89 billion1.
Geographically diversified portfolio - no single state contributes > 16% of Gross AUM1
Well diversified presence as well as AUM base
States where AUM share of Ujjivan is greater than 11.15%, which is the overall market share of Ujjivan in NBFC-MFI business in India
1 As of March 31, 2016
129 118
130
85
East North South West
No. of Branches1
Gross AUM
(` in Bn)
15.8 11.1 17.5 9.6

15
CUSTOMER CENTRIC ORGANIZATION
'Innovator in Responsible Business’
Inc India magazine (2013)
Socially Transparent and Responsible
(S.T.A.R.) MFI MIX (2013)
M2I score of 93% for “Excellent Adherence” in the Code of Conduct
Assessment (2015)
CUSTOMERS AT THE CORE OF
OUR OPERATIONS
Customer Feedback is
Key
Dedicated Service
Quality Dept.
Reliable & Accessible Channels
Financial Literacy
Programs
Product introduction based on customer feedback Constantly assessing our customers’ requirements
3-point escalation system: Customer care representatives at branches; National toll-free customer helpline; Regional grievance redressal officers
Focus on customer retention, customer protection and grievance redressal Adopted Smart Campaign’s global standards of Client Protection Principles
Partnered with the Parinaam Foundation Formulation and implementation of programs such as ‘Diksha’ and ‘Sankalp’ Also conduct community development programs to address critical local community needs.
Certified by Smart Campaign
(2013)
Over 3.05 million active customers with 86.3% retention rate!# # As of March 31, 2016
16
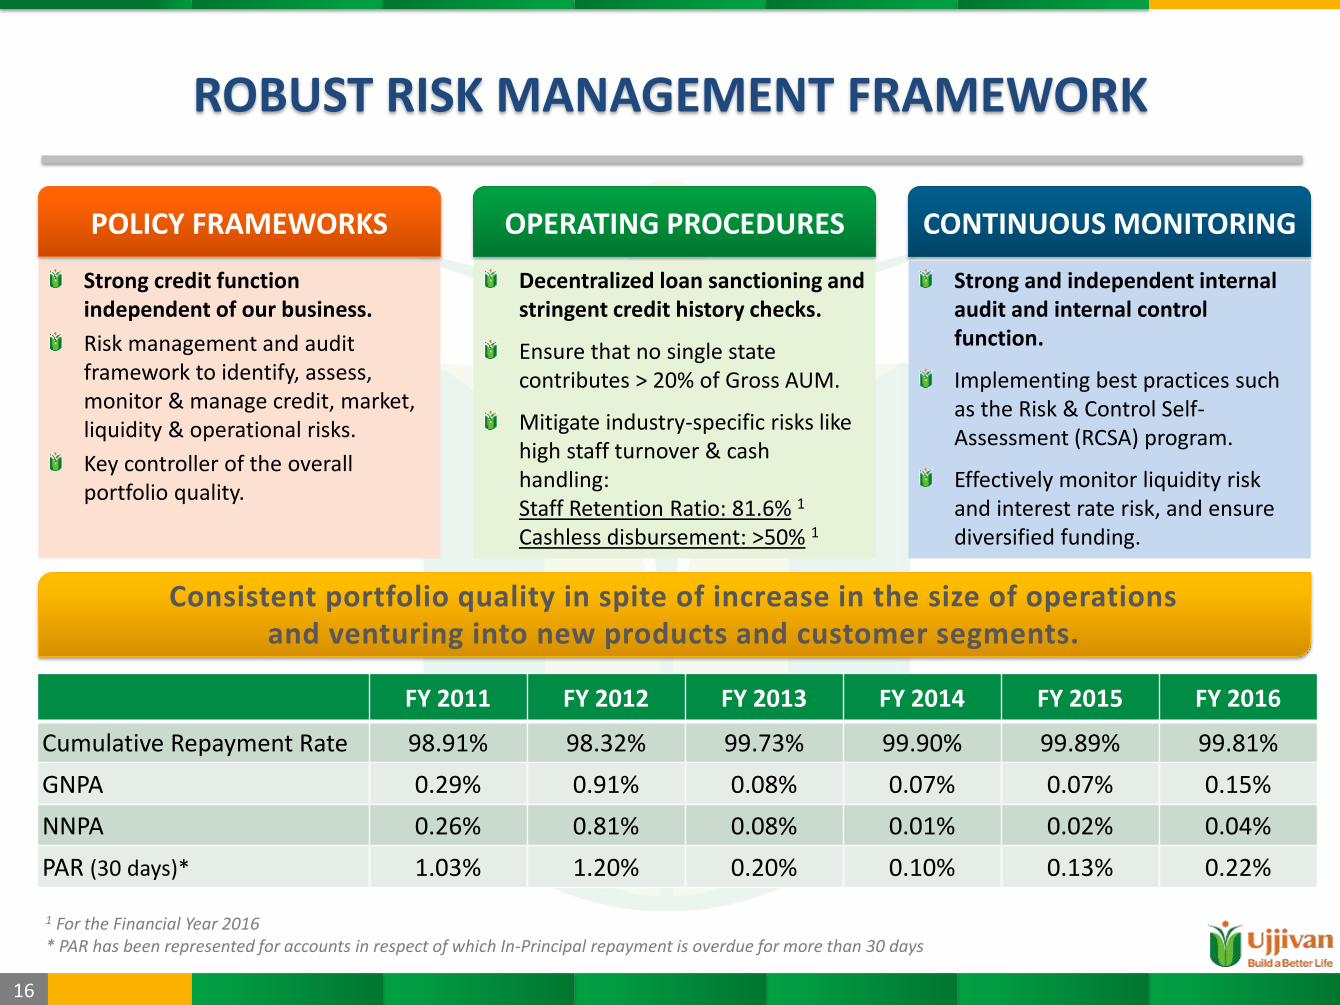
ROBUST RISK MANAGEMENT FRAMEWORK
FY 2011 FY 2012 FY 2013 FY 2014 FY 2015 FY 2016
Cumulative Repayment Rate 98.91% 98.32% 99.73% 99.90% 99.89% 99.81%
GNPA 0.29% 0.91% 0.08% 0.07% 0.07% 0.15%
NNPA 0.26% 0.81% 0.08% 0.01% 0.02% 0.04%
PAR (30 days)* 1.03% 1.20% 0.20% 0.10% 0.13% 0.22%
1 For the Financial Year 2016 * PAR has been represented for accounts in respect of which In-Principal repayment is overdue for more than 30 days
Consistent portfolio quality in spite of increase in the size of operations and venturing into new products and customer segments.
Strong credit function independent of our business.
Risk management and audit framework to identify, assess, monitor & manage credit, market, liquidity & operational risks.
Key controller of the overall portfolio quality.
OPERATING PROCEDURES
Decentralized loan sanctioning and stringent credit history checks.
Ensure that no single state contributes > 20% of Gross AUM.
Mitigate industry-specific risks like high staff turnover & cash handling: Staff Retention Ratio: 81.6% 1 Cashless disbursement: >50% 1
CONTINUOUS MONITORING
Strong and independent internal audit and internal control function.
Implementing best practices such as the Risk & Control Self-Assessment (RCSA) program.
Effectively monitor liquidity risk and interest rate risk, and ensure diversified funding.
POLICY FRAMEWORKS

17
ROBUST TECHNOLOGY DRIVEN OPERATING MODEL
1 Number of Clients per loan officer (for Group Loan products) increased from 436 in FY 2012 to 761 as of FY 2016. 2 TAT for Individual Loan products reduced significantly from 17.26 days in FY 2013 to 6.27 days as of FY 2016. 3 TAT for Group Loan products reduced significantly from 7.94 days in FY 2013 to 4.32 days as of FY 2016. 4 Cost to income ratio reduced from 94.2% in FY 2012 to 51% in FY 2016.
Available on android phones (GL) and tablets (IL) to facilitate real-time analysis
Paperless Processing
Applications and documents are processed electronically at branches
Automated Back-end
Supported by a robust core banking system and document management system
+ +
Secure & efficient operations
Enhanced governance
Improved employee engagement
Increased product accessibility
Ability to rapidly scale up
TAT (Individual Loans)2
17.26 to 6.27 days
TAT (Group Loans)3
7.94 to 4.32 days
Cost to Income Ratio4
94.2% to 51%
Employee Productivity Ratio1
436 to 761 borrowers
Digitized Front-end
18
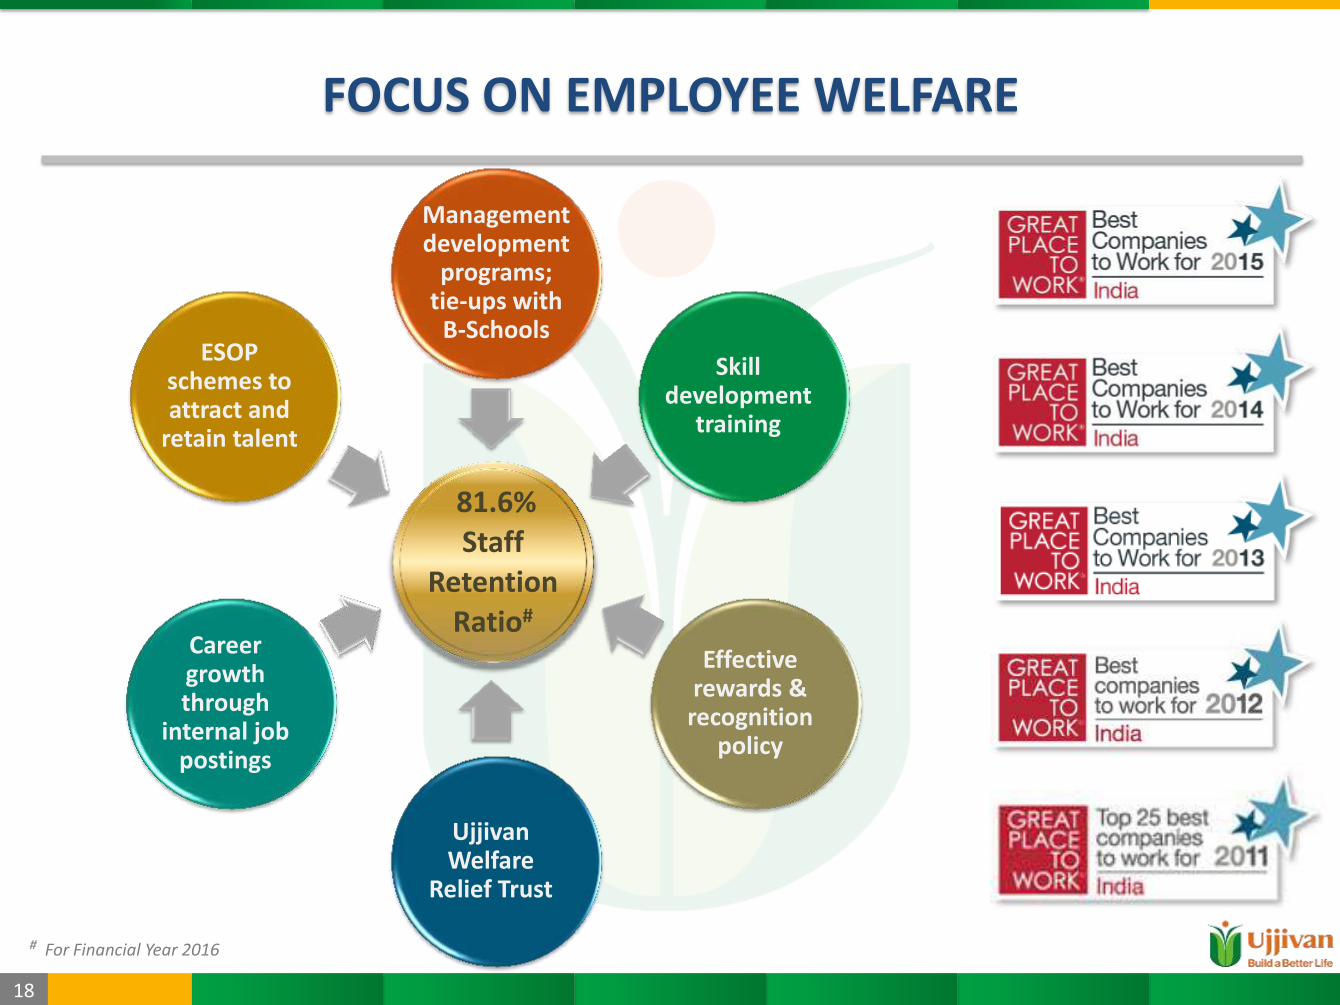
FOCUS ON EMPLOYEE WELFARE
# For Financial Year 2016
81.6% Staff
Retention
Ratio#
Management development
programs; tie-ups with
B-Schools
Skill development
training
Effective rewards & recognition
policy
Ujjivan Welfare
Relief Trust
Career growth through
internal job postings
ESOP schemes to attract and
retain talent

19
EXPERIENCED BOARD & STRONG GOVERNANCE
Bachelors degree in arts from Delhi University and in law from Madras University
Fellow member of the Institute of Company Secretaries of India
Former CMD, Corporation Bank and former chairman & CEO, ING Vysya Bank
MBA from Wharton School of Business
Career banker for 30 years; worked with Citibank, Standard Chartered, HDFC Bank.
Past President of MFIN; Chairman of AKMI; board member of Women’s World Banking Capital Partners L.P
Samit Ghosh Founder, MD & CEO
65 Years
K. R. Ramamoorthy Non-Executive Chairman & Independent Director
75 Years
Anadi Charan Sahu Non-Executive, Nominee Director
56 Years
Abhijit Sen Non-Executive Director
65 Years
Venkatesh Natarajan Non-Executive Director
47 Years
Amit Gupta Non-Executive Director
39 Years
Jayanta Basu Non-Executive Director
50 Years
Sunil Patel Non-Executive, Independent Director
66 Years
Nandlal Sarda Non-Executive, Independent Director
67 Years
Vandana Viswanathan Non-Executive, Independent Director
44 Years
20
STRONG TRACK RECORD OF FINANCIAL PERFORMANCE
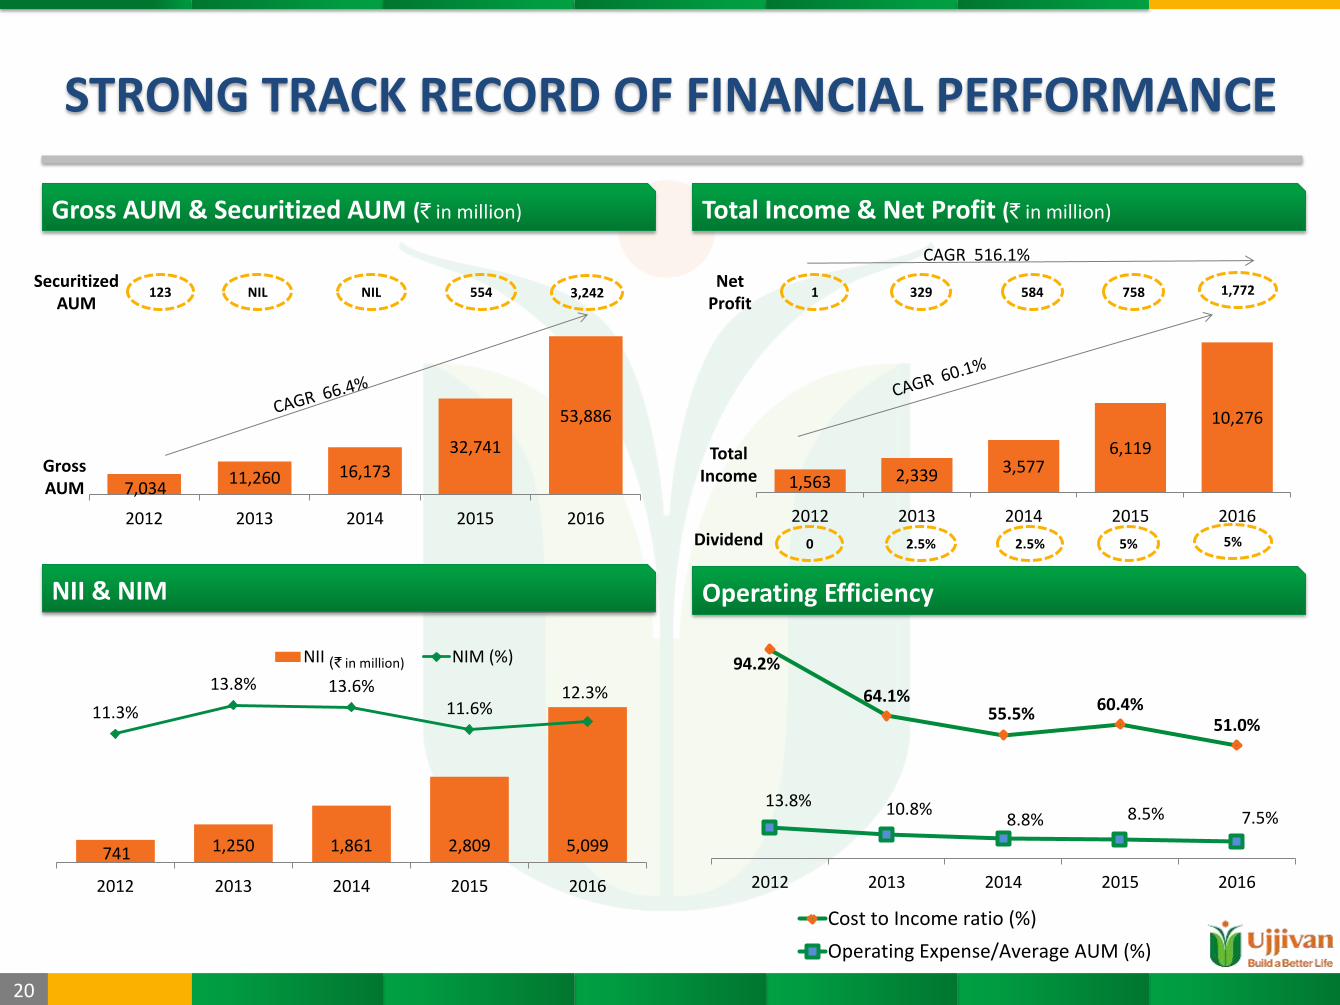
Gross AUM & Securitized AUM (` in million)
NII & NIM
741 1,250 1,861 2,809 5,099
11.3%
13.8% 13.6% 11.6%
12.3%
2012 2013 2014 2015 2016
NII NIM (%)(` in million)
Total Income & Net Profit (` in million)
Operating Efficiency
1,563 2,339 3,577 6,119
10,276
2012 2013 2014 2015 2016
1 329 584 758 1,772 Net
Profit
7,034 11,260 16,173
32,741
53,886
2012 2013 2014 2015 2016
123 NIL NIL 554 3,242 Securitized
AUM
CAGR 516.1%
Gross AUM
Total Income
94.2%
64.1% 55.5%
60.4% 51.0%
13.8% 10.8% 8.8% 8.5% 7.5%
2012 2013 2014 2015 2016
Cost to Income ratio (%)
Operating Expense/Average AUM (%)
0 2.5% 2.5% 5% 5% Dividend
21
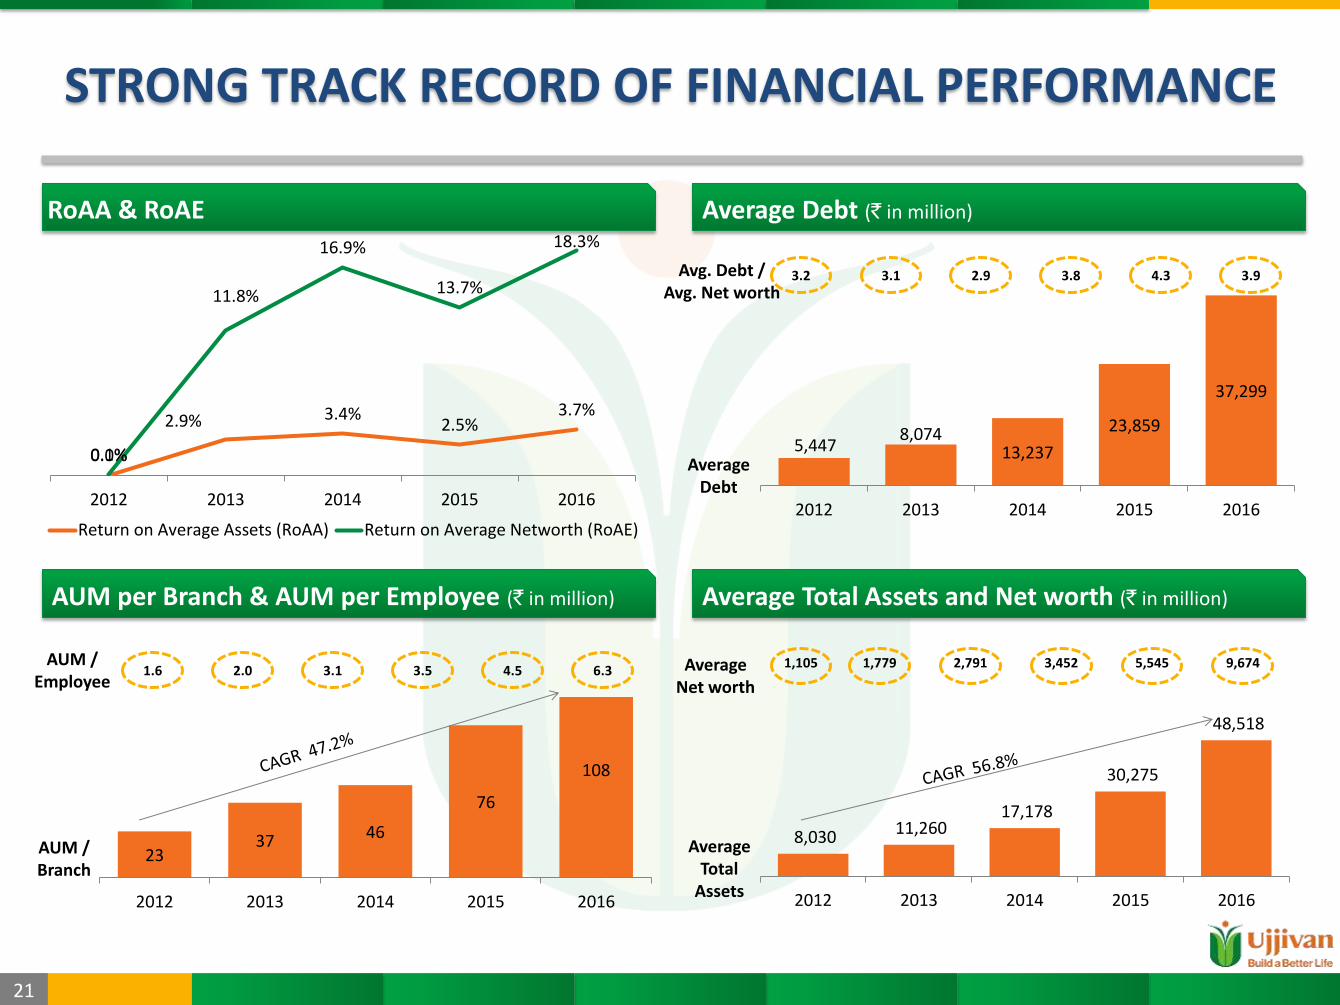
STRONG TRACK RECORD OF FINANCIAL PERFORMANCE
8,030 11,260 17,178
30,275
48,518
2012 2013 2014 2015 2016
1,105 1,779 2,791 3,452 5,545 9,674 Average Net worth
5,447 8,074
13,237
23,859
37,299
2012 2013 2014 2015 2016
3.2 3.1 2.9 3.8 4.3 3.9 Avg. Debt / Avg. Net worth
23 37 46
76
108
2012 2013 2014 2015 2016
1.6 2.0 3.1 3.5 4.5 6.3 AUM /
Employee
AUM / Branch
0.0%
2.9% 3.4% 2.5%
3.7%
0.1%
11.8%
16.9%
13.7%
18.3%
2012 2013 2014 2015 2016
Return on Average Assets (RoAA) Return on Average Networth (RoAE)
Average Total
Assets
Average Debt
AUM per Branch & AUM per Employee (` in million) Average Total Assets and Net worth (` in million)
Average Debt (` in million) RoAA & RoAE
22
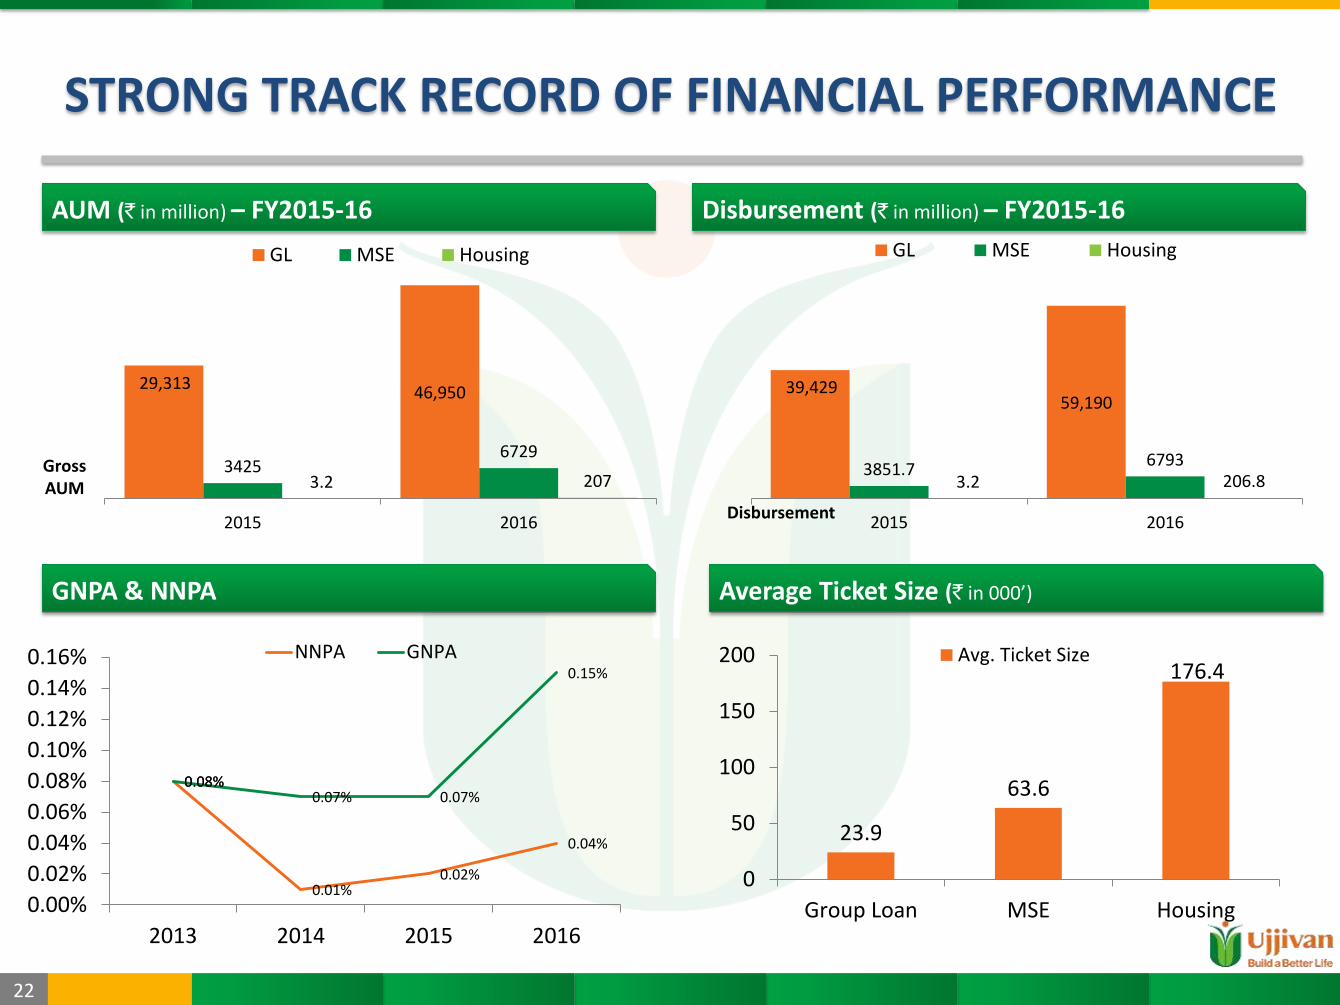
STRONG TRACK RECORD OF FINANCIAL PERFORMANCE
AUM (` in million) – FY2015-16
GNPA & NNPA
Disbursement (` in million) – FY2015-16
Average Ticket Size (` in 000’)
29,313 46,950
3425 6729
3.2 207
2015 2016
GL MSE Housing
Gross AUM
Disbursement
39,429 59,190
3851.7 6793
3.2 206.8
2015 2016
GL MSE Housing
0.08%
0.01% 0.02%
0.04%
0.08% 0.07% 0.07%
0.15%
0.00%
0.02%
0.04%
0.06%
0.08%
0.10%
0.12%
0.14%
0.16%
2013 2014 2015 2016
NNPA GNPA
23.9
63.6
176.4
0
50
100
150
200
Group Loan MSE Housing
Avg. Ticket Size

Proposed SFB & Growth Strategies
24
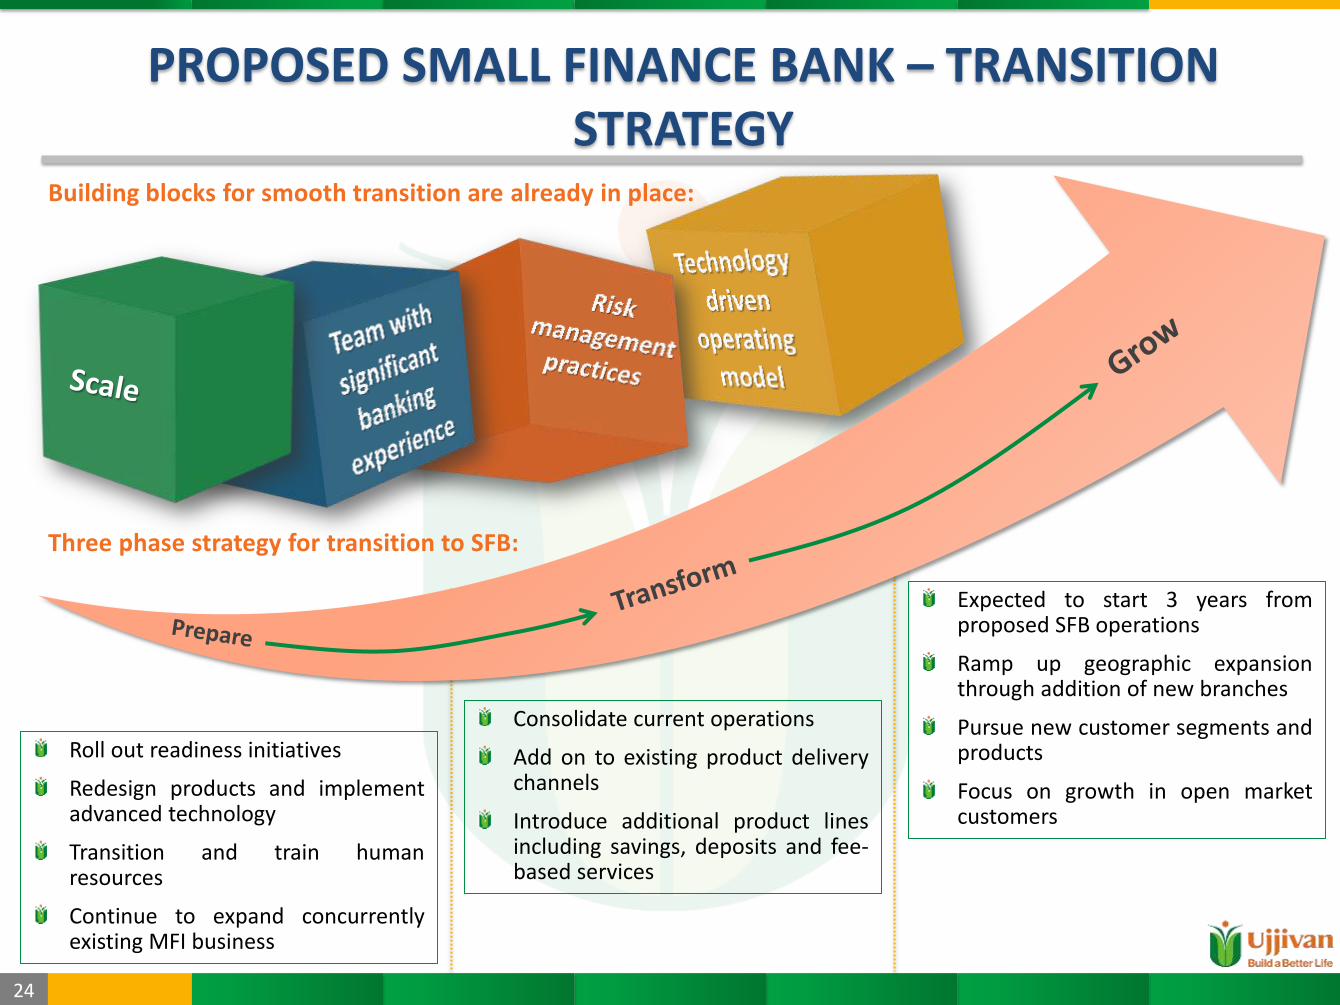
PROPOSED SMALL FINANCE BANK – TRANSITION STRATEGY
Roll out readiness initiatives
Redesign products and implement advanced technology
Transition and train human resources
Continue to expand concurrently existing MFI business
Consolidate current operations
Add on to existing product delivery channels
Introduce additional product lines including savings, deposits and fee-based services
Expected to start 3 years from proposed SFB operations
Ramp up geographic expansion through addition of new branches
Pursue new customer segments and products
Focus on growth in open market customers
Building blocks for smooth transition are already in place:
Three phase strategy for transition to SFB:
25
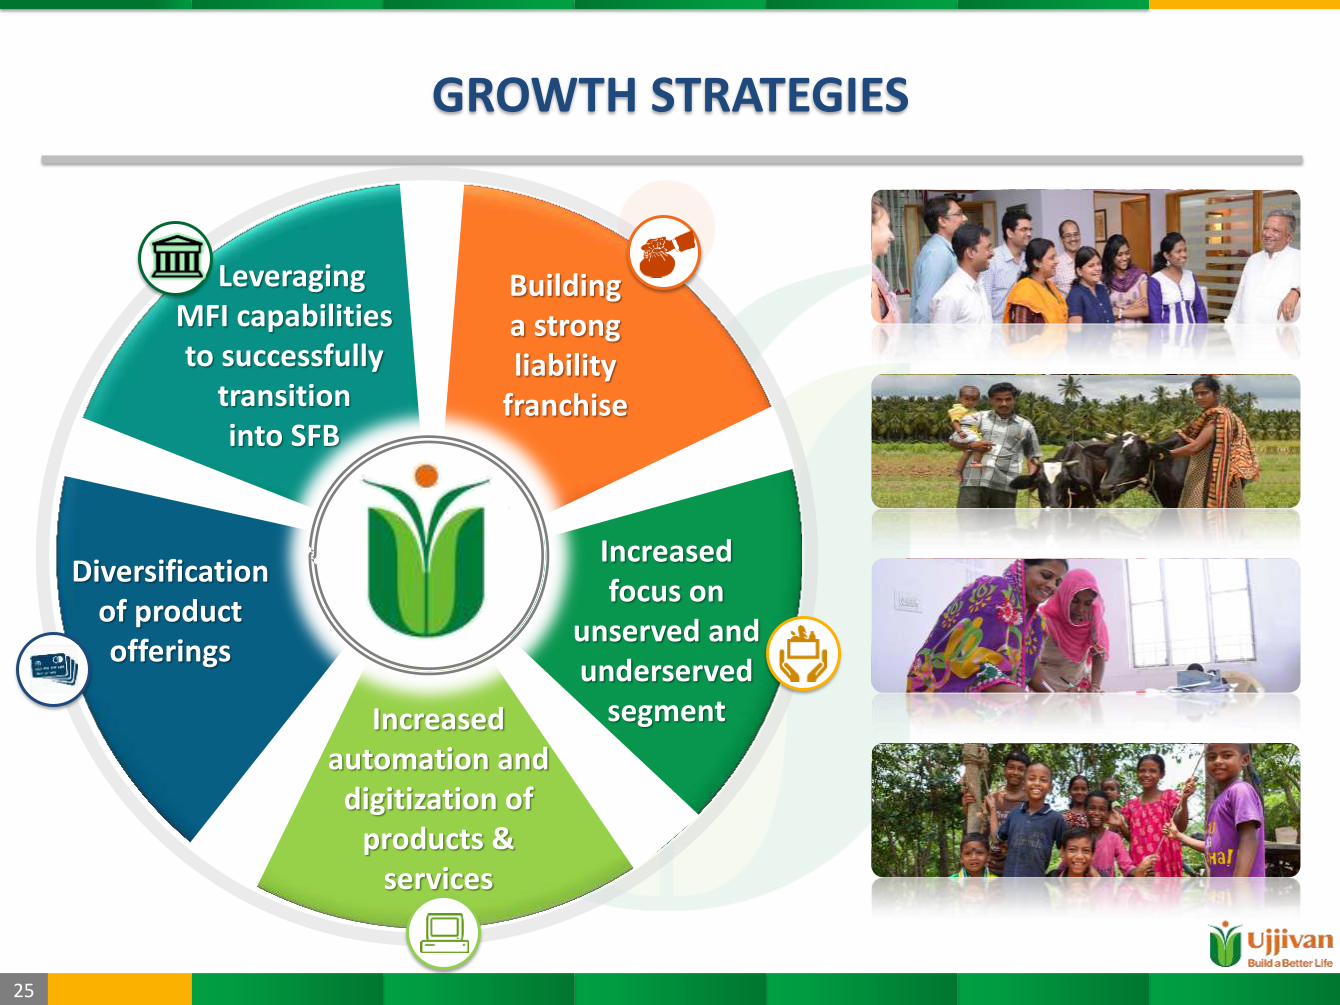
GROWTH STRATEGIES
Leveraging MFI capabilities to successfully
transition into SFB
Increased focus on
unserved and underserved
segment
Diversification of product offerings
Increased automation and
digitization of products &
services
Building a strong liability
franchise

Financial Overview FY15-16

27
FINANCIALS – PROFIT & LOSS STATEMENT
FY12 FY13 FY14 FY15 FY16
Revenue from operations 1,482 2,225 3,479 5,993 10,073
Other income 81 114 98 126 204
Total Income 1,563 2,339 3,577 6,119 10,276
Finance costs 609 821 1,399 2,714 4,235
Employee expenses 603 659 815 1,328 1,967
Other expenses 270 288 360 654 1,022
Depreciation 24 25 31 67 80
Provisions and write offs 58 69 83 210 253
Total Expenses 1,565 1,862 2,688 4,974 7,556
Profit before tax -1 477 888 1,145 2,720
Current tax 16 161 316 468 1036
Deferred tax -19 -13 -12 -81 -88
Total tax expense -3 148 304 387 948
Profit after tax 1 329 584 758 1,772
` in million
Figures from FY12 to FY15 are Restated figures
28
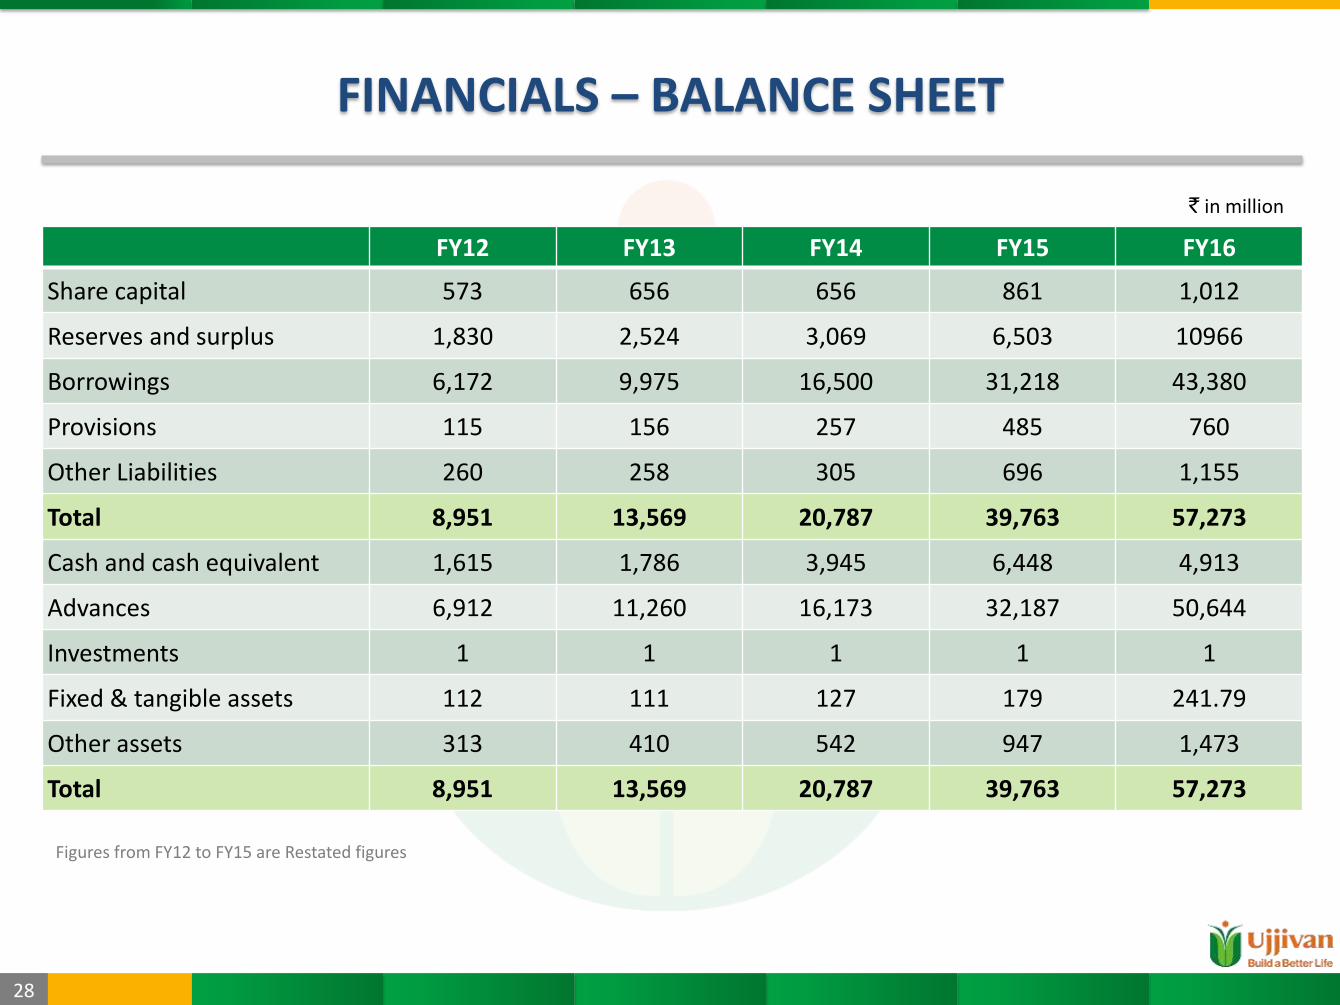
FINANCIALS – BALANCE SHEET
FY12 FY13 FY14 FY15 FY16
Share capital 573 656 656 861 1,012
Reserves and surplus 1,830 2,524 3,069 6,503 10966
Borrowings 6,172 9,975 16,500 31,218 43,380
Provisions 115 156 257 485 760
Other Liabilities 260 258 305 696 1,155
Total 8,951 13,569 20,787 39,763 57,273
Cash and cash equivalent 1,615 1,786 3,945 6,448 4,913
Advances 6,912 11,260 16,173 32,187 50,644
Investments 1 1 1 1 1
Fixed & tangible assets 112 111 127 179 241.79
Other assets 313 410 542 947 1,473
Total 8,951 13,569 20,787 39,763 57,273
` in million
Figures from FY12 to FY15 are Restated figures

29
FINANCIALS – KEY METRICS
FY12 FY13 FY14 FY15 FY16
Per share metrics
EPS (`) 0 5.3 8.9 11.2 20.2
BV (`) 40 45 53 82 119
Yields & Margins (%)
Yields 20.3 22.7 23.7 22.8 22.5
Cost of funds 11 10.1 10.5 11.3 11.3
Spread 9.4 12.6 13.2 11.5 11.2
Net interest margin 11.3 13.8 13.6 11.6 12.3
Asset quality (%)
Gross NPAs 0.9 0.1 0.1 0.1 0.15
Net NPAs 0.8 0.1 0 0 0.04
Credit cost (bps) 82 61 51 64 47
Capital (%)
Tier-I 32.4 27 21.8 21.7 22.4
CAR 32.4 27.3 22.7 24.2 24.1
Efficiency (%) ROA 0 2.9 3.4 2.5 3.7
ROE 0.1 11.8 16.9 13.7 18.3
Growth (%)
Opex/Avg AUM 13.8 10.8 8.8 8.5 7.5
AUM per branch (` in mn) 23 37 46 76 108
AUM / Advances (on book) 10.6 62.9 43.6 99 57
Disbursement -5.1 42.3 36.6 105.6 52.9
Average Total Asset 43.4 40.2 52.6 76.2 60
Book value 30.4 14.1 17.7 53 45
Others (Nos.) Branches 299 301 350 423 469
Employees 3,449 3,656 4,667 7,089 8,049 Net Interest Margin represents the ratio of the Net Interest Income to the Average AUM in the relevant period
30
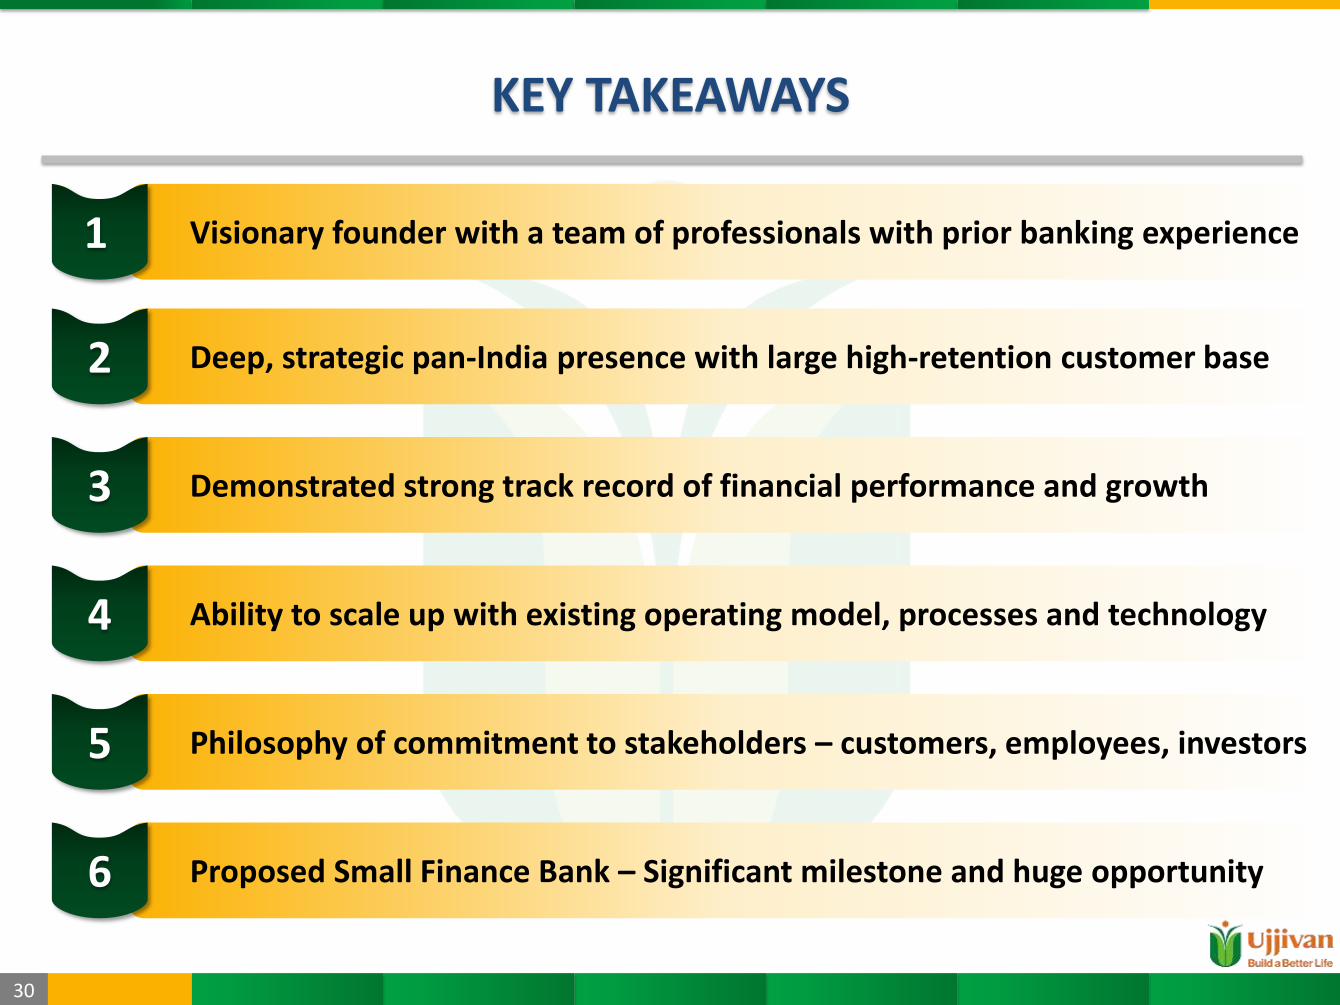
KEY TAKEAWAYS
Visionary founder with a team of professionals with prior banking experience
Deep, strategic pan-India presence with large high-retention customer base
Demonstrated strong track record of financial performance and growth
Ability to scale up with existing operating model, processes and technology
Philosophy of commitment to stakeholders – customers, employees, investors
Proposed Small Finance Bank – Significant milestone and huge opportunity
1
2
3
4
5
6

Annexure(s)
32
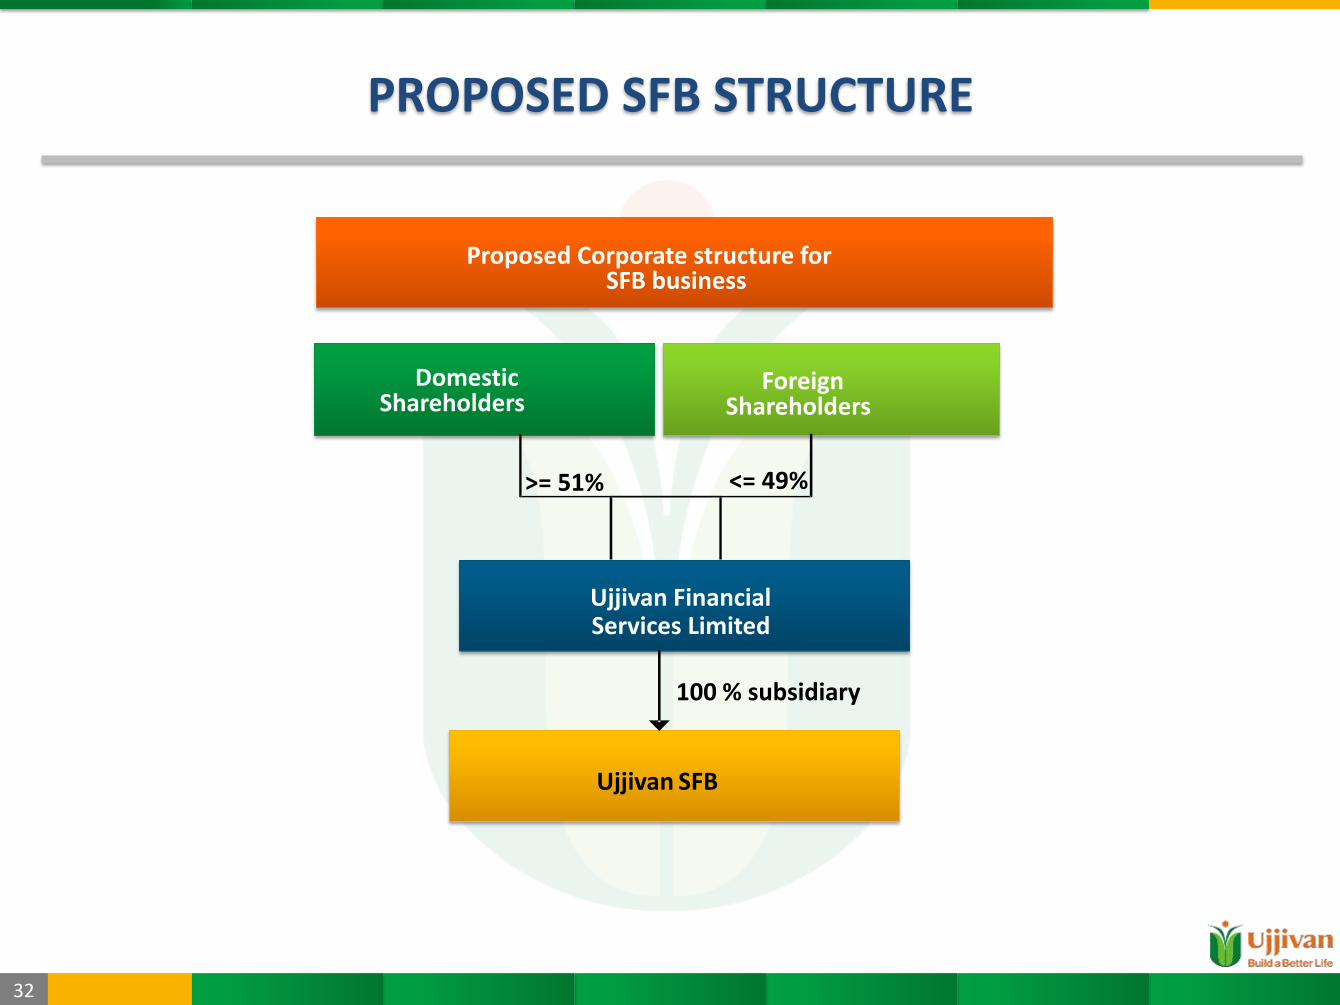
PROPOSED SFB STRUCTURE
Proposed Corporate structure for SFB business
Ujjivan Financial Services Limited
Foreign Shareholders
Domestic Shareholders
100 % subsidiary
<= 49%
Ujjivan SFB
>= 51%
33
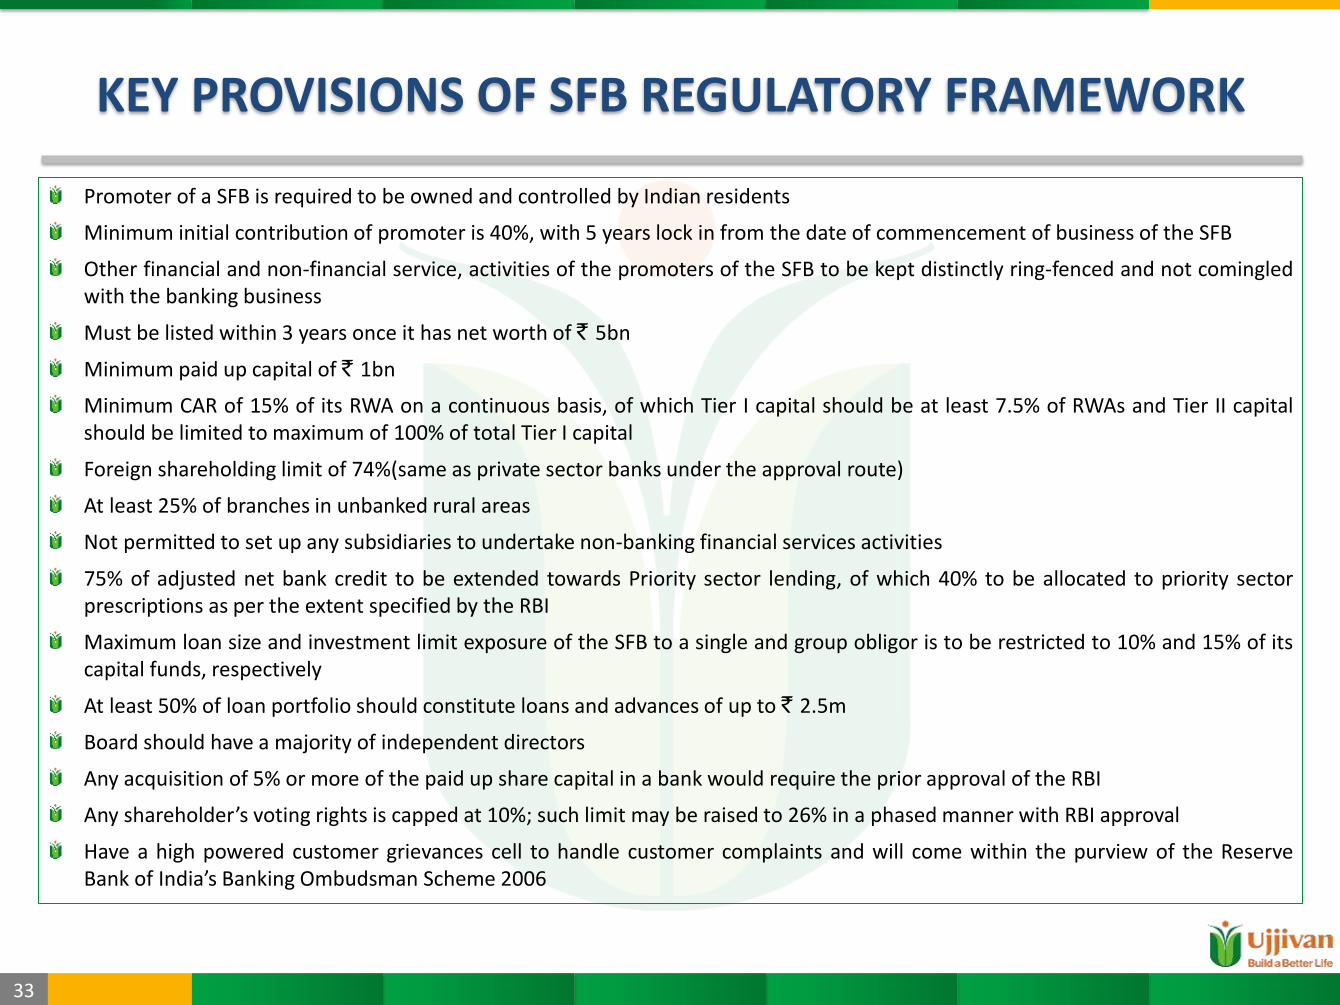
KEY PROVISIONS OF SFB REGULATORY FRAMEWORK
Promoter of a SFB is required to be owned and controlled by Indian residents
Minimum initial contribution of promoter is 40%, with 5 years lock in from the date of commencement of business of the SFB
Other financial and non-financial service, activities of the promoters of the SFB to be kept distinctly ring-fenced and not comingled with the banking business
Must be listed within 3 years once it has net worth of ` 5bn
Minimum paid up capital of ` 1bn
Minimum CAR of 15% of its RWA on a continuous basis, of which Tier I capital should be at least 7.5% of RWAs and Tier II capital should be limited to maximum of 100% of total Tier I capital
Foreign shareholding limit of 74%(same as private sector banks under the approval route)
At least 25% of branches in unbanked rural areas
Not permitted to set up any subsidiaries to undertake non-banking financial services activities
75% of adjusted net bank credit to be extended towards Priority sector lending, of which 40% to be allocated to priority sector prescriptions as per the extent specified by the RBI
Maximum loan size and investment limit exposure of the SFB to a single and group obligor is to be restricted to 10% and 15% of its capital funds, respectively
At least 50% of loan portfolio should constitute loans and advances of up to ` 2.5m
Board should have a majority of independent directors
Any acquisition of 5% or more of the paid up share capital in a bank would require the prior approval of the RBI
Any shareholder’s voting rights is capped at 10%; such limit may be raised to 26% in a phased manner with RBI approval
Have a high powered customer grievances cell to handle customer complaints and will come within the purview of the Reserve Bank of India’s Banking Ombudsman Scheme 2006

Thank you!