Embed Size (px)
Citation preview

UHPLC-ESI-QTOF-MS/MS based Lipidomics by Data-Independent Acquisition
Michael Lämmerhofer, Jörg Schlotterbeck
Institute of Pharmaceutical Sciences, Pharmaceutical (Bio-)Analysis, University of Tübingen, Germany
Analytica 2016, May 11, 2016, Munich (Germany)
11.5.2016, 13:15, 15 + 5 min
Sciex Innovation Day
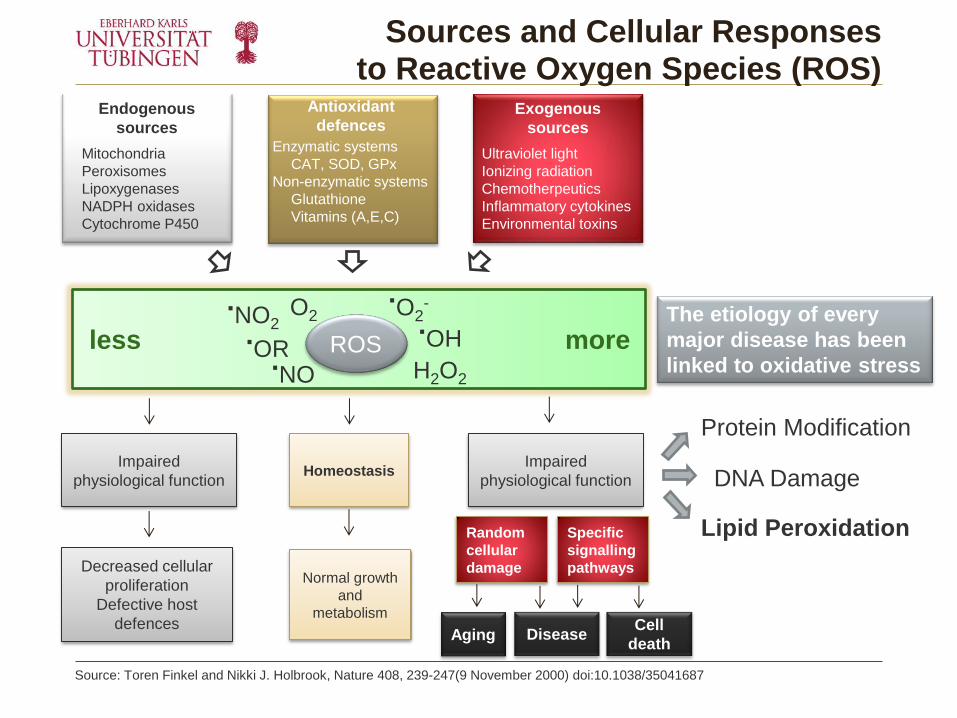
Sources and Cellular Responses to Reactive Oxygen Species (ROS)
Source: Toren Finkel and Nikki J. Holbrook, Nature 408, 239-247(9 November 2000) doi:10.1038/35041687
Endogenous
sources
Mitochondria
Peroxisomes
Lipoxygenases
NADPH oxidases
Cytochrome P450
Exogenous
sources
Ultraviolet light
Ionizing radiation
Chemotherpeutics
Inflammatory cytokines
Environmental toxins
Antioxidant
defences
Enzymatic systems
CAT, SOD, GPx
Non-enzymatic systems
Glutathione
Vitamins (A,E,C)
ROS
.O2
- O2
.OH .
OR .NO
.NO2
H2O2
less more
Impaired
physiological function Homeostasis
Normal growth
and
metabolism
Decreased cellular
proliferation
Defective host
defences
Random
cellular
damage
Specific
signalling
pathways
Aging Disease Cell
death
Impaired
physiological function DNA Damage
Protein Modification
Lipid Peroxidation
The etiology of every
major disease has been
linked to oxidative stress
Cyclization,
Oxidation,
rearrangement
OH
HO
Isoprostanes
O
O
Isolevuglandins
O
O
Isothromboxanes
Isofurans
O
HO
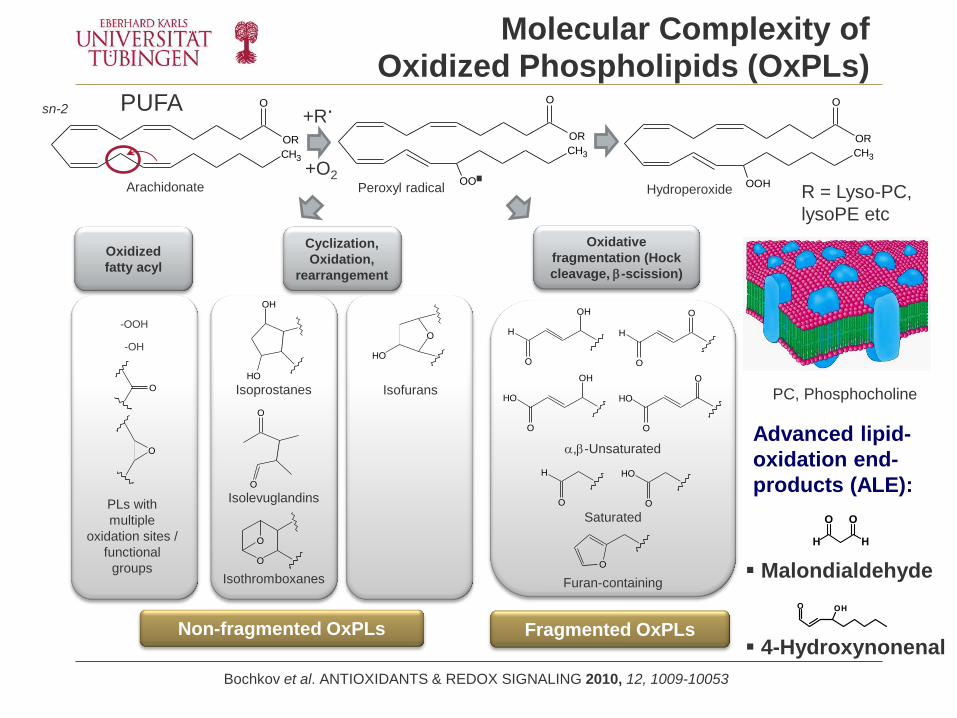
Bochkov et al. ANTIOXIDANTS & REDOX SIGNALING 2010, 12, 1009-10053
Molecular Complexity of Oxidized Phospholipids (OxPLs)
Arachidonate
O
OR
CH3
Hydroperoxide
O
OR
CH3
OOHR = Lyso-PC,
lysoPE etc
PC, Phosphocholine
Oxidized
fatty acyl
Non-fragmented OxPLs
PLs with
multiple
oxidation sites /
functional
groups
-OOH
-OH
O
O
Oxidative
fragmentation (Hock
cleavage, -scission)
Fragmented OxPLs
H
O
OH
H
O
O
HO
O
O
HO
O
OH
,-Unsaturated
Saturated
Furan-containing
HO
O
H
O
O
PUFA sn-2
Peroxyl radical
O
OR
CH3
OO. +O2
Malondialdehyde
4-Hydroxynonenal
Advanced lipid-
oxidation end-
products (ALE):
+R.
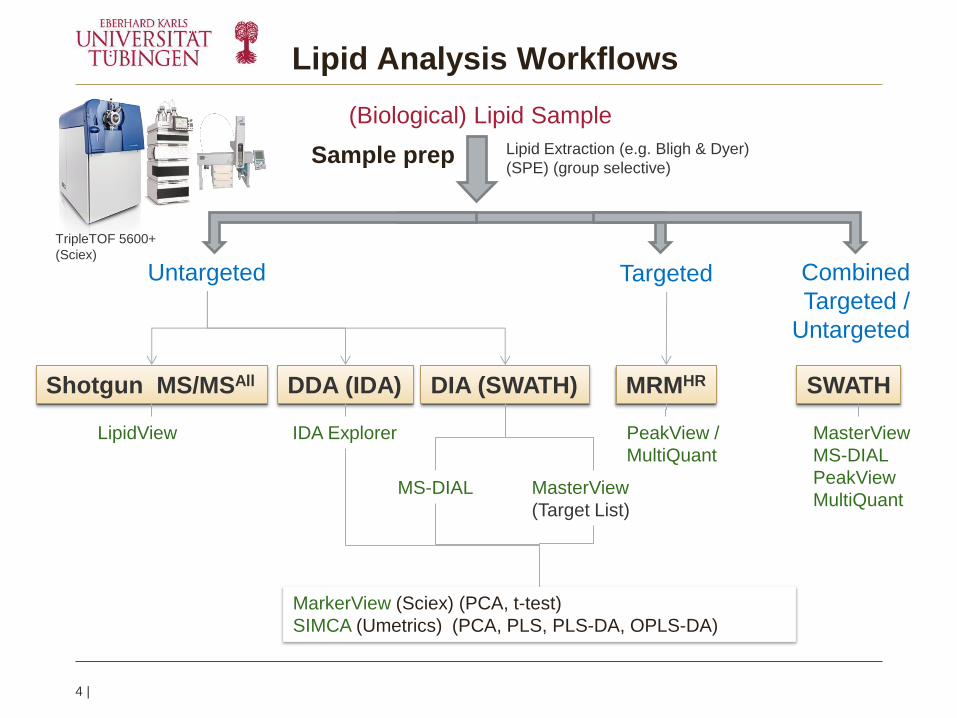
Lipid Analysis Workflows
4 |
(Biological) Lipid Sample
Lipid Extraction (e.g. Bligh & Dyer)
(SPE) (group selective) Sample prep
Untargeted Targeted
Shotgun MS/MSAll DDA (IDA) DIA (SWATH)
MS-DIAL MasterView
(Target List)
MRMHR
Combined
Targeted /
Untargeted
SWATH
PeakView /
MultiQuant
MasterView
MS-DIAL
PeakView
MultiQuant
LipidView
MarkerView (Sciex) (PCA, t-test)
SIMCA (Umetrics) (PCA, PLS, PLS-DA, OPLS-DA)
IDA Explorer
TripleTOF 5600+
(Sciex)
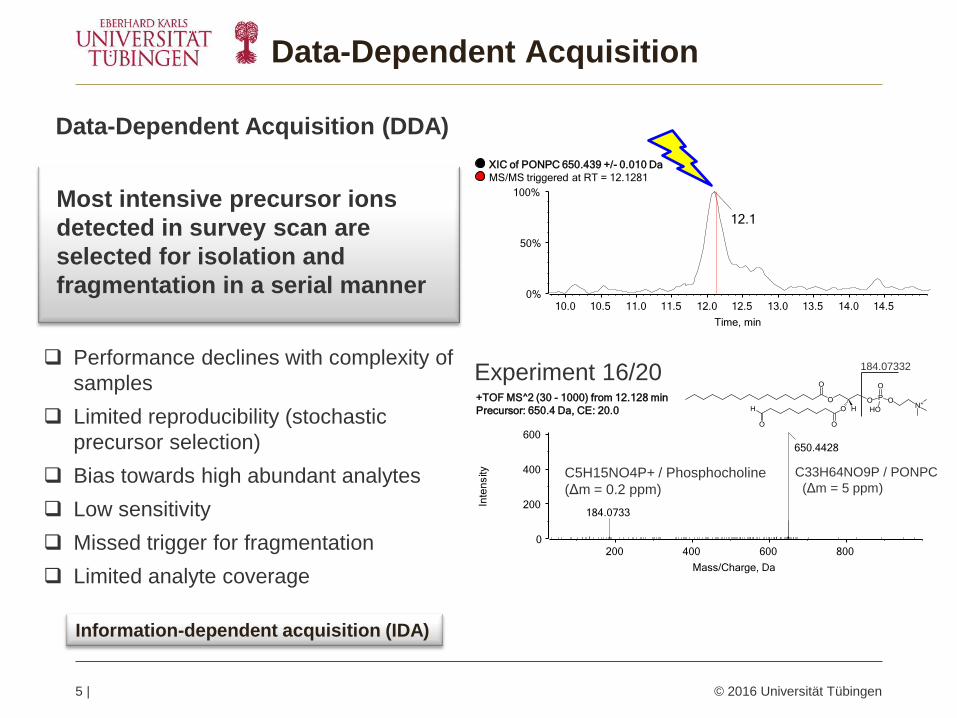
Data-Dependent Acquisition
5 | © 2016 Universität Tübingen
Data-Dependent Acquisition (DDA)
Most intensive precursor ions
detected in survey scan are
selected for isolation and
fragmentation in a serial manner
Performance declines with complexity of
samples
Limited reproducibility (stochastic
precursor selection)
Bias towards high abundant analytes
Low sensitivity
Missed trigger for fragmentation
Limited analyte coverage
Information-dependent acquisition (IDA)
10.0 10.5 11.0 11.5 12.0 12.5 13.0 13.5 14.0 14.5
Time, min
0%
50%
100%
12.1
XIC of PONPC 650.439 +/- 0.010 Da
MS/MS triggered at RT = 12.1281
200 400 600 800
Mass/Charge, Da
0
200
400
600
I n t e
n s i t y
650.4428
184.0733
+TOF MS^2 (30 - 1000) from 12.128 min
Precursor: 650.4 Da, CE: 20.0
Experiment 16/20
C33H64NO9P / PONPC
(Δm = 5 ppm) C5H15NO4P+ / Phosphocholine
(Δm = 0.2 ppm)
184.07332
Autosampler
PAL-HTX xt DLW (10µL Injection)
LC
Agilent 1290 Infinity Binary System
Column
Phenomenex Kinetex 2.6 u C8 100 A 150x2.1 mm
Mobile Phase
A: H2O 10 mM NH4Ac
B: 55 % ACN, 40 % IPA, 5 % H2O, 10 mM NH4Ac
Gradient
10 % B – 50 % B in 3 min
50 % B – 100 %B in 17 min
MS
AB Sciex TripleTOF 5600+
MS Parameter
Source:
ESI+, 500°C, 5000 V, Cur 30, GS1 50, GS2 40
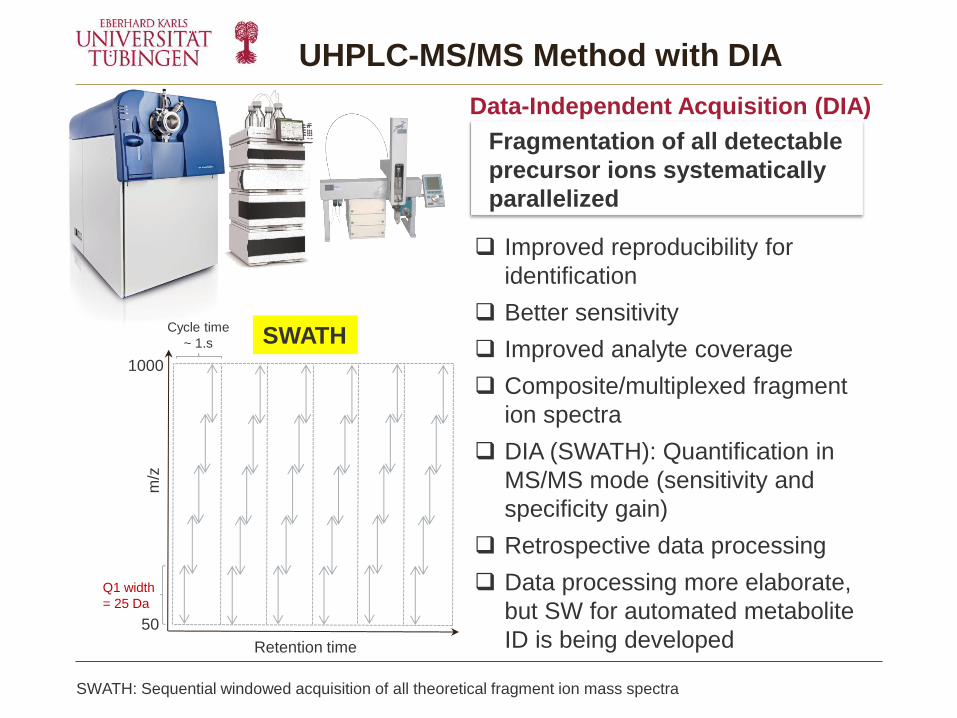
Q1 width
= 25 Da
Cycle time
~ 1.s
Retention time
m/z
SWATH 1000
50
Data-Independent Acquisition (DIA)
Improved reproducibility for
identification
Better sensitivity
Improved analyte coverage
Composite/multiplexed fragment
ion spectra
DIA (SWATH): Quantification in
MS/MS mode (sensitivity and
specificity gain)
Retrospective data processing
Data processing more elaborate,
but SW for automated metabolite
ID is being developed
SWATH: Sequential windowed acquisition of all theoretical fragment ion mass spectra
UHPLC-MS/MS Method with DIA
Fragmentation of all detectable
precursor ions systematically
parallelized
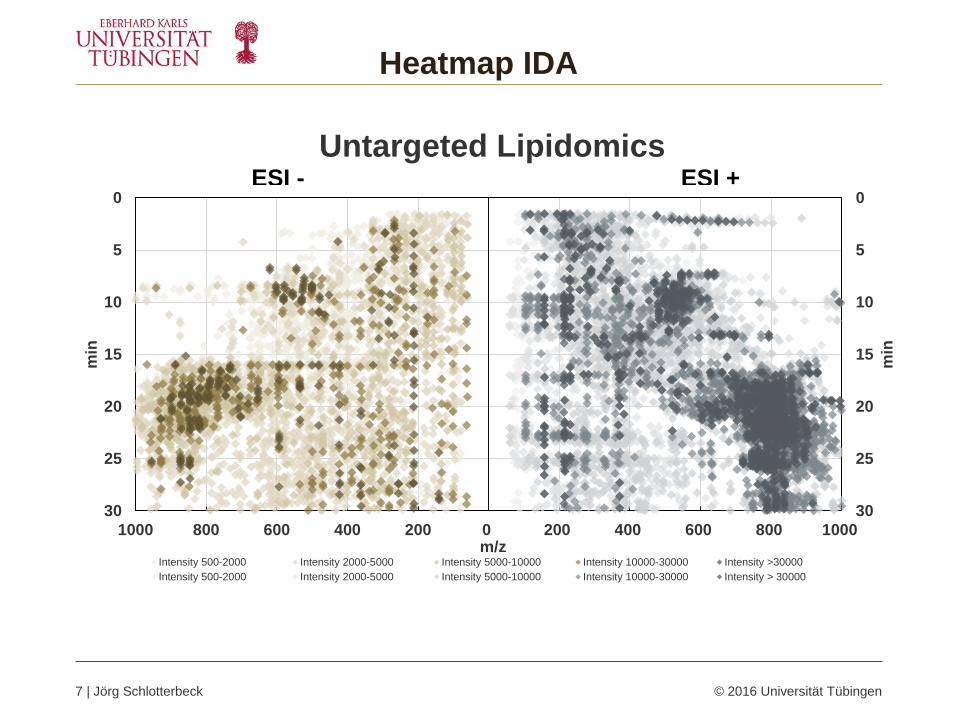
Heatmap IDA
7 | Jörg Schlotterbeck © 2016 Universität Tübingen
0
5
10
15
20
25
30
0
5
10
15
20
25
30
1000 800 600 400 200 0 200 400 600 800 1000
min
min
m/z
Untargeted Lipidomics
Intensity 500-2000 Intensity 2000-5000 Intensity 5000-10000 Intensity 10000-30000 Intensity >30000
Intensity 500-2000 Intensity 2000-5000 Intensity 5000-10000 Intensity 10000-30000 Intensity > 30000
ESI + ESI -
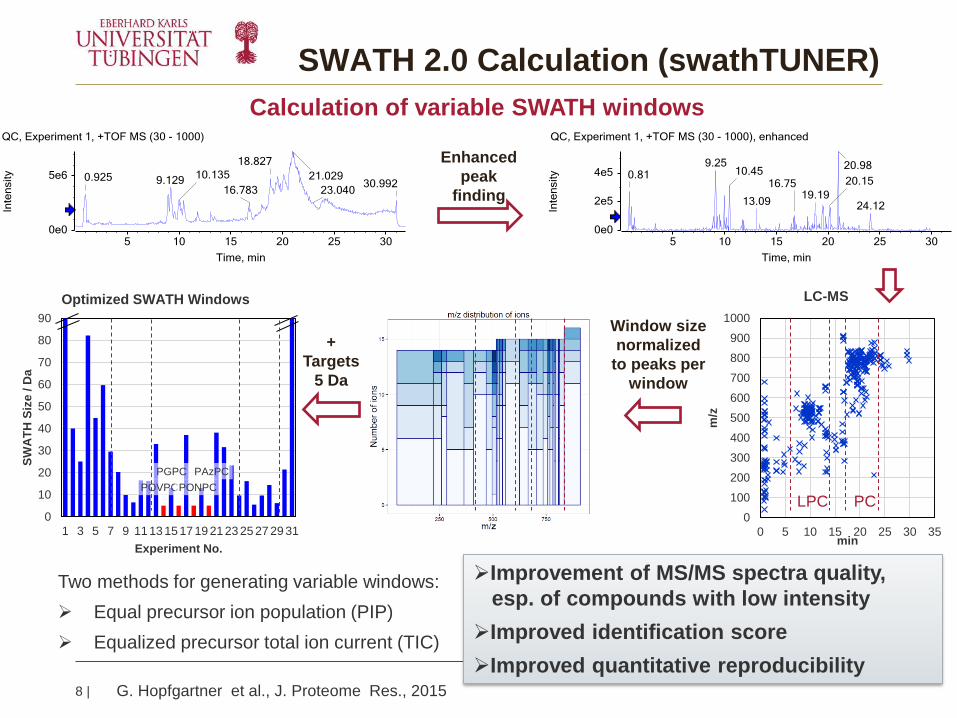
SWATH 2.0 Calculation (swathTUNER)
8 |
Enhanced
peak
finding
Window size
normalized
to peaks per
window
0
100
200
300
400
500
600
700
800
900
1000
0 5 10 15 20 25 30 35
m/z
min
LC-MS
POVPC
PGPC
PONPC
PAzPC
0
10
20
30
40
50
60
70
80
90
1 3 5 7 9 11 13 15 17 19 21 23 25 27 29 31
SW
AT
H S
ize
/ D
a
Experiment No.
Optimized SWATH Windows
+
Targets
5 Da
LPC PC
Two methods for generating variable windows:
Equal precursor ion population (PIP)
Equalized precursor total ion current (TIC)
Calculation of variable SWATH windows
Improvement of MS/MS spectra quality,
esp. of compounds with low intensity
Improved identification score
Improved quantitative reproducibility G. Hopfgartner et al., J. Proteome Res., 2015
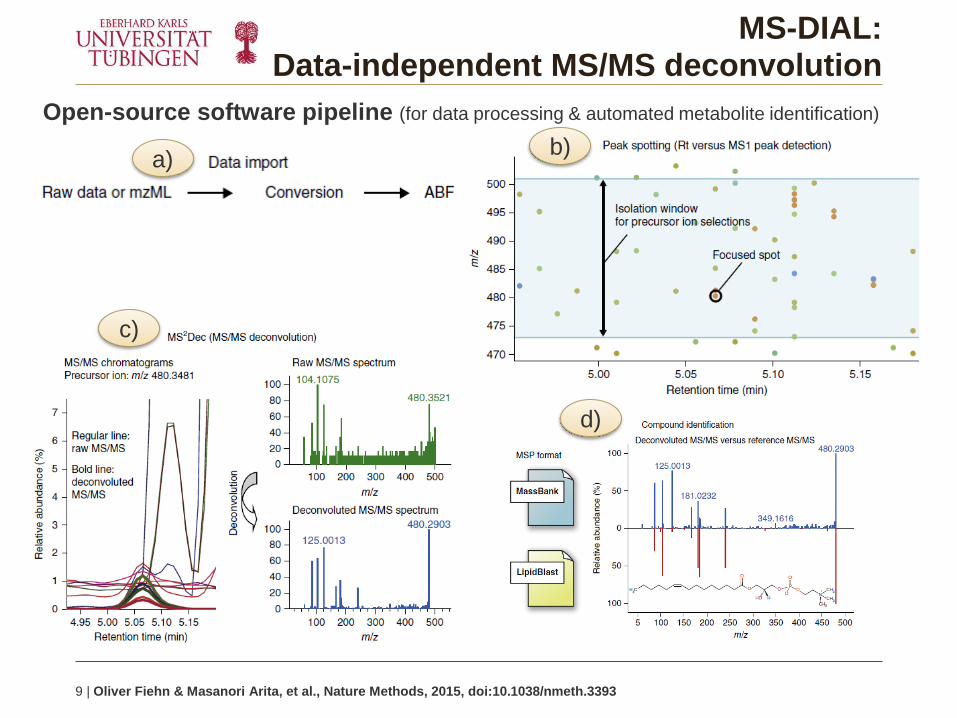
MS-DIAL: Data-independent MS/MS deconvolution
9 | Oliver Fiehn & Masanori Arita, et al., Nature Methods, 2015, doi:10.1038/nmeth.3393
Open-source software pipeline (for data processing & automated metabolite identification)
a) b)
c)
d)
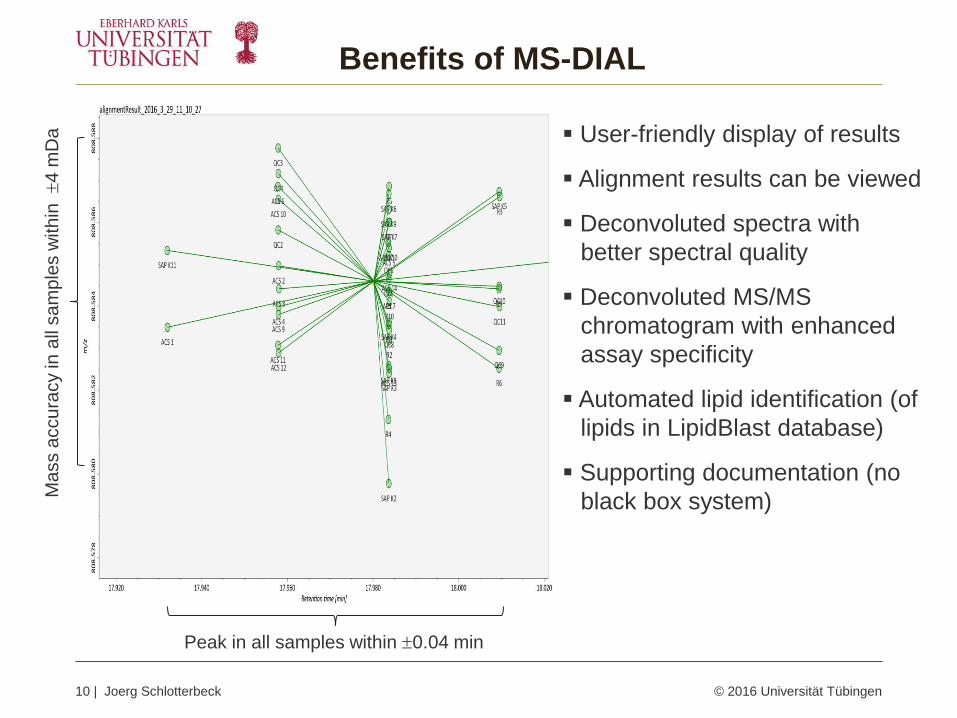
Benefits of MS-DIAL
10 | Joerg Schlotterbeck © 2016 Universität Tübingen
Peak in all samples within 0.04 min
Ma
ss a
ccu
racy in
all
sa
mp
les w
ith
in 4
mD
a
User-friendly display of results
Alignment results can be viewed
Deconvoluted spectra with
better spectral quality
Deconvoluted MS/MS
chromatogram with enhanced
assay specificity
Automated lipid identification (of
lipids in LipidBlast database)
Supporting documentation (no
black box system)
Platelet Lipidomics
11 | Jörg Schlotterbeck
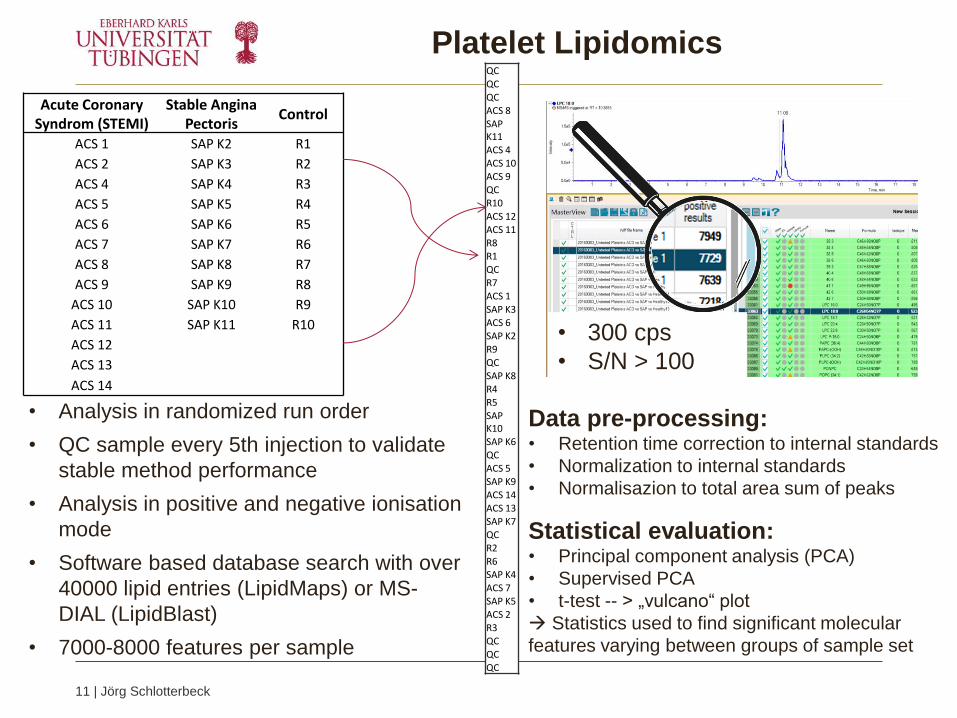
Acute Coronary Syndrom (STEMI)
Stable Angina Pectoris
Control
ACS 1 SAP K2 R1
ACS 2 SAP K3 R2
ACS 4 SAP K4 R3
ACS 5 SAP K5 R4
ACS 6 SAP K6 R5
ACS 7 SAP K7 R6
ACS 8 SAP K8 R7
ACS 9 SAP K9 R8
ACS 10 SAP K10 R9
ACS 11 SAP K11 R10
ACS 12
ACS 13
ACS 14
QC QC QC ACS 8 SAP K11 ACS 4 ACS 10 ACS 9 QC R10 ACS 12 ACS 11 R8 R1 QC R7 ACS 1 SAP K3 ACS 6 SAP K2 R9 QC SAP K8 R4 R5 SAP K10 SAP K6 QC ACS 5 SAP K9 ACS 14 ACS 13 SAP K7 QC R2 R6 SAP K4 ACS 7 SAP K5 ACS 2 R3 QC QC QC
• 300 cps
• S/N > 100
• Analysis in randomized run order
• QC sample every 5th injection to validate
stable method performance
• Analysis in positive and negative ionisation
mode
• Software based database search with over
40000 lipid entries (LipidMaps) or MS-
DIAL (LipidBlast)
• 7000-8000 features per sample
Data pre-processing: • Retention time correction to internal standards
• Normalization to internal standards
• Normalisazion to total area sum of peaks
Statistical evaluation: • Principal component analysis (PCA)
• Supervised PCA
• t-test -- > „vulcano“ plot
Statistics used to find significant molecular
features varying between groups of sample set
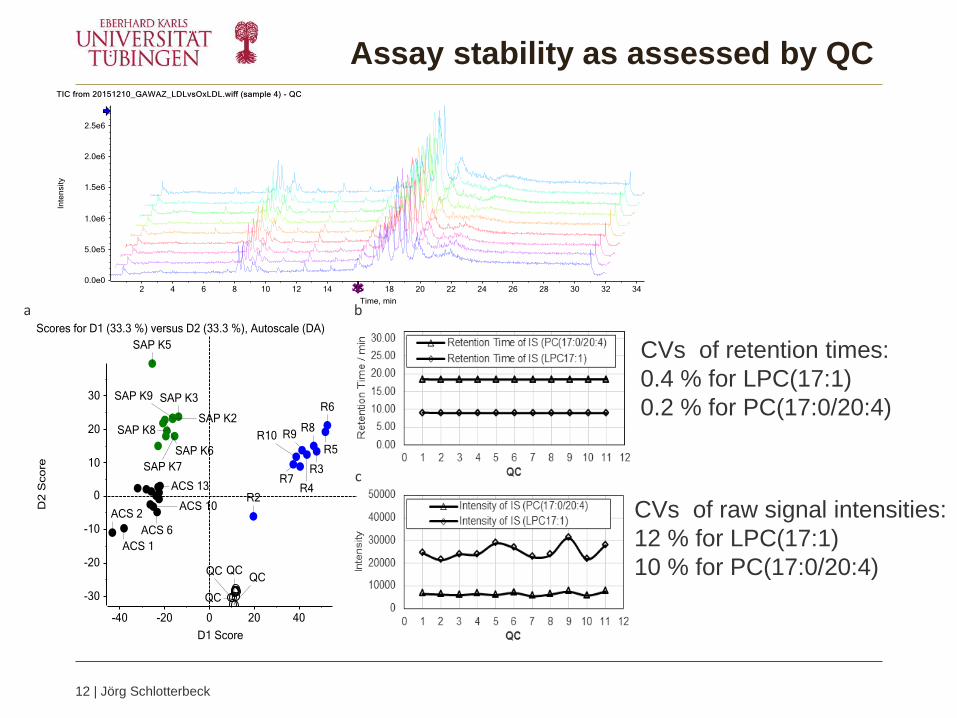
Assay stability as assessed by QC
12 | Jörg Schlotterbeck
a b
c
CVs of retention times:
0.4 % for LPC(17:1)
0.2 % for PC(17:0/20:4)
CVs of raw signal intensities:
12 % for LPC(17:1)
10 % for PC(17:0/20:4)
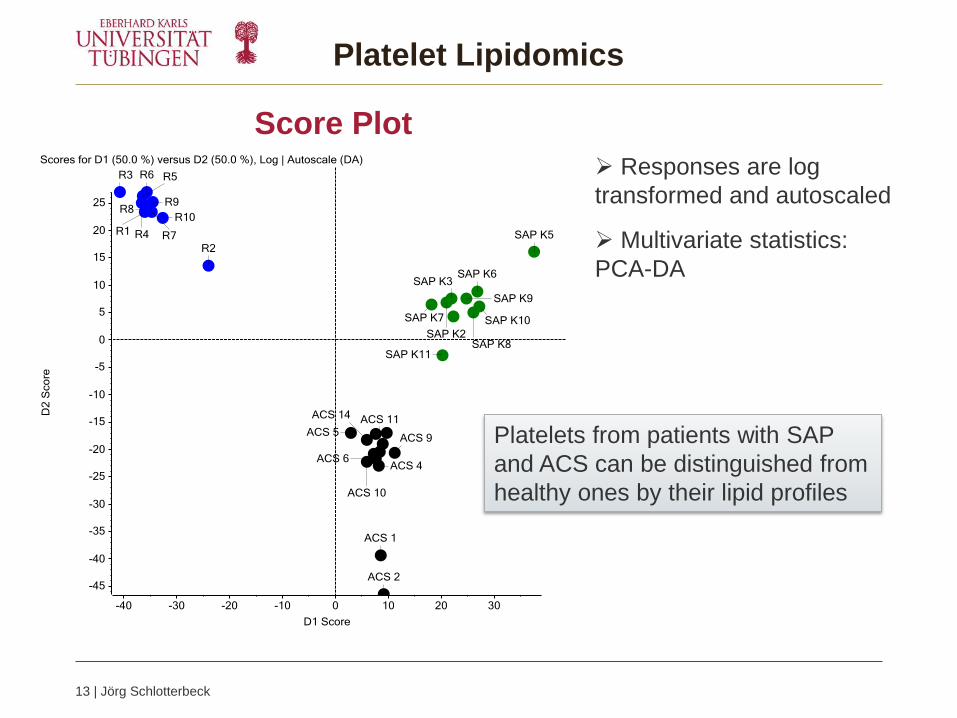
Platelet Lipidomics
13 | Jörg Schlotterbeck
Responses are log
transformed and autoscaled
Multivariate statistics:
PCA-DA
Platelets from patients with SAP
and ACS can be distinguished from
healthy ones by their lipid profiles
Score Plot
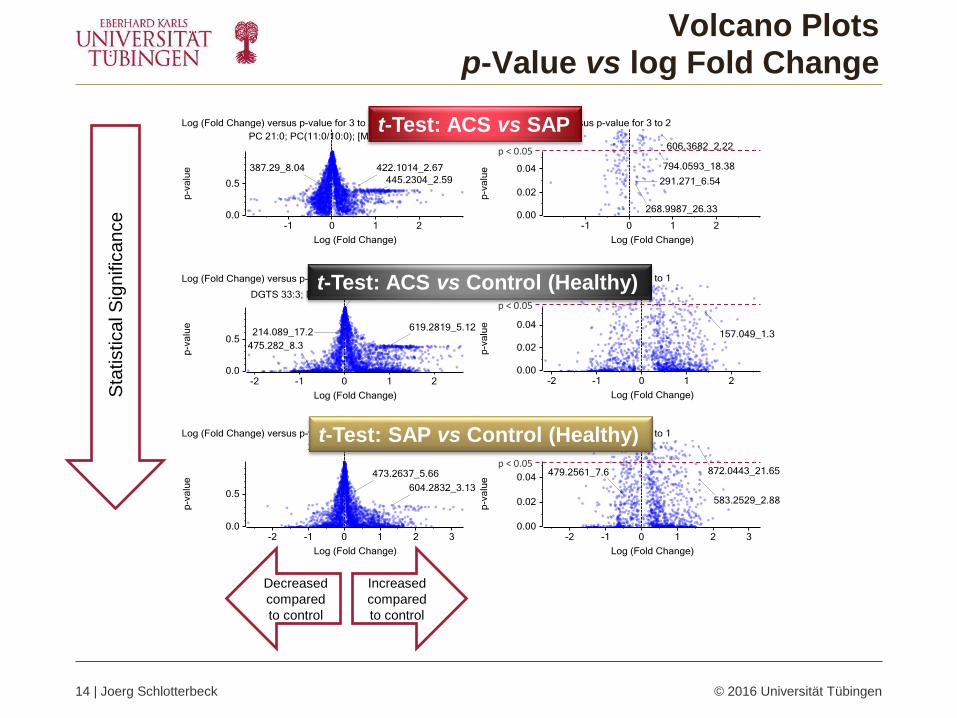
Volcano Plots p-Value vs log Fold Change
14 | Joerg Schlotterbeck © 2016 Universität Tübingen
p < 0.05
p < 0.05
p < 0.05
t-Test: ACS vs SAP
t-Test: ACS vs Control (Healthy)
t-Test: SAP vs Control (Healthy)
Sta
tistica
l S
ign
ific
an
ce
Decreased
compared
to control
Increased
compared
to control
Identification of Significant Features
15 | Jörg Schlotterbeck
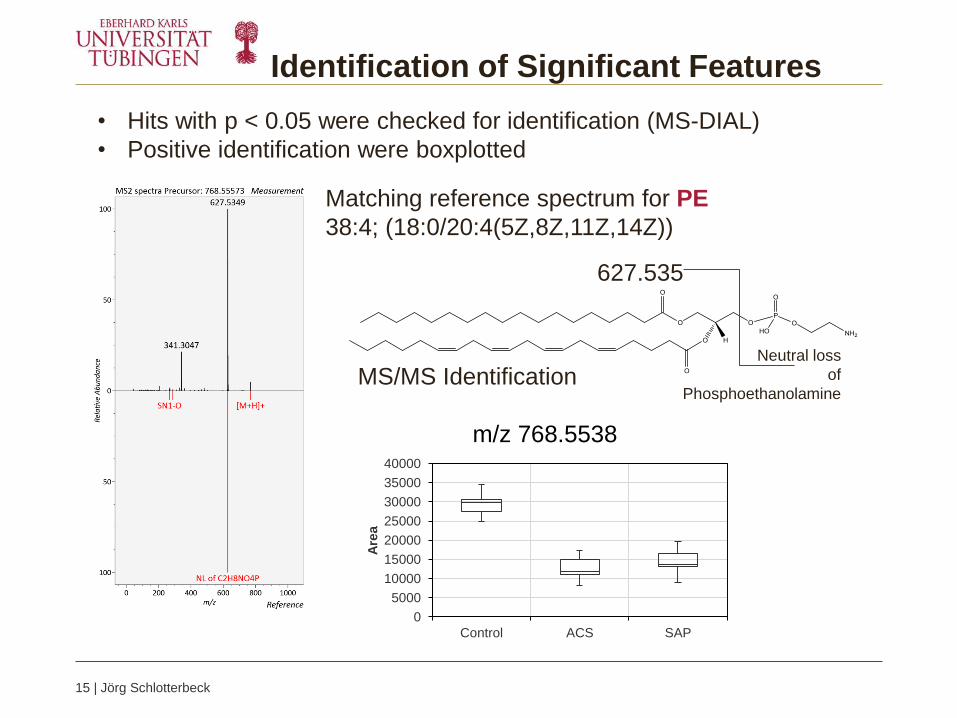
• Hits with p < 0.05 were checked for identification (MS-DIAL)
• Positive identification were boxplotted
Matching reference spectrum for PE
38:4; (18:0/20:4(5Z,8Z,11Z,14Z))
Neutral loss
of
Phosphoethanolamine
627.535
MS/MS Identification
0
5000
10000
15000
20000
25000
30000
35000
40000
Control ACS SAP
Are
a
m/z 768.5538
Heatmap of Lipids Identified with MS-DIAL
16 | Jörg Schlotterbeck © 2016 Universität Tübingen
R1 R10 R2 R3 R4 R5 R6 R7 R8 R9
SAP
K10
SAP
K11
SAP
K2SA
P K3
SAP
K4SA
P K5
SAP
K6SA
P K7
SAP
K8SA
P K9
ACS
1AC
S 10
ACS
11AC
S 12
ACS
13AC
S 14
ACS
2AC
S 4
ACS
5AC
S 6
ACS
7AC
S 8
ACS
9lysoPE 16:0; PE(O-16:0/0:0); [M+H]+
PC 38:3; PC(18:3(6Z,9Z,12Z)/20:0); [M+H]+
SQDG 35:5; SQDG(16:2/19:3); [M+NH4]+
TG 53:7; TG(16:2/18:0/19:5); [M+NH4]+
Sample no.
Met
abol
ite n
ame
0.02000
0.4000
1.000
1.750
4.000
200.0
Response
CE Cer DG
DGDG
DGTS
LysoPC
LysoPE MG
MGDG
PlasmenylPC
PC
PE
SM
TG
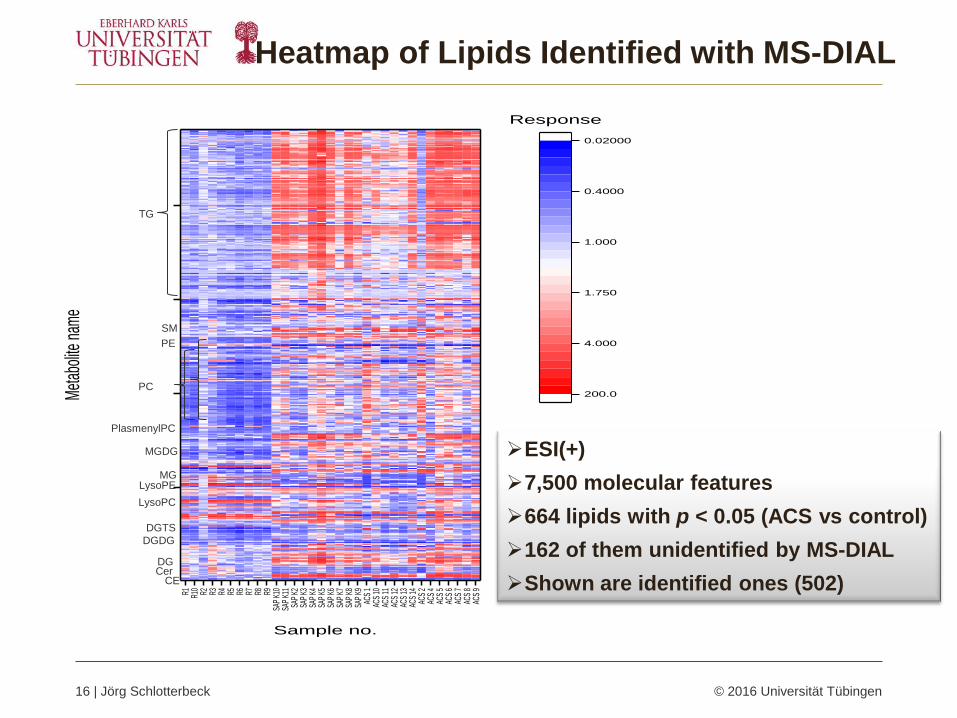
ESI(+)
7,500 molecular features
664 lipids with p < 0.05 (ACS vs control)
162 of them unidentified by MS-DIAL
Shown are identified ones (502)
0
100000
200000
300000
400000
500000
Control ACS SAP
Are
a
m/z 790.5593
0
10000
20000
30000
40000
50000
60000
70000
Control ACS SAP
Are
a
m/z 822.5491
0
20000
40000
60000
80000
Control ACS SAP
Are
a
m/z 814.5593
0
100000
200000
300000
400000
500000
Control ACS SAP
Are
a
m/z 762.5643
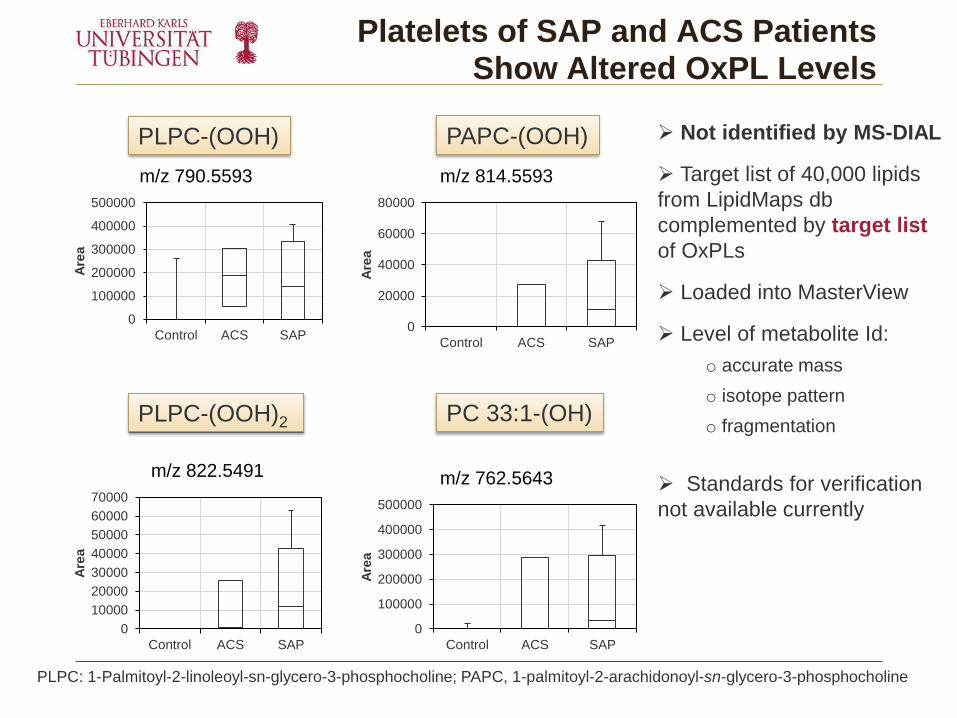
Platelets of SAP and ACS Patients Show Altered OxPL Levels
PLPC-(OOH) PAPC-(OOH)
PLPC-(OOH)2 PC 33:1-(OH)
Not identified by MS-DIAL
Target list of 40,000 lipids
from LipidMaps db
complemented by target list
of OxPLs
Loaded into MasterView
Level of metabolite Id:
o accurate mass
o isotope pattern
o fragmentation
Standards for verification
not available currently
PLPC: 1-Palmitoyl-2-linoleoyl-sn-glycero-3-phosphocholine; PAPC, 1-palmitoyl-2-arachidonoyl-sn-glycero-3-phosphocholine
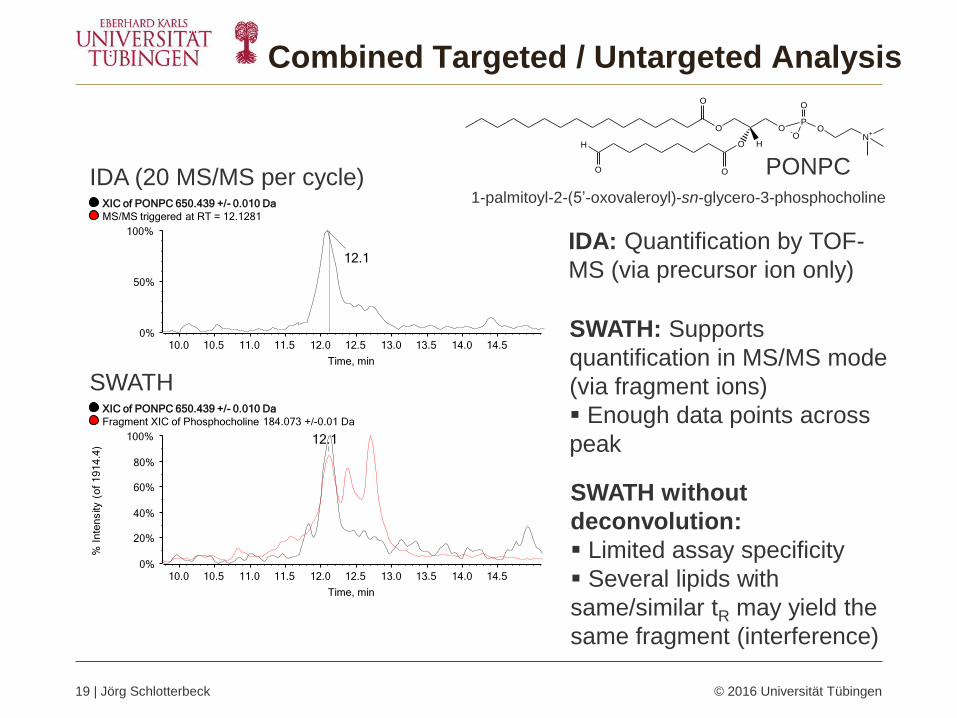
Combined Targeted / Untargeted Analysis
18 | Jörg Schlotterbeck © 2015 Universität Tübingen
O
O
O H
O ON
+
P-O
O
OO
H
PONPC
O
O
O H
O ON
+
P-O
O
OO
H
POVPC
O
O
O H
O ON
+
P-O
O
OO
HO
PGPC
O
O
O H
O ON
+
P-O
O
OO
HO
PAzPC
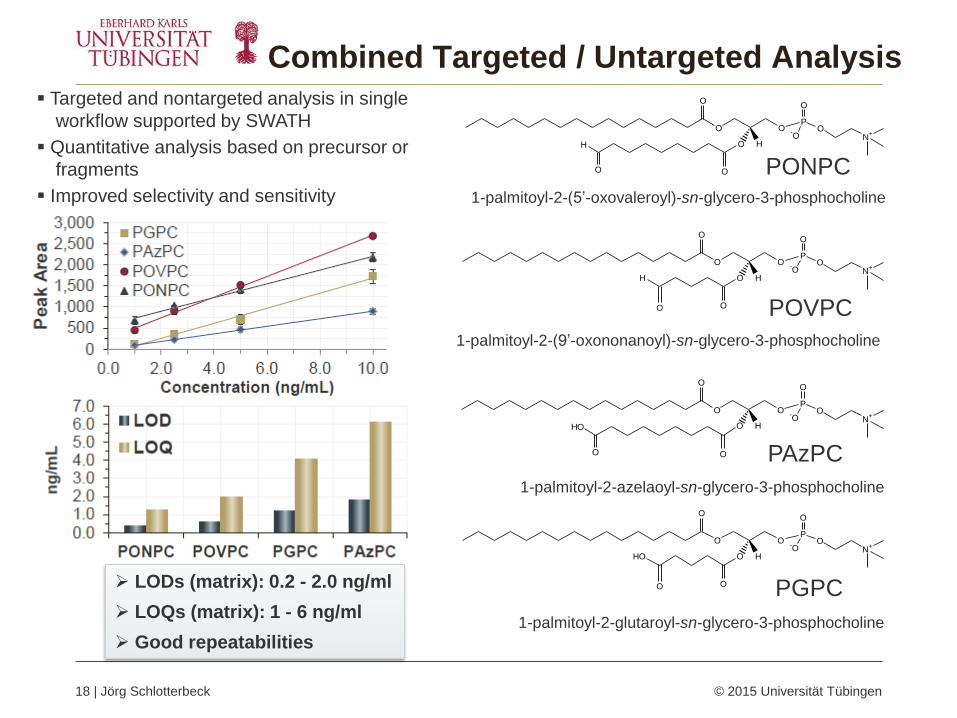
1-palmitoyl-2-(5’-oxovaleroyl)-sn-glycero-3-phosphocholine
1-palmitoyl-2-(9’-oxononanoyl)-sn-glycero-3-phosphocholine
1-palmitoyl-2-glutaroyl-sn-glycero-3-phosphocholine
1-palmitoyl-2-azelaoyl-sn-glycero-3-phosphocholine
LODs (matrix): 0.2 - 2.0 ng/ml
LOQs (matrix): 1 - 6 ng/ml
Good repeatabilities
Targeted and nontargeted analysis in single
workflow supported by SWATH
Quantitative analysis based on precursor or
fragments
Improved selectivity and sensitivity
Combined Targeted / Untargeted Analysis
19 | Jörg Schlotterbeck © 2016 Universität Tübingen
O
O
O H
O ON
+
P-O
O
OO
H
PONPC
1-palmitoyl-2-(5’-oxovaleroyl)-sn-glycero-3-phosphocholine
10.0 10.5 11.0 11.5 12.0 12.5 13.0 13.5 14.0 14.5
Time, min
0%
50%
100%
12.1
XIC of PONPC 650.439 +/- 0.010 Da
MS/MS triggered at RT = 12.1281
10.0 10.5 11.0 11.5 12.0 12.5 13.0 13.5 14.0 14.5
Time, min
0%
20%
40%
60%
80%
100%
% I
n t e
n s i t y (
o f
1 9
1 4
. 4 )
12.1
XIC of PONPC 650.439 +/- 0.010 Da
Fragment XIC of Phosphocholine 184.073 +/-0.01 Da
IDA (20 MS/MS per cycle)
SWATH
IDA: Quantification by TOF-
MS (via precursor ion only)
SWATH: Supports
quantification in MS/MS mode
(via fragment ions)
Enough data points across
peak
SWATH without
deconvolution:
Limited assay specificity
Several lipids with
same/similar tR may yield the
same fragment (interference)
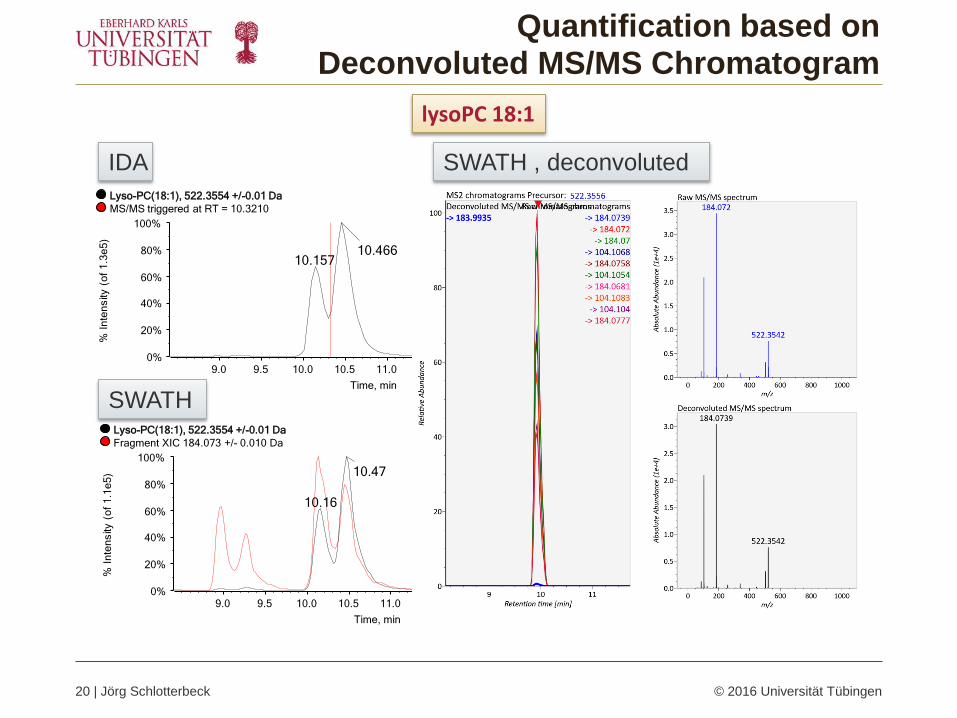
Quantification based on Deconvoluted MS/MS Chromatogram
lysoPC 18:1
9.0 9.5 10.0 10.5 11.0 11.5 12.0 12.5 13.0
Time, min
0%
20%
40%
60%
80%
100%
% I
n t e
n s i t y (
o f
1 . 3
e 5
)
10.466 10.157
Lyso-PC(18:1), 522.3554 +/-0.01 Da
MS/MS triggered at RT = 10.3210
9.0 9.5 10.0 10.5 11.0 11.5 12.0 12.5 13.0
Time, min
0%
20%
40%
60%
80%
100%
% I
n t e
n s i t y (
o f
1 . 1
e 5
) 10.47
10.16
Lyso-PC(18:1), 522.3554 +/-0.01 Da
Fragment XIC 184.073 +/- 0.010 Da
IDA
SWATH
SWATH , deconvoluted
20 | Jörg Schlotterbeck © 2016 Universität Tübingen
Data-independent acquisition (DIA) with SWATH
Better coverage of analytes as compared to DDA (IDA) profiling
MS-DIAL a powerful SW for automated lipid identification
Oxidized PLs not successfully identified, therefore target list approach used
In future, focus on combined targeted/untargeted profiling
Ion mobility and 2D-LC as further selectivity dimensions to resolve complexity
Summary / Conclusions
Platelet lipidomics
SAP and ACS show significant differences in lipid profiling (regulation via
signaling cascades)
Several oxidized PLs showed increased levels in SAP and ACS patients
(oxidative stress or controlled regulation upon platelet activation)

Acknowledgements
Financial Support:
Struktur- und
Innovationsfonds für die
Forschung (SI-BW)
Jörg Schlotterbeck
Adrian Sievers-Engler
Stefan Polnick
Markus Höldrich
Corinna Sanwald
Ulrich Woiwode
Carlos Calderon
Aleksandra Zimmermann
Jeannie Horak
Stefan Neubauer
Heike Gerhardt
Siyao Liu
Bernhard Drotleff
Stefanie Bäurer
Mike Kaupert
Prof. Meinrad Gawaz
Dr. Madhumita Chatterjee