Embed Size (px)
Citation preview

1
Uganda Health Supply Chain
Annual Report October 1, 2017 to September 30, 2018
2
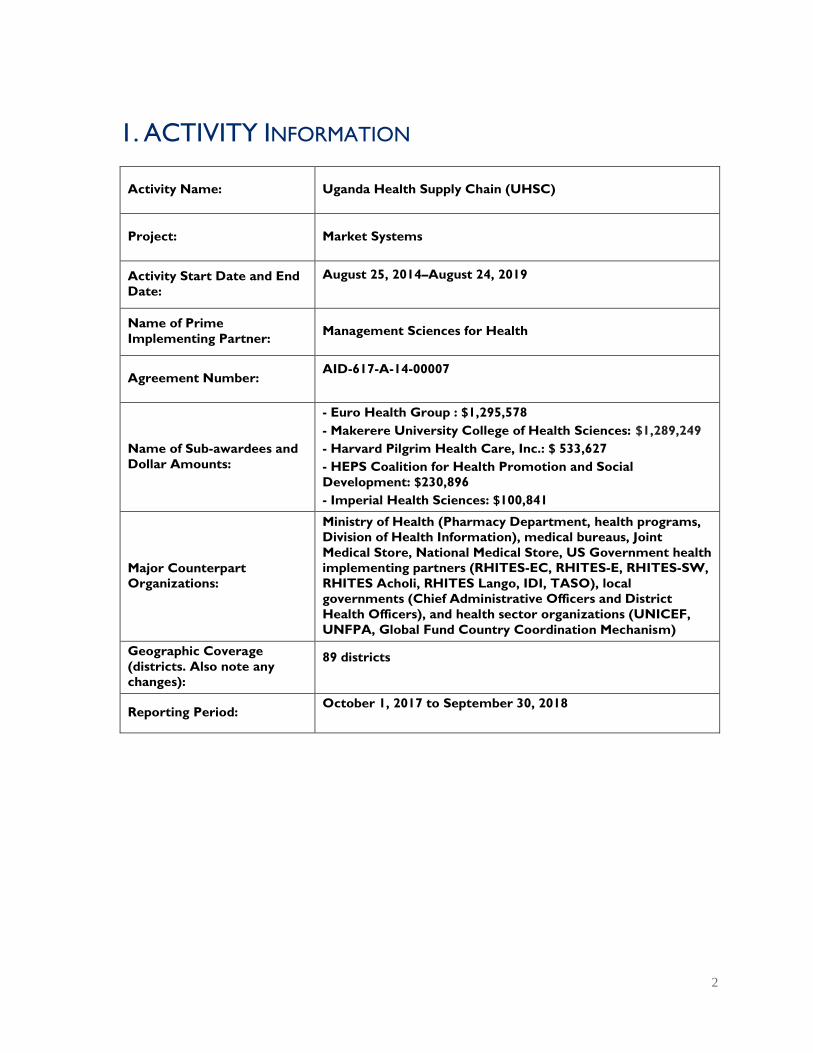
1. ACTIVITY INFORMATION
Activity Name: Uganda Health Supply Chain (UHSC)
Project: Market Systems
Activity Start Date and End
Date:
August 25, 2014–August 24, 2019
Name of Prime
Implementing Partner: Management Sciences for Health
Agreement Number: AID-617-A-14-00007
Name of Sub-awardees and
Dollar Amounts:
- Euro Health Group : $1,295,578
- Makerere University College of Health Sciences: $1,289,249
- Harvard Pilgrim Health Care, Inc.: $ 533,627
- HEPS Coalition for Health Promotion and Social
Development: $230,896
- Imperial Health Sciences: $100,841
Major Counterpart
Organizations:
Ministry of Health (Pharmacy Department, health programs,
Division of Health Information), medical bureaus, Joint
Medical Store, National Medical Store, US Government health
implementing partners (RHITES-EC, RHITES-E, RHITES-SW,
RHITES Acholi, RHITES Lango, IDI, TASO), local
governments (Chief Administrative Officers and District
Health Officers), and health sector organizations (UNICEF,
UNFPA, Global Fund Country Coordination Mechanism)
Geographic Coverage
(districts. Also note any
changes):
89 districts
Reporting Period: October 1, 2017 to September 30, 2018

3
2. ACRONYMS AND ABBREVIATIONS
AMELP activity monitoring evaluation and learning plan
AMU Appropriate Medicines Unit
ARV antiretroviral
ART antiretroviral therapy
CDCS Country Development Cooperation Strategy
DHI
DHIS2
Division of Health Information
district health information system, version 2
EMHS essential medicines and health supplies
GDP good distribution practices
GPP good pharmacy practices
HC health center
HMIS health management information system
iCCM integrated community case management
IFS Industry and Financial Systems (enterprise resource solution)
JMS Joint Medical Store
MAPD
MB MMS
Malaria Action Program for Districts
medical bureau medicines management supervisors
M&E monitoring and evaluation
MDR multi-drug resistant
MMS medicines management supervisors
MoH Ministry of Health
MSH Management Sciences for Health
MTC medicines and therapeutic committee
NMS National Medical Stores
PEPFAR US President’s Emergency Plan for AIDS Relief
PFM pharmaceutical financial management
PIP pharmaceutical information portal
PNFP private not-for-profit
QPPU Quantification and Procurement Planning Unit
RMNCAH reproductive, maternal, newborn, child, and adolescent health
SPARS supervision, performance assessment, recognition strategy
TB
TLD
TWOS
tuberculosis
tenofovir disoproxil fumarate, lamivudine, and dolutegravir
TB web-based ordering system
UHSC Uganda Health Supply Chain [program]
USAID US Agency for International Development
WAOS web-based ARV ordering and reporting system
4
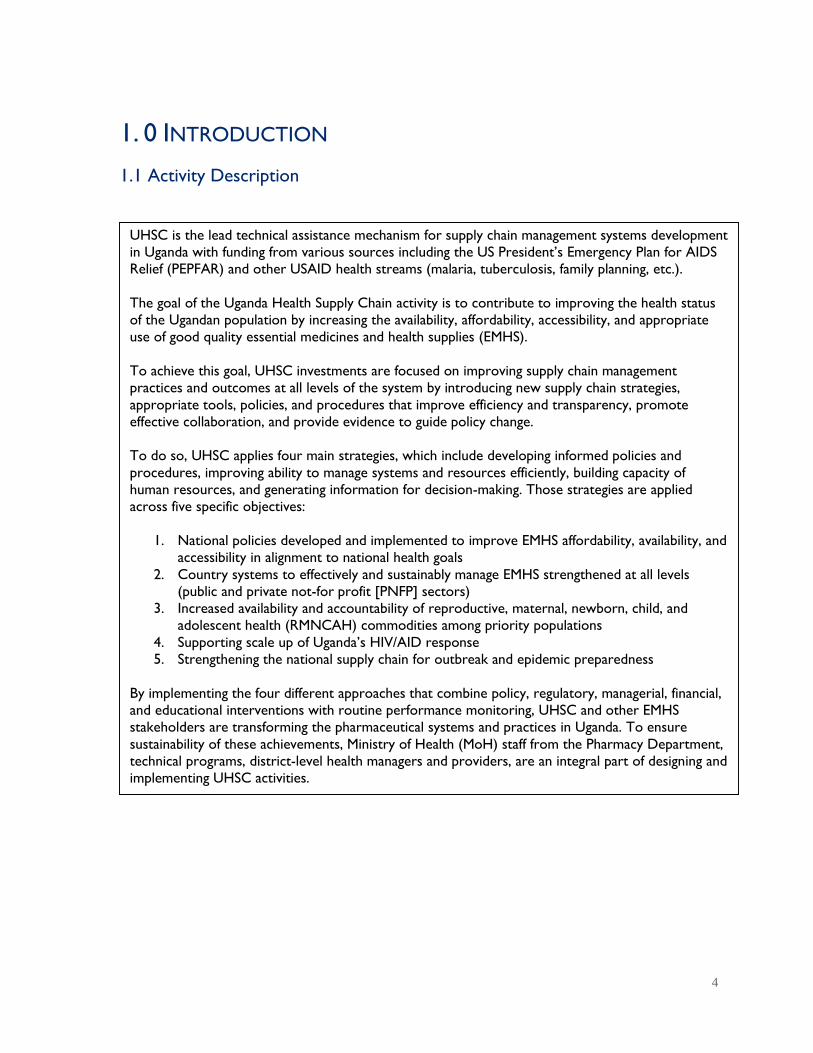
1. 0 INTRODUCTION
1.1 Activity Description
UHSC is the lead technical assistance mechanism for supply chain management systems development
in Uganda with funding from various sources including the US President’s Emergency Plan for AIDS
Relief (PEPFAR) and other USAID health streams (malaria, tuberculosis, family planning, etc.).
The goal of the Uganda Health Supply Chain activity is to contribute to improving the health status
of the Ugandan population by increasing the availability, affordability, accessibility, and appropriate
use of good quality essential medicines and health supplies (EMHS).
To achieve this goal, UHSC investments are focused on improving supply chain management
practices and outcomes at all levels of the system by introducing new supply chain strategies,
appropriate tools, policies, and procedures that improve efficiency and transparency, promote
effective collaboration, and provide evidence to guide policy change.
To do so, UHSC applies four main strategies, which include developing informed policies and
procedures, improving ability to manage systems and resources efficiently, building capacity of
human resources, and generating information for decision-making. Those strategies are applied
across five specific objectives:
1. National policies developed and implemented to improve EMHS affordability, availability, and
accessibility in alignment to national health goals
2. Country systems to effectively and sustainably manage EMHS strengthened at all levels
(public and private not-for profit [PNFP] sectors)
3. Increased availability and accountability of reproductive, maternal, newborn, child, and
adolescent health (RMNCAH) commodities among priority populations
4. Supporting scale up of Uganda’s HIV/AID response
5. Strengthening the national supply chain for outbreak and epidemic preparedness
By implementing the four different approaches that combine policy, regulatory, managerial, financial,
and educational interventions with routine performance monitoring, UHSC and other EMHS
stakeholders are transforming the pharmaceutical systems and practices in Uganda. To ensure
sustainability of these achievements, Ministry of Health (MoH) staff from the Pharmacy Department,
technical programs, district-level health managers and providers, are an integral part of designing and
implementing UHSC activities.
5
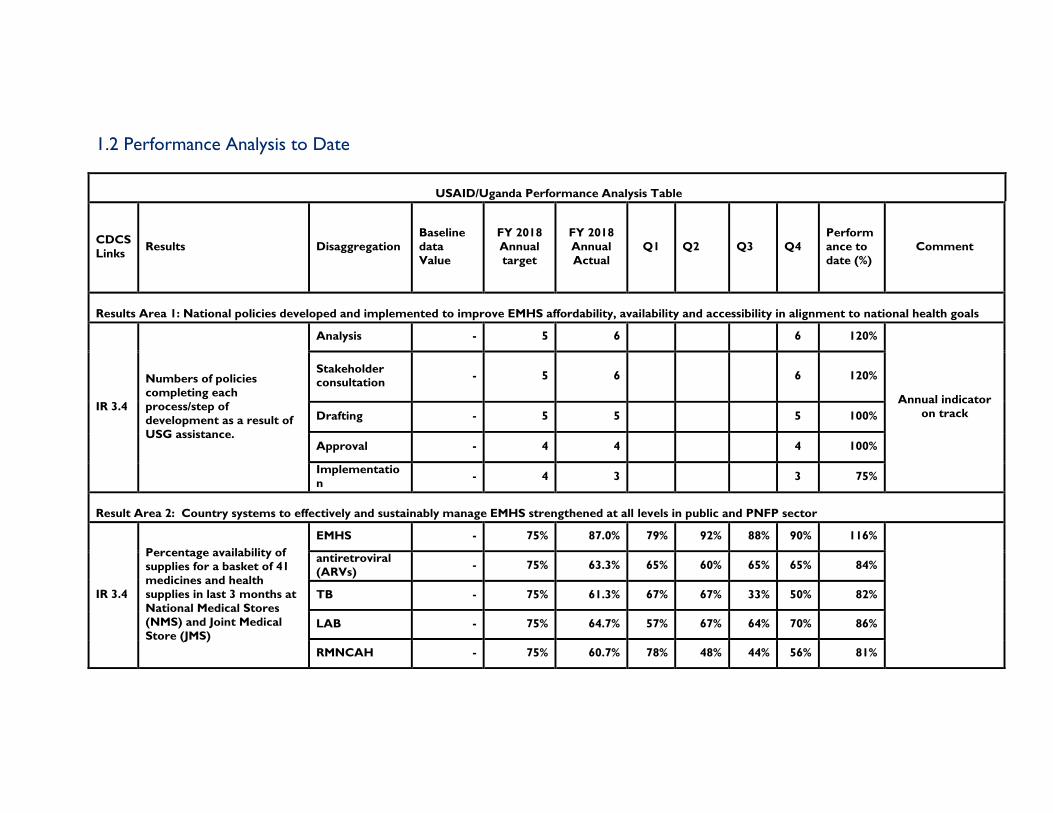
1.2 Performance Analysis to Date
USAID/Uganda Performance Analysis Table
CDCS
Links Results Disaggregation
Baseline
data
Value
FY 2018
Annual
target
FY 2018
Annual
Actual
Q1 Q2 Q3 Q4
Perform
ance to
date (%)
Comment
Results Area 1: National policies developed and implemented to improve EMHS affordability, availability and accessibility in alignment to national health goals
IR 3.4
Numbers of policies
completing each
process/step of
development as a result of
USG assistance.
Analysis - 5 6 6 120%
Annual indicator
on track
Stakeholder consultation
- 5 6 6 120%
Drafting - 5 5 5 100%
Approval - 4 4 4 100%
Implementatio
n - 4 3 3 75%
Result Area 2: Country systems to effectively and sustainably manage EMHS strengthened at all levels in public and PNFP sector
IR 3.4
Percentage availability of
supplies for a basket of 41
medicines and health
supplies in last 3 months at
National Medical Stores
(NMS) and Joint Medical
Store (JMS)
EMHS - 75% 87.0% 79% 92% 88% 90% 116%
antiretroviral
(ARVs) - 75% 63.3% 65% 60% 65% 65% 84%
TB - 75% 61.3% 67% 67% 33% 50% 82%
LAB - 75% 64.7% 57% 67% 64% 70% 86%
RMNCAH - 75% 60.7% 78% 48% 44% 56% 81%

6
USAID/Uganda Performance Analysis Table
CDCS
Links Results Disaggregation
Baseline
data
Value
FY 2018
Annual
target
FY 2018
Annual
Actual
Q1 Q2 Q3 Q4
Perform
ance to
date (%)
Comment
IR 3.4
Average percentage
availability of a basket of 41
commodities based on all
reporting facilities in the
previous quarter
EMHS - 89% 83.9% 91% 85% 81% 79% 94%
ARVs - 89% 87.7% 90% 86% 87% 88% 99%
TB - 89% 83.5% 89% 90% 79% 76% 94%
LAB 89% 80.4% 71% 84% 83% 84% 90%
RMNCH - 89% 83.9% 88% 92% 79% 77% 94%
Sub-IR 2.1: Central level systems for EMHS management enhanced
IR 3.4
Number of wholesalers
licensed according to the
new Good Dispensing
Practice (GDP) guidelines
developed
0 350 484 445 484 138%
IR 3.4
Number of government
and PNFP health facility
pharmacies inspected for Good Pharmaceutical
Practices (GPP)
Government 797 1500 1560 1412 1560 104%
PNFP 142 500 277 244 277 55%
IR 3.4
Percentage of government
and PNFP health facility
pharmacies certified
according to GPP
Government 54% 60% 0.59 56% 59% 98%
PNFP 59% 65% 0.65 63% 65% 100%
7
USAID/Uganda Performance Analysis Table
CDCS
Links Results Disaggregation
Baseline
data
Value
FY 2018
Annual
target
FY 2018
Annual
Actual
Q1 Q2 Q3 Q4
Perform
ance to
date (%)
Comment
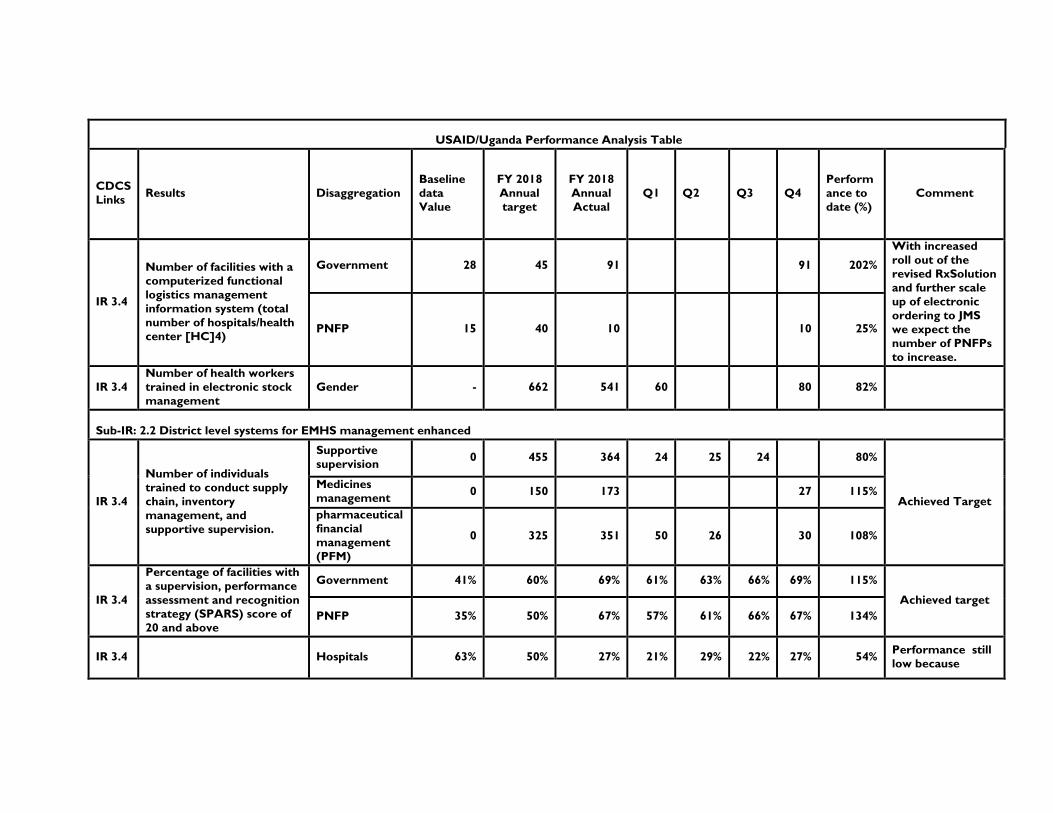
IR 3.4
Number of facilities with a
computerized functional
logistics management
information system (total
number of hospitals/health
center [HC]4)
Government 28 45 91 91 202%
With increased
roll out of the
revised RxSolution
and further scale
up of electronic
ordering to JMS
we expect the
number of PNFPs
to increase.
PNFP 15 40 10 10 25%
IR 3.4
Number of health workers
trained in electronic stock
management
Gender - 662 541 60 80 82%
Sub-IR: 2.2 District level systems for EMHS management enhanced
IR 3.4
Number of individuals
trained to conduct supply
chain, inventory
management, and
supportive supervision.
Supportive
supervision 0 455 364 24 25 24 80%
Achieved Target
Medicines
management 0 150 173 27 115%
pharmaceutical
financial
management
(PFM)
0 325 351 50 26 30 108%
IR 3.4
Percentage of facilities with
a supervision, performance
assessment and recognition
strategy (SPARS) score of
20 and above
Government 41% 60% 69% 61% 63% 66% 69% 115%
Achieved target
PNFP 35% 50% 67% 57% 61% 66% 67% 134%
IR 3.4 Hospitals 63% 50% 27% 21% 29% 22% 27% 54% Performance still
low because

8
USAID/Uganda Performance Analysis Table
CDCS
Links Results Disaggregation
Baseline
data
Value
FY 2018
Annual
target
FY 2018
Annual
Actual
Q1 Q2 Q3 Q4
Perform
ance to
date (%)
Comment
Percentage of order based
facilities with a PFM score
of 80% and above
HC4 51% 50% 30% 28% 24% 25% 30% 60%
Facilities have only
received visit 1
and 2 but with
additional visits
performance
expected to
improve
IR 3.4
Average percentage of
cases of priority diseases
treated in compliance with
standard treatment
guidelines in reporting
period
Malaria 70% 70% 90% 86% 87% 88% 90% 129% Achieved Target
Upper
respiratory
tract infection
41% 70% 58% 55% 52% 59% 58% 83%
Diarrhea 45% 70% 70% 66% 68% 70% 70% 100% Achieved Target
Result Area 3: Increased availability and accountability of RMNCH commodities among priority populations
IR 2.1
Percentage of health
facilities submitting a quarterly integrated
community case
management (iCCM)
report
10% 40% 10.5% 10% 10% 11% 11% 26%
Sub-
IR
2.1.2
Average stock out rate of
contraceptive commodities
at family planning service
delivery points
Depo-Provera 0% 38% 38% Annual indicator
Implanon 0% 53% 53% Annual indicator
Result Area 4: Supporting scale up of Uganda’s HIV/AIDS response
IR 1.2
IR 1.3
The percentage of
antiretroviral therapy Government 0% 50% 49% 8% 26% 34% 49% 98%

9
USAID/Uganda Performance Analysis Table
CDCS
Links Results Disaggregation
Baseline
data
Value
FY 2018
Annual
target
FY 2018
Annual
Actual
Q1 Q2 Q3 Q4
Perform
ance to
date (%)
Comment
(ART) sites initiated on
ART SPARS PNFP 0% 50% 11% 1% 4% 7% 11% 22%
IR 1.2
IR 1.3 Percentage of facilities
scoring at least 80% of the
maximum ART SPARS
score
Government 0% 50% 44% 12% 19% 33% 44% 87%
PNFP 0% 50% 28% 1% 7% 19% 28% 57%
IR 1.2
IR 1.3 Average percentage
availability of a basket of
ART commodities in the
last three months
Government 90% 93% 76% 78% 69% 77% 79% 81%
PNFP 90% 93% 85% 93% 71% 94% 84% 92%
IR 1.2
IR 1.3 Percentage of facilities with
accurate orders
Government 0% 50% 26% 9% 16% 31% 50% 53%
PNFP 0% 50% 30% 20% 17% 36% 47% 60%
IR 1.2
IR 1.3 Percentage of facilities with
traceability of first line
ARVs
Government 0% 50% 24% 18% 15% 31% 31% 48%
PNFP 0% 50% 29% 20% 7% 55% 33% 58%
Result 5: Strengthen supply chain systems to respond to public health emergencies
IR 5.1.1 Establish a national stockpile strategy
A national stockpile
strategy of medical
countermeasures for use
during a public health
emergency in place
Y5 new indictors
5.1.2 Establish a national public health emergencies supply chain coordination mechanism
10
USAID/Uganda Performance Analysis Table
CDCS
Links Results Disaggregation
Baseline
data
Value
FY 2018
Annual
target
FY 2018
Annual
Actual
Q1 Q2 Q3 Q4
Perform
ance to
date (%)
Comment
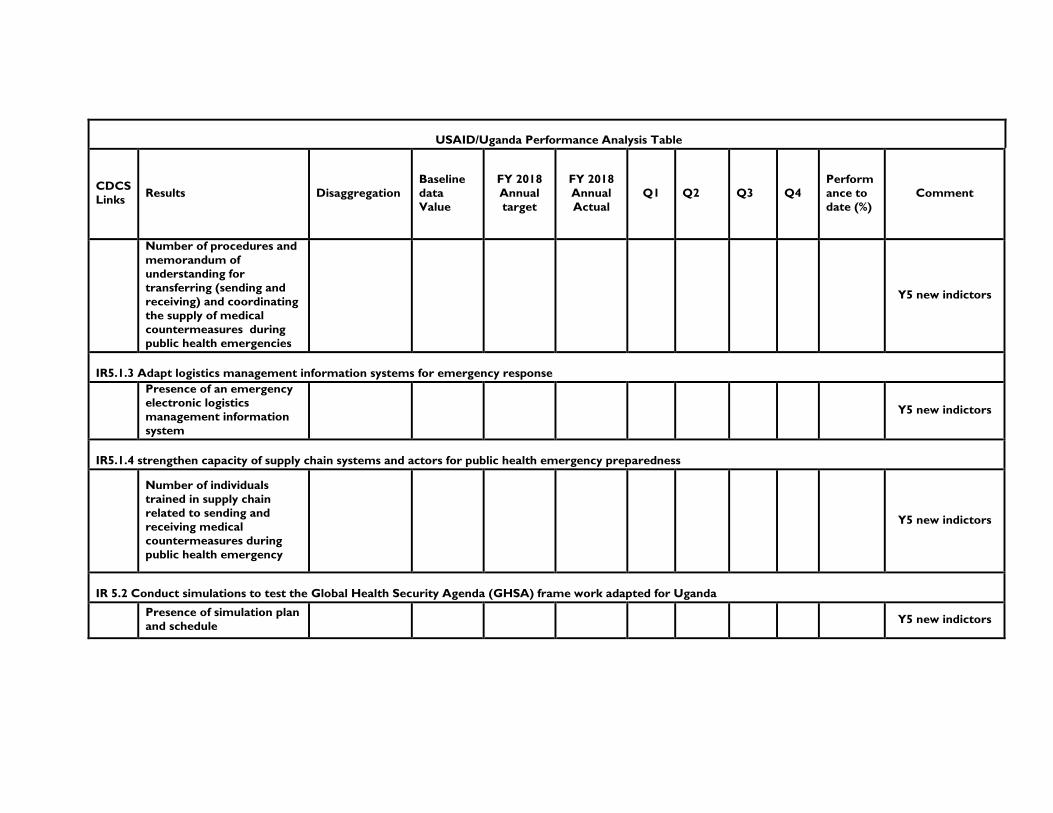
Number of procedures and
memorandum of
understanding for
transferring (sending and
receiving) and coordinating
the supply of medical
countermeasures during
public health emergencies
Y5 new indictors
IR5.1.3 Adapt logistics management information systems for emergency response
Presence of an emergency
electronic logistics
management information
system
Y5 new indictors
IR5.1.4 strengthen capacity of supply chain systems and actors for public health emergency preparedness
Number of individuals
trained in supply chain
related to sending and
receiving medical
countermeasures during
public health emergency
Y5 new indictors
IR 5.2 Conduct simulations to test the Global Health Security Agenda (GHSA) frame work adapted for Uganda
Presence of simulation plan
and schedule Y5 new indictors
11
USAID/Uganda Performance Analysis Table
CDCS
Links Results Disaggregation
Baseline
data
Value
FY 2018
Annual
target
FY 2018
Annual
Actual
Q1 Q2 Q3 Q4
Perform
ance to
date (%)
Comment
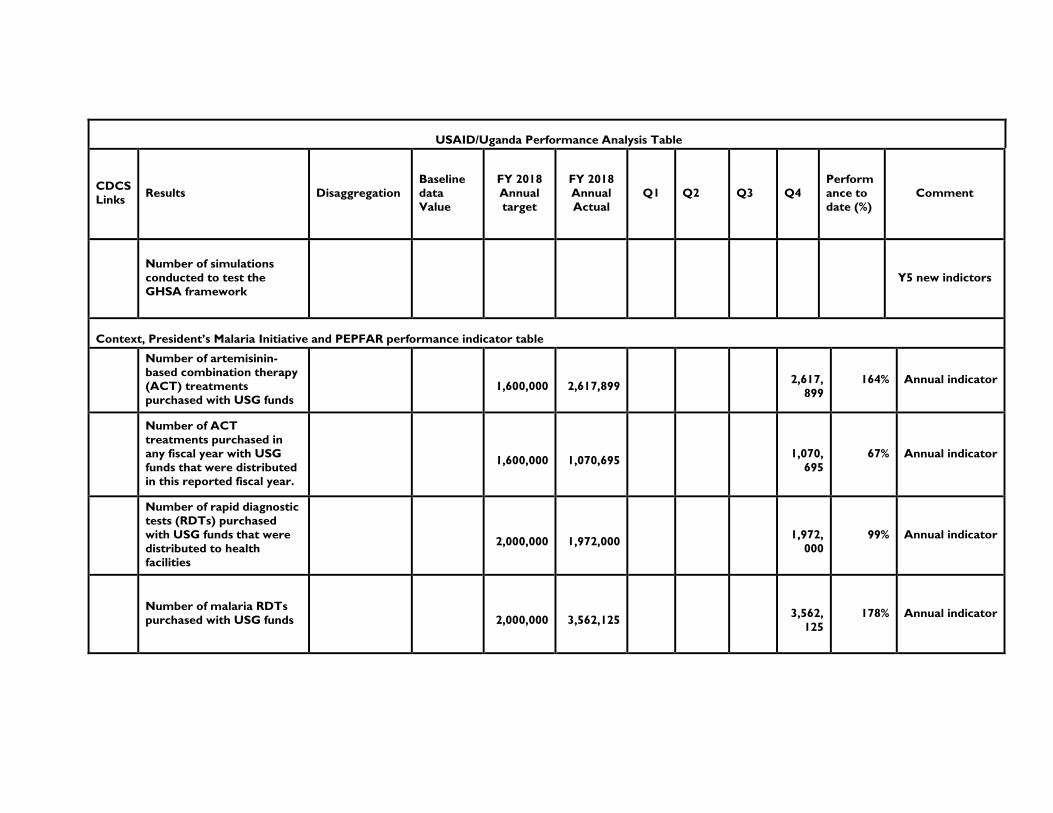
Number of simulations
conducted to test the
GHSA framework
Y5 new indictors
Context, President’s Malaria Initiative and PEPFAR performance indicator table
Number of artemisinin-
based combination therapy
(ACT) treatments
purchased with USG funds
1,600,000
2,617,899
2,617,
899
164% Annual indicator
Number of ACT
treatments purchased in
any fiscal year with USG
funds that were distributed
in this reported fiscal year.
1,600,000
1,070,695
1,070,
695
67% Annual indicator
Number of rapid diagnostic
tests (RDTs) purchased
with USG funds that were
distributed to health
facilities
2,000,000
1,972,000
1,972,
000
99% Annual indicator
Number of malaria RDTs
purchased with USG funds
2,000,000
3,562,125
3,562,
125
178% Annual indicator

12
USAID/Uganda Performance Analysis Table
CDCS
Links Results Disaggregation
Baseline
data
Value
FY 2018
Annual
target
FY 2018
Annual
Actual
Q1 Q2 Q3 Q4
Perform
ance to
date (%)
Comment
Number of insecticide
treated nets purchased
with USG funds
1,575,000
2,000,000 127%
Number of insecticide
treated nets purchased
with USG funds that were
distributed
1,575,000
1,643,411 104%

13
1.3 Contribution to CDCS Results Framework Progress Narrative
In Year 4, UHSC continued to contribute to making the country’s key systems more accountable
and responsive to Uganda’s development needs. We contributed to the Country Development
Cooperation Strategy (CDCS) intermediate result 3.3 by strengthening health and pharmaceutical
management systems in a way that increases access to lifesaving medicines and other health
commodities.
Our policy work directly contributed to IR 3.4 by creating an enabling environment that enhances
the pharmaceutical sector regulatory framework and financial and technical management, oversight
and monitoring of the supply chain system at all levels.
Our progress in increasing access to RMNCAH commodities, particularly at the community level,
contributed to the achievement of CDCS Result 2. Our work to improve access and availability of
commodities for healthy reproductive practices for women of all ages and to treat most common
child diseases directly supports IR 2.1.
In the last quarter of Year 4, in addition to supporting scale up of Uganda’s response to the HIV
epidemic, we began collaborating with GHSA stakeholders to strengthen the national supply chain
for outbreaks and epidemics, which directly contributes to CDCS intermediate results 1.2 and 1.3,
which aim to increase national capacity to manage risk and enhance prevention and treatment of
HIV, malaria, and other epidemics.

14
2 ACTIVITY IMPLEMENTATION PROGRESS
Annex 10.4 contains a detailed narrative of all of our Year 4 activities.
2.1 Summary of Implementation Status
Activity Result
Areas
Summary of planned
activities in work plan for
the reporting year
Actual key activities/tasks
conducted during the year
Link to CDCS 1
1.1. Policies that
improve
affordability,
availability, and
accessibility of
EMHS
Support the Pharmacy
Department to conduct the mid-
term review of the National
Pharmaceutical Sector Strategic
Plan (NPSSP) III
UHSC analyzed pharmaceutical
sector performance data and
facilitated three task force
meetings and two national
stakeholder meetings to assess
progress in achieving NPSSP III
objectives
IR 3.4
Obtain consensus within the
MoH and wider health sector on
the adoption of a needs-based
formula to allocate EMHS
resources to health facilities
Our evidence and advocacy
resulted in the MoH setting up
an Equity Task Force to
correct the inequities with the
formula used since 2005 for
allocating EMHS funds to
government facilities. We
provided technical assistance to
develop a new allocation
formula which was endorsed
in a stakeholders meeting
IR 3.4
Finalize implementation of the
push-pull pilot study in 50
facilities in 10 districts and
disseminate the results in a
national meeting
We completed and evaluated
the pilot study and
disseminated results to
stakeholders. Findings indicated
that lower-level facilities can
produce accurate, timely
orders and optimize their
EMHS budgets, and NMS has
the potential to handle the
expected increased work load
from the transition
IR 3.4
Collaborate with the MoH and
partners to ensure issues of
medicines affordability are
adequately addressed in national
plans
With WHO and MoH, we
analyzed data from the 2016/17
Uganda National Household
Survey to estimate the effect of
direct household out-of-pocket
payments on the population.
We disseminated results from
our health services cost study
to guide the selection of an
affordable medicines benefit
package
IR 3.4
1 Which IRs and Sub-IRs in CDCS 2016-2021 does the activity results contribute to?
15
Activity Result
Areas
Summary of planned
activities in work plan for
the reporting year
Actual key activities/tasks
conducted during the year
Link to CDCS 1
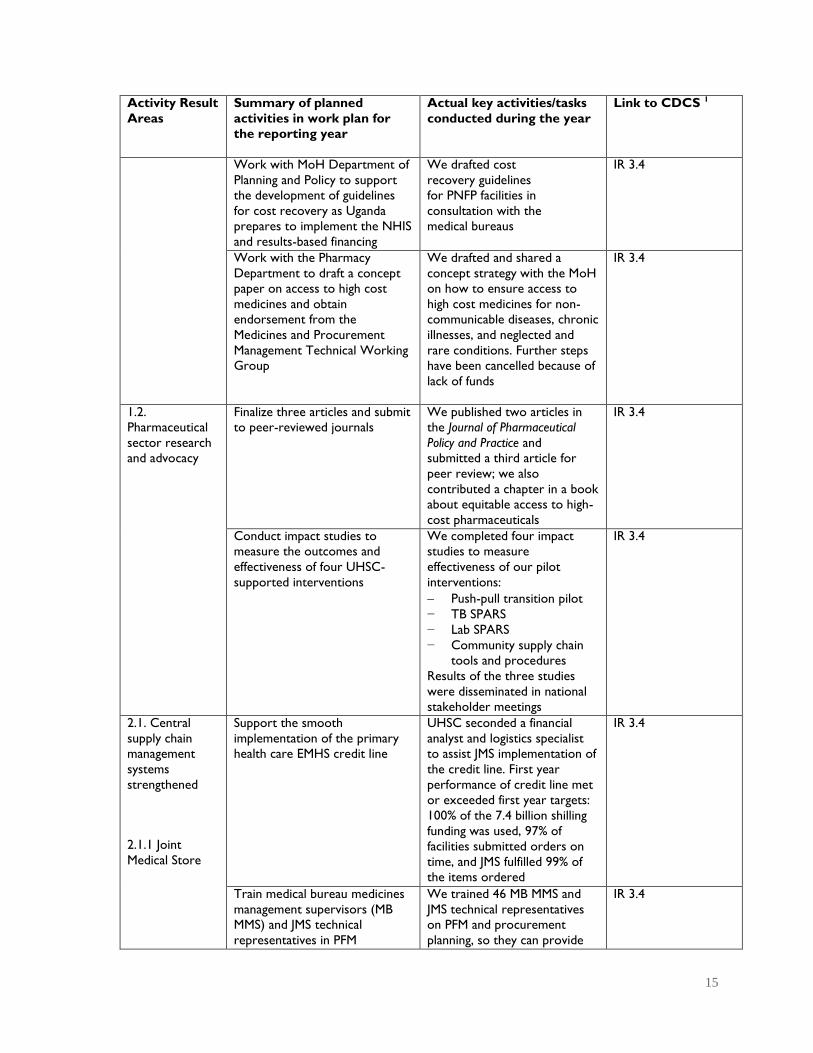
Work with MoH Department of
Planning and Policy to support
the development of guidelines
for cost recovery as Uganda
prepares to implement the NHIS
and results-based financing
We drafted cost
recovery guidelines
for PNFP facilities in
consultation with the
medical bureaus
IR 3.4
Work with the Pharmacy
Department to draft a concept
paper on access to high cost
medicines and obtain
endorsement from the
Medicines and Procurement
Management Technical Working
Group
We drafted and shared a
concept strategy with the MoH
on how to ensure access to
high cost medicines for non-
communicable diseases, chronic
illnesses, and neglected and
rare conditions. Further steps
have been cancelled because of
lack of funds
IR 3.4
1.2.
Pharmaceutical
sector research
and advocacy
Finalize three articles and submit
to peer-reviewed journals
We published two articles in
the Journal of Pharmaceutical
Policy and Practice and
submitted a third article for
peer review; we also
contributed a chapter in a book
about equitable access to high-
cost pharmaceuticals
IR 3.4
Conduct impact studies to
measure the outcomes and
effectiveness of four UHSC-
supported interventions
We completed four impact
studies to measure
effectiveness of our pilot
interventions:
Push-pull transition pilot
− TB SPARS
− Lab SPARS
− Community supply chain
tools and procedures
Results of the three studies
were disseminated in national
stakeholder meetings
IR 3.4
2.1. Central
supply chain
management
systems
strengthened
2.1.1 Joint
Medical Store
Support the smooth
implementation of the primary
health care EMHS credit line
UHSC seconded a financial
analyst and logistics specialist
to assist JMS implementation of
the credit line. First year
performance of credit line met
or exceeded first year targets:
100% of the 7.4 billion shilling
funding was used, 97% of
facilities submitted orders on
time, and JMS fulfilled 99% of
the items ordered
IR 3.4
Train medical bureau medicines
management supervisors (MB
MMS) and JMS technical
representatives in PFM
We trained 46 MB MMS and
JMS technical representatives
on PFM and procurement
planning, so they can provide
IR 3.4

16
Activity Result
Areas
Summary of planned
activities in work plan for
the reporting year
Actual key activities/tasks
conducted during the year
Link to CDCS 1
on-job support to PNFP facility
staff on EMHS credit line
Review the implementation
status of actions recommended
from previous UHSC-funded
technical assessments/assistance
activities
We completed a review of JMS
implementation of 60
recommendations made by
three UHSC consultants in
2014-2015 to strengthen the
functionality of the IFS
(enterprise resource solution)
and distribution services. JMS
has implemented 83% of the
recommendations and clearly
made good use of UHSC
support to improve their
efficiency and financial
performance
IR 3.4
2.1.2 National
Drug Authority
Continue co-funding GPP
inspections to expand coverage
of the public and PNFP health
facilities. Transition the server
with the GPP database to
National Drug Authority (NDA)
and train NDA staff to manage
and maintain the server and
GPP/GDP databases
With our support, NDA has
made 1,837 GPP facility
inspections to date, including at
137 high-volume ART sites.
The servers were transferred
to NDA and the system is
being managed entirely by
NDA staff
IR 3.4
Support NDA to roll-out the
second phase of GDP standards
in preparation for 2018 licensing
of approximately 400
pharmaceutical wholesalers
With UHSC support, NDA
implemented Phase 2 GDP
standards and 445 wholesalers
received their 2018 license.
The GDP inspection tool was
incorporated into the NDA
inspection manual
IR 3.4
2.1.3 Private
not-for-profit
(PNFP) sector
Support the medical bureaus to
strengthen their implementation
of essential medicines (EM)
SPARS in the PNFP sector
99% of PNFP facilities have
received at least one EM
SPARS visit, 69% have had five
or more visits and 62% of the
facilities have achieved the
target score of 20
IR 3.4
Support roll out of PFM in PNFP
sector
We finalized the PFM cost
recovery module and training
materials and trained 44 MB
MMS and JMS staff to scale-up
PFM and help credit line
facilities do their procurement
planning. To date, 148 (25%) of
PNFP facilities have received
one or more PFM visits.
IR 3.4
2.1.4
Pharmaceutical
Information
Portal (PIP)
Build capacity of MoH Division
of Health Information (DHI) staff
to operate, manage and maintain
the PIP and enhance information
technology infrastructure
We trained the DHI team on
the operation and maintenance
of the system and developed
PIP system administration
manuals. We initiated migration
IR 3.4
17
Activity Result
Areas
Summary of planned
activities in work plan for
the reporting year
Actual key activities/tasks
conducted during the year
Link to CDCS 1
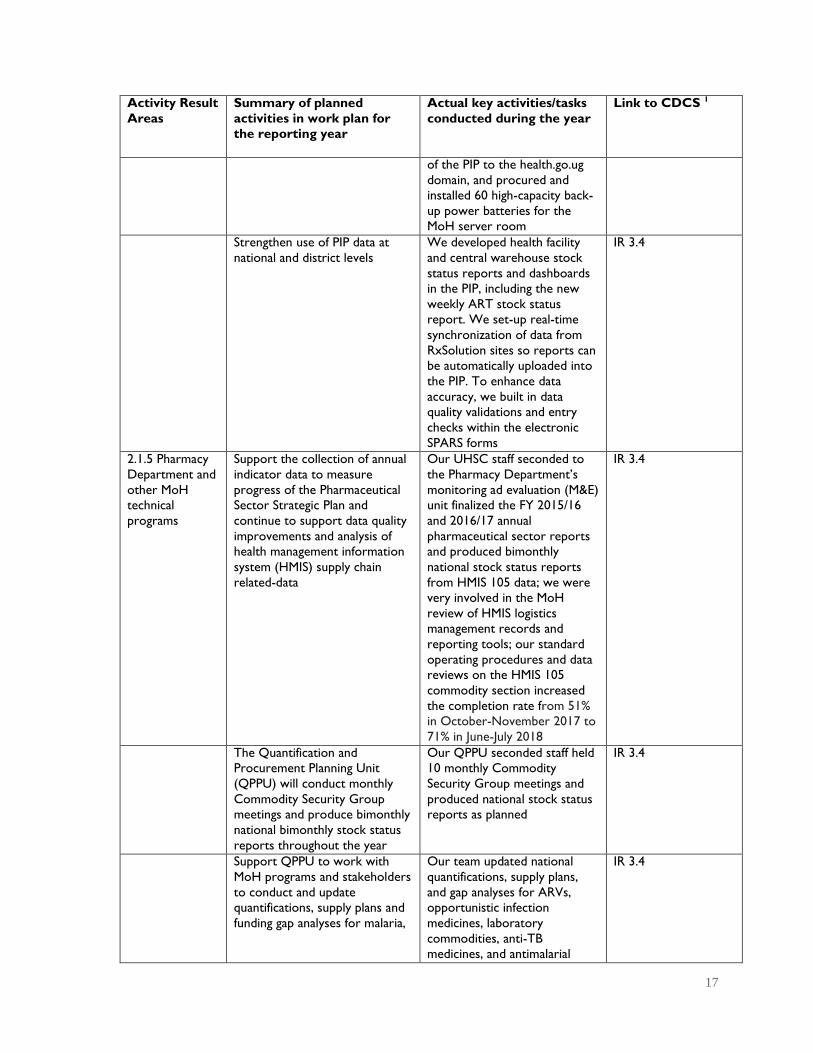
of the PIP to the health.go.ug
domain, and procured and
installed 60 high-capacity back-
up power batteries for the
MoH server room
Strengthen use of PIP data at
national and district levels
We developed health facility
and central warehouse stock
status reports and dashboards
in the PIP, including the new
weekly ART stock status
report. We set-up real-time
synchronization of data from
RxSolution sites so reports can
be automatically uploaded into
the PIP. To enhance data
accuracy, we built in data
quality validations and entry
checks within the electronic
SPARS forms
IR 3.4
2.1.5 Pharmacy
Department and
other MoH
technical
programs
Support the collection of annual
indicator data to measure
progress of the Pharmaceutical
Sector Strategic Plan and
continue to support data quality
improvements and analysis of
health management information
system (HMIS) supply chain
related-data
Our UHSC staff seconded to
the Pharmacy Department’s
monitoring ad evaluation (M&E)
unit finalized the FY 2015/16
and 2016/17 annual
pharmaceutical sector reports
and produced bimonthly
national stock status reports
from HMIS 105 data; we were
very involved in the MoH
review of HMIS logistics
management records and
reporting tools; our standard
operating procedures and data
reviews on the HMIS 105
commodity section increased
the completion rate from 51%
in October-November 2017 to
71% in June-July 2018
IR 3.4
The Quantification and
Procurement Planning Unit
(QPPU) will conduct monthly
Commodity Security Group
meetings and produce bimonthly
national bimonthly stock status
reports throughout the year
Our QPPU seconded staff held
10 monthly Commodity
Security Group meetings and
produced national stock status
reports as planned
IR 3.4
Support QPPU to work with
MoH programs and stakeholders
to conduct and update
quantifications, supply plans and
funding gap analyses for malaria,
Our team updated national
quantifications, supply plans,
and gap analyses for ARVs,
opportunistic infection
medicines, laboratory
commodities, anti-TB
medicines, and antimalarial
IR 3.4

18
Activity Result
Areas
Summary of planned
activities in work plan for
the reporting year
Actual key activities/tasks
conducted during the year
Link to CDCS 1
TB, ART, laboratory and
RMHCAH commodities.
commodities. They also led a
national quantification exercise
for EMHS needed to manage
severe acute malnutrition and
common non-communicable
diseases
Finalize TB SPARS electronic
reporting tool, support the
training of the 20 pilot district
TB SPARS supervisors, and fund
bimonthly TB SPARS facility
visits to provide oversight of TB
diagnostic and treatment
services
With the National Tuberculosis
and Leprosy Program (NTLP)
we finalized the TB SPARS e-
reporting system, trained 20
supervisors, and funded 500 TB
SPARS facility visits; 83% of the
190 pilot facilities have been
visited at least 3 times. At pilot
end, the average facility score
was 21.1 of the target of 25
IR 3.4
Train district biostatisticians and
other key stakeholders on the
TB web-based ordering system
(TWOS), provide follow-up
support to users, and prepare
and disseminate bimonthly
TWOS reports. Plan to
transition the management and
maintenance of TWOS to NTLP
during the year
We trained all 122
biostatisticians on the use of
TWOS plus 14 regional referral
hospital logisticians, 20 partner
logistics advisors, 5 regional TB
supervisors, and 25 NMS
customer care staff. The first
bimonthly TWOS report was
issued in Q16. The system will
be transitioned to NTLP in
Year 5
IR 3.4
Fund and disseminate results of
two end-user verification (EUV)
surveys (# 7 and 8)
We conducted two EUV
surveys and disseminated
results to President’s Malaria
Initiative and other
stakeholders
IR 1.2, IR 1.3
Complete development of the
electronic Lab SPARS reporting
system, train all Lab SPARS
supervisors, supply motorcycles,
computers and modems and
support implementation of Lab
SPARS in 20 pilot districts
We implemented the e-Lab
SPARS reporting system,
trained and equipped 42 Lab
SPARS supervisors, and
supported 1,258 facility
supervisory visits; 51% of the
292 pilot facilities have been
visited at least 5 times. The
average facility performance
score improved from 49% at
baseline 79% at 5th visit
IR 3.4
Train Uganda National Health
Laboratory Services staff on Lab
SPARS system and integrate
system into the laboratory
logistics management
information system
Lab SPARS tools have been
integrated into the logistics
management information
system. We will train Uganda
National Health Laboratory
Services staff on the system in
Year 5
IR 3.4
19
Activity Result
Areas
Summary of planned
activities in work plan for
the reporting year
Actual key activities/tasks
conducted during the year
Link to CDCS 1
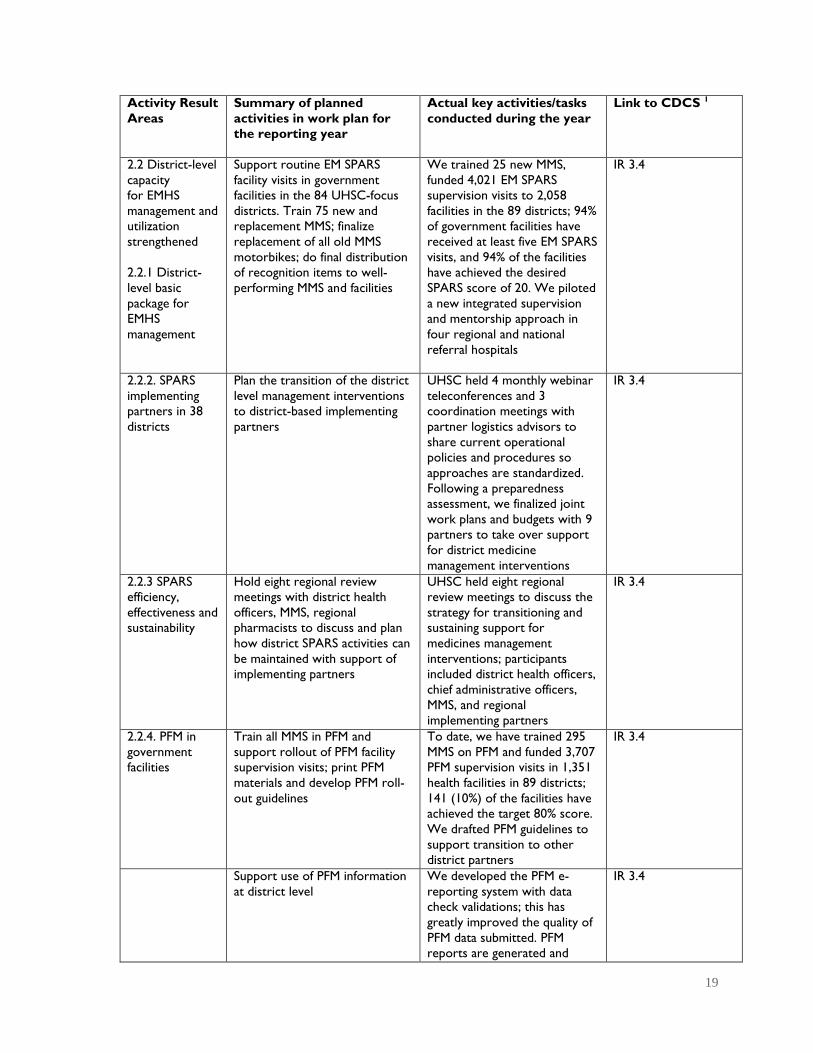
2.2 District-level
capacity
for EMHS
management and
utilization
strengthened
2.2.1 District-
level basic
package for
EMHS
management
Support routine EM SPARS
facility visits in government
facilities in the 84 UHSC-focus
districts. Train 75 new and
replacement MMS; finalize
replacement of all old MMS
motorbikes; do final distribution
of recognition items to well-
performing MMS and facilities
We trained 25 new MMS,
funded 4,021 EM SPARS
supervision visits to 2,058
facilities in the 89 districts; 94%
of government facilities have
received at least five EM SPARS
visits, and 94% of the facilities
have achieved the desired
SPARS score of 20. We piloted
a new integrated supervision
and mentorship approach in
four regional and national
referral hospitals
IR 3.4
2.2.2. SPARS
implementing
partners in 38
districts
Plan the transition of the district
level management interventions
to district-based implementing
partners
UHSC held 4 monthly webinar
teleconferences and 3
coordination meetings with
partner logistics advisors to
share current operational
policies and procedures so
approaches are standardized.
Following a preparedness
assessment, we finalized joint
work plans and budgets with 9
partners to take over support
for district medicine
management interventions
IR 3.4
2.2.3 SPARS
efficiency,
effectiveness and
sustainability
Hold eight regional review
meetings with district health
officers, MMS, regional
pharmacists to discuss and plan
how district SPARS activities can
be maintained with support of
implementing partners
UHSC held eight regional
review meetings to discuss the
strategy for transitioning and
sustaining support for
medicines management
interventions; participants
included district health officers,
chief administrative officers,
MMS, and regional
implementing partners
IR 3.4
2.2.4. PFM in
government
facilities
Train all MMS in PFM and
support rollout of PFM facility
supervision visits; print PFM
materials and develop PFM roll-
out guidelines
To date, we have trained 295
MMS on PFM and funded 3,707
PFM supervision visits in 1,351
health facilities in 89 districts;
141 (10%) of the facilities have
achieved the target 80% score.
We drafted PFM guidelines to
support transition to other
district partners
IR 3.4
Support use of PFM information
at district level
We developed the PFM e-
reporting system with data
check validations; this has
greatly improved the quality of
PFM data submitted. PFM
reports are generated and
IR 3.4

20
Activity Result
Areas
Summary of planned
activities in work plan for
the reporting year
Actual key activities/tasks
conducted during the year
Link to CDCS 1
shared with district health
officials and MMS in regional
review meetings and district
monthly meetings
2.2.5
Appropriate
medicines use
Support the Appropriate
Medicines Use (AMU) unit to
strengthen and coordinate the
AMU advisory group
UHSC staff at the AMU unit
and the Pharmacy Department
obtained MoH approval to
appoint the AMU advisory
group. Our staff led the
antimicrobial consumption and
use steering group and
contributed to the
development the national
antimicrobial resistance
national action plan
IR 3.4
Distribute the Uganda Clinical
Guidelines 2016 and Essential
Medicines and Health Supplies List
of Uganda 2016 to all facilities
We printed and distributed to
all public and PNFP facilities
40,000 copies of the Uganda
Clinical Guidelines 2016 and
10,000 copies of the Essential
Medicines and Health Supplies
List of Uganda 2016
IR 3.4
Train staff of pilot hospital
medicines and therapeutics
committees (MTCs) and assist
them to carry out AMU
research in their facilities
We trained 114 staff of 7
hospital MTCs on AMU
principles and investigation
methods. We held a national
stakeholders meeting to
present results of MTC
interventions and our draft
national MTC guidelines on
how to scale up support for
MTCs
IR 3.4
Collect and analyze
consumption data of artemisinin-
based combination therapies and
artesunate to determine possible
misuse of resources by facilities
UHSC conducted a study to
triangulate data on reported
malaria cases and commodity
use which revealed
discrepancies between
commodity consumption and
malaria cases that could be due
to leakage or wastage. Data
from a follow-up field study will
be analyzed and presented in
Year 5
IR 1.2, IR 1.3
IR 2.3 Country
capacity to
manage EMHS
enhanced
through pre-
service
education
Provide computers to four
pharmacy and pharmacy
technician schools to support
preservice training of staff and
students on RxSolution
In Q14, we provided 17
computers with accessories to
four pharmacy training schools
in Makerere University,
Mbarara University, Kampala
International University,
Uganda Institute of Allied
Health and Management
Sciences
IR 3.4

21
Activity Result
Areas
Summary of planned
activities in work plan for
the reporting year
Actual key activities/tasks
conducted during the year
Link to CDCS 1
IR 3.1 Increased
access to
RMNCAH
commodities
Complete pilot of standardized
community supply chain
management procedures and
tools and conduct end-line
assessment
In 5 pilot districts, we trained
18 national trainers, 539
community health workers, 52
health facility staff members,
and 28 district health team
members to implement the
standardized community
logistics management tools and
procedures. Results of the pilot
assessment were disseminated
in a stakeholder meeting. Scale
up began in one district, 16
more planned.
IR 2, IR 2.1
Finalize the community SCM
training materials and tools,
develop an implementation
manual, and integrate the SCM
record and report forms into
the HMIS during the 2019
revision exercise
UHSC drafted the community
SCM training module to include
in the iCCM curriculum. The
MoH approved the integration
of the community SCM tools in
the HMIS and donor partners
have adopted the tools and
procedures for use in iCCM
districts
IR 2, IR 2.1
Support the development of a
summary report with key
community health logistics data
indicators for central level use
As a result of UHSC efforts,
facility iCCM commodity stock
status reports are included in
all iCCM technical working
group meetings. We
conducted a data quality
assessment on RMNCAH
facility data reported in HMIS
105 reports (45% are complete
and accurate); we prepared 4
USAID procurement planning
and monitoring reports for
contraceptives
IR 2, IR 2.1
Support procurement and supply
management for scale up of
iCCM program
During the year, UHSC assisted
the MoH and donor partners in
monitoring and coordinating
the supply planning and
distribution of iCCM
commodities to facilities in 34
districts
IR 2, IR 2.1
IR 4.1
Strengthen
national capacity
to manage
HIV/AIDS
commodities
Support the rollout of
tenofovir/lamivudine/dolutegravir
(TLD) as a new first-line
treatment regimen
Our QPPU staff quantified
national TLD requirements,
developed the transition plan
and contributed to the ART
guidelines addendum for TLD.
In Year 4, UHSC helped the
MoH to mobilize more than
$80 million to fill the public
sector funding gap for HIV
commodities in 2018-2019
IR 1.2, IR 1.3

22
Activity Result
Areas
Summary of planned
activities in work plan for
the reporting year
Actual key activities/tasks
conducted during the year
Link to CDCS 1
Support NMS to develop an
appropriate fee schedule for
services
We funded two NMS staff
members to participate in a
central warehouse study tour
in Lesotho and South Africa
IR 1.2, IR 1.3
Continue supporting the smooth
functioning of the web-based
antiretroviral ordering and
reporting system (WAOS) and
data quality improvements
UHSC trained all 122
biostatisticians on the use of
the upgraded WAOS form
IR 1.2, IR 1.3
IR 4.2
Strengthen
district and
health facility
capacity to
manage
HIV/AIDS
commodities
Roll out ART SPARS to all 118
districts, prioritizing districts
with the 63 high-volume ART
facilities
319 MMS (71%) have been
trained in ART SPARS, and 438
facilities have been supervised
at least once. The average
facility performance score
improved from 12% at baseline
visit to average of 52% at visit
4; 27% have achieved the target
80% performance score
IR 1.2, IR 1.3
Develop and implement tools
and procedures to improve
stock visibility and monitoring of
ART commodities at facility level
We developed and
implemented two new tools
and a third is under
development:
− Bimonthly order delivery
analysis
− weekly MMS ART stock
status report
− Instant notification of stock
outs and overstocks using
Mtrac
We printed and distributed
5,000 revised dispensing logs,
3,000 supervision report
books, 2,000 supervision tool
books, 2,600 plastic spider
graphs, stock cards, and stock
books. ART registers were
procured and are being
distributed
IR 1.2, IR 1.3
4.2.2 Scale-up of
facility electronic
pharmaceutical
logistics
management
system
Roll out RxSolution in 63 high
priority facilities
We have installed RxSolution in
60 of the 63 priority ART sites.
The remaining three sites are
military hospitals, and we could
not get clearance for the
installation
IR 1.2, IR 1.3
Improve RxSolution data quality
and use at all levels
We completed a standardized
product catalog of 1,000+
items, revised RxSolution
reports to support facility work
requirements, and setup PIP to
automatically upload facility
stock status reports from
IR 1.2, IR 1.3

23
Activity Result
Areas
Summary of planned
activities in work plan for
the reporting year
Actual key activities/tasks
conducted during the year
Link to CDCS 1
RxSolution. We also
successfully tested electronic
ordering between 10 PNFP
facilities with RxSolution and
JMS and trained 27 clinicians
from 5 hospitals on the
RxSolution dispensing module
in preparation for piloting of
electronic dispensing
Expand the role and capacity of
counterparts to support and
supervise the use of RxSolution
In collaboration with
implementing partners, we
trained 107 people as
RxSolution trainers and 226
health facility staff. We
developed an RxSolution
eLearning course for partners
IR 1.2, IR 1.3
IR 4.3 Expand
and improve
storage facilities
in selected sites
Complete the construction of 26
storage units
Although we planned to
construct 26 sites, we could
only initiate construction in 5
sites because the procurement
process and obtaining USAID
approvals took much longer
than we anticipated
IR 1.2, IR 1.3
IR 5 Strengthen
national supply
chain for
outbreak and
epidemic
preparedness
Respond to USAID request to
expand UHSC’s original scope of
work and revise Year 4 work
plan to include this new result
area
USAID approved our expanded
scope of work at the end of
June. We finalized Y4 and Y5
work plans with input from the
One Health Platform members.
As a new member of the
national Ebola task force, we
successfully advocated to
establish a logistics
subcommittee. We assisted in
quantifying supplies needed by
the country in preparedness
and response to the Ebola
outbreak in the Democratic
Republic of Congo
IR 1.2, IR 1.3
2.3 Progress Narrative

24
We successfully completed our Year 4 priority work activities and expanded our original
scope of work at USAID’s request to include two new result areas (4 and 5).
In the policy arena, after almost two years of trying, we succeeded in getting the MoH to
officially establish a task force to make decisions about changing the outdated and inequitable
formula for allocating funds for EMHS to government health facilities. At a meeting in
September 2018, participants agreed on the elements of a new more equitable formula. The
next steps with the MoH task force will be a priority in the coming months. Based on the
promising results of the complementary ‘push-pull’ transition pilot study, many other
stakeholders have reached consensus on a needs-based approach to supplying EMHS.
The first year performance of the Government of Uganda-funded EMHS credit line for PNFP
facilities at JMS has been outstanding. Set up and implemented with UHSC assistance, JMS
supplied 7.5 billion shillings’ worth of EMHS to 535 facilities ensuring all have a basic supply of
vital health commodities. JMS exceeded the annual targets by fulfilling 99% of ordered items
and delivering 97% of orders on time. Facilities, many of whom had never ordered by a set
schedule, also stepped up with 97% submitting their orders on time to JMS. This smooth
implementation is the result of 12 months of detailed planning and continued collaboration of
a working group made up of members from JMS, MoH, medical bureaus, UHSC, and the
Kampala City Council Authority.
We wrapped up five important facility-level pilot interventions that will inform future
pharmaceutical system strengthening policies and efforts. In collaboration with our Harvard
partner, impact studies were completed for three of the interventions (‘push-pull’ transition,
Lab SPARS, TB SPARS) and an assessment of the pilot study of community supply chain
management tools. The results of the evaluations were presented in different meetings to
several hundred national and district stakeholders for discussion and scale-up planning. Scale
up of the community supply chain management tools has already begun in one district and is
planned for another 16 iCCM districts.
Although we experienced some delays to be able to amend the contract of our training
provider, Makerere University, we nevertheless quickly scaled up our district-level ART
SPARS and PFM interventions in government health facilities. The 148 MMS trained on ART
SPARS have made one or more supervisory visits to 663 of the 830 ART sites (77%), and
already 27% of the supervised facilities have achieved the target score of 80%, which is a
major improvement compared to the average facility score of less than 12% at baseline. The
better staff knowledge and practices will positively affect the availability of and accountability
for HIV commodities as well as the quality of data reported for central monitoring and
planning. For PFM, we exceeded all of our annual targets: PFM has been implemented in
1,351 health facilities in 89 UHSC districts, including 170 of the 178 priority high-level
facilities. So far, 141 of the supervised facilities (10%) have achieved the target 80% PFM
score. The greatest improvements were in tracking of budget allocations and expenditures
and the ordering process.
We made a concerted push this year to expand the availability, visibility, quality, and use of
supply chain data at all levels with the aim of improving accountability and decision-making.
For example, because of our new reports and dashboards in PIP, users can now get weekly
updates on ART stock in about 200 facilities or monthly updates on key tracer EMHS in
stock at central warehouses.

25
Users can also generate their own tailored reports with EM SPARS and PFM data. Because of
these new features, use of the PIP more than doubled this year to more than 25,000, with
the greatest increase by MMS. Our team was also involved in the MoH review of supply
chain-related HMIS reports and records to ensure that more and better data is available for
quantification and supply planning exercises and monitoring of pharmaceutical sector
performance.
Following our training of 114 staff of seven hospital MTCs on AMU principles and
investigation methods, the MTCs were able to carry out their own medicines use studies and
develop and implement interventions to correct inappropriate prescribing practices in the
facilities. USAID selected our success story on one MTC’s major reduction of the
unnecessary prescribing of antimalarial medicines for publication. We presented the results
of the MTC intervention in a national stakeholders meeting.
We completed the handover of the e-GPP and e-GDP servers and databases to NDA. The
NDA staff are now managing them on their own.
In preparation for our final year, we completed work plans and budgets with nine of 11
implementing partners who will take over support for district-level medicines management
interventions. The transition plans take into account an assessment of the partners’
preparedness as well as district details to ensure as smooth a transition as possible. The
transition is expected to be completed by May 2019.
We undertook the procurement, selection and contracting of a construction company to
build 26 prefabricated medicines storage units in 20 districts across Uganda. Those units will
improve the storage capacity of health centers that are managing high volumes of HIV
patients and thus need to store large quantities of medicines and health supplies. Because we
underestimated the time it would take to complete the procurement process and obtain
USAID approvals for construction, by the end of Year 4 we had only initiated the
construction of an initial set of 5 units.
We also were off track in the scale up of PFM in PNFP facilities. As mentioned above, the
timeline to amend our contract with Makerere University, our PFM training provider, took
longer than we had originally planned. Because of the delay, Makerere was able to train only
46 of the active 85 MB MMS and JMS technical representatives. With less than half of the
needed MMS, we could only achieve 33% of our annual target of 600 PFM supervision visits.

26
2.3 Partnership, Collaboration, and Stakeholder Engagement
The highly successful first year of implementation of the EMHS credit line for PNFP facilities at JMS is
due to the collaborative partnership between the MoH, JMS, four faith-based medical bureaus,
diocese representatives, Kampala City Council Authority, and UHSC. All of the Government of
Uganda funds (7.4 billion shillings) were expended; 97% of the 600 eligible facilities adhered to order
schedules, and JMS delivered 97% of facility orders on time and fulfilled 99% of the items ordered by
facilities, which exceeded the annual targets. Our establishment of a public-private partnership between the NDA and pharmaceutical
wholesalers accelerated the smooth implementation of Good Distribution Practice standards; 484 of
the private sector suppliers passed NDA inspections and were licensed to operate in 2018. NDA
will use this approach to introduce future regulations. A diverse task force set up by UHSC completed the design and pilot of standardized community
supply chain tools, procedures, and training materials in five districts with the aim of increasing
access to lifesaving maternal and child health commodities among hard-to-reach communities. The
task force, led by the Pharmacy Department, brought together the skills and experience of
representatives of three MoH departments; child health organizations (UNICEF, Save the Children,
And Malaria Action Program for Districts); reproductive health organizations (FHI 360 and Path);
and health service partners (RHITES-SW). Over the past 18 months, we worked together to train
and supervise hundreds of health facility staff and village health team workers to assess the
acceptability and effectiveness of the new tools and procedures in increasing the availability and
accountability of commodities used in iCCM and family planning programs operating at the
community level. We collaborated with implementing partners funded by USAID and the US Centers for Disease
Control and Prevention to strengthen RxSolution use through joint support supervision visits in
Eastern Uganda with RHITES-E and TASO, IDI in the Western region, and Mildmay and IDI in the
Central region. We also conducted a training of trainers’ course with RHITES-ACHOLI in the
North and collaborated with RHSP, MAUL, UPMB, and MUWRP to train new RxSolution health
facility users.
27
2.4 Learning and Adaptation
With our Harvard partners, we published two articles in the Journal of Pharmaceutical Policy and
Practice, “Longitudinal study assessing the one-year effects of supervision performance assessment
and recognition strategy to improve medicines management in Uganda health facilities" and
“Competency in supportive supervision: A study of public sector medicines management supervisors
in Uganda.” We also contributed a chapter, “Improving Access to High Cost Medicines in Low
Income Countries in Africa: Creating a Functioning Pharmaceutical System in Uganda,” to a book on
equitable access to high-cost pharmaceuticals.
This year, we assessed the impact and effectiveness of five UHSC-designed interventions and
disseminated the results and lessons learned through national stakeholder meetings. The
interventions include the push-pull supply system for lower-level health facilities, implementation of
TB SPARS and Lab SPARS in selected districts, the revitalization of MTCs in hospitals, and the
standardized community supply chain procedures and tools. Hundreds of stakeholders participated
in the learning opportunities.
Over the past two years we have experimented on how best to build the knowledge and skills of
MTC members in seven regional hospitals on appropriate medicines use principles and help them to
independently conduct their own investigations and devise solutions to inappropriate practices in
their facilities. The lessons we learned have resulted in a practical manual and training approach to
revitalizing MTCs that future stakeholders can use.
We returned to JMS this year to follow up on whether key recommendations made by three UHSC
consultants in 2014-2016 had been implemented and what impact our assistance had. We learned
that 1) JMS had implemented 83% of the 60 UHSC consultant recommendations and that this
assistance directly and substantially improved JMS business, financial, and operational performance;
2) JMS is a responsive, responsible counterpart, making our investments to strengthen their
capabilities very worthwhile; and 3) conducting this kind of systematic follow up is a valuable
exercise.
We could see that only a small proportion of facilities with RxSolution were routinely updating and
submitting their stock data to the central level. To figure out a way to address the issue, we
established an internal task force with information technology, logistics management, and AMU staff
to bring different perspectives on how we could make RxSolution data more used and useful to
facilities and central level managers. The task force visited facilities to get feedback from RxSolution
users and on that basis, developed a much smaller set of RxSolution reports that are specifically
tailored to the work needs of facility staff and managers. We subsequently piloted the reports in
seven facilities; users were enthusiastic about the changes—especially the automated generation of
the HMIS 105 monthly stock report, ART weekly stock status report, and list of short-dated and
excess items to redistribute. The task force will continue working to increase use of RxSolution data
and implement the new RxSolution package in all sites countrywide.
Integrated RRH – Anthony to give more information on how this new approach worked
DQA of RMNCAH data – Eric to provide more information
28
2.5 Inclusive Development
UHSC’s overall mandate is to increase the availability, affordability, accessibility, and appropriate
use of good quality EMHS for all citizens, and as such, UHSC activities are inclusive by nature. It is
worth noting that UHSC’s focus is on systems and not diseases; this means that we aim to
strengthen systems that can handle any type of health-related commodity. This ensures that all
categories of citizens—women, youth, elderly, and other vulnerable populations—can find the
commodities that they need for the prevention, treatment, and care of conditions likely to affect
them. Our community-based activities aim to improve EMHS access for harder-to-reach
populations, as not all citizens are able to seek services at a health center.
This year, we worked closely with the AIDS Control Program, National Advisory Committee,
development partners, and a civil society group, Women Living with HIV, to resolve an issue
regarding access to the new antiretroviral regimen (DTG) that Uganda has adopted as a preferred
first-line ART regimen: preliminary results from a Botswana study showed an increased risk of
neural tube defects in babies born to women taking DTG. At this year’s International AIDS
Conference, most, if not all, African countries had decided to exclude women of reproductive age
from using DTG; countries are waiting for further communication from the World Health
Organization in March 2019 on the issue. In the meantime, the Ugandan Women Living with HIV
group insisted that all women need to be given a choice on whether to use DTG, because it has
fewer side effects than efavirenz in the current regiment. We worked with the AIDS Control
Program to develop standard operating procedures to guide health workers on how to
implement the agreed solution, which is to obtain informed consent should a woman of
reproductive age choose to use DTG.
29
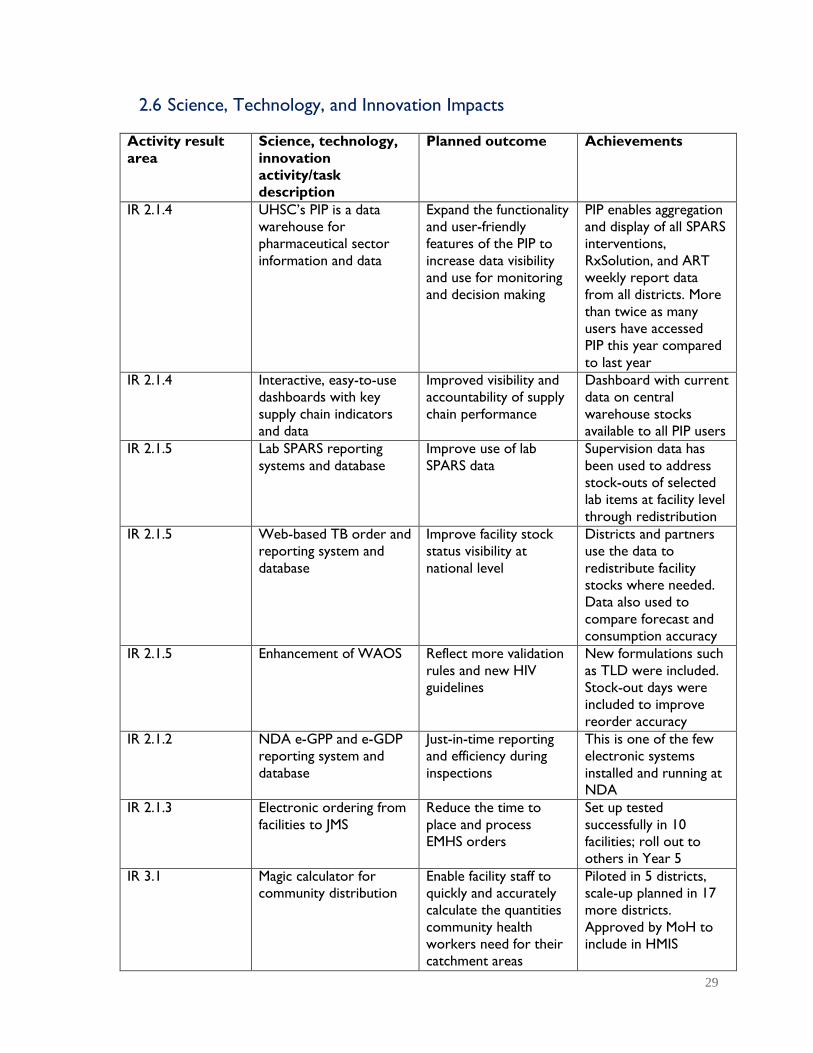
2.6 Science, Technology, and Innovation Impacts
Activity result
area
Science, technology,
innovation
activity/task
description
Planned outcome Achievements
IR 2.1.4 UHSC’s PIP is a data
warehouse for
pharmaceutical sector
information and data
Expand the functionality
and user-friendly
features of the PIP to
increase data visibility
and use for monitoring
and decision making
PIP enables aggregation
and display of all SPARS
interventions,
RxSolution, and ART
weekly report data
from all districts. More
than twice as many
users have accessed
PIP this year compared
to last year
IR 2.1.4 Interactive, easy-to-use
dashboards with key
supply chain indicators
and data
Improved visibility and
accountability of supply
chain performance
Dashboard with current
data on central
warehouse stocks
available to all PIP users
IR 2.1.5 Lab SPARS reporting
systems and database
Improve use of lab
SPARS data
Supervision data has
been used to address
stock-outs of selected
lab items at facility level
through redistribution
IR 2.1.5 Web-based TB order and
reporting system and
database
Improve facility stock
status visibility at
national level
Districts and partners
use the data to
redistribute facility
stocks where needed.
Data also used to
compare forecast and
consumption accuracy
IR 2.1.5 Enhancement of WAOS
Reflect more validation
rules and new HIV
guidelines
New formulations such
as TLD were included.
Stock-out days were
included to improve
reorder accuracy
IR 2.1.2 NDA e-GPP and e-GDP
reporting system and
database
Just-in-time reporting
and efficiency during
inspections
This is one of the few
electronic systems
installed and running at
NDA
IR 2.1.3 Electronic ordering from
facilities to JMS
Reduce the time to
place and process
EMHS orders
Set up tested
successfully in 10
facilities; roll out to
others in Year 5
IR 3.1 Magic calculator for
community distribution
Enable facility staff to
quickly and accurately
calculate the quantities
community health
workers need for their
catchment areas
Piloted in 5 districts,
scale-up planned in 17
more districts.
Approved by MoH to
include in HMIS
30
2.7 Transparency and Accountability
UHSC conducted a study to triangulate central and regional data on reported malaria cases and
commodity use, which revealed discrepancies between commodity consumption and malaria cases
that could be due to poor reporting practices, inappropriate use, or leakage. In Year 5, UHSC will
complete a field assessment to identify the main causes of the discrepancies and develop
approaches to address the problems.
Together with the Pharmacy Department, we closed an accountability gap by revising the existing
HMIS facility dispensing log, so that pharmacy dispensers have to record details of what they
receive and dispense to clients. Our ART SPARS performance assessment tool also includes
indicators on how well a facility can trace and account for commodities from receipt to when
they are dispensed to clients.
Our WAOS team now calculates and routinely reports on ARV order fulfillment rates by the
three central warehouses, making their performance visible to all stakeholders.
Our PFM program has enabled 1,499 government and PNFP health facilities to track their EMHS
expenditures and balances owed by NMS across the year, which helps them manage their budgets
more efficiently and empowers them to demand the full budget amount allocated to them.
The EMHS credit line for PNFPs brought 100% visibility and accountability to how Government of
Uganda primary health care funds are spent in the PNFP sector. Prior to establishing the credit
line at JMS, it was estimated that PNFPs spent 35% of their primary health care funds allocated for
procuring EMHS on other things; in addition, no controls were in place to ensure good product
quality or good value for money.

31
3.0 LEADERSHIP DEVELOPMENT
UHSC does not have activities related to leadership development so this section is not
applicable.
Leadership development
activity/task
Planned outcome for the
reporting year
Indications/examples
results
4.0 ENVIRONMENTAL COMPLIANCE
5.0 AWARD-SPECIFIC REPORTING
REQUIREMENTS
UHSC completed all the required compliance steps to construct 26 prefabricated storage units at
selected high-volume ART sites. Environmental monitoring and mitigation plans were developed and
approved by USAID. The mitigation actions included the site not exceeding 150 meters, fertile soil
being retained, and construction undertaken in a manner that does not negatively impact the
environment and communities. We will assure that the construction fully complies with
Government of Uganda and USAID environmental regulations and standards.
UHSC submits routine reports as required through the performance reporting system, TRAINET,
VAT reporting, and Hybrid DATIM. We will also report as required through the separate GHSA
work plan and reporting mechanisms.
32
6.0 ACTIVITY MEL PLAN UPDATE
UHSC revised its activity monitoring, evaluation, and learning plan (AMELP) to align with the new
CDCS 2016–2021 and its performance monitoring plan, which includes a new indicator for guiding
principles. Two award modifications—IR 4 Supporting scale up of Uganda’s HIV/AIDS response and
IR 5 Strengthen supply chain capacity to respond to public health emergencies—were made in Year
4. Indicators for IR 3, IR 4, and IR 5 have been added to our AMELP. UHSC falls under DO 3 Market
Systems but we have not yet received the indicators.
In Year 4, UHSC had a set of learning agendas to assess the impact and effectiveness of five UHSC-
designed interventions, including push-pull supply system for lower-level health facilities,
implementation of TB SPARS and Lab SPARS in pilot districts, the revitalization of MTCs in hospitals,
and the standardized community supply chain procedures and tools. We are using the findings from
the learning products to inform the improvement and scale up of medicines management
interventions in the country.

33
7.0 SUMMARY FINANCIAL MANAGEMENT
REPORT

34
8.0 MANAGEMENT AND ADMINISTRATIVE
ISSUES
8.1 Key management issues
8.2 Resolved management issues
Two key personnel left UHSC this year. The Supply Chain System Specialist position was filled with
an existing UHSC employee. The second position, Senior Technical Advisor-Health Financing,
became vacant at the end of August 2018. Given that UHSC is entering its last year, and in light of
both activities planned for the coming year as well as budget constraints, we have proposed to not
fill this position in Year 5.
No issues were raised in the last report.

35
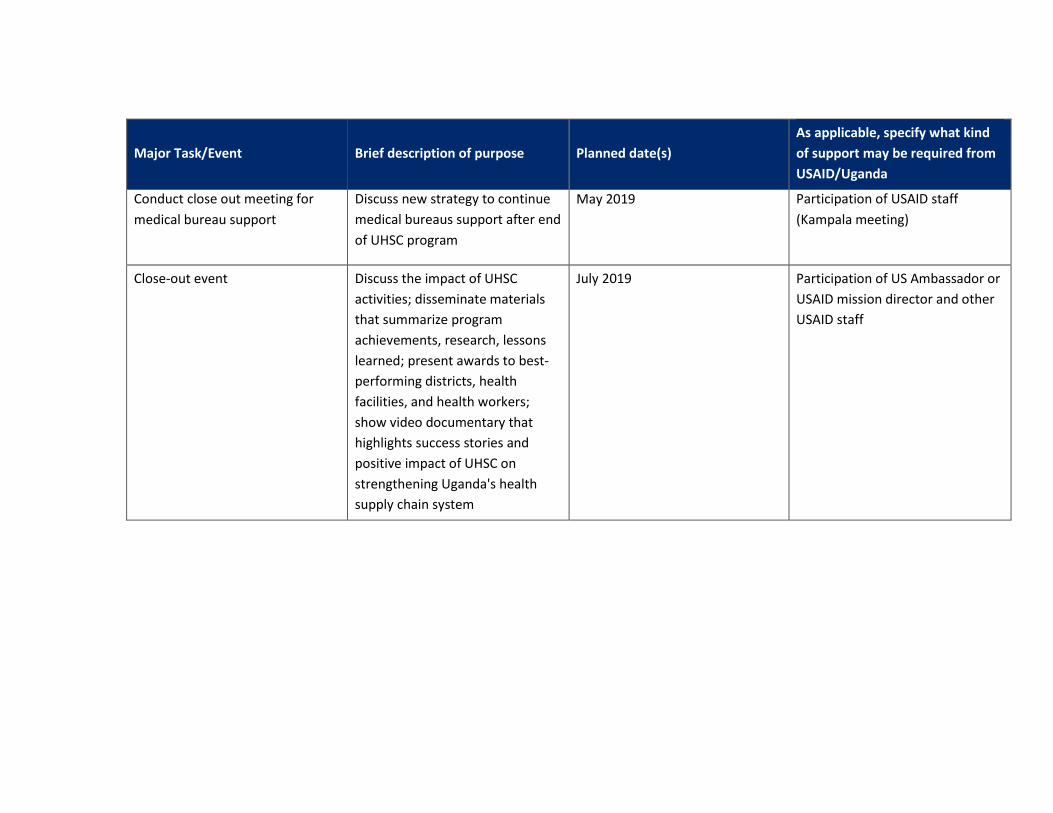
9.0 PLANNED ACTIVITIES FOR NEXT YEAR INCLUDING UPCOMING EVENTS
Major Task/Event Brief description of purpose Planned date(s)
As applicable, specify what kind
of support may be required from
USAID/Uganda
Approval to construct 21
prefabricated medicines storage
units
After learning from the first five
structures constructed, UHSC will
move forward with construction of
21 additional units
October 2018 AOR approval
Hand-over of medicines stores National event to hand over 26
prefabricated medicines stores to
MoH/ district governments
February 2019 Participation of US Ambassador or
USAID mission director
Medicines infrastructure
conference
Disseminate findings from a
national stores infrastructure
assessment highlighting the
current gap to advocate for donor
support
March 2019
MTC conference Disseminate progress and results
of MTC revitalization intervention
April 2019
Regional review meetings Discuss the UHSC district support
milestones reached and the new
support strategy in place for
continuation
November 2018
36
Major Task/Event Brief description of purpose Planned date(s)
As applicable, specify what kind
of support may be required from
USAID/Uganda
Conduct close out meeting for
medical bureau support
Discuss new strategy to continue
medical bureaus support after end
of UHSC program
May 2019 Participation of USAID staff
(Kampala meeting)
Close-out event Discuss the impact of UHSC
activities; disseminate materials
that summarize program
achievements, research, lessons
learned; present awards to best-
performing districts, health
facilities, and health workers;
show video documentary that
highlights success stories and
positive impact of UHSC on
strengthening Uganda's health
supply chain system
July 2019 Participation of US Ambassador or
USAID mission director and other
USAID staff

37
10.0 ANNEXES
10.1 USAID/Uganda Activity Work Plan Table
USAID/Uganda Performance Analysis Table
CDCS Links Results Disaggregation
Baseline
data
value
FY 2017
Annual
actual
FY 2018
Annual
target
Results Area 1: National policies developed and implemented to improve EMHS affordability, availability and
accessibility in alignment to national health goals
IR 3.4
Numbers of policies completing
each process/step of development as
a result of USG assistance.
Analysis - 6
5
Stakeholder consultation - 4
5
Drafting - 3
5
Approval - 3
4
Implementation - 3
4
Result Area 2: Country systems to effectively and sustainably manage EMHS strengthened at all levels in public and
PNFP sector
IR 3.4
Percentage availability of supplies for a basket of 41 medicines and
health supplies in last 3 months at
NMS and JMS
EMHS - 68%
75%
ARVs - 67%
75%
TB - 73%
75%
LAB - 59%
75%
RMNCH - 66%
75%
IR 3.4
Average percentage availability of a
basket of 41 commodities based on
all reporting facilities in the previous
quarter
EMHS - 86%
89%
ARVs - 82%
89%
TB - 79%
89%
LAB 84%
89%
RMNCH - 83%
89%
Sub-IR 2.1: Central level systems for EMHS management enhanced
IR 3.4
Number of wholesalers licensed
according to the new GDP
guidelines developed
0
497
350
IR 3.4
Number of government and PNFP
health facility pharmacies inspected
for GPP
Government 797 1363
1500
PNFP 142 255
500
IR 3.4 Government 54% 55%
60%

38
USAID/Uganda Performance Analysis Table
CDCS Links Results Disaggregation
Baseline
data
value
FY 2017
Annual
actual
FY 2018
Annual
target
Percentage of government and
PNFP health facility pharmacies
certified according to GPP
PNFP 59%
64%
65%
IR 3.4
Number of facilities with a
computerized functional Logistics
Management Information System
(Total number of Hospitals/HC4)
Government 28 18
45
PNFP 15 12 40
IR 3.4 Number of health workers trained
in electronic stock management Gender -
401 662
IR 3.4
IR 3.4
Number of individuals trained to
conduct supply chain, inventory
management, and supportive
supervision.
Supportive supervision 0 291
455
Medicines Management 0 146
150
PFM 0 245
325
IR 3.4 Percentage of facilities with a
SPARS score of 20 and above
Government 41% 68%
60%
PNFP 35% 50%
50%
IR 3.4 Percentage of order based facilities
with a PFM score of 80% and above
Hospitals 63% 17%
50%
HC4 51%
25%
50%
IR 3.4
Average percentage of cases of priority diseases treated in
compliance with standard treatment
guidelines in reporting period
Malaria 70% 85%
70%
Upper respiratory tract
infection 41%
51%
70%
Diarrhea 45% 66%
70%
Result Area 3: Increased availability and accountability of RMNCH commodities among priority populations
IR 2.1 Percentage of health facilities
submitting a quarterly iCCM report 10%
12%
40%
Sub-IR 2.1.2
Average stock out rate of
contraceptive commodities at family
planning service delivery points
Depo-Provera 20%
0%
Implanon -
0%
Result Area 4: Supporting scale up of Uganda’s HIV/AIDS response
IR 1.2, IR 1.3 The percentage of ART sites
initiated on ART SPARS
Government 0% -
50%
PNFP 0% -
50%

39
USAID/Uganda Performance Analysis Table
CDCS Links Results Disaggregation
Baseline
data
value
FY 2017
Annual
actual
FY 2018
Annual
target
IR 1.2, IR 1.3 Percentage of facilities scoring at
least 80% of the maximum ART
SPARS score
Government 0% -
50%
PNFP 0% -
50%
IR 1.2, IR 1.3 Average percentage availability of a
basket of ART commodities in the
last three months
Government 90% -
93%
PNFP 90% -
93%
IR 1.2, IR 1.3
Percentage of facilities with
accurate orders
Government 0% -
50%
PNFP 0% -
50%
IR 1.2, IR 1.3
Percentage of facilities with
traceability of first line ARVs
Government 0% -
50%
PNFP 0% -
50%
Result 5: Strengthen supply chain systems to respond to public health emergencies
IR 5.1 Support customization of the Global Health Security Agenda (GHSA) framework for Uganda context
IR 5.1.1 Establish a national stockpile strategy
A national stockpile strategy of
medical countermeasures for use
during a public health emergency in
place
- -
5.1.2 Establish a national public health emergencies supply chain coordination mechanism
Number of procedures and
memorandum of understanding for
transferring (sending and receiving)
and coordinating the supply of
medical countermeasures during
public health emergencies
- -
IR5.1.3 Adapt logistics management information systems for emergency response
Presence of an emergency
electronic logistics management
information system
- -
IR5.1.4 strengthen capacity of supply chain systems and actors for public health emergency
preparedness
Number of individuals trained in
supply chain related to sending and
receiving medical countermeasures
during public health emergency
- -
IR 5.2 Conduct simulations to test the GHSA frame work adapted for Uganda
Presence of simulation plan and
schedule
- -
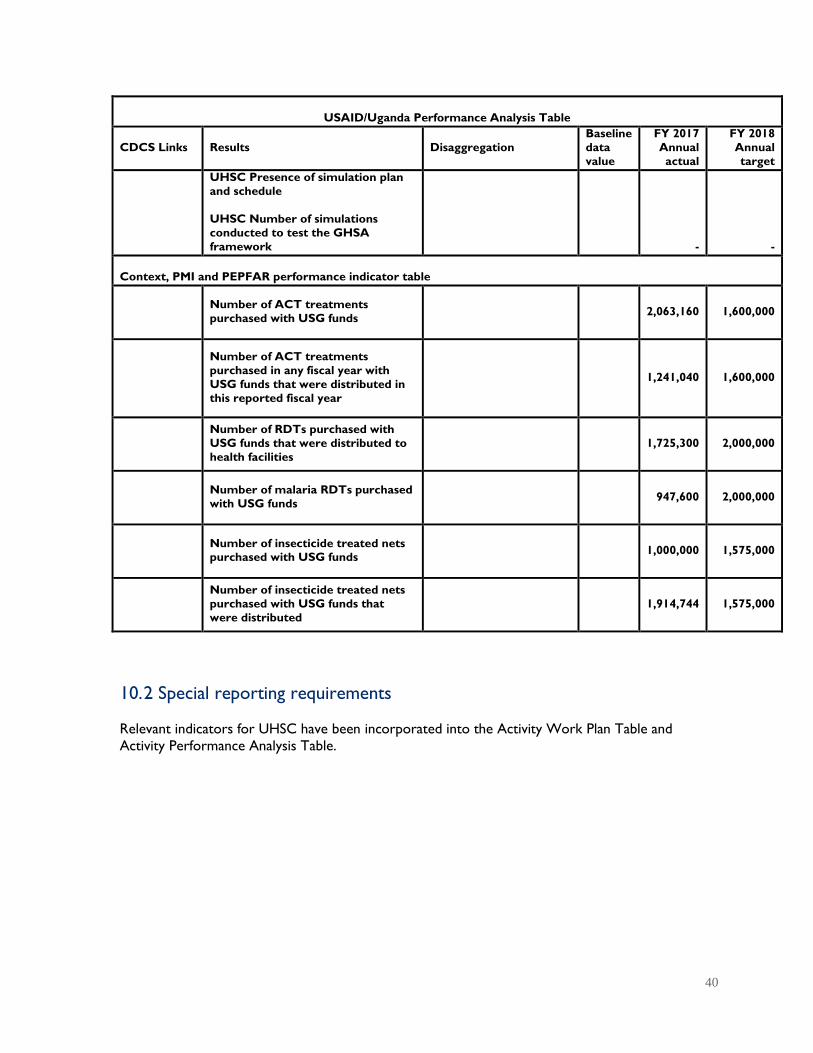
40
USAID/Uganda Performance Analysis Table
CDCS Links Results Disaggregation
Baseline
data
value
FY 2017
Annual
actual
FY 2018
Annual
target
UHSC Presence of simulation plan
and schedule
UHSC Number of simulations
conducted to test the GHSA
framework
- -
Context, PMI and PEPFAR performance indicator table
Number of ACT treatments
purchased with USG funds 2,063,160 1,600,000
Number of ACT treatments
purchased in any fiscal year with
USG funds that were distributed in
this reported fiscal year
1,241,040 1,600,000
Number of RDTs purchased with
USG funds that were distributed to
health facilities
1,725,300 2,000,000
Number of malaria RDTs purchased
with USG funds 947,600 2,000,000
Number of insecticide treated nets purchased with USG funds
1,000,000 1,575,000
Number of insecticide treated nets
purchased with USG funds that
were distributed
1,914,744 1,575,000
10. 2 Special reporting requirements
Relevant indicators for UHSC have been incorporated into the Activity Work Plan Table and
Activity Performance Analysis Table.

41
10.3 Success story
Operating Unit: ____USAID/Uganda____________
Headline: Mentorship and supportive supervision improves management of laboratory commodities
Program Element: Health
Key Issues: Laboratory commodities management, evidence-based decision making
Title: No more “guesswork”: Lab staff and patients benefit from Lab SPARS
The Apapai Health Centre IV laboratory in Serere district, Eastern Uganda, is busy today with ten patients waiting
to have their lab tests taken. The laboratory technician, Samuel Oule, is confident that he has enough of the right
laboratory supplies to run tests for all the patients he will see today, a welcome change from 12 months ago when
he would have had to turn some patients away because he lacked one or more of the laboratory supplies needed.
Oule’s previous situation was common across the country. A 2016 survey of 120 laboratories found that virtually
all of them were stocked out of one or more of the supplies required to diagnosis HIV, tuberculosis, malaria and
other common diseases.
Efficient and reliable laboratory services are an essential and fundamental component of any strong and effective
health system and diagnostic testing is essential for appropriate treatment and the rational use of drugs. UHSC’s
investment in improving the appropriate management and use of laboratory commodities directly contributes to
better health outcomes and more efficient use of limited national resources.
Although a chronic funding gap for laboratory commodities is the primary reason for frequent stock outs, there are
other reasons too. “We had no systems in place. Because our stock cards were not filled out correctly, we relied
on guesswork to place our orders of laboratory items and we often ran out of supplies. Now we have enough
supplies available because we carefully track and record our commodities, know the minimum and maximum stock
levels and can plan orders and make timely requests based on actual consumption,” says Oule.
Oule’s new-found confidence is widely shared by his colleagues in the 292 health facilities that were part of the pilot
test of an intervention designed to resolve the root problems that can cause frequent stock outs. Designed by the
USAID Uganda Health Supply Chain project and Uganda National Health Laboratory Services, the pilot intervention
of the Laboratory Supervision, Performance Assessment and Recognition Strategy─Lab SPARS─ combines a
supportive supervision approach with targeted performance assessments and recognition to improve the
knowledge, skills and practices of laboratory staff in five critical areas: storage management, laboratory information
systems, ordering, receipt and recording, and equipment management.
Over the past 14 months, 42 trained district Lab SPARS supervisors assessed each facility’s performance in the five
areas every two months and worked with the lab staff to develop and implement tailored, practical action plans to
improve the facility’s weakest areas.
Sam Opio, the Lab SPARS supervisor for Apapai Health Centre IV, explains: “The purpose of the first visit was
simply to unearth the issues. We observed the lab data was incomplete, inaccurate and was not used in planning.
There were poor reorder calculations and the worst performing domain was ordering, receipt and recording. We
discussed the challenges we had identified and cleaned and rearranged the lab and store. On subsequent visits, we
reviewed the progress that had been made and encouraged the staff. The idea is that you push together with
everyone in the health facility, you can’t do it on your own.”

42
Performance has dramatically improved in all 292 pilot facilities over the five Lab SPARS supervision visits (Figure
1). These improvements are a direct result of the Lab SPARS intervention, as the performance of ‘control’
facilities—which are similar to those in the pilot study but did not receive Lab SPARS supervision visits-- did not
show improvements on any of the 27 indicators during the pilot period.
Figure 1. Average Lab SPARS performance scores of pilot facilities at Visit 1 and 5, August, 2017 –
September, 2018
The number of stock out days decreased markedly for some key laboratory supplies because staff now have the
right knowledge and skills of staff on how to correctly maintain stock cards, calculate their average monthly
consumption, and calculate the correct quantities to order.
0
2
4
6Stock management
Storagemanagement
Ordering,receipt &recording
Laboratoryequipment
Laboratoryinformation system
Visit 1
Visit 5
Laboratory technician, Samuel Oule discusses laboratory data
with the facility in-charge, Dr. Denis Omiat at Apapai HC IV,
Serere district. Photo Credit: Sheila Mwebaze

43
10.4 Special reporting requirements of Activities undertaking construction
ACTIVITY NAME:
UHSC ART-scale-up:
Construction of
medicines storage units
Start Date:
August 31, 2018
End Date:
November 30, 2018
Narrative Description of Progress Completed in Year 4, referencing the Schedule of Works:
Site name: Kangulumira HC IV. Total USD Cost: $83,886. % Completion Planned: 35%, Completion
Actual: 35%. We experienced delays in starting slab construction at Kangulumira HC IV due to issues
related to available quality of construction materials.
Site Name: Namayumba HC IV. Total USD Cost: $83,573. % Completion Planned: 35, % Completion
Actual: 25.
Site Name: Kasangati HC IV. Total USD Cost: $68,001. % Completion Planned: 35%, Completion
Actual: 35%.
Site Name: Luwunga HC IV. Total USD Cost: $83,424. % Completion Planned: 35%, Completion
Actual: 35%.
Site Name: Wakiso HC IV. Total USD Cost: USD $67,902. % Completion Planned: 35%, Completion
Actual: 35%.
This year, we obtained the following approvals: clearance from the MoH; approval for construction from
USAID, approval from USAID for Environment Monitoring and Mitigation Plans (EMMPs), approval of
drawings/designs for the awarded storage units by respective district leaders and their technical team
leads; and handing over of the sites by district leaderships. Following the bid evaluation, we contracted
Fiditidis Group of Companies (U) Limited to carry out the construction Day–to-day technical
supervision was provided by UHSC engineers. In addition, an initial monthly supervision visit was
conducted by joint teams composed of USAID/MSH/MoH/Local Government staff. During the visit, both
technical and management support were provided.
Narrative Description of Work Scheduled for Next Quarter, referencing the Schedule of
Works:
Description of Work Scheduled for Next Quarter: We plan to provide continuous supervision of
the superstructure fabrication on all the three sites of Wakiso HCIV, Luwunga Barracks HCIII, Kasangati
HCIV in Wakiso district and one site at Kangulumira HCIV in Kayunga district. We will continue
supervising the substructure construction at Namayumba HCIV in Wakiso district. Work schedule
includes: materials production (+procurement), mobilization, assemblers, erectors (electrical roof sheet
insulation), external cladding + insulation, internal wall & ceiling cladding + insulation, painting works,
hardware & security doors works, clearing /retouching while waiting for other group.