Embed Size (px)
Citation preview

UF Station ReportS-1064
2017-2018
M. A. Elzo1, R. Mateescu1, C. Carr1, D. O. Rae2, T. Scheffler1, J. Scheffler1, K. C. Jeong1, M. D. Driver1,
and J. D. Driver1
1Department of Animal Sciences, UF/IFAS, Gainesville, FL2Dept. Large Animal Clinical Sciences, College Vet. Medicine, UF, Gainesville, FL
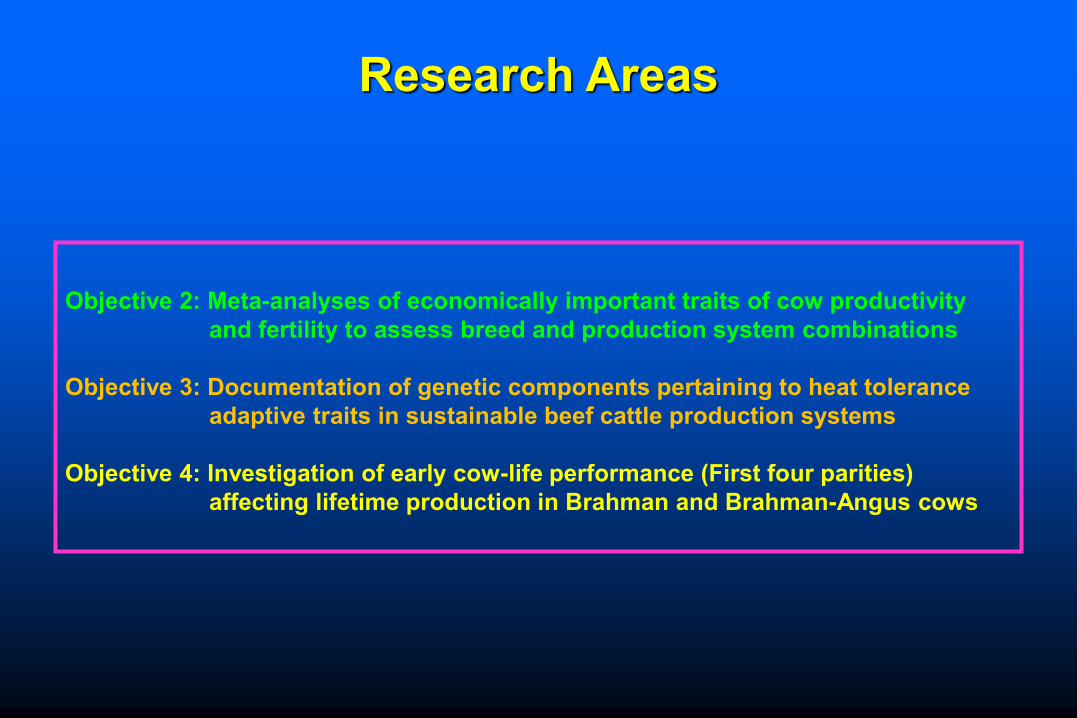
Objective 2: Meta-analyses of economically important traits of cow productivity and fertility to assess breed and production system combinations
Objective 3: Documentation of genetic components pertaining to heat tolerance adaptive traits in sustainable beef cattle production systems
Objective 4: Investigation of early cow-life performance (First four parities) affecting lifetime production in Brahman and Brahman-Angus cows
Research Areas

Objective 2 Suggested Data Collection
(1)Breed of cow, (2) Sire ID/sire breed and dam ID/dam breed of cow, (3) cow birth date, (4) Mating information (natural or artificial insemination; single or multiple sires; number of cows per bull; season or insemination date(s), (5) Predominant forage in pastures (fescue 0 = no; 1 = yes), (6) Sire/sire breed of calf, (7) Cow:bull ratio, (8) Body condition score (date and stage of production), (9) Palpation status (0 = non-pregnant; 1= pregnant), (10) Calving status (0 = no; 1 = yes), (11) Weaning status ( 0= no; 1 = yes), (12) Calving date (calving season, spring or fall), (13) Calving difficulty (1 = normal; 2 = easy pull; 3 = hard pull; 4 = caesarean section; 5 = abnormal presentation, note the abnormal presentation of calf), (14) Calf vigor issues (1 = normal; 2 = weak but nursed without assistance; 3 = weak and assisted to nurse; add any notes), (15) Calf birth weight, (16) Calf weaning date, (17) Calf weaning weight, (18) Cow temperament at calving, (19) Date of death and reason/notes for cow or her calf, and (20) Date of culling and reason/notes for cow and/or her calf leaving herd.
Objective 4 Additional Data Collection(1) Udder and teat scores, (2) Ultrasound ribeye area, fat, percent intramuscular fat between 365 and 467 days of age, (3) Carcass and meat quality traits, (4) Thermotolerance traits.
Activities
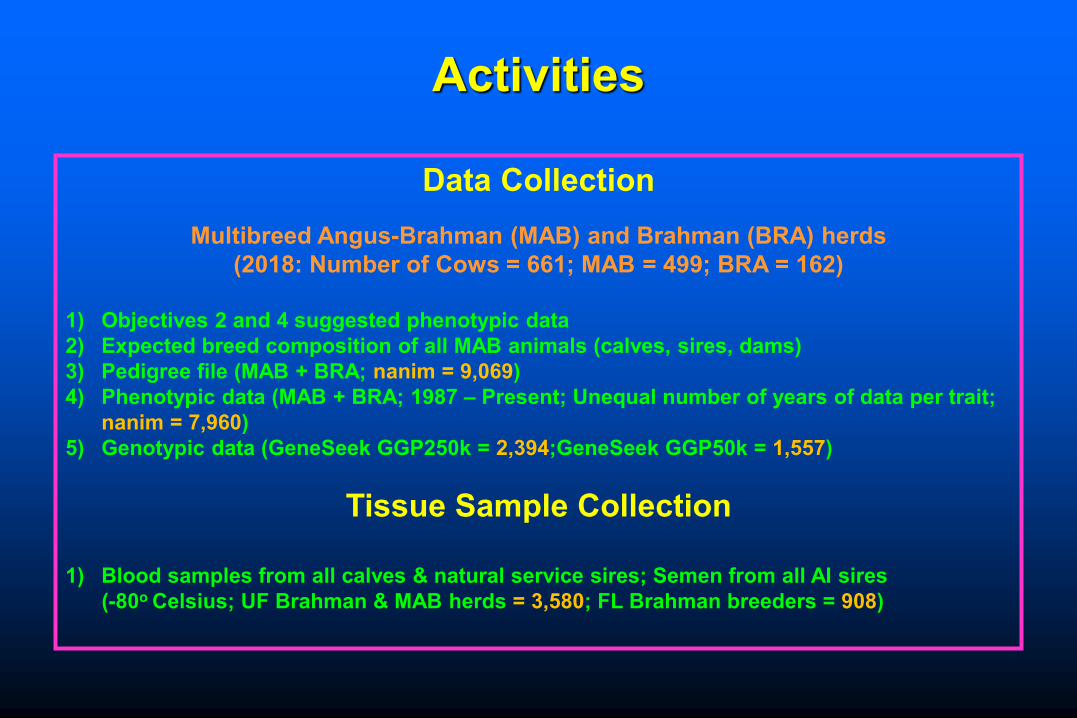
Data CollectionMultibreed Angus-Brahman (MAB) and Brahman (BRA) herds
(2018: Number of Cows = 661; MAB = 499; BRA = 162)
1) Objectives 2 and 4 suggested phenotypic data 2) Expected breed composition of all MAB animals (calves, sires, dams)3) Pedigree file (MAB + BRA; nanim = 9,069)4) Phenotypic data (MAB + BRA; 1987 – Present; Unequal number of years of data per trait;
nanim = 7,960)5) Genotypic data (GeneSeek GGP250k = 2,394;GeneSeek GGP50k = 1,557)
Tissue Sample Collection
1) Blood samples from all calves & natural service sires; Semen from all AI sires (-80o Celsius; UF Brahman & MAB herds = 3,580; FL Brahman breeders = 908)
Activities

Udder & Teat Score by Brahman Fraction(nrec = 628; ncows =386)

Udder & Teat Score by Cow Age(nrec = 628; ncows =386)
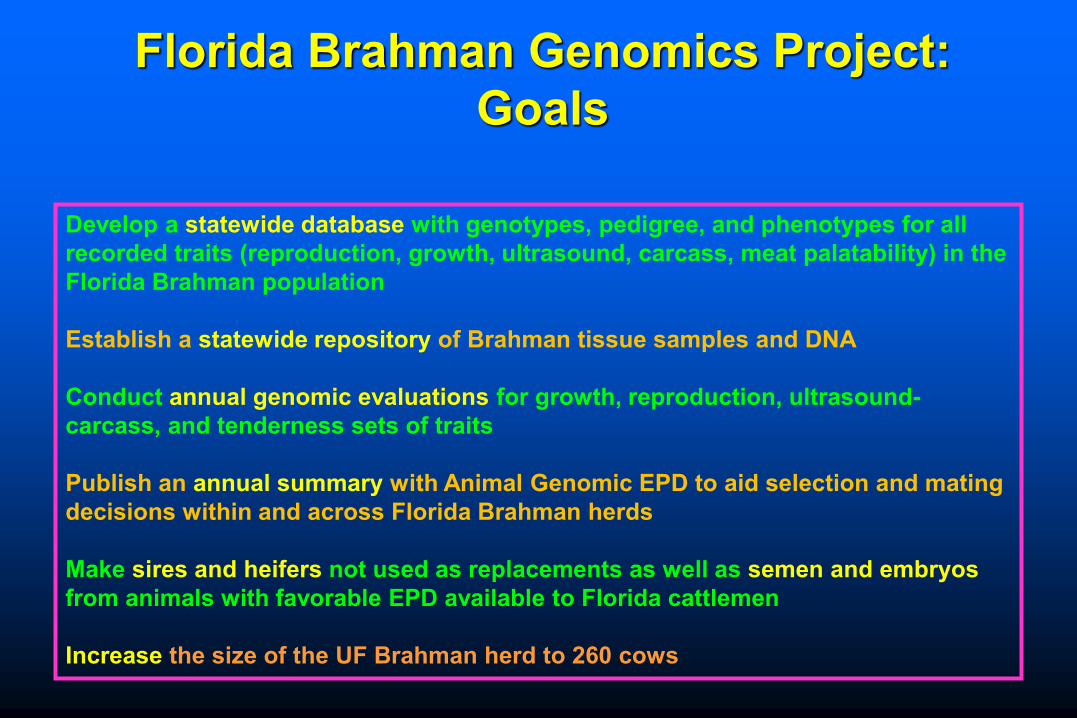
Develop a statewide database with genotypes, pedigree, and phenotypes for all recorded traits (reproduction, growth, ultrasound, carcass, meat palatability) in the Florida Brahman population
Establish a statewide repository of Brahman tissue samples and DNA
Conduct annual genomic evaluations for growth, reproduction, ultrasound-carcass, and tenderness sets of traits
Publish an annual summary with Animal Genomic EPD to aid selection and mating decisions within and across Florida Brahman herds
Make sires and heifers not used as replacements as well as semen and embryos from animals with favorable EPD available to Florida cattlemen
Increase the size of the UF Brahman herd to 260 cows
Florida Brahman Genomics Project: Goals
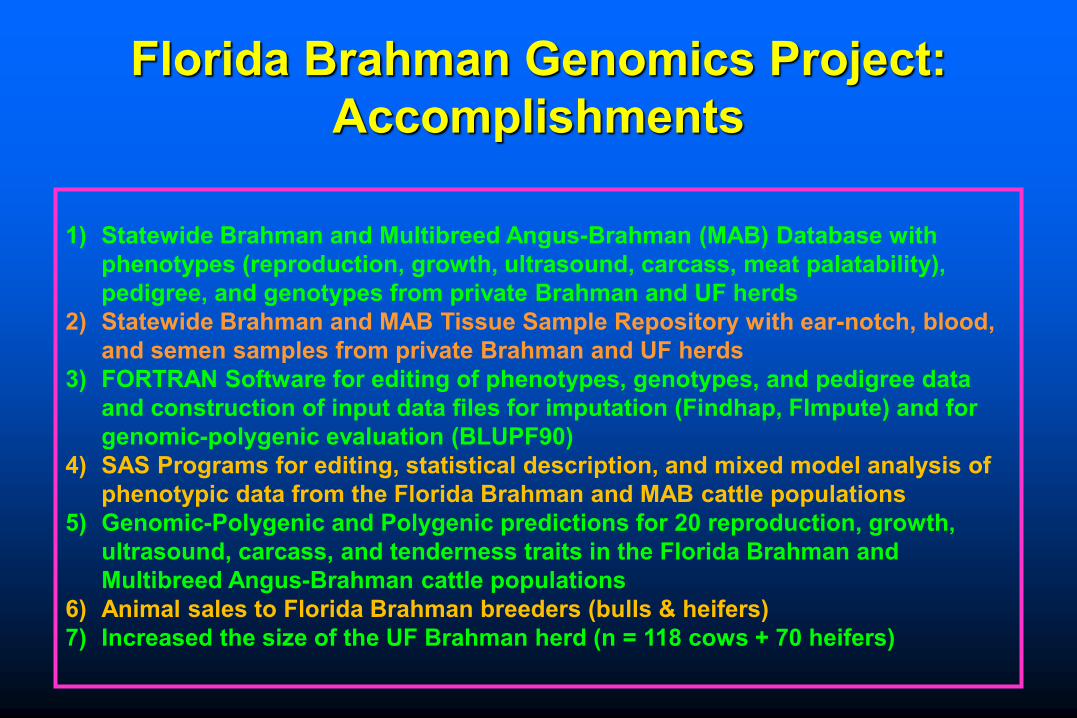
1) Statewide Brahman and Multibreed Angus-Brahman (MAB) Database with phenotypes (reproduction, growth, ultrasound, carcass, meat palatability), pedigree, and genotypes from private Brahman and UF herds
2) Statewide Brahman and MAB Tissue Sample Repository with ear-notch, blood, and semen samples from private Brahman and UF herds
3) FORTRAN Software for editing of phenotypes, genotypes, and pedigree data and construction of input data files for imputation (Findhap, FImpute) and for genomic-polygenic evaluation (BLUPF90)
4) SAS Programs for editing, statistical description, and mixed model analysis of phenotypic data from the Florida Brahman and MAB cattle populations
5) Genomic-Polygenic and Polygenic predictions for 20 reproduction, growth, ultrasound, carcass, and tenderness traits in the Florida Brahman and Multibreed Angus-Brahman cattle populations
6) Animal sales to Florida Brahman breeders (bulls & heifers)7) Increased the size of the UF Brahman herd (n = 118 cows + 70 heifers)
Florida Brahman Genomics Project: Accomplishments

Genomic-Polygenic EBV
Data Collection Phenotypes(ABBA, FL Breeders, UF)
Pedigree (ABBA, FL Breeders, UF)
Data Editing(UF; ABBAData)
Construction of Input Files(FLBRA-MAB Phen, Ped, Genot)
Imputation(Findhap)
Covariance Components(AIREMLF90)
Genomic-Polygenic Predictions(AIREMLF90, BLUPF90)
Publication
Tissue Collection Ear Notches, Blood, Semen (FL Breeders, UF BRA, UF MAB)
Animal EBV (Excel Files)
Genotyping SNP Genotypes(GeneSeek: GGP250k, GGP50k)
FL Brahman GenomPol Evaluation System

Marcus Shackleford
UF Brahman HerdUF Multibreed
Angus-Brahman HerdJohn Traxler
Larry FordDoc Partin (Ricky Booth)
George & Henry Kempfer
Drew Tucker
Larry Barthle
Sean Sexton
Connectedness FL Brahman Population {Pedigree, DNA}
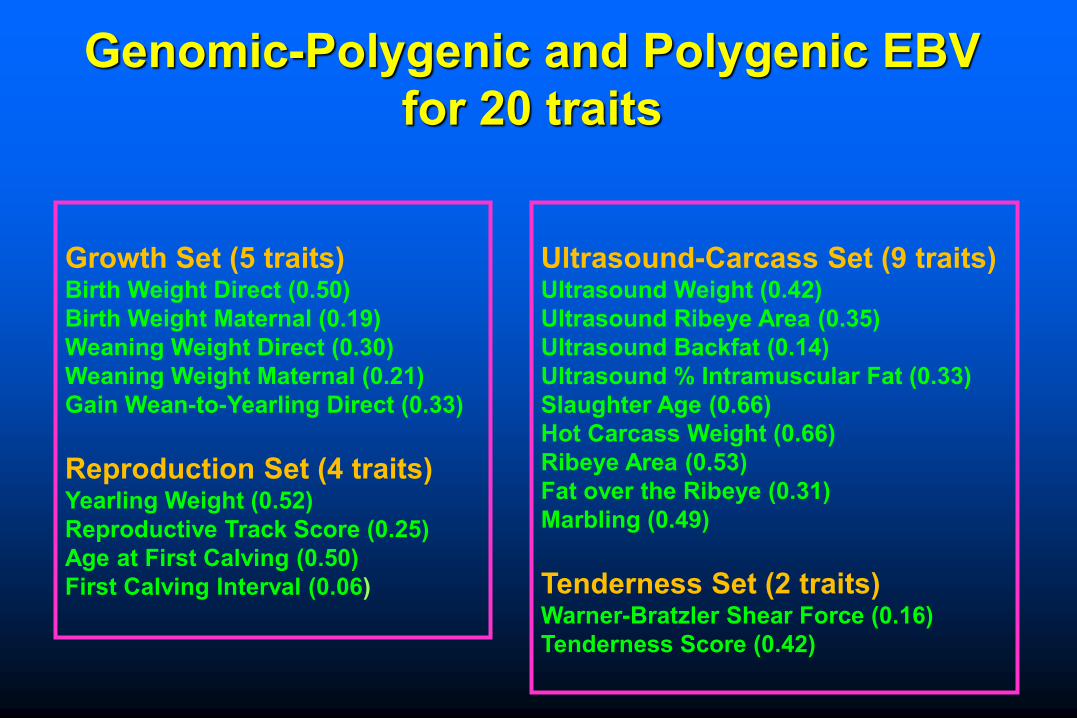
Growth Set (5 traits)Birth Weight Direct (0.50)Birth Weight Maternal (0.19)Weaning Weight Direct (0.30)Weaning Weight Maternal (0.21)Gain Wean-to-Yearling Direct (0.33)
Reproduction Set (4 traits)Yearling Weight (0.52)Reproductive Track Score (0.25)Age at First Calving (0.50)First Calving Interval (0.06)
Genomic-Polygenic and Polygenic EBV for 20 traits
Ultrasound-Carcass Set (9 traits)Ultrasound Weight (0.42)Ultrasound Ribeye Area (0.35)Ultrasound Backfat (0.14)Ultrasound % Intramuscular Fat (0.33)Slaughter Age (0.66)Hot Carcass Weight (0.66)Ribeye Area (0.53)Fat over the Ribeye (0.31)Marbling (0.49)
Tenderness Set (2 traits)Warner-Bratzler Shear Force (0.16)Tenderness Score (0.42)

Phenotypic Data (2018 EBV)Trait N Mean SD Min Max
BW, kg 14635 34.0 5.6 15 62WW, kg 12379 218.5 32.8 93 329GW, kg 2177 114.4 46.4 -13 286YW, kg 2620 343.2 56.1 141 571
RTS, units 664 3.0 1.2 1 5AC1, d 3205 1065.1 84.9 626 1277CI1, d 1594 437.8 118.7 244 790
UW, kg 2650 352.8 71.3 168 656UREA, cm2 2735 56.1 12.1 0 961
UBF, cm 2745 1.1 1.7 0.8 2.2UPIMF, % 2728 2.9 1.2 0.11 6.44
SLA, d 2160 558.7 52.3 324 713HCW, kg 2146 336.3 45.9 208 489
REA, cm2 2104 80.3 10.9 47.7 129FAT, cm 2135 1.3 0.5 1.5 9
MAR, units 2141 404.5 93.9 150 900WBSF, kg 1398 4.0 1.1 1.5 9.4
TEND, units 931 5.4 0.9 2.4 7.6

Genomic-Polygenic EBV: Growth Set
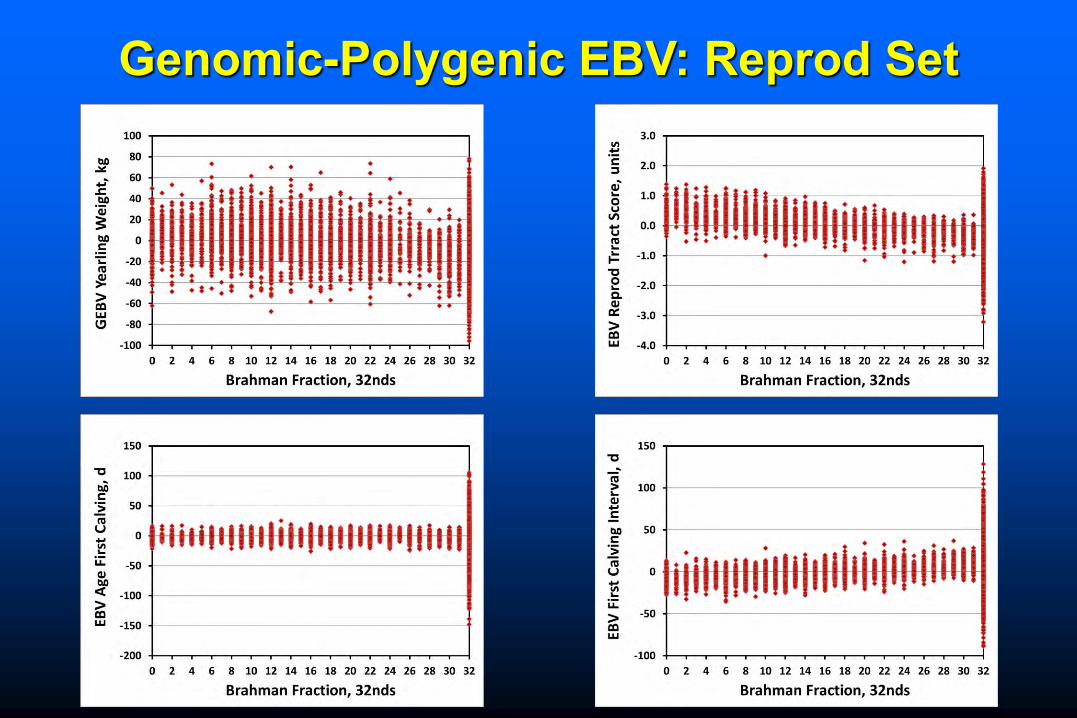
Genomic-Polygenic EBV: Reprod Set
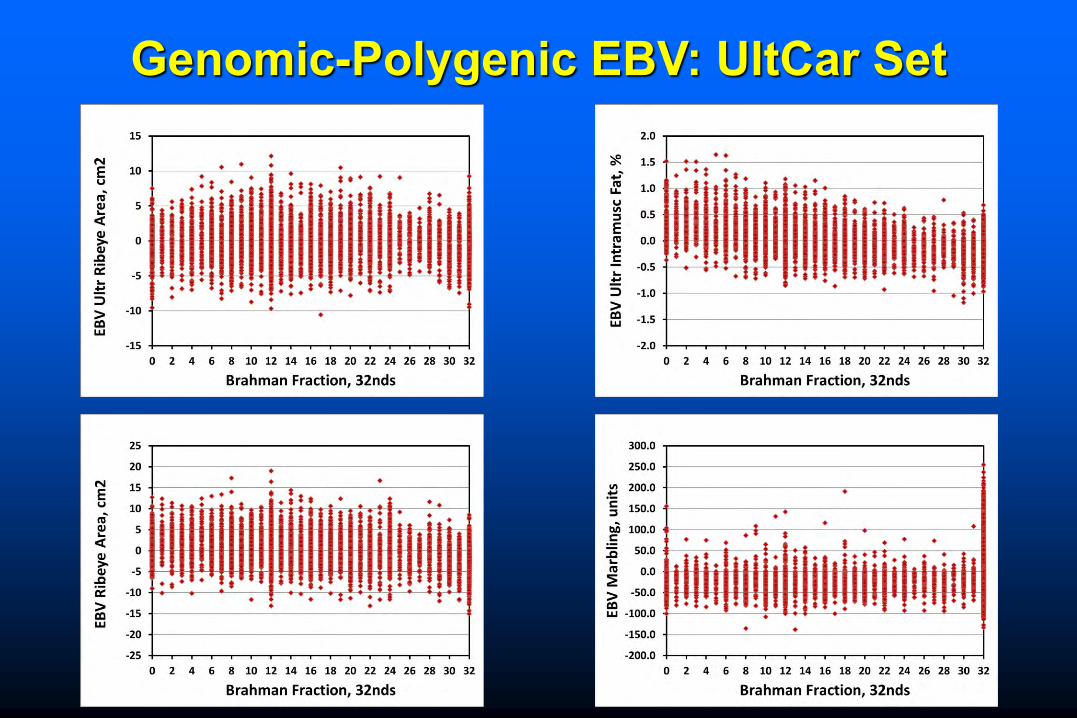
Genomic-Polygenic EBV: UltCar Set

Genomic-Polygenic EBV: Tend Set
Continue and Expand Current Objectives:1) Database (Phenotypes, Pedigree, Genotypes)2) Tissue Sample and DNA Repository3) Annual Genomic-Polygenic Evaluations4) Expand Florida Project to the US Southern Region
5) Identify a set of SNP associated with genes actually influencing traits6) Obtain internal phenotype data7) Construct chips with biologically meaningful SNP8) Evaluate Brahman and MAB animals with chips containing biologically meaningful SNP
Future Work

Genomic-Polygenic EBV
Trait N Mean SD Min MaxSol bwd 23958 1.32 2.75 -11.52 13.34BIF Acc bwd 23958 0.22 0.14 0.00 0.74Sol wwd 23958 3.22 7.79 -36.60 39.79BIF Acc wwd 23958 0.19 0.12 0.00 0.71Sol gwd 23958 -0.76 6.00 -43.09 39.47BIF Acc gwd 23958 0.08 0.10 0.00 0.68Sol bwm 23958 -0.81 1.89 -6.73 8.73BIF Acc bwm 23958 0.14 0.14 0.00 0.90Sol wwm 23958 -0.27 5.12 -30.55 29.71BIF Acc wwm 23958 0.17 0.13 0.00 0.71Sol yw 23958 -2.03 13.82 -107.01 78.11BIF Acc yw 23958 0.12 0.12 0.00 0.71Sol rts 23958 -0.11 0.41 -3.21 1.91BIF Acc rts 23958 0.34 0.05 0.00 0.69Sol ac1 23958 -0.30 14.53 -147.57 105.25BIF Acc ac1 23958 0.75 0.02 0.58 0.88Sol ci1 23958 2.58 12.93 -88.74 128.50BIF Acc ci1 23958 0.41 0.05 0.00 0.73

Genomic-Polygenic EBVTrait N Mean SD Min MaxSol uw 23958 -2.75 10.93 -69.47 78.44BIF Acc uw 23958 0.07 0.12 0.00 0.69Sol urea 23958 -0.06 1.55 -10.56 12.14BIF Acc urea 23958 0.07 0.11 0.00 0.68Sol ubf 23958 -0.01 0.05 -0.40 0.66BIF Acc ubf 23958 0.32 0.08 0.00 0.75Sol upimf 23958 -0.08 0.20 -1.18 1.64BIF Acc upimf 23958 0.06 0.10 0.00 0.67Sol slage 23958 0.77 9.49 -71.87 70.12BIF Acc slage 23958 0.20 0.12 0.00 0.71Sol hcw 23958 -2.54 11.88 -62.08 65.41BIF Acc hcw 23958 0.07 0.12 0.00 0.66Sol rea 23958 -0.41 2.38 -15.05 18.99BIF Acc rea 23958 0.18 0.11 0.00 0.70Sol fat 23958 -0.04 0.15 -1.07 1.96BIF Acc fat 23958 0.04 0.08 0.00 0.61Sol marb 23958 -19.12 37.08 -137.90 254.40BIF Acc marb 23958 0.05 0.10 0.00 0.63Sol wbsf 23958 0.09 0.18 -0.74 1.08BIF Acc wbsf 23958 0.02 0.07 0.00 0.85Sol tend 23958 -0.16 0.30 -1.62 1.13BIF Acc tend 23958 0.03 0.08 0.00 0.85