Embed Size (px)
Citation preview

Lawrence Livermore National Laboratory
UCRL-50027-99
E n v i ronmental Report 1999
Tricolored BlackbirdAgelaius tricolor

CompositionBeverly L. ChamberlainSherry A. Emmons
Art and DesignLee A. DravidziusBrett S. Clark
DISCLAIMERThis document was prepared as an account of wo rk sponsored by an agency of the United States Gove rn m e n t . Neither the United States Gove rnment nor the University of Califo rnia nor any of their employees makes any wa r ra n t y, express or implied, or assumes any legal liability or responsibility for the accura c y, completness, or usefulnessof any info rmation, appara t u s, product, or process disclosed, or represents that its use would not infringe on pri vately owned ri g h t s. R e ferences herein to any specific commercialproduct, process, or service by trade name, tra d e m a rk, manu fa c t u r e r, or otherwise does not necessarily constitute or imply its endorsement, recommendation, or favo ring bythe United States Gove rnment or the University of Califo rn i a . The views and opinions of authors expressed herein do not necessarily state or reflect those of the UnitedStates Gove rnment or the University of Califo rnia and shall not be used for adve rtising or product endorsement purp o s e s.
This wo rk was perfo rmed under the auspices of the U. S. D e p a rtment of Energy by University of Califo rnia Lawrence Live rmore National Labora t o ry under contract W- 7 4 0 5 - E n g - 4 8 .
Lawrence Livermore National Laboratory
Environmental Report 1999
UCRL-50027-99
Cover The Tricolored Blackbird (Agelaius tricolor), which has state and federalstatus as a species of Special Concern, is endemic only to California andis largely restricted to the San Joaquin Valley where it is estimated thatpopulations have declined by at least 50% in the last half-century. Itroosts and nests in cattail or tule marshes in dense colonies that cannumber in the thousands of birds. The male Tricolored has a darker redpatch than the Red-winged Blackbird and a conspicuous white marginthat is identifiable even in flight.
Historically, Site 300 has had a small population nesting in the ElkRavine wetland. This colony is considered unique because Tricoloredstypically do not inhabit foothill habitat areas like those at Site 300.When Tricoloreds are actively nesting, LLNL restricts traffic levels toprotect the adult birds during their egg incubation period and rearing ofyoung (roughly late March through May). LLNL wildlife biologists col-lect information on the density of nesting birds, productivity at the nestsites, and the areas used by the colony for foraging. This information isimportant to our understanding of the natural history and wildlife man-agement aspects of the site as well as to state and federal resourceagencies that track Tricolored population trends across California.
Cover photos provided by:• flock–Jim S. Woollett, Jr., wildlife biologist, LLNL• single bird–David Menke, outdoor recreation planner, Lower
Klamath National Wildlife Refuge, U.S. Fish and Wildlife Service
For further information about this report contact: Bert Heffner,LLNL Public Affairs Department, P.O. Box 808, Livermore, CA 94550,(510) 424-4026. This report can be accessed on the Internet athttp://www.llnl.gov/saer. It is also available to DOE employees andDOE contractors from: Office of Scientific and Technical Information,P.O. Box 62, Oak Ridge, TN 37831 and to the public from: NationalTechnical Information Service, U.S. Department of Commerce, 5285 Port Royal Road, Springfield, VA 22161.

UCRL-50027-99Distribution Category UC-702
Environmental Report 1999
September 1, 2000 Lawrence Livermore National Laboratory
Jennifer M. Larson
Arthur H. BiermannRobert J. HarrachParis E. AlthouseNicholas A. BertoldoRichard G. BlakeErich R. BrandstetterShari L. BrigdonRichard A. BrownEric ChristoffersonKaren J. Folks
Gretchen M. GallegosLucinda M. GarciaTed A. GiesingAllen R. GraysonLinda C. HallDonald H. MacQueenSandra MathewsS. Ring PetersonMichael J. TaffetPaula J. TateRobert J. VellingerRebecca J. WardRobert A. Williams
Authors
Karen S. RathNancy J. Woods
Gloria J. CannonNona M. Sanford
Editors


Distribution:
Subject: 1999 Site Annual Environmental Report (SAER) for theLawrence Livermore National Laboratory (LLNL)
This report, prepared by LLNL for the Department of Energy, Oakland Operations Office (DOE-OAK), provides a comprehensive summary of the environmental program activities at LLNL for calendar year 1999. Site Annual Environmental Reports (SAERs) are prepared annually for all DOE sites with significant environmental activities, and distributed to relevant external regulatory agencies and other interested organizations or individuals.
To the best of my knowledge, this report accurately summarizes the results of the 1999 environmental monitoring, compliance, impacts assessment, and restoration program at LLNL. This assurance can be made based on DOE-OAK and LLNL review of the SAER, and quality assurance protocols applied to monitoring and data analyses at LLNL.
A reader survey form is provided with the SAER to provide comments or suggestions for future versions of the report. Your response is appreciated. Questions or comments regarding this report may also be made directly to DOE-OAK, by contacting Ron Sommer at (925) 422-3390.
Sincerely,
Michael K. HooperAssistant Manager for National Nuclear
Security Administration Operations
Department of EnergyOakland Operations Office
1301 Clay Street
Oakland, California 94612-5208


LLNL Environmental Report for 1999 v
PrefaceThe Environmental Report 1999 is prepared for the U.S. Department of Energy (DOE), asrequired by DOE Order 5400.1 and DOE Order 231.1, by the Environmental ProtectionDepartment at Lawrence Livermore National Laboratory (LLNL). The results of LLNL’senvironmental monitoring and compliance efforts and an assessment of the impact ofLLNL operations on the public and the environment are presented in this publication.
One important change has been made to the 1999 report. A new Appendix C, Errata,has been added to notify holders of previous environmental reports that corrections tothe bound, hard copies were necessary, what the corrections were, and that thecorrections were made on the Internet versions. With the errata, the hard copy andInternet versions are equivalent documents. Environmental reports covering calendaryears 1994 through 1999 can be accessed on the Internet at the address of the LLNLSAER homepage: http://www.llnl.gov/saer . Both the main volume and data supple-ment volume of each individual report can be viewed in its fully corrected, most up-to-date form.
To produce a more readable and useful document for our diverse readership, whichincludes regulators, scientists and engineers, educators, the media, public interestgroups, and interested citizens, this report is divided into two volumes: main volumeand Data Supplement. The main volume describes LLNL’s environmental impact andcompliance activities and features descriptive and explanatory text, summary datatables, and plots showing data trends. The summary data include measures of thecentral tendency of the data (i.e. mean and medium), their spread or variability, andtheir extreme values. The main volume contains the Executive Summary and theCompliance Summary; it features individual chapters on monitoring of air, sewage,surface water, ground water, soil and sediment, vegetation and foodstuff, and environ-mental radiation; and it contains chapters on site overview, environmental programinformation, ground water investigation and remediation, radiological dose assessment,and quality assurance. Information on both the Livermore site and Site 300 is presentedin each chapter. The main volume contains the information of interest to most of ourreaders and will be distributed. The distribution list for the 1999 report can be accessedfrom the LLNL SAER homepage on the Internet at the address provided above. Requests for additions to or deletions from the list can be entered on the distribution listwebpage.

Preface
vi LLNL Environmental Report for 1999
The Data Supplement provides individual data points, where applicable, some sum-mary data, and more detailed accounts of sample collection and analytical methods. TheData Supplement will be sent only upon request; a card for this purpose is included onthe last page of this volume. Both the main volume and the Data Supplement areavailable on the Internet at the address provided above.
As in our previous annual reports, data are presented in Système International (SI)units. In particular, the primary units we use for radiological results are becquerelsand sieverts for activity and dose, respectively, with curies and rem used secondarily(1 Bq = 2.7 × 10⁻¹¹ Ci; 1 Sv = 100 rem). If the data are available, radioactivities arereported as the measured concentration with an uncertainty ±2σ counting error); if not,they are reported as being less than a detection limit. If the concentration is less than theuncertainty, the result is considered to be indistinguishable from a zero concentration. Units are discussed in Supplement 13-1 of Chapter 13, Radiological Dose Assessment,and in Chapter 14, Quality Assurance, in the main volume.
This document is the responsibility of LLNL’s Operations and Regulatory AffairsDivision of the Environmental Protection Department. Monitoring data wereobtained through the combined efforts of the Operations and Regulatory AffairsDivision, Environmental Restoration Division, the Chemistry and Materials ScienceEnvironmental Services Laboratories, and the Hazards Control Department. Specialrecognition is deserved for the dedication and professionalism of the technicianswho carried out environmental monitoring—Gary A. Bear, David J. Castro,Paul C. Dickinson, Keith Toon, David Macedo, Charles Hunt, Renee Needens,Terrance W. Poole, Donald G. Ramsey, Terri Crippen, and Robert Williams—and to thedata management personnel—Jennifer Clark, Kimberly A. Stanford, Louise Morris,Beth Schad, Suzanne Chamberlain, Connie Wells, Della Burruss, and Susan Lambaren. Betty Cuevas provided secretarial support and collated and distributed drafts.
Special thanks go to Bill Hoppes for his strong support of the project and carefuland timely reviews of all the drafts; C. Susi Jackson and Charlene Grandfield forreviewing the chapters; and Karen Folks and Paula Tate for their comments andhelp with chapters other than their own. In addition, the following people contributedsignificantly to this report: Janice Butler, Richard Crawford, Keith V. Gilbert,Albert L. Lamarre, Patricia L. Ottesen, Duane W. Rueppel, Jeffrey Sketchley,Brenda Staley, Judy Steenhoven, and Kim Heyward.

LLNL Environmental Report for 1999 vii
Table of ContentsList of Figures..................................................................................................................... xvii
List of Tables ...................................................................................................................... xxiii
Executive Summary .......................................................................................................... EX-1Introduction ........................................................................................................... EX-1Environmental Monitoring Results .................................................................... EX-1
Air Monitoring ................................................................................................ EX-2Stack Air Effluent Monitoring....................................................................... EX-2Sewerable Water Monitoring ........................................................................ EX-3Surface Water Monitoring ............................................................................. EX-3Ground Water Monitoring ............................................................................ EX-4Soil and Sediment Monitoring ...................................................................... EX-5Vegetation and Foodstuff Monitoring ......................................................... EX-6
Radiological Dose Assessment ............................................................................ EX-6Environmental Compliance and Program Activities ....................................... EX-7
Ground Water Remediation.......................................................................... EX-7Waste Minimization and Pollution Prevention.......................................... EX-8Air, Wastewater, and Water Compliance ................................................... EX-9Endangered Species ........................................................................................ EX-9Environmental Occurrences.......................................................................... EX-10Work Smart Standards................................................................................... EX-10
Conclusion.............................................................................................................. EX-10
1. Site Overview........................................................................................................ 1-1Introduction ........................................................................................................... 1-1Operations .............................................................................................................. 1-1Location .................................................................................................................. 1-1Meteorology ........................................................................................................... 1-3Topography ............................................................................................................ 1-4Hydrogeology ........................................................................................................ 1-9
Livermore Site ................................................................................................. 1-9Site 300.............................................................................................................. 1-11
Summary ................................................................................................................ 1-13
2. Compliance Summary ......................................................................................... 2-1Introduction ........................................................................................................... 2-1Comprehensive Environmental Response, Compensation and LiabilityAct............................................................................................................................ 2-1
Livermore Site Ground Water Project ......................................................... 2-1Documentation ......................................................................................... 2-2Milestones and Activities ........................................................................ 2-2Treatment Facilities.................................................................................. 2-2

Table of Contents
viii LLNL Environmental Report for 1999
Community Relations.............................................................................. 2-3Site 300 CERCLA Project ............................................................................... 2-3
Documentation ......................................................................................... 2-4Milestones and Activities ........................................................................ 2-4Treatment Facilities ................................................................................. 2-4Community Relations.............................................................................. 2-4
Site Evaluations Prior to Construction ........................................................ 2-5Agency for Toxic Substances and Disease Registry Assessment ............ 2-5
Superfund Amendment and Reauthorization Act, Title III ............................ 2-6Clean Air Act—Air Quality Management Activities ....................................... 2-6
National Emission Standards for Hazardous Air Pollutants ................... 2-13Clean Water Act and Related State Programs................................................... 2-13
Ground Water and Surface Water ................................................................ 2-14Sewerable Water ............................................................................................. 2-16Streambed Alteration Agreements and Nationwide Permits .................. 2-17Tank Management .......................................................................................... 2-17
Resource Conservation and Recovery Act and Related State Laws .............. 2-18Hazardous Waste Permits ............................................................................. 2-19
Livermore Site .......................................................................................... 2-19Site 300 ....................................................................................................... 2-20
Hazardous Waste Reports ............................................................................. 2-21Hazardous Waste Transport Registration ................................................... 2-21Waste Accumulation Areas........................................................................... 2-21
California Medical Waste Management Act ..................................................... 2-22Federal Facility Compliance Act ......................................................................... 2-22Toxic Substances Control Act .............................................................................. 2-22National Environmental Policy Act .................................................................... 2-23California Environmental Quality Act............................................................... 2-24National Historic Preservation Act..................................................................... 2-24Endangered Species Acts and Sensitive Natural Resources ........................... 2-25Antiquities Act (of 1906): Paleontological Resources ..................................... 2-26Environmental Occurrences ................................................................................ 2-26Contributing Authors Acknowledgment .......................................................... 2-28
3. Environmental Program Information............................................................... 3-1Introduction ........................................................................................................... 3-1Integrated Environmental, Safety, and Health Management System ........... 3-1Work Smart Standards ......................................................................................... 3-2Environmental Protection Department.............................................................. 3-3
Operations and Regulatory Affairs Division.............................................. 3-5Hazardous Waste Management Division ................................................... 3-5Environmental Restoration Division ........................................................... 3-6
Performance Measures Summary....................................................................... 3-7DOE Pollution Prevention Goals ........................................................................ 3-7

Table of Contents
LLNL Environmental Report for 1999 ix
Waste Minimization/Pollution Prevention ....................................................... 3-9Nonhazardous Solid Waste Minimization ................................................. 3-11
Diverted Waste ......................................................................................... 3-11Source Reduction and Pollution Prevention............................................... 3-14
Toxic Reporting Inventory Information................................................ 3-14Implementing Cost-Saving Pollution Prevention (P2) Projects ............... 3-14Review of New Processes or Experiments .................................................. 3-15Design for Environment ................................................................................ 3-15Implementing P2 Employee Training and Awareness Programs ........... 3-16Current Return-on-Investment Projects ...................................................... 3-16
ChemTrack ............................................................................................................. 3-17Current Issues and Actions.................................................................................. 3-17
Miniature Optical Lair Explorer ................................................................... 3-17Leaking Underground Fuel Tank Studies ................................................... 3-17Evaluation of the Use of Ethanol To Replace MTBE in Gasoline ............ 3-18Initiative to Improve Volatile Organic Compound Cleanup Processby Using Historical Case Analysis ............................................................... 3-19
Response to Spills and Other Environmental Emergencies ............................ 3-20Environmental Training ....................................................................................... 3-20LLNL’s Other Environmental Programs ........................................................... 3-21Contributing Authors Acknowledgment .......................................................... 3-22
4. Air Effluent Monitoring ..................................................................................... 4-1Introduction ........................................................................................................... 4-1
Air Quality Laws ............................................................................................ 4-1Monitored Emissions ..................................................................................... 4-2Operation of Monitoring Systems ................................................................ 4-3
Methods .................................................................................................................. 4-3Measured Radioactive Air Emissions ................................................................ 4-5
Livermore Site ................................................................................................. 4-6Site 300.............................................................................................................. 4-8
All Potential Sources of Radioactive Air Emissions......................................... 4-8Nonradioactive Air Emissions ............................................................................ 4-9Environmental Impact .......................................................................................... 4-10
5. Air Surveillance Monitoring.............................................................................. 5-1Introduction ........................................................................................................... 5-1Methods .................................................................................................................. 5-1
Air Particulate Sampling Locations ............................................................. 5-6Tritium Sampling Locations ......................................................................... 5-7Radiological Analysis..................................................................................... 5-7
Results ..................................................................................................................... 5-7Livermore Site ................................................................................................. 5-8
Airborne Radioactivity ............................................................................ 5-8Beryllium in Air ........................................................................................ 5-20

Table of Contents
x LLNL Environmental Report for 1999
Site 300.............................................................................................................. 5-21Airborne Radioactivity ............................................................................ 5-21Beryllium in Air ........................................................................................ 5-23
Environmental Impact .......................................................................................... 5-23Radioactive Materials ..................................................................................... 5-23Nonradioactive Materials .............................................................................. 5-24
6. Sewerable Water................................................................................................... 6-1Introduction ........................................................................................................... 6-1
Preventive Measures ...................................................................................... 6-3Monitoring ....................................................................................................... 6-5
Monitoring at the Sewer Monitoring Station ....................................... 6-5Monitoring at the Upstream pH Monitoring Station ......................... 6-5
Diversion System ............................................................................................ 6-5Pretreatment Discharges ...................................................................................... 6-6Categorical Discharges ......................................................................................... 6-7Discharges of Treated Ground Water ................................................................ 6-8Radioactive Pollutants in Sewage....................................................................... 6-9
Monitoring Results ......................................................................................... 6-9Environmental Impact ................................................................................... 6-11
Nonradioactive Pollutants in Sewage ................................................................ 6-16Monitoring Results ......................................................................................... 6-16Environmental Impact ................................................................................... 6-20
7. Surface Water ........................................................................................................ 7-1Overview ................................................................................................................ 7-1Storm Water ........................................................................................................... 7-1
General Information ....................................................................................... 7-1Permits ....................................................................................................... 7-1Constituent Criteria ................................................................................. 7-3Inspections................................................................................................. 7-4Sampling .................................................................................................... 7-5
Methods............................................................................................................ 7-8Results .............................................................................................................. 7-9
Inspections................................................................................................. 7-9Livermore Sampling ................................................................................ 7-10Site 300 Sampling ..................................................................................... 7-17
Rainfall .................................................................................................................... 7-19General Information ....................................................................................... 7-19
Livermore Site and Livermore Valley ................................................... 7-19Site 300 ....................................................................................................... 7-20
Methods............................................................................................................ 7-20Results .............................................................................................................. 7-21
Livermore Site and Livermore Valley ................................................... 7-21Site 300 ....................................................................................................... 7-22

Table of Contents
LLNL Environmental Report for 1999 xi
Livermore Site Drainage Retention Basin ......................................................... 7-22General Information ....................................................................................... 7-23Methods............................................................................................................ 7-25Results .............................................................................................................. 7-25
Chemical and Physical Monitoring ....................................................... 7-26Biological Monitoring .............................................................................. 7-29
Site 300 Cooling Towers ....................................................................................... 7-30General Information ....................................................................................... 7-30Methods............................................................................................................ 7-30Results .............................................................................................................. 7-32
Other Waters .......................................................................................................... 7-34Methods............................................................................................................ 7-34Results .............................................................................................................. 7-35
Environmental Impacts ........................................................................................ 7-36Storm Water..................................................................................................... 7-36Rainfall ............................................................................................................. 7-37
Livermore Site and Livermore Valley ................................................... 7-37Site 300 ....................................................................................................... 7-37
Drainage Retention Basin .............................................................................. 7-37Cooling Towers ............................................................................................... 7-38Other Waters.................................................................................................... 7-38
8. Ground Water Investigation and Remediation.............................................. 8-1Introduction ........................................................................................................... 8-1Livermore Site Ground Water Project ................................................................ 8-1
Physiographic Setting .................................................................................... 8-1Hydrogeology ................................................................................................. 8-2Remedial Activities......................................................................................... 8-2
Treatment Facility A ................................................................................ 8-4Treatment Facility B ................................................................................. 8-5Treatment Facility C ................................................................................ 8-7Treatment Facility D ................................................................................ 8-9Treatment Facility E ................................................................................. 8-13Treatment Facility G ................................................................................ 8-14Treatment Facility 406 ............................................................................. 8-15Ground Water Treatment Facility 518................................................... 8-16Vapor Treatment Facility 518 ................................................................. 8-17Treatment Facility 5475 ........................................................................... 8-17Vapor Treatment Facility 5475 ............................................................... 8-18
Ground Water Flow and Transport Modeling ........................................... 8-19Treatment Facility A and B Model ........................................................ 8-19
Environmental Impact ................................................................................... 8-19Site 300 CERCLA Project ...................................................................................... 8-21
Geology of Site 300 ......................................................................................... 8-22

Table of Contents
xii LLNL Environmental Report for 1999
Hydrogeology of Site 300 .............................................................................. 8-24Study Area Highlights and Activities ......................................................... 8-27
General Services Area.............................................................................. 8-27Building 834 Area..................................................................................... 8-32High Explosives Process Area ................................................................ 8-32East and West Firing Areas..................................................................... 8-34Building 854 Study Area ......................................................................... 8-37Pit 6 Area ................................................................................................... 8-37Building 832 Canyon Study Area .......................................................... 8-38
Environmental Remediation at Site 300 ...................................................... 8-41General Services Area.............................................................................. 8-41Building 834 Complex ............................................................................. 8-44High Explosives Process Area ................................................................ 8-45Pit 6 Landfill Area .................................................................................... 8-46Building 854 Area..................................................................................... 8-46Building 832 Canyon ............................................................................... 8-46
Community Relations .................................................................................... 8-46
9. Ground Water Monitoring ................................................................................. 9-1Introduction ........................................................................................................... 9-1
Surveillance Monitoring ................................................................................ 9-1Compliance Monitoring................................................................................. 9-2Livermore Site and Environs ........................................................................ 9-3
Livermore Valley...................................................................................... 9-3Livermore Site Perimeter ........................................................................ 9-4Livermore Site .......................................................................................... 9-5
Site 300.............................................................................................................. 9-7Elk Ravine Drainage Area....................................................................... 9-9Corral Hollow Creek Drainage Area..................................................... 9-14
Sampling and Analytical Methods ..................................................................... 9-22Results ..................................................................................................................... 9-23
Livermore Site and Environs ........................................................................ 9-23Livermore Valley...................................................................................... 9-23Livermore Site Perimeter ........................................................................ 9-24Livermore Site .......................................................................................... 9-26
Site 300.............................................................................................................. 9-27Elk Ravine Drainage Area....................................................................... 9-27Corral Hollow Creek Drainage Area..................................................... 9-31
Environmental Impacts ........................................................................................ 9-36Livermore Site and Environs ........................................................................ 9-36Site 300.............................................................................................................. 9-37
10. Soil and Sediment Monitoring .......................................................................... 10-1Introduction ........................................................................................................... 10-1Sampling Locations............................................................................................... 10-2
Table of Contents
LLNL Environmental Report for 1999 xiii
Methods............................................................................................................ 10-4Livermore Valley Surface Soil Results ......................................................... 10-6Livermore Site Sediment Results ................................................................. 10-9Livermore Site Vadose Zone Soil Results ................................................... 10-10Site 300 Results ................................................................................................ 10-11Environmental Impact ................................................................................... 10-11
Livermore Site .......................................................................................... 10-11Site 300 ....................................................................................................... 10-12
Big Trees Park ........................................................................................................ 10-13Impact............................................................................................................... 10-16
11. Vegetation and Foodstuff Monitoring ............................................................. 11-1Introduction ........................................................................................................... 11-1Methods .................................................................................................................. 11-2
Vegetation ........................................................................................................ 11-2Wine.................................................................................................................. 11-2
Results ..................................................................................................................... 11-4Livermore Site ................................................................................................. 11-4
Vegetation ................................................................................................. 11-4Wine ........................................................................................................... 11-7
Site 300.............................................................................................................. 11-8Vegetation ................................................................................................. 11-8
Environmental Impact .......................................................................................... 11-10Livermore Site ................................................................................................. 11-11Site 300.............................................................................................................. 11-12
12. Environmental Radiation Monitoring ............................................................. 12-1Introduction ........................................................................................................... 12-1
Cosmic Radiation Component...................................................................... 12-1Terrestrial Radiation Component................................................................. 12-1
General Methods ................................................................................................... 12-2Monitoring Locations ........................................................................................... 12-2
Collocated Monitoring Locations ................................................................. 12-4Results of Gamma Monitoring ............................................................................ 12-6
Livermore Site ................................................................................................. 12-7Site 300.............................................................................................................. 12-7
Environmental Impact .......................................................................................... 12-8
13. Radiological Dose Assessment.......................................................................... 13-1Introduction ........................................................................................................... 13-1
Background Information ............................................................................... 13-1Releases of Radioactivity to Air .................................................................... 13-1Air Dispersion and Dose Models ................................................................. 13-2Radiation Protection Standards .................................................................... 13-3Reporting Requirements ................................................................................ 13-4
Table of Contents
xiv LLNL Environmental Report for 1999
Evaluation of Sources of Radioactive Emissions .............................................. 13-5Inventoried Sources ........................................................................................ 13-5Monitored Sources.......................................................................................... 13-6
Stack Effluent Monitoring....................................................................... 13-6Surveillance Air Monitoring................................................................... 13-7
Determinations of Dose ........................................................................................ 13-7Principal Modeling Approaches................................................................... 13-8Identification of Key Receptors .................................................................... 13-8Assessment Assumptions Regarding Tritium............................................ 13-10
Relative Contributions to Dose from HTO and HT Emissions ......... 13-10Dose-Rate-Conversion Factor for Tritium ............................................ 13-11Overestimate of Ingestion Dose for Tritium ........................................ 13-11Contribution from Ingestion of Organically Bound Tritium ............. 13-11
Special Modeling Problems........................................................................... 13-12Diffuse Sources ......................................................................................... 13-12Modeling Dose Impacts from Explosives Experiments atSite 300 ....................................................................................................... 13-12
Radiological Doses to the Public from LLNL Operations ............................... 13-14Dose Breakdown by Facility ......................................................................... 13-14Unplanned Releases ....................................................................................... 13-18Doses to Site-Wide Maximally Exposed Individuals ................................ 13-18Temporal Trends in Dose to the SW-MEI ................................................... 13-22Collective Doses to Exposed Populations ................................................... 13-23
Summary and Conclusion.................................................................................... 13-23Chapter 13 Supplements ..................................................................................... 13-26
Supplement 13-1: Radiation Basics ............................................................. 13-26Supplement 13-2: Radiation Control Measures at LLNL......................... 13-31
14. Quality Assurance ................................................................................................ 14-1Introduction ........................................................................................................... 14-1Quality Assurance Activities ............................................................................... 14-2Analytical Laboratories ........................................................................................ 14-2
Participation in Laboratory Intercomparison Studies ............................... 14-3Duplicate Analyses ............................................................................................... 14-4Statistical Methods ................................................................................................ 14-10
Radiation Units ............................................................................................... 14-10Sampling Completeness ................................................................................ 14-10Radiological Data ............................................................................................ 14-10Nonradiological Data ..................................................................................... 14-15Statistical Comparisons.................................................................................. 14-15Summary Statistics ......................................................................................... 14-15
Quality Assurance Process for the Environmental Report ............................. 14-16

Table of Contents
LLNL Environmental Report for 1999 xv
Appendix A. Methods of Dose Calculations ............................................................. A-1
Appendix B. Reports for Regulatory Agencies ......................................................... B-1
Appendix C. Errata to 1997 and 1998 Environmental Reports ................................ C-1
References........................................................................................................................... R-1
Glossary .............................................................................................................................. G-1


LLNL Environmental Report for 1999 xvii
List of FiguresFigure 1-1. Locations of LLNL Livermore site and Site 300..................................... 1-2
Figure 1-2. Wind rose showing the frequency of occurrence for wind speedand direction at the Livermore site, 1999 ................................................ 1-5
Figure 1-3. Wind rose showing the frequency of occurrence for wind speedand direction at Site 300, 1999................................................................... 1-7
Figure 1-4. 1999 approximate ground water and surface elevation contours,Livermore site and vicinity ....................................................................... 1-10
Figure 1-5. 1999 approximate ground water elevations in principalcontinuous water-bearing zones at Site 300 ........................................... 1-12
Figure 4-1. Facilities at the Livermore site with air monitoring systems foreffluent gas streams during all or part of 1999....................................... 4-4
Figure 4-2. Tritium Facility HTO and HT emissions between 1981 and 1999 ....... 4-6
Figure 5-1. Air particulate and tritium sampling locations on the Livermoresite, 1999....................................................................................................... 5-3
Figure 5-2. Air particulate and tritium sampling locations in the LivermoreValley, 1999 ................................................................................................. 5-4
Figure 5-3. Air particulate and tritium sampling locations at Site 300 andoff site, 1999 ................................................................................................. 5-5
Figure 5-4. Monthly median gross alpha concentrations in particulate airsamples from the LLNL perimeter, Livermore Valley, andSite 300 sampling locations, 1999 ............................................................. 5-11
Figure 5-5. Monthly median gross beta concentrations in particulate airsamples from the LLNL perimeter, Livermore Valley, andSite 300 sampling locations, 1999 ............................................................. 5-12
Figure 5-6. Annual median plutonium concentrations in air particulatesamples at two locations, SALV and FCC, 1982–1999 .......................... 5-15
Figure 5-7. Median concentration of beryllium in air particulate samplestaken at the Livermore site perimeter, 1974–1999 ................................. 5-21
Figure 6-1. LLNL sanitary sewer system monitoring stations and diversionfacility........................................................................................................... 6-2
Figure 6-2. Historical trend in tritium concentration in LLNL sewage ................. 6-11
Figure 6-3. Historical trends in average monthly plutonium and cesiumconcentrations in LLNL sewage............................................................... 6-13

List of Figures
xviii LLNL Environmental Report for 1999
Figure 6-4. Average monthly concentrations of eight of the nine regulatedmetals in LLNL sanitary sewer effluent showing trends from1994–1999 ..................................................................................................... 6-18
Figure 6-5. Results as percentages of effluent pollutant limits (EPLs) for theeight of the nine regulated metals in LLNL sewage, 1999 ................... 6-19
Figure 7-1. Surface water courses in the vicinity of the Livermore site ................. 7- 6
Figure 7-2. Storm water runoff and Drainage Retention Basin dischargesampling locations, Livermore site, 1999 ................................................ 7- 7
Figure 7-3. Surface water flow in the vicinity of Site 300 ......................................... 7- 9
Figure 7-4. Annual median gross alpha concentrations in Livermore sitestorm water compared with the maximum contaminant level(MCL) ........................................................................................................... 7-12
Figure 7-5. Annual median gross beta concentrations in Livermore sitestorm water compared with the maximum contaminant level(MCL) ........................................................................................................... 7-13
Figure 7-6. Annual median tritium concentrations in Livermore site stormwater compared with the maximum contaminant level (MCL).......... 7-14
Figure 7-7. Median tritium concentrations in storm water runoff at theLivermore site, 1999 ................................................................................... 7-16
Figure 7-8. Rain sampling locations, Livermore site and Livermore Valley,1999............................................................................................................... 7-20
Figure 7-9. Trends of median tritium activity in rain and total stackemissions of HTO from the Livermore site andSandia/California, 1989–1999................................................................... 7-22
Figure 7-10. Sampling locations within the Drainage Retention Basin, 1999 .......... 7-24
Figure 7-11. Monthly average dissolved oxygen vs. temperature at eachdepth location in the Drainage Retention Basin, 1999 .......................... 7-27
Figure 7-12. Monthly average dissolved oxygen concentration variationsfrom the beginning of Drainage Retention Basin operations............... 7-28
Figure 7-13. Monthly average seasonal temperature variation measured atsample top, middle, and bottom levels from the start ofoperations in 1993 ...................................................................................... 7-29
Figure 7-14. Cooling tower locations and receiving water monitoringlocations, Site 300, 1999 ............................................................................. 7-31
Figure 7-15. Surface and drinking water sampling locations, LivermoreValley, 1999 ................................................................................................. 7-35

List of Figures
LLNL Environmental Report for 1999 xix
Figure 8-1. Map and cross section of the Livermore site showinghydrostratigraphic units and the locations of the treatmentplants ............................................................................................................ 8-3
Figure 8-2 Total VOC mass removed from the subsurface of the Livermoresite, 1989–1999 ............................................................................................. 8-5
Figure 8-3. Isoconcentration contour map of total VOCs within HSU 1B ............. 8-6
Figure 8-4. Isoconcentration contour map of total VOCs within HSU 2................ 8-7
Figure 8-5. Isoconcentration contour map of total VOCs within HSU 3A ............ 8-8
Figure 8-6. Isoconcentration contour map of total VOCs within HSU 3B ............. 8-9
Figure 8-7. Isoconcentration contour map of total VOCs within HSU 4................ 8-10
Figure 8-8. Isoconcentration contour map of total VOCs within HSU 5................ 8-11
Figure 8-9. Environmental restoration study areas at Site 300 ................................ 8-22
Figure 8-10. Site 300 stratigraphy (Webster-Scholten 1994) ....................................... 8-23
Figure 8-11. Approximate ground water elevations in the principalcontinuous water-bearing zone at Site 300 ............................................. 8-25
Figure 8-12. Extent of ground water contamination at Site 300 ................................ 8-28
Figure 8-13. Total VOC concentrations in ground water in the eastern GSAand vicinity (fourth quarter, 1999) ........................................................... 8-30
Figure 8-14. Total VOC concentrations in ground water in the central GSA(fourth quarter, 1999) ................................................................................. 8-31
Figure 8-15. Distribution of total VOCs in ground water in the Qt-Tpsghydrologic unit at the Building 834 complex (second quarter,1999) ............................................................................................................. 8-33
Figure 8-16. Trichloroethene (TCE) isoconcentration contour map in theTnbs2 aquifer in the HE Process Area (fourth quarter, 1999).............. 8-34
Figure 8-17. Distribution of tritium in ground water in the first water-bearing zone in the Building 850/Pits 3 and 5 area (secondquarter, 1999) .............................................................................................. 8-35
Figure 8-18. Distribution of TCE in ground water in the Building 854 area(second quarter, 1999) ................................................................................ 8-38
Figure 8-19. Distribution of TCE in ground water in the Pit 6 area (fourthquarter, 1999) .............................................................................................. 8-39
Figure 8-20. Distribution of TCE in ground water in the Building 832Canyon (fourth quarter, 1999) .................................................................. 8-40
Figure 9-1. Locations of off-site tritium monitoring wells in the LivermoreValley............................................................................................................ 9-3

List of Figures
xx LLNL Environmental Report for 1999
Figure 9-2. Locations of routine surveillance ground water monitoringwells at the Livermore site ........................................................................ 9-5
Figure 9-3. Locations of surveillance ground water wells, Barcads, andsprings at Site 300 ....................................................................................... 9-8
Figure 9-4. Locations of compliance ground water monitoring wells, Pit 7complex ........................................................................................................ 9-10
Figure 9-5. Locations of Pit 2 surveillance Barcads (K1-02A, K2-01A, K2-01B,and K2-02A) and surveillance well K2-02B, and Pit 1 complianceground water monitoring wells (K1-01C, -07, -02B, -03, -04, -05,-08, and -09) ................................................................................................. 9-12
Figure 9-6. Locations of surveillance ground water monitoring wells, Pit 8,1999............................................................................................................... 9-13
Figure 9-7. Locations of surveillance ground water monitoring wells, Pit 9,1999............................................................................................................... 9-14
Figure 9-8. Locations of Pit 6 ground water monitoring wells ................................ 9-16
Figure 9-9. Locations of monitoring wells in Building 829 closed burnfacility area .................................................................................................. 9-17
Figure 9-10. Locations of compliance ground water monitoring wells in theExplosives Process Area ............................................................................ 9-20
Figure 9-11. Sewage evaporation and percolation ponds, compliance groundwater monitoring wells, and wastewater monitoring locations.......... 9-21
Figure 10-1. Surface soil sampling locations, Livermore Valley, 1999 ..................... 10-3
Figure 10-2. Site 300 surface soil sampling locations, 1999 ........................................ 10-4
Figure 10-3. Sediment and vadose zone sampling locations on or near theLivermore site, 1999 ................................................................................... 10-5
Figure 10-4. Median plutonium-239+240 activities in surface soils, 1976–1999...... 10-10
Figure 10-5. Uranium-238 concentrations in surface soils, 1976–1999 ..................... 10-12
Figure 11-1. Livermore site and Livermore Valley vegetation samplinglocations, 1999 ............................................................................................. 11-3
Figure 11-2. Site 300 vegetation sampling locations, 1999 ......................................... 11-4
Figure 11-3. Median tritium concentrations in Livermore site and LivermoreValley plant water samples, 1971–1999 ................................................... 11-7
Figure 11-4. Mean tritium concentrations in retail wines decay-correctedfrom the sampling year to the vintage year............................................ 11-9
Figure 11-5. Median tritium concentrations in plant water at Site 300sampling locations, 1971–1999 ................................................................. 11-10
Figure 12-1. Gamma dosimeter locations, Livermore site, 1999................................ 12-3

List of Figures
LLNL Environmental Report for 1999 xxi
Figure 12-2. Gamma dosimeter locations, Livermore Valley, 1999 .......................... 12-4
Figure 12-3. Gamma dosimeter locations, Site 300 and vicinity, 1999 ..................... 12-5
Figure 12-4. Quarterly gamma dose measurements at the Livermore siteperimeter, Livermore Valley, and Site 300, 1988–1999 ......................... 12-6
Figure 13-1. Annual dose to the site-wide maximally exposed individualmember of the public, 1990 to 1999 ......................................................... 13-22
Figure 13-2. Typical annual radiation doses from natural and man-madesources ......................................................................................................... 13-30
Figure 14-1 Ground water uranium-234+233 concentrations from collocatedsamples ........................................................................................................ 14-9
Figure 14-2 Air tritium concentrations from collocated samples showing anoutlier ........................................................................................................... 14-11
Figure 14-3 Sewer gross alpha concentrations from collocated samplesshowing a lot of scatter .............................................................................. 14-12


LLNL Environmental Report for 1999 xxiii
List of Tables
Table 1-1. Wind rose data for LLNL’s Livermore site at the 10-m level for1999............................................................................................................... 1-6
Table 1-2. Wind rose data for LLNL’s Site 300 at the 10-m level for 1999 ........... 1-8
Table 2-1. Summary of LLNL compliance with EPCRA in 1999 ........................... 2-7
Table 2-2. Livermore site, SARA, Title III, Section 311, Chemical List, 1999 ....... 2-8
Table 2-3. Site 300, SARA, Title III, Section 311, Chemical List, 1999 ................... 2-9
Table 2-4. Summary of permits active in 1999 ......................................................... 2-10
Table 2-5a. Inspections and tours of the Livermore site by external agenciesin 1999 .......................................................................................................... 2-12
Table 2-5b. Inspections and tours of Site 300 by external agencies in 1999............ 2-12
Table 2-6. Summary of NPDES permit nonconformance ....................................... 2-15
Table 2-7. Summary of streambed alteration agreements, 404 nationwidepermits, and 401 waivers or WDRs ......................................................... 2-17
Table 2-8. Summary of in-service tanks, December 31, 1999 ................................. 2-18
Table 2-9 Tabulation of environmental occurrences reported under theOccurrence Reporting System, 1999 ........................................................ 2-27
Table 3-1. UC Contract 48 environmental protection performance measuresfor environmental performance in 1998.................................................. 3-8
Table 3-2. Routine waste generation totals (tons), 1993–1999 ................................ 3-10
Table 3-3. Routine waste reduction, 1999 ................................................................. 3-11
Table 3-4. Nonhazardous landfill totals (tons), 1999 ............................................... 3-11
Table 3-5. Diverted waste totals (tons), 1996–1999 .................................................. 3-12
Table 3-6. Waste diversion summary table, 1999..................................................... 3-12
Table 3-7. Nonhazardous solid waste summary table, 1990–2000 ........................ 3-14
Table 3-8. Major high return-on-investment projects, 1999 ................................... 3-16
Table 3-9. EPD training courses ................................................................................. 3-21
Table 4-1. Air effluent sampling locations and sampling systems........................ 4-5
Table 4-2. Measured radiological air effluent emissions for the Livermoresite, 1999....................................................................................................... 4-8
Table 4-3. Nonradioactive air emissions, Livermore site and Site 300, 1999 ....... 4-10
Table 5-1. Air sampling locations listed by monitoring network.......................... 5-2

List of Tables
xxiv LLNL Environmental Report for 1999
Table 5-2. Gross alpha and gross beta concentration in air particulatesamples summarized by month, 1999 ..................................................... 5-9
Table 5-3. Gamma activity in air particulate samples, Livermore siteperimeter and Site 300, 1999 ..................................................................... 5-13
Table 5-4. Plutonium-239+240 activity in air particulate samples(10–9 Bq/m3), 1999 ..................................................................................... 5-14
Table 5-5. Uranium mass concentration in air particulate samples, 1999 ............ 5-17
Table 5-6. Tritium in air samples (10–3 Bq/m3), 1999 ............................................. 5-19
Table 5-7. Beryllium in air particulate samples (pg/m3), Livermore siteperimeter and Site 300 locations, 1999 .................................................... 5-20
Table 6-1. LLNL’s internal discharge guidelines for pollutants inwastewaters ................................................................................................. 6-4
Table 6-2. Permit discharge limits for nonradioactive pollutants inwastewaters at point of discharge into LLNL sewer ............................ 6-7
Table 6-3. Estimated total radioactivity in LLNL sanitary sewer effluent,1999............................................................................................................... 6-9
Table 6-4. Tritium in sanitary sewer effluents (Bq/mL), LLNL and LWRP,1999............................................................................................................... 6-10
Table 6-5. Cesium and plutonium in sanitary sewer effluents, LLNL andLWRP, 1999 ................................................................................................. 6-12
Table 6-6. Radioactive liquid effluent releases from the Livermore site,1990–1999 ..................................................................................................... 6-15
Table 6-7. Average monthly results for regulated metals in LLNL sanitarysewer effluent (mg/L), 1999 ..................................................................... 6-17
Table 6-8. Monthly monitoring results for physical and chemicalcharacteristics of the LLNL sanitary sewer effluent, 1999.................... 6-21
Table 7-1. Analyses conducted on storm water samples, 1999.............................. 7-2
Table 7-2. Fish chronic toxicity test results, Livermore site, 1999 ......................... 7-11
Table 7-3. Radioactivity in storm water runoff (Bq/L), Livermore site, 1999 ..... 7-12
Table 7-4. Nonradioactive constituents above comparison criteria in stormwater runoff, Livermore site, 1999 ........................................................... 7-18
Table 7-5. Tritium activities in rainfall for the Livermore site and LivermoreValley, 1999 ................................................................................................. 7-21
Table 7-6. Summary of Drainage Retention Basin monitoring exceedingmanagement action levels at sampling location CDBE ........................ 7-26
Table 7-7. Summary data from compliance monitoring of primary coolingtowers, Site 300, 1999 ................................................................................. 7-32

List of Tables
LLNL Environmental Report for 1999 xxv
Table 7-8. Summary data from operational monitoring of primary coolingtowers, Site 300, 1999 ................................................................................. 7-32
Table 7-9. Radioactivity in surface and drinking water in the LivermoreValley, 1999 ................................................................................................. 7-36
Table 8-1. Volatile organic compounds (VOCs) removed from groundwater and soil at the Livermore site ........................................................ 8-4
Table 8-2. 1999 extraction wells and extraction rates .............................................. 8-12
Table 8-3. Wells installed in 1999 .............................................................................. 8-13
Table 8-4. Major contaminants of concern found in soil, rock, and groundwater at Site 300 .......................................................................................... 8-21
Table 8-5. Volatile organic compounds (VOCs) removed from groundwater and soil vapor at Site 300................................................................ 8-41
Table 8-6. General Services Area ground water treatment system surfacedischarge permit requirements ................................................................ 8-44
Table 9-1. Concentration ranges for three major anions in background andwestern perimeter monitoring wells ....................................................... 9-24
Table 10-1. Summary of surface soil and sediment radioanalytical data, 1999..... 10-7
Table 10-2. Special soil studies ..................................................................................... 10-13
Table 11-1. Concentrations of tritium in plant water (Bq/L), 1999 ......................... 11-6
Table 11-2. Tritium in retail wine (Bq/L), 1999.......................................................... 11-8
Table 12-1. Summary of dose calculations for gamma-monitoring locations(mSv) at all LLNL sites, 1999 ................................................................... 12-5
Table 12-2. Annual dose by year at the Livermore site perimeter caused bydirect gamma radiation ............................................................................. 12-7
Table 13-1. Sources of radiation dose from LLNL releases (measured andpotential) to air: stacks and other exhaust pathways frombuildings containing radiological operations and diffuse areasources ......................................................................................................... 13-15
Table 13-2. Doses (µSv) calculated for the SW-MEI for the Livermore site andSite 300, 1990 to 1999 .................................................................................. 13-20
Table 13-3. Annual dose to the SW-MEI from explosives experiments onfiring tables at Site 300, 1990–1999, related to the total quantity ofdepleted uranium used in the experiments and the total quantityof high explosives driving the detonations ............................................ 13-21
Table 13-4. Major contributors to LLNL’s radiation dose via airborneemissions, 1999............................................................................................ 13-21
Table 13-5. Comparison of background (natural and man-made) and LLNLradiation doses, 1999.................................................................................. 13-24

List of Tables
xxvi LLNL Environmental Report for 1999
Table 14-1. Quality assurance duplicate sampling. Summary statistics foranalytes with more than eight pairs in which both results wereabove the detection limit ........................................................................... 14-5
Table 14-2. Quality assurance duplicate sampling. Summary statistics forselected analytes with eight or fewer pairs in which both resultswere above the detection limit ................................................................. 14-7
Table 14-3. Quality assurance duplicate sampling. Summary statistics foranalytes with at least four pairs in which one or both results werebelow the detection limit........................................................................... 14-8
Table 14-4. Sampling completeness in 1999, Livermore site and Site 300.............. 14-13

LLNL Environmental Report for 1999 EX-1
Executive Summary
Jennifer M. LarsonArthur H. Biermann
Introduction
Lawrence Livermore National Laboratory (LLNL), a U.S. Department of Energy (DOE)facility operated by the University of California (UC), serves as a national resource ofscientific, technical, and engineering capabilities. The Laboratory’s mission focuseson nuclear weapons and national security, and over the years has been broadened toinclude areas such as strategic defense, energy, the environment, biomedicine, tech-nology transfer, the economy, and education. The Laboratory carries out this missionin compliance with local, state, and federal environmental regulatory requirements.It does so with the support of the Environmental Protection Department, which isresponsible for environmental monitoring and analysis, hazardous waste management,environmental restoration, and assisting Laboratory organizations in ensuring compli-ance with environmental laws and regulations.
LLNL comprises two sites: the Livermore site and Site 300. The Livermore site occupiesan area of 3.28 square kilometers on the eastern edge of Livermore, California. Site 300,LLNL’s experimental testing site, is located 24 kilometers to the east in the AltamontHills and occupies an area of 30.3 square kilometers. Meteorological and environmentalmonitoring activities are conducted at both sites as well as in surrounding areas.
This summary provides an overview of LLNL’s environmental activities in 1999,including radiological and nonradiological surveillance, effluent and compliancemonitoring, remediation, assessment of radiological releases and doses, and determi-nation of the impact of LLNL operations on the environment and public health.
Environmental Monitoring Results
During 1999, the Environmental Protection Department sampled air, sewerable water,surface water, ground water, soil and sediment, and vegetation and foodstuff. Sampleswere analyzed for radioactive and nonradioactive substances using (1) standard methodsapproved by the U.S. Environmental Protection Agency (EPA), (2) special systems suchas the continuous monitoring system for Livermore site sewage, or (3) special analyticaltechniques designed to measure very low levels of radionuclides. Environmental

Executive Summary
EX-2 LLNL Environmental Report for 1999
radiation was also measured directly using dosimeters. More than 13,000 environmentalsamples were taken, and more than 250,000 analytical results were obtained.
Air Monitoring
Air was monitored for various airborne radionuclides (including particles and tritiatedwater vapor) and beryllium at the Livermore site, Site 300, and off-site locationsthroughout the Livermore Valley and Tracy areas. Concentrations of all monitoredradionuclides and beryllium at all of these locations were well below levels that wouldendanger the environment or public health, according to current regulatory standards.For example, in 1999, the highest median plutonium concentration for samples collectedat any air monitoring station was 0.0036% of the federal Derived Concentration Guide(DCG). The DCG specifies the concentration of radionuclides in air or water that couldbe inhaled or ingested continuously 365 days a year without exceeding the DOEradiation protection standard for the public. Median concentrations of tritiated watervapor collected at Livermore Valley sampling locations showed a highest median valueof 0.001% of the DCG, while the highest median values on the Livermore site perimeterand within the site boundaries were, respectively, 0.004% and 0.1% of the DCG. Thehighest median concentrations of beryllium on the Livermore site and Site 300 were0.11% and 0.13%, respectively, of the guideline level established by the Bay Area AirQuality Management District and the EPA and are representative of naturally occurringlevels.
Stack Air Effluent Monitoring
In 1999, LLNL operated 101 samplers for measuring radioactivity in air effluent at eightfacilities at the Livermore site. These samplers extracted a measured volume of air fromthe exhaust stack of a facility or process and collected particles or vapor in a collectionmedium. Measured radiological air emissions from Livermore site operations remainedwell below levels of health and environmental concern. Building 331 emissionsaccounted for 96% of the estimated total tritium emissions from the site in 1999; emis-sions from this facility remained at a level far below those of the 1980s and causedpublic dose impacts far below levels allowed by regulatory standards. Radionuclideemissions from the other monitored facilities were very low.
Nonradioactive air emissions from exempt and permitted sources at LLNL were quitesmall and typical of values in previous years. For example, total emission of nitrogenoxides from the Livermore site in 1999 was 81 kg per day, which is 0.06% of the quantityof this air pollutant released daily over the entire San Francisco Bay Area; corresponding

Executive Summary
LLNL Environmental Report for 1999 EX-3
numbers for reactive organics were 24 kilograms per day and 0.02%. The total emissionof criteria air pollutants (nitrogen oxides, volatile organics, sulfur oxides, particulatematter, carbon monoxide, and lead) was 140 kilograms per day for the Livermore siteand about 6 kilograms per day for Site 300.
Sewerable Water Monitoring
Discharges of radioactive and hazardous material to the combined sanitary andindustrial sewer at the Livermore site are controlled by use of administrative andengineering controls, including limiting the disposal of those materials and routingsome discharged material to retention tanks for later characterization and treatment.Flow-proportional and instantaneous samples of the site’s wastewater are regularlycollected and analyzed (for metals, radioactivity, toxic chemicals, and water-qualityparameters) to ensure that LLNL’s sewage effluent meets the requirements of thepermit granted by the City of Livermore. In addition, the site effluent is monitoredcontinuously for pH, regulated metals, and radioactivity. If concentrations are detectedabove warning levels, an alarm sounds and the effluent is automatically contained byLLNL’s sewer diversion system. The diversion system captures all but the initialminutes of wastewater flow that causes an alarm, thereby protecting the LivermoreWater Reclamation Plant (LWRP) and minimizing any required cleanup. With the 1998addition of a new monitoring and diversion capability for pH, even the initial minutesof a pH-related release are contained on site.
In 1999, the Livermore site discharged an average of 1.0 million liters per day of waste-water to the City of Livermore sewer system, an amount that constituted 4.4% of thetotal flow to the system (about 13% of the Livermore site effluent was generated bySandia National Laboratories/California). The Livermore site’s sanitary sewer effluentwas monitored continuously and sampled daily, weekly, and monthly to satisfy variouspermit compliance requirements.
LLNL achieved 100% compliance during 1999 with LWRP wastewater discharge permitlimits. Similarly, no sewer releases exceeded discharge limits for radioactive materialsduring 1999.
Surface Water Monitoring
Surface water sampling and analysis are a large part of the LLNL surveillance andcompliance monitoring effort for the Livermore site, Site 300, and their surroundingareas. The waters monitored include storm water runoff, rainfall, water in the
Executive Summary
EX-4 LLNL Environmental Report for 1999
Livermore site Drainage Retention Basin, wastewater discharges from cooling towersat Site 300, and a variety of other water that includes off-site reservoirs and ponds,drinking water taps both on and off site, and the Livermore site swimming pool.Overall, the surface water monitoring data indicate compliance with establishedregulatory limits and negligible impact on the environment.
Radioactivity detected in the storm water was all at small percentages of the levelsallowed in drinking water (referred to as the maximum contaminant level, or MCL).The maximum tritium concentration in storm water effluent at the Livermore site was17% of the MCL. Plutonium was not detected in the liquid phase of any storm watersamples. The sediment phase of one sample contained a low concentration ofplutonium, which is consistent with worldwide fallout and naturally occurringconcentrations.
Chemical monitoring of Livermore site storm water showed that concentrations ofseveral metals were higher in effluent samples than influent samples. Acute and chronicfish toxicity tests conducted on Livermore site storm water demonstrated no toxicity tothe test species. Allowable lead concentration was slightly exceeded in one release fromthe Drainage Retention Basin. Site 300 storm water contained levels of specific conduc-tance and total suspended solids higher than comparison criteria; however, theseeffluent levels were lower than the off-site background levels. Sampling results from theSite 300 cooling towers effluent indicated compliance with all limits with the exceptionof one high flow measurement that was the result of a malfunctioning mechanical valve.
Tritium measurements in rain showed a slight increase in 1999 over the measurementsin 1998. The maximum on-site measurement in 1999 was 73% of the MCL. In drinkingwater sources, the maximum tritium concentration was less than 0.05% of the MCL.
Ground Water Monitoring
Ground water in the Livermore Valley and the Altamont Hills is monitored to assess theprogress of remediation efforts in areas of known contamination, to test the impact ofLLNL operations on local water sources, and to comply with numerous federal, state,and local permits. Ground water samples are routinely measured for tritium, uranium,and other radioisotopes; gross radioactivity; toxic metals; a wide range of organicchemicals; and other general contaminant indicators. Special consideration is given tomonitoring those dissolved elements and organic compounds that are known to be toxicin trace amounts.

Executive Summary
LLNL Environmental Report for 1999 EX-5
The impact of Livermore site and Site 300 operations on off-site ground water continuedto be minimal in 1999. In the Livermore Valley, no monitored radioactive or inorganicnonradioactive constituent was found to exceed primary drinking water MCLs in anyoff-site well. In on-site wells, chromium and nitrates have been detected above theprimary MCLs, but these constituents have not migrated off site at levels above theprimary MCL. The maximum tritium activity detected in any sample of ground watermeasured in the Livermore Valley was 1.4% of the MCL, as measured at an on-sitelocation. At Site 300, tritiated water and depleted uranium have been released toground water from landfills and firing tables, but the boundaries of the slowly movingground water plumes lie entirely within site boundaries. The shallow ground waterbeneath Site 300 contains volatile organic compounds (VOCs), tritium, nitrate, Freon,perchlorate, and depleted uranium, but it presents no current health risks because thiscontaminated water is not used as a potable water supply for domestic, industrial, oragricultural use. LLNL works with the regulatory agencies to contain or clean upground water contamination where needed.
Soil and Sediment Monitoring
The impact of Laboratory operations on soil and sediment at the Livermore site in 1999was insignificant and unchanged from previous years. The highest level of plutonium(isotopes 239 and 240) measured at the LWRP represented 1.9% of the EPA preliminaryremediation goal for commercial or industrial sites. Other constituents of concern weremeasured at background or trace concentrations or were below the limit of detection.At Site 300, the concentrations of radionuclides and beryllium in soil samples weregenerally representative of background or naturally occurring levels, as in previousyears. Elevated concentrations of uranium-238 found in Site 300 soils in 1999 wereattributed to contamination by debris from firing-table experiments.
Sampling of the vadose zone, carried out as part of the Livermore Ground WaterManagement Program, showed that ground water on the Livermore site is not beingaffected by contaminants carried in storm water.
Soil was sampled at Big Trees Park in Livermore during August and September of 1998to provide information about the vertical and lateral distribution of plutonium in thesoil, the pathway by which plutonium got to the park, and the distribution of plutoniumin areas of public concern. All sample results indicated that plutonium concentrationswere below the risk-based preliminary remediation goal for residential areas. In aJanuary 2000 report, the Agency for Toxic Substances and Disease Registry (ATSDR)stated that the use of plutonium-contaminated sewage sludge as a soil amendment wasthe most credible pathway by which plutonium reached the park. The EPA, the

Executive Summary
EX-6 LLNL Environmental Report for 1999
California Department of Health Services, and ATSDR all concurred that there was nounacceptable risk to human health or the environment from the levels of plutoniumpresent at Big Trees Park.
Vegetation and Foodstuff Monitoring
LLNL impacts on vegetation and food in the Livermore Valley remained minimalin 1999. Tritium, which is the only measurable radionuclide in the vegetation andfoodstuff monitoring program, was estimated to be well below levels of concern, evenwhen organically bound tritium was taken into account. In 1999, tritium concentrationsin wines from the Livermore Valley, California, and Europe are within the range ofthose reported in previous years and remain low in wines from all areas. Even thehighest detected tritium value in Livermore Valley wine represented only 1.1% of theamount of tritium that EPA allows in drinking water (no health standards exist forradionuclides in wine).
Radiological Dose Assessment
Radiological dose-assessment modeling—using conservative EPA-mandated computermodels, actual LLNL meteorology, population distributions appropriate to the two sites,and 1999 radionuclide usage inventory and monitoring data—was conducted this pastyear for key facilities. Emissions from more than 200 points were reported in 1999.These sources were of several types: stacks and other exhaust pathways from buildings,diffuse area sources generally external to buildings, and open-air firing tables at Site 300where explosives experiments were conducted.
LLNL reports public doses resulting from air releases of radionuclides during routineoperations and from accidents. The principal exposure pathways taken into account areinternal exposures from inhalation of air and ingestion of foodstuff and drinking watercontaminated by the air releases. Releases of radioactivity from LLNL via water do notdirectly contribute to the public dose because this water is not used as a potable watersupply for domestic, industrial, or agricultural use.
The most significant radiological effluent for the Livermore site from the standpointof public dose continues to be tritium, the radioactive isotope of hydrogen. The calcu-lated total potential dose for the sitewide maximally exposed individual (SW-MEI),(i.e., a hypothetical member of the public having the greatest possible exposure fromLivermore site operations in 1999) was 1.0 microsievert (0.1 millirem). This result wascalculated based on LLNL’s standard assumptions regarding potential public dose

Executive Summary
LLNL Environmental Report for 1999 EX-7
caused by tritium releases. In 1998, the EPA mandated that LLNL’s complianceevaluations use a more conservative assumption, in which gaseous tritium must betreated as though it were tritiated water vapor. This translates to a higher calculateddose of 1.20 microsievert (0.12 millirem) to the SW-MEI. Trends in this SW-MEI dosefor the Livermore site over the last eight years show levels in the range 1.0 to0.4 microsievert per year (0.1 to 0.04 millirem per year), down from 2.40 microsievertper year (0.24 millirem per year) in 1990. These small radiation quantities exhibitlarge percentage but small absolute value fluctuations from year to year.
At Site 300, depleted uranium (containing isotopes with atomic weights 238, 235, and234) remains by far the principal contributor to off-site dose. The calculated totalpotential dose to the SW-MEI during 1999 was 0.35 microsievert (0.035 millirem). Thisis well within the range of doses calculated over the past 10 years.
Conservatively calculated radiological doses to the maximally exposed public indi-viduals from Livermore site and Site 300 emissions amounted to about 1.0% (1.2% usingEPA assumptions) and 0.35%, respectively, of the EPA National Emission Standards forHazardous Air Pollutants regulatory standard. These doses are a small fraction (about1/2500) of the doses received by these populations from natural background radiation.Thus, the potential radiological doses from LLNL operations in 1999 were well withinregulatory limits and were very small compared with doses from natural backgroundradiation sources.
Environmental Compliance and Program Activities
LLNL works to ensure that its operations comply with all environmental laws andfederal, state, and local regulatory guidelines. Many activities related to water, air,waste, waste reduction, community “right to know,” and other environmental issueswere addressed in 1999.
Ground Water Remediation
As a Superfund site, LLNL continued to treat ground water at both the Livermore siteand Site 300 under the jurisdiction of the Comprehensive Environmental Response,Compensation and Liability Act. LLNL’s primary treatment method to remediatecontaminated ground water is pump-and-treat technology. In 1999, nearly 270 kilogramsof VOCs were removed from 1.1 billion liters of ground water and 20,000 cubic meters ofwater vapor from soil at the Livermore site. These efforts at control and remediationhave reduced VOC concentrations throughout the site and reduced plume sizes.

Executive Summary
EX-8 LLNL Environmental Report for 1999
New treatment facilities were added to the Treatment Facility A (TFA) and TF5475areas. TFA-East, which began operating in 1999, consists of one extraction well. Aportable solar-powered unit treats the extracted ground water. Vapor TreatmentFacility (VTF) 5475, which began operation in early 1999, extracts soil vapor from thevadose zone using a vapor extraction system. The soil vapor is processed using granu-lated activated carbon. Because of elevated tritium concentrations in the vadose zone,VTF5475 was designed as a closed-loop system. Following removal of VOCs from theprocess air stream, the tritiated vapor is reinjected into the subsurface at a soil vaporinlet well, and no effluent vapor is released to the atmosphere.
Significant progress was also made at Site 300, where 39 kilograms of VOCs wereremoved from soil and ground water. In addition to the three treatment facilities, whichoperated throughout the year, three new treatment facilities were constructed and beganoperation in 1999. In the Eastern General Services Area, the plume of high (>500 partsper billion) trichloroethene (TCE) concentrations has been restricted to the Site 300property. It had previously extended more than 1600 m beyond the site boundarybefore the treatment facility started up in 1991. With only a few minor exceptions,treated ground water discharges and VOCs vented to air were within permit limitsduring 1999.
Waste Minimization and Pollution Prevention
LLNL continues to employ a weighted ranking system to prioritize and evaluate itswaste streams. Cost, type of waste, and operational aspects are emphasized rather thansimple considerations of total waste volume. Transuranic and transuranic-mixed andlow-level wastes continue to be of highest priority for LLNL even though their relativequantities are low.
Comparing 1999 with the 1993 baseline, levels of waste in three of the four categories—radioactive, hazardous, and mixed—have decreased by more than the 50% specified inLLNL’s contract with UC. The total waste diverted from landfills in 1999 was more than47,000 tons, comparable to the 1998 total. Although LLNL has not yet achieved a 33%reduction goal for routine nonhazardous waste, its recycling percentage fornonhazardous waste was 89% in 1999.
The Laboratory has a Chemical Exchange Warehouse (CHEW) that enables employeesto locate needed chemicals already on site. By reducing the need to buy new chemicals,production of waste is minimized. Employees can use ChemTrack, LLNL’s computerized

Executive Summary
LLNL Environmental Report for 1999 EX-9
chemical inventory system, to search for chemicals in CHEW. In 1999, ChemTracktracked 176,000 chemicals through the use of bar codes, hand-held bar code laserscanners, and customized software.
Air, Wastewater, and Water Compliance
LLNL continued to perform all activities necessary to comply with clean air and cleanwater requirements. In 1999, the Bay Area Air Quality Management District issued orrenewed 137 operating permits for the Livermore site. The San Joaquin Valley UnifiedAir Pollution Control District issued or renewed 47 permits for Site 300 operations.LLNL has permits for underground and aboveground storage tanks and for dischargeof treated ground water, industrial and sanitary sewage, and storm water. Site 300 hasadditional permits for inactive landfills, cooling tower discharges, operation of thesewer lagoon, septic tanks, and leach fields. The Laboratory complies with allrequirements for self-monitoring and inspections associated with these permits.
Endangered Species
LLNL meets the requirements of both the U.S. Endangered Species Act and theCalifornia Endangered Species Act as they pertain to endangered or threatened speciesand other species of special concern that may exist or are known to exist at the LLNLsites. In 1999, biological assessment surveys were performed for special-status speciesat 76 LLNL project construction (ground disturbance) areas. Although no active SanJoaquin kit fox dens were discovered, 10 occupied American badger dens were found.In addition, 18 active burrowing owl dens were discovered at Site 300; the owls weremarked with leg bands to initiate long-term studies, monitoring, and conservation of thespecies. A population of the federal candidate species California tiger salamander(Ambystoma tigrinum) was monitored, and a Livermore site population of the federallythreatened red-legged frog (Rana aurora draytonii) was monitored and protected. Alsoat the Livermore site, three separate pairs of white-tailed kites (Elanus lecurus), a state-protected raptor, successfully nested and fledged 18 young.
Two of the three known natural populations of the large-flowered fiddleneck (Amsinckiagrandiflora), a federally listed endangered plant species, occur at Site 300, where aportion of the site has been designated as critical habitat for the plant. In spite ofattempts to reduce competing grass in 1998, the number of native plants continued todecline in 1999. Investigations into the use of controlled burns and rodent predation onseed population are currently planned.

Executive Summary
EX-10 LLNL Environmental Report for 1999
Monitoring of the big tarplant (Blepharazonia plumosa), a California Native Plant Society“rare” plant, and the Diamond-petaled poppy (Eschscholzia rhombipetala), a plantpreviously thought to be extinct, continued in 1999. The big tarplant continued to bewidespread throughout Site 300, although the individual populations were reduced insize. A total of nine Diamond-petaled poppy plants were located; of these, six plantsproduced seed-bearing pods.
Environmental Occurrences
Notification of environmental occurrences at the Laboratory is required by a number ofenvironmental laws, regulations, and DOE orders. LLNL responded to four incidentsthat required federal and/or state agency notification during 1999. None of thesecaused adverse impact to human health or the environment.
Work Smart Standards
In 1997, LLNL and DOE’s Oakland Operations Office inaugurated a Work SmartStandard (WSS) process. As part of this process, safety and environmental professionalsfrom both organizations identified environment, safety, and health hazards and estab-lished standards of operation to protect the public, workers, and the environment fromthese hazards. WSSs were implemented in 1999 and include more than 250 require-ments directly related to the environment.
Conclusion
The current techniques LLNL uses for environmental monitoring are very sensitive,allowing detection of extremely low levels of constituents. The combination of surveil-lance and effluent monitoring, source characterization, and computer modeling showsthat radiological doses to the public caused by LLNL operations are less than 1% ofregulatory standards and are about 2500 times smaller than the doses received fromnatural background radiation. The analytical results and evaluations generally showcontinuing low contaminant levels, reflecting the responsiveness of the Laboratory incontrolling pollutants.
In 1999, LLNL successfully engaged in environmental compliance activities related towater, air, waste, waste reduction, and other environmental issues. Some key examplesinclude ground water remediation activities that restricted a high TCE plume at Site 300,

Executive Summary
LLNL Environmental Report for 1999 EX-11
waste minimization efforts that reduced the amount of waste generated in LLNLoperations, and recycling efforts that diminished the quantity of waste sent to landfills.Actions to protect endangered species at both LLNL sites continued on several fronts.
In summary, the results of the 1999 environmental programs demonstrate that LLNL iscommitted to protecting the environment and ensuring that its operations are conductedin accordance with applicable federal, state, and local laws and regulations. Theenvironmental impacts of LLNL operations are minimal and pose no threat to the publicor the environment.


1
LLNL Environmental Report for 1999 1-1
Site Overview
Introduction
Meteorology and geography play primary roles in how the environment is affected byhuman actions. Dispersal of particles in air, for example, is influenced by the windand rain, which in turn are influenced by geographical characteristics. Similarly, themovement of ground water is constrained by the particular geology of a site. Thus,knowledge of wind, rainfall, geology, and geographical characteristics is used to modelthe effects that operations at Lawrence Livermore National Laboratory might have onthe surrounding environment. Some history and a description of these characteristicshelp us understand the importance of the Laboratory’s meteorological and geographicsetting.
Operations
Lawrence Livermore's mission is to apply science and technology in the nationalinterest, with a focus on global security, global ecology, and bioscience. Laboratoryemployees are working with industrial and academic partners to increase nationaleconomic competitiveness and improve science education. The Laboratory's missionis dynamic and has changed over the years to meet new national needs.
LLNL is a full-service research laboratory with the infrastructure—engineering,maintenance, and waste management activities, as well as security, fire, and medicaldepartments—necessary to support its operations and about 8700 personnel.
Location
LLNL consists of two sites—the main laboratory site located in Livermore, California(Livermore site) in Alameda County, and the Experimental Test Site (Site 300) locatednear Tracy, California, in San Joaquin and Alameda counties (Figure 1-1). Each site isunique, requiring a different approach for environmental monitoring and protection.

1 Site Overview
1-2 LLNL Environmental Report for 1999
Livermore
Modesto
San FranciscoOakland
Pacific Ocean
Santa Cruz
San Jose
Tracy
Livermore site
Stockton
Sacramento
80
101
101
99
5
880
580
680
17
101
5
99
280
Site 300
0 5 10
0 5 10Scale: Kilometers
Scale: Miles
N
Figure 1-1. Locations of LLNL Livermore site and Site 300.
LLNL was founded at the Livermore site in 1952 at a former U.S. Navy training base. At that time the location was relatively isolated, being approximately 1.6 km from theLivermore city limits. Over time, Livermore evolved from a small town of fewer than7000 people when the Laboratory began to its present population of about 74,300. The economy, which had been primarily agricultural, diversified to include lightindustry and business parks. Within the last few years, low-density, single-family

Site Overview 1
LLNL Environmental Report for 1999 1-3
residential developments have begun to fill the formerly vacant fields. Livermoreresidences are now near LLNL’s western boundary.
LLNL’s Livermore site occupies an area of 3.28 km2, including the land that serves as abuffer zone around the site. Immediately to the south is Sandia National Laboratories/California (Sandia/California), operated by Lockheed-Martin under Department ofEnergy (DOE) contract. Sandia/California engages in research and development assoc-iated with nuclear weapons systems engineering as well as related national securitytasks. Although their primary missions are similar, LLNL and Sandia/California areseparate entities, each with its own management and each reporting to a different DOEoperations office.
To the south of LLNL, there are also some low-density residential areas and agriculturalareas devoted to grazing, orchards, and vineyards. A business park lies to the south-west. Farther south, property is primarily open space and ranchettes, with someagricultural use. High-density residential development lies to the west. A very smallamount of low-density residential development lies to the east of the Livermore site, andagricultural land extends to the foothills that define the eastern margin of the LivermoreValley. A business park is located to the north, and a 200-hectare parcel of open space tothe northeast has been rezoned to allow development of light industry.
Site 300, LLNL’s Experimental Test Facility, is located 20 km east of the Livermore sitein San Joaquin and Alameda counties in the Altamont Hills of the Diablo Range; itoccupies an area of 30.3 km2. It is in close proximity to two other testing sites: PRIMEX/Physics International operates a testing site that is adjacent and to the east ofSite 300, and SRI International operates another site, located approximately 1 km southof Site 300. The Carnegie State Vehicular Recreation Area is located south of the westernportion of Site 300, and wind turbine generators line the hills to the northwest. Theremainder of the surrounding area is in agricultural use, primarily as grazing land forcattle and sheep. The nearest residential area is the town of Tracy (population 54,200),located 10 km to the northeast.
Meteorology
Meteorological data (including wind speed, wind direction, rainfall, humidity, solarradiation, and air temperature) are continuously gathered at both the Livermore site andSite 300. Mild, rainy winters and warm, dry summers characterize the climate. Adetailed review of the climatology for LLNL can be found in Climatology of LawrenceLivermore National Laboratory (Gouveia and Chapman 1989). The mean annual

1 Site Overview
1-4 LLNL Environmental Report for 1999
temperature for both sites in 1999 was 15°C. Temperatures range from 5°C during somepredawn winter mornings to 40°C during some summer afternoons.
Both rainfall and wind exhibit strong seasonal patterns. These wind patterns tend to bedominated by the thermal draw of the warm San Joaquin Valley that results in windblowing from the cool ocean toward the warm valley, increasing in intensity as thevalley heats up. The wind blows from the northeast primarily during the winter stormseason. Most precipitation occurs between October and April, with very little rainfallduring the warmer months.
Annual wind data for the Livermore site are given in Figure 1-2 and Table 1-1. Thesedata show that greater than 50% of the wind comes from the south-southwest towesterly direction. Based on a ten-year record, the highest and lowest annual rainfallswere 541 and 211 mm, and the average annual rainfall was 360 mm. In 1999, theLivermore site received 245 mm of rain.
The meteorological conditions at Site 300, while generally similar to those at theLivermore site, are modified by higher elevation and more pronounced topologicalrelief. The complex topography of the site significantly influences local wind andtemperature patterns. Annual wind data are presented in Figure 1-3 and Table 1-2. The data show that winds are more consistently from the west-southwest and reachgreater speeds than at the Livermore site. The increased wind speed and elevation ofmuch of Site 300 result in afternoon temperatures that are typically lower than thosefor the Livermore site. Rainfall for 1999 was 198 mm at Site 300.
Topography
The Livermore site is located in the southeastern portion of the Livermore Valley, atopographic and structural depression oriented east-west within the Diablo Range of theCalifornia Coast Range Province. The Livermore Valley, the most prominent valley inthe Diablo Range, is an east-west trending structural and topographic trough that isbounded on the west by Pleasanton Ridge and on the east by the Altamont Hills. Thevalley floor is covered by alluvial, lake, and swamp deposits consisting of gravels,sands, silts, and clays, at an average thickness of about 100 m. The valley is approxi-mately 25-km long and averages 11 km in width. The valley floor is at its highestelevation of 220 m above sea level along the eastern margin and gradually dips to 92 mat the southwest corner. The major streams passing through the Livermore Valley areArroyo del Valle and Arroyo Mocho, which drain the southern highlands and flowintermittently. Major arroyos are depicted in Chapter 7 (Figure 7-1).

Site Overview 1
LLNL Environmental Report for 1999 1-5
N
EW
S
0.5–2.9 3–4.9
Calms: 9.2%
Wind speed (m/s)
5–6.9 ≥ 7
20%
10%
5%
15%
Figure 1-2. Wind rose showing the frequency of occurrence for wind speed anddirection at the Livermore site, 1999.

1 Site Overview
1-6 LLNL Environmental Report for 1999
Table 1-1. Wind rose data for LLNL’s Livermore site at the 10-m level for 1999. Values are frequency of occurrence (in percent). Columns and rowsmay not exactly sum to the listed totals because of rounding.
Wind speed range (m/s)
Direction 0.0–0.4 0.5–2.9 3.0–4.9 5.0–6.9 ≥7.0 Total
NNE 0.58 2.11 1.66 0.46 0.05 4.9
NE 0.58 2.84 1.83 0.14 0.00 5.4
ENE 0.58 2.92 0.08 0.00 0.00 3.6
E 0.58 2.41 0.03 0.00 0.00 3.0
ESE 0.58 2.61 0.02 0.00 0.00 3.2
SE 0.58 2.00 0.00 0.00 0.00 2.6
SSE 0.58 1.65 0.00 0.03 0.00 2.3
S 0.58 4.95 0.81 0.29 0.11 6.7
SSW 0.58 5.96 1.89 0.90 0.23 9.6
SW 0.58 7.71 7.72 3.51 0.65 20.2
WSW 0.58 8.44 5.48 0.97 0.16 15.6
W 0.58 5.43 6.52 0.96 0.05 13.5
WNW 0.58 1.86 0.74 0.26 0.00 3.4
NW 0.58 1.31 0.09 0.02 0.00 2.0
NNW 0.58 1.26 0.14 0.03 0.03 2.0
N 0.58 0.76 0.23 0.14 0.27 2.0
Total 9.3 54.2 27.2 7.7 1.6 100
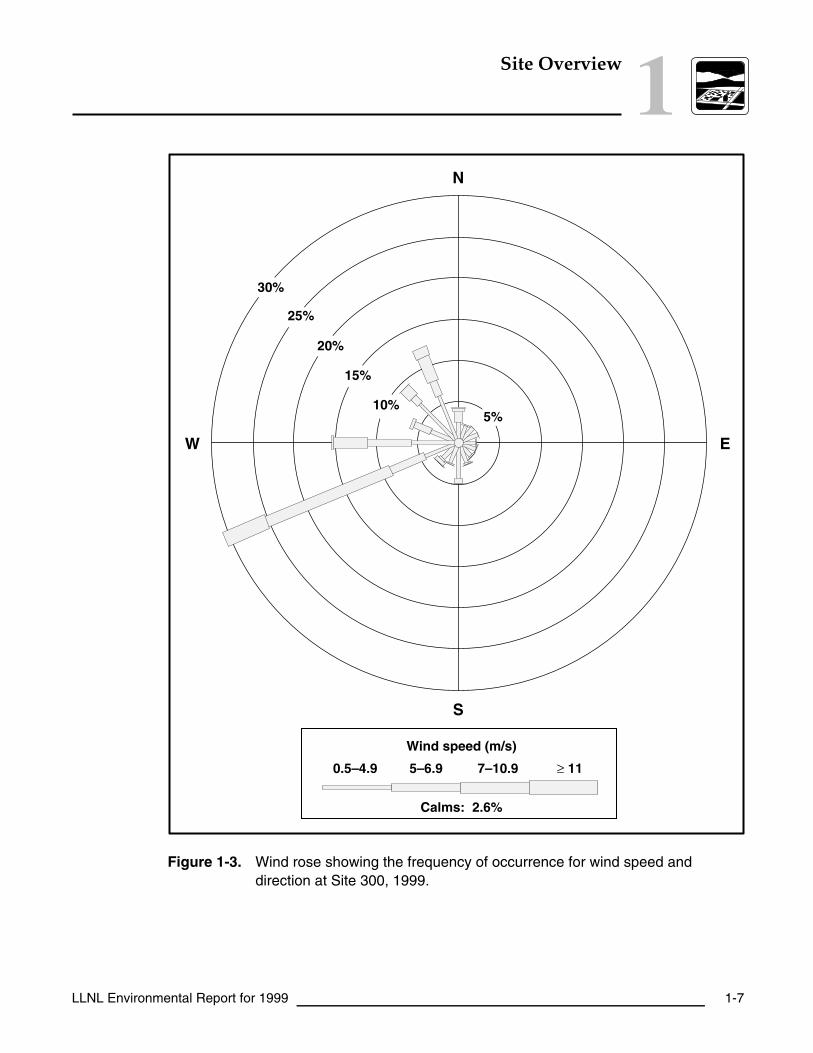
Site Overview 1
LLNL Environmental Report for 1999 1-7
N
EW
S
0.5–4.9 5–6.9
Calms: 2.6%
Wind speed (m/s)
7–10.9
25%
30%
15%
10%
20%
5%
Figure 1-3. Wind rose showing the frequency of occurrence for wind speed anddirection at Site 300, 1999.

1 Site Overview
1-8 LLNL Environmental Report for 1999
Table 1-2. Wind rose data for LLNL’s Site 300 at the 10-m level for 1999. Values arefrequency of occurrence (in percent). Columns and rows may not exactlysum to the listed totals because of rounding.
Wind speed range (m/s)
Direction 0.0–0.4 0.5–4.9 5.0–6.9 7.0–10.9 ≥11.0 Total
NNE 0.16 1.69 0.05 0.00 0.00 1.9
NE 0.16 1.91 0.03 0.00 0.00 2.1
ENE 0.16 1.91 0.00 0.00 0.00 2.1
E 0.16 1.53 0.05 0.00 0.00 1.7
ESE 0.16 1.62 0.03 0.03 0.00 1.8
SE 0.16 1.50 0.19 0.07 0.00 1.9
SSE 0.16 2.04 0.17 0.10 0.00 2.5
S 0.16 3.77 0.56 0.06 0.00 4.6
SSW 0.16 2.06 0.16 0.03 0.00 2.4
SW 0.16 2.09 0.33 0.38 0.05 3.0
WSW 0.16 3.78 4.56 16.2 5.46 30.2
W 0.16 5.20 5.33 4.09 0.25 15.0
WNW 0.16 4.04 1.21 0.45 0.00 5.9
NW 0.16 6.08 1.20 1.46 0.06 9.0
NNW 0.16 5.65 2.56 2.47 1.12 12.0
N 0.16 1.94 1.29 0.37 0.17 3.9
Total 2.6 46.8 17.7 25.8 7.1 100

Site Overview 1
LLNL Environmental Report for 1999 1-9
The topography of Site 300 is much more irregular than that of the Livermore site; aseries of steep hills and ridges is oriented along a generally northwest-southeast trendand is separated by intervening ravines. The Altamont Hills, where Site 300 is located,are part of the California Coast Range Province and separate the Livermore Valley to thewest from the San Joaquin Valley to the east. The elevation ranges from approximately538 m above sea level at the northwestern corner of the site to approximately 150 m inthe southeast portion.
HydrogeologyLivermore Site
The hydrogeology and movement of ground water in the vicinity of the Livermore sitehave been the subjects of several investigations (Stone and Ruggieri 1983; Carpenteret al. 1984; Webster-Scholten and Hall 1988; and Thorpe et al. 1990). This section hasbeen summarized from the reports of these investigations and from data supplied byAlameda County Flood Control and Water Conservation District Zone 7, the agencyresponsible for ground water management in the Livermore Valley basin (San FranciscoBay Regional Water Quality Control Board 1982a and b).
The Livermore Formation (and overlying alluvial deposits) contains the aquifers of theLivermore Valley ground water basin, an important water-bearing formation. Naturalrecharge occurs primarily along the fringes of the basin and through the arroyos duringperiods of winter flow. Artificial recharge, if needed to maintain ground water levels, isaccomplished by releasing water from Lake Del Valle or from the South Bay Aqueductinto arroyo channels in the east. Ground water flow in the valley generally movestoward the central east-west axis of the valley and then westward through the centralbasin. Ground water flow in the basin is primarily horizontal, although a significantvertical component probably exists in fringe areas, under localized sources of recharge,and in the vicinity of heavily used extraction (production) wells.
Beneath the Livermore site, the water table varies in depth from the surface from about10 to 40 m. Figure 1-4 shows a contour map of water table elevations (meters abovemean sea level) for the Livermore site area. Although water table elevations varyslightly with seasonal and year-to-year differences in both natural and artificialrecharge, the qualitative patterns shown in Figure 1-4 are generally maintained. At theeastern edge of the Livermore site, ground water gradients (change in vertical elevationper unit of horizontal distance) are relatively steep, but under most of the site andfarther to the west, the contours flatten to a gradient of approximately 0.003.

1 Site Overview
1-10 LLNL Environmental Report for 1999
~198
m
(650
’)
~162 m (532’)
Patterson Pass Road
N
~174
m
(572
’)
0 300 600
Scale: Meters
Ground water contour (approximate meters above mean sea level)
Surface elevation contour (approximate meters above mean sea level)
LLNL site boundary
Vas
co R
oad
Gre
envi
lle R
oad
East Avenue
~168
m
(552
’)
Figure 1-4. 1999 approximate ground water and surface elevation contours, Livermoresite and vicinity.
Ground water flow under most of the site is southwesterly. This flow direction divergesfrom the generally westward regional flow and from flow patterns demonstrated for thesite in the 1980s. This shift in flow direction is a consequence of ground water recoveryand remediation in the southwest portion of the site and agricultural pumping. Aquifertests on monitoring wells in the vicinity of the Livermore site indicate that the hydraulicconductivity (a measure of the rate of flow) of the permeable sediments ranges from 1 to16 m/day (Isherwood et al. 1991). This, in combination with the observed water tablegradients, yields an estimated average ground water velocity of 20 m/y (Thorpe et al.1990). The range in these values reflects the heterogeneity typical of the more permeablealluvial sediments that underlie the area.

Site Overview 1
LLNL Environmental Report for 1999 1-11
Site 300
Gently dipping sedimentary bedrock dissected by steep ravines generally underliesSite 300. The bedrock is made up primarily of interbedded sandstone, siltstone, andclaystone. Most ground water occurs in the Neroly Formation upper and lower bluesandstone aquifers. Significant ground water is also locally present in permeableQuaternary alluvium valley fill. Much less ground water is present within perchedaquifers in the unnamed Pliocene nonmarine unit. Perched aquifers contain unconfinedwater separated from an underlying main body of water by impermeable layers;normally they are discontinuous and highly localized. Because water quality generallyis poor and yields are low, these perched water-bearing zones do not meet the State ofCalifornia criteria for aquifers that are potential water supplies.
Fine-grained siltstone and claystone interbeds may confine the ground water and act asaquitards, confining layers, or perching horizons. Ground water is present under confinedconditions in parts of the deeper bedrock aquifers but is generally unconfined elsewhere.
Ground water flow in most aquifers follows the attitude of the bedrock. In the north-west part of Site 300, ground water in bedrock generally flows northeast except where itis locally influenced by the geometry of alluvium-filled ravines. In the southern half ofSite 300, ground water in bedrock flows roughly south-southeast, approximatelycoincident with the attitude of bedrock strata.
The thick Neroly lower blue sandstone, stratigraphically near the base of the formation,generally contains confined water. Wells located in the western part of the GeneralServices Area (GSA) (see Figure 8-8) are completed in this aquifer and are used to supplydrinking and process water.
Figure 1-5 shows the elevation contours for ground water in the regional aquifer atSite 300. This map of the piezometric surface (the elevation at which water stabilizes ina well that penetrates a confined or unconfined aquifer) is based primarily on waterlevels in the Neroly lower blue sandstone aquifer.
Recharge occurs predominantly in locations where saturated alluvial valley fill is incontact with underlying permeable bedrock or where permeable bedrock strata cropout because of structure or topography. Local recharge also occurs on hilltops, creatingsome perched water-bearing zones. Low rainfall, high evapotranspiration, steeptopography, and intervening aquitards generally preclude direct vertical recharge ofthe bedrock aquifers.

1 Site Overview
1-12 LLNL Environmental Report for 1999
Corral Hollow Road
Livermore
Tracy
N
0 1600800
Scale: Meters
Ground water elevation contour(meters above mean sea level)
Ground water elevation contourDashed where approximate
Ground water elevation contourQueried where uncertain
?
Site 300 perimeter
Surface elevation contour(meters above mean sea level)
150
150
160
160
170
17018
0
180
190
200
200
190
210
210
280
290
300
290
310320
330340
350360370
390380370410
400
420
430
?
?
366
366
366
366
305
305
305
305
305305
245
245
245
245
245
183
427
427
305
Figure 1-5. 1999 approximate ground water elevations in the principal continuouswater-bearing zone at Site 300.
Further information on the hydrology of both the Livermore site and Site 300 can befound in the ground water protection information in Chapters 8 and 9.

Site Overview 1
LLNL Environmental Report for 1999 1-13
Summary
LLNL recognizes the importance of our geology, hydrogeology, climate, and geo-graphical relationships with our neighbors in assessing potential impacts of operationsat the Livermore site and Site 300. Each year we gain additional information thatallows us to better predict, interpret, and avoid potential impacts. Each environmentalmedium that is discussed in this document—air, soil, water, vegetation, and foodstuff—may be affected differently. The environmental scientists at LLNL take into account theunique locations of the Livermore site and Site 300 to tailor sampling and analysisprograms for each method used to monitor the environment.
We acknowledge the work of Frank Gouveia, Michael Taffet, Richard Blake,William Hoppes, and Janice Butler in preparing this chapter.


2
LLNL Environmental Report for 1999 2-1
Compliance Summary
Introduction
During 1999, Lawrence Livermore National Laboratory (LLNL) participated innumerous activities to comply with federal, state, and local environmental regulationsas well as internal requirements and Department of Energy (DOE) orders. This chapter,which is organized according to the various laws and regulations that drive LLNL’scompliance activities, describes the activities the Laboratory carried out related to air,water, waste, waste reduction, community “right to know,” protection of sensitiveresources, and other environmental issues at the Livermore site and Site 300. A widerange of compliance activities is summarized in this chapter. Compliance activitiesspecific to DOE Orders 5400.1 and 5400.5 are discussed in the chapters that follow.Many documents concerned with these activities and other environmental topics areavailable for public viewing at the LLNL Visitors Center and the Livermore and Tracypublic libraries.
Comprehensive Environmental Response, Compensation and Liability Act
The Livermore Site Ground Water Project (GWP) and the Site 300 CERCLA Project areunder the jurisdiction of the Comprehensive Environmental Response, Compensationand Liability Act (CERCLA)/Superfund Amendment and Reauthorization Act, Title 1.As part of work on these projects, DOE and LLNL also continued with environmentalrestoration and community relations activities. These projects and activities aredescribed in the following sections.
Livermore Site Ground Water Project
The GWP at the Livermore site complies with provisions specified in a federal facilityagreement (FFA) entered into by the U.S. Environmental Protection Agency (EPA),DOE, the California EPA’s Department of Toxic Substances Control (DTSC), and theSan Francisco Bay Regional Water Quality Control Board (SFBRWQCB). As required bythe FFA, the project addresses compliance issues by investigating potential contaminationsource areas (such as suspected old release sites, solvent-handling areas, and leaking

2 Compliance Summary
2-2 LLNL Environmental Report for 1999
underground tank systems), continuous monitoring, and remediation of ground water.The ground water contaminants (constituents of concern) are volatile organic compounds(VOCs), primarily trichloroethene (TCE) and tetrachloroethene (PCE). For the most part,these contaminants are present within the site boundary and to some extent at the siteboundary and beyond, mainly to the west and south of the site (see Figures 8-3 to 8-7,Chapter 8). In 1999, GWP activities included preparing the required CERCLA docu-ments, meeting milestones, operating ground water treatment facilities, and maintainingliaison with community groups.
Documentation
As required by the Livermore site FFA, DOE and LLNL issued the 1999 Ground WaterProject Annual Report (Aarons et al. 2000) on March 23, 1999. DOE and LLNL alsofinalized and issued Remedial Project Manager (RPM) meeting summaries. Quarterlyself-monitoring data were reported in letter reports (Bainer and Joma 2000a, 2000b).LLNL also issued an updated Quality Assurance Project Plan (Dibley 1999).
A draft explanation of significant differences, submitted on December 14, 1999, forregulatory review, described proposed changes to the planned ground water treatmentsystem at Trailer 5475 to allow ground water containing both VOCs and tritium abovetheir maximum contaminant levels (MCLs) to go through an aboveground treatmentunit (Berg 1999).
DOE and LLNL began preparing a draft action memorandum (Berg and Bainer 2000) fora time-critical removal action for soil containing residual polychlorinated biphenyls(PCBs) in the East Traffic Circle. The document will be finalized in 2000.
Milestones and Activities
LLNL has completed all the 1999 Remedial Action Implementation Plan (RAIP) milestones(Table 5 in Dresen et al. 1993) for the Livermore site ahead of schedule. For a detailedlist of these milestones and corresponding dates, please see Table 8-1 in Chapter 8.Details of 1999 environmental restoration activities are discussed in the LLNL GroundWater Project 1999 Annual Report (Aarons et al. 2000).
Treatment Facilities
In 1999, LLNL operated ground water treatment facilities in the TFA, TFB, TFC, TFD,TFE, TFG, TF406, TF518, and TF5475 areas (see Figure 8-1 in Chapter 8). Sixty-nineground water extraction wells operated at 20 separate locations, treating about3,161,000 liters of ground water per day. The vapor treatment facilities VTF518 and

Compliance Summary 2
LLNL Environmental Report for 1999 2-3
VTF5475 treated about 3000 m3 of vapor per day. Together, these treatment facilitiesremoved approximately 269 kg of VOCs in 1999. Since remediation efforts began in1989, more than 4.5 billion liters of ground water and approximately 477,480 m3 ofvapor have been treated, and about 752 kg of VOCs have been removed. Remediationactivities at the Livermore site are discussed in greater detail in Chapter 8.
Community Relations
The Community Work Group met once in 1999 to discuss the DOE budget, progress onthe Livermore site cleanup, and the Livermore Site Priority List/Consensus Statement.LLNL continued to correspond and communicate with Community Work Groupmembers throughout the year. DOE and LLNL met four times with members of Tri-Valley Communities Against a Radioactive Environment (CAREs) and its scientificadvisor as part of the activities funded by an EPA technical assistance grant.
Other Livermore site community relations activities in 1999 included communicationsand meetings with neighbors; local, regional, and national interest groups; and othercommunity organizations. LLNL also conducted public presentations, including thoseto local realtors and to national and northern California peace leaders; producedand distributed the Environmental Community Letter; maintained the informationrepositories and the administrative record; conducted tours of the site environmentalactivities; and responded to public and news media inquiries. In addition, LLNL nowconducts some community relations activities electronically, answering questions andsending responses via electronic mail. LLNL also posts documents, letters, and publicnotices on the Internet at the following address: http://www-envirinfo.llnl.gov/
Site 300 CERCLA Project
Investigations and remedial activities are ongoing at Site 300, which became aCERCLA/Superfund site in 1991, when it was placed on the National Priorities List.Investigations and remedial activities are conducted under the joint oversight of theEPA, the Central Valley Regional Water Quality Control Board (CVRWQCB), CaliforniaEPA’s DTSC, and the authority of an FFA for the site. (There are separate FFAs forSite 300 and the Livermore site.)
During 1999, LLNL submitted all required regulatory documents (see Chapter 8) on orahead of schedule, performed all actions stipulated in the FFA, and maintained liaisonwith community groups. Results and status for Site 300 environmental restoration studyareas are discussed in Chapter 8. Background information for LLNL environmental

2 Compliance Summary
2-4 LLNL Environmental Report for 1999
characterization and restoration activities at Site 300 can be found in the Final Site-WideRemedial Investigation Report, Lawrence Livermore National Laboratory Site 300 (Webster-Scholten 1994).
Documentation
LLNL submitted the required documentation to oversight agencies on time in 1999. TheDraft Final and Final Site-Wide Feasibility Study (Ferry et al. 1999a,b), Draft Final ProposedPlan for Environmental Cleanup (Dresen et al. 1999), quarterly reports, and work planswere among the documents submitted.
Milestones and Activities
LLNL has completed all the 1999 FFA milestones for Site 300 on or ahead of schedule.For a detailed list of these milestones and corresponding dates, please see Table 8-2 inChapter 8.
Treatment Facilities
VOCs (primarily TCE) are the main contaminants at Site 300. High explosives, tritium,depleted uranium, organosilicate oil, nitrates, and perchlorates are also found in groundwater. Three treatment facilities that remove and treat VOCs operated throughout 1999.Additionally, three new treatment facilities were constructed and began operation atSite 300 during 1999. These facilities are discussed in more detail in Chapter 8. Eighteenwells that extract ground water only, and 17 wells that extract both ground water andsoil vapor operated during 1999, treating about 84.5 million liters of ground water. The17 wells that extract both vapor and ground water and three wells that extract vaporonly, together removed 431,000 m3 of vapor. In 1999, the Site 300 treatment facilitiesremoved approximately 39 kg of VOCs. Since remediation efforts began in 1990, morethan 565 million liters of ground water and approximately 1.58 million m3 of vapor havebeen treated, to yield about 141 kg of removed VOCs. Chapter 8 also includes maps ofthe study areas and details of the distribution of contaminants in ground water atSite 300.
Community Relations
The Site 300 CERCLA project maintains proactive communication with the surroundingcommunities of Tracy and Livermore. Community relations activities in 1999 includedmaintenance of the information repositories and administrative records; Site 300 toursfor scientists and students from universities and local public schools; off-site, privatewell-sampling activities; and preparation of a fourth Site 300 Environmental Restoration

Compliance Summary 2
LLNL Environmental Report for 1999 2-5
fact sheet (Heffner 1999). Quarterly meetings were held with Tri-Valley CAREs, whichreceives an annual technical assistance grant from EPA to independently evaluateCERCLA activities at Site 300. A tour of Site 300 CERCLA activities was also conductedfor Tri-Valley CAREs.
In March 1999, the remedial project managers held a public workshop to present theinitial selection of remedial alternatives in the Draft Site-Wide Feasibility Study (Ferry etal. 1999a) to the community. In December 1999, a second public workshop was held topresent the Draft Final Proposed Plan for Environmental Cleanup (Dresen et al. 2000).
Site Evaluations Prior to Construction
Before any construction begins, the CERCLA Record of Decision requires that the projectsite be evaluated to determine if soil or rubble (concrete and asphalt) is contaminated.Soil is sampled and analyzed for potential radioactive and/or hazardous contamination.Depending on the analytical results, soil may be reused on site or disposed of accordingto established procedures. Depending on the potential for radioactive contamination,rubble may be either surveyed or analyzed for radioactivity. During 1999, soil andrubble were evaluated at 75 construction sites.
Agency for Toxic Substances and Disease Registry Assessment
The Agency for Toxic Substances and Disease Registry (ATSDR) is a federal public healthagency whose mission is to prevent exposure and adverse human health effects anddiminished quality of life associated with exposure to hazardous substances from wastesites, unplanned releases, and other sources of pollution in the environment. As part ofits mission, ATSDR is mandated by Congress to conduct Public Health Assessments(PHAs) at sites, such as LLNL, that appear on the National Priorities List.
In 1999, ATSDR worked with the California Department of Health Services (CDHS) tocomplete a health consultation related to Livermore site operations, which will mostlikely be part of the final PHA for LLNL. This health consultation report assessedconcerns related to the discovery of plutonium at levels above background in Big TreesPark in the City of Livermore.
Big Trees Park has been the object of public scrutiny since 1993, when a single soilsample was found to contain plutonium at a concentration higher than would have been

2 Compliance Summary
2-6 LLNL Environmental Report for 1999
expected from global fallout alone. In 1998, LLNL resampled soil in the park to deter-mine the vertical and lateral extent of plutonium contamination and the likelihood ofpossible pathways. LLNL and ATSDR, in August 1999 and January 2000, respectively,published reports concluding that there was no systematic distribution of plutonium atdepth, that the horizontal distribution is consistent with the application of plutonium-contaminated sewage sludge as a soil amendment, and that the most credible pathwayto the park was the application of plutonium-contaminated sewage sludge as a soilamendment. The plutonium at the park was found to be below levels of health concernand below the recommended levels requiring additional activities. (See Chapter 10 formore information on the sampling and analysis.)
The ATSDR report, LLNL sampling documents, and regulatory statements can beviewed at the following address: http://www-envirinfo.llnl.gov
Superfund Amendment and Reauthorization Act, Title III
Title III of the Superfund Amendment and Reauthorization Act (SARA) is known as theEmergency Planning and Community Right-to-Know Act (EPCRA). It requires ownersor operators of facilities that handle certain hazardous chemicals on site to provideinformation on the release, storage, and use of those chemicals to organizations respon-sible for emergency response planning. Executive Order 12856 directs all federalagencies to comply with the requirements of EPCRA, including SARA 313, ToxicRelease Inventory Program.
EPCRA requirements and LLNL compliance are summarized in Table 2-1. Tables 2-2and 2-3 identify those chemicals and their hazards reported during 1999 by LLNL forthe Livermore site and Site 300, respectively, under Title III, Section 311.
Clean Air Act—Air Quality Management Activities
Air permits are obtained from the Bay Area Air Quality Management District(BAAQMD) for the Livermore site and from the San Joaquin Valley Unified AirPollution Control District (SJVUAPCD) for Site 300. In 1999, BAAQMD issued orrenewed air permits for 128 air emission sources for the Livermore site. In 1999,SJVUAPCD issued or renewed air permits for 47 air emission sources for Site 300(see Table 2-4). During 1999, BAAQMD inspectors found no deficiencies at the
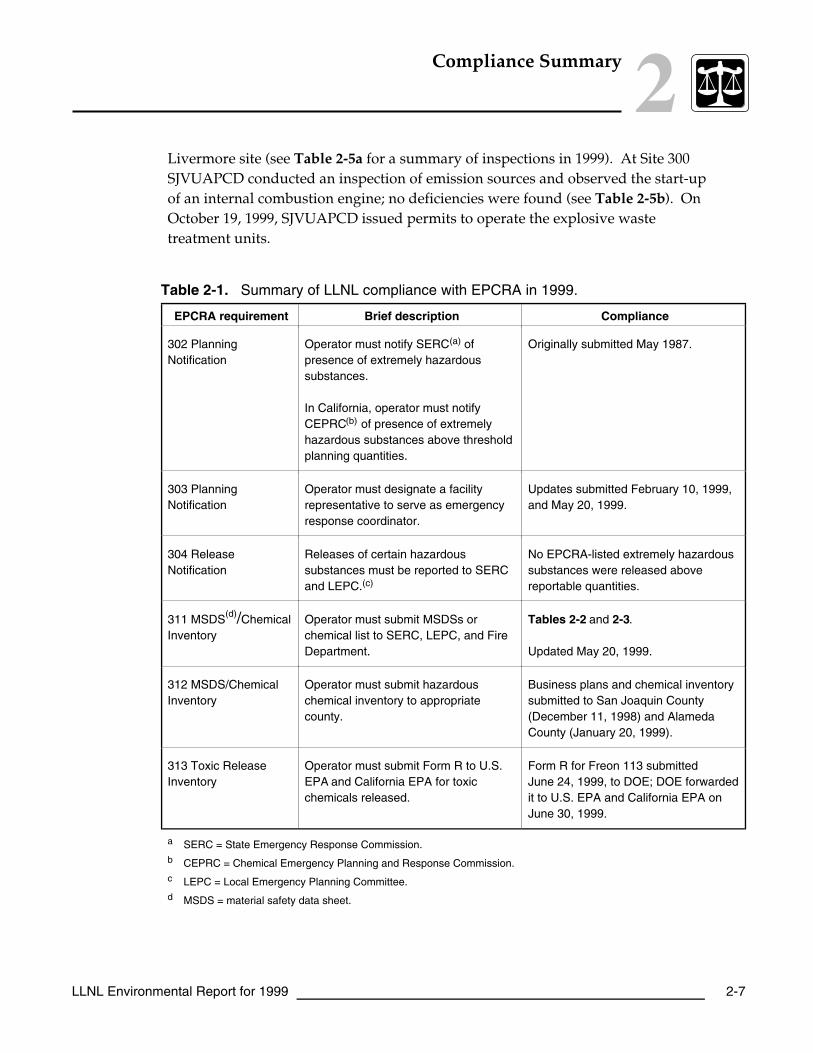
Compliance Summary 2
LLNL Environmental Report for 1999 2-7
Livermore site (see Table 2-5a for a summary of inspections in 1999). At Site 300SJVUAPCD conducted an inspection of emission sources and observed the start-upof an internal combustion engine; no deficiencies were found (see Table 2-5b). OnOctober 19, 1999, SJVUAPCD issued permits to operate the explosive wastetreatment units.
Table 2-1. Summary of LLNL compliance with EPCRA in 1999.
EPCRA requirement Brief description Compliance
302 PlanningNotification
Operator must notify SERC(a) ofpresence of extremely hazardoussubstances.
In California, operator must notifyCEPRC(b) of presence of extremelyhazardous substances above thresholdplanning quantities.
Originally submitted May 1987.
303 PlanningNotification
Operator must designate a facilityrepresentative to serve as emergencyresponse coordinator.
Updates submitted February 10, 1999,and May 20, 1999.
304 ReleaseNotification
Releases of certain hazardoussubstances must be reported to SERCand LEPC.(c)
No EPCRA-listed extremely hazardoussubstances were released abovereportable quantities.
311 MSDS(d)/ChemicalInventory
Operator must submit MSDSs orchemical list to SERC, LEPC, and FireDepartment.
Tables 2-2 and 2-3.
Updated May 20, 1999.
312 MSDS/ChemicalInventory
Operator must submit hazardouschemical inventory to appropriatecounty.
Business plans and chemical inventorysubmitted to San Joaquin County(December 11, 1998) and AlamedaCounty (January 20, 1999).
313 Toxic ReleaseInventory
Operator must submit Form R to U.S.EPA and California EPA for toxicchemicals released.
Form R for Freon 113 submittedJune 24, 1999, to DOE; DOE forwardedit to U.S. EPA and California EPA onJune 30, 1999.
a SERC = State Emergency Response Commission.b CEPRC = Chemical Emergency Planning and Response Commission.c LEPC = Local Emergency Planning Committee.d MSDS = material safety data sheet.

2 Compliance Summary
2-8 LLNL Environmental Report for 1999
Table 2-2. Livermore site, SARA, Title III, Section 311, Chemical List, 1999.(a)
Livermore site Physical hazard Health hazard
chemicals Fire Pressure Reactivity Acute Chronic
Acetylene • • •Air •Ammonia, anhydrous • •Ammonium hydroxide •Argon • •Brayco 889, coolant •Carbon, activated •Carbon dioxide • •Chlorine • • •Chromium(III) chloride •Cobalt • • •Diesel fuel •Ethyl alcohol • • •Freon 113 •Gasoline • • •Helium • •Hydrochloric acid • •Hydrofluoric acid •(b) • • •Hydrogen • • •Hydrogen peroxide (<52%) •Insulating oil, inhibiting •Lead (bricks and ingots) • •Methane • • •Neon • •Nitric acid • • • •Nitric oxide • • •Nitrogen • •Oxygen • •Paint •Potassium cyanide •

Compliance Summary 2
LLNL Environmental Report for 1999 2-9
Table 2-2. Livermore site, SARA, Title III, Section 311, Chemical List, 1999(concluded).(a)
Livermore site Physical hazard Health hazard
chemicals Fire Pressure Reactivity Acute Chronic
Propane • • •Sodium hydroxide • • •Sulfur hexafluoride • •Sulfuric acid • • •
a Physical and health hazard information obtained primarily from material safety data sheets.
b Some containers have a pressure hazard.
Table 2-3. Site 300, SARA, Title III, Section 311, Chemical List, 1999.(a)
Site 300 Physical hazard Health hazardchemicals Fire Pressure Reactivity Acute Chronic
Argon • •Carbon, activated •Chlorine • •Bis(2,2-dinitro-2-fluoroethyl) formal inmethylene chloride
—(b) —(b) • •
Diesel fuel •Gasoline • • •Helium • •High explosives •Lead (bricks) • •Nitrogen •Oil, hydraulic •Oil, inhibited insulating •Oil, transformer •Sulfuric acid • • •a Physical and health hazard information obtained primarily from material safety data sheets.
b Dangerous fire or explosion risk in neat form (solvent evaporates).

2 Compliance Summary
2-10 LLNL Environmental Report for 1999
Table 2-4. Summary of permits active in 1999.(a,b)
Type ofpermit Livermore site Site 300
Air BAAQMD issued 128 permits for operation of varioustypes of equipment, including boilers, emergencygenerators, cold cleaners, ultrasonic cleaners,degreasers, printing press operations, manual wipe-cleaning operations, metal machining and finishingoperations, silk-screening operations, silk-screenwashers, paint spray booths, adhesives operations, imagetube fabrication, optic coating operations, storage tankscontaining VOCs in excess of 1.0%, plating tanks, drumcrusher, semiconductor operations, diesel air-compressorengines, ground water air strippers/dryers, ovens,material-handling equipment, sewer diversion system,wave soldering machine, oil and water separator, fire testcells, gasoline-dispensing operation, resin-mixingoperation, paper-pulverizer system, and firing tanks.
SJVUAPCD issued 47 permits for operation ofvarious types of equipment, including boilers,emergency generators, paint spray booth, groundwater air strippers, soil vapor extraction units,woodworking cyclone, gasoline-dispensingoperation, explosive waste treatment units, anddrying ovens.
Water WDR Order No. 88-075 for discharges of treated groundwater from Treatment Facility A to percolation pits andrecharge basin.
WDR Order No. 95-174, NPDES Permit No. CA0030023for discharges of storm water associated with industrialactivities and low-threat nonstorm water discharges tosurface waters.
WDR Order No. 99-08-DWQ, NPDES California GeneralConstruction Activity Permit No. CAS000002, DWTF SiteID No. 201S305140, Soil Reuse Project ID No.2015305529 and National Ignition Facility, Site ID No.201S306762, for discharges of storm water associatedwith construction activities affecting two hectares or more.
WDR Order No. 99-086 for the Arroyo Las PositasMaintenance Project.
Two ongoing projects permitted under streambedalteration agreements.
FFA for ground water investigation/remediation.
WDR Order No. 99-08-DWQ, NPDES CaliforniaGeneral Construction Activity Permit No.CAS000002, Contained Firing Facility/ChemistryMagazine Loop, Site ID No. 5B39S307131 fordischarges of storm water associated withconstruction activities impacting two hectares ormore.
WDR Order No. 93-100 for post-closure monitoringrequirements for two Class I landfills.
WDR Order No. 94-131, NPDES PermitNo. CA0081396 for discharges of storm waterassociated with industrial activities and from coolingtowers.
WDR Order No. 96-248 for operation of two Class IIsurface impoundments, a domestic sewage lagoon,and percolation pits.
WDR Order No. 97-242, NPDES PermitNo. CA0082651 for discharges of treated groundwater from the eastern General Services Areatreatment unit.
One ongoing project permitted under a streambedalteration agreement.
FFA for ground water investigation/remediation.
52 registered Class V injection wells.

Compliance Summary 2
LLNL Environmental Report for 1999 2-11
Table 2-4. Summary of permits active in 1999 (concluded).(a,b)
Type ofpermit Livermore site Site 300
Hazardouswaste
EPA ID No. CA2890012584.
Authorization to mix resin in Units CE231-1 and CE443-1under conditional exemption tiered permitting.
Closure under interim status of the Building 419 sizereduction unit and Building 419 solidification unit.
Authorizations to construct the permitted units ofBuilding 280, Building 695, and additions to Building 693.
Authorization under hazardous waste permit to operate18 waste storage units and 14 waste treatment units.
Continued authorization to operate seven waste storageunits and eight waste treatment units under interimstatus.
EPA ID No. CA2890090002.
Part B Permit—Container Storage Area(Building 883) and Explosives Waste StorageFacility (issued May 23, 1996).
Part B Permit—Explosives Waste TreatmentFacility (issued October 9, 1997).
Docket HWCA 92/93-031. Closure andPost-Closure Plans for Landfill Pit 6 and theBuilding 829 Open Burn Facility.
Sanitarysewer
Discharge Permit No. 1250 (99/00) for discharges ofwastewater to the sanitary sewer.
Permit 1510G (99) for discharges of sewerable groundwater from CERCLA restoration activities.
Storagetanks
Nine operating permits covering 13 undergroundpetroleum product and hazardous waste storage tanks:111-D1U2 Permit No. 6480; 113-D1U2 Permit No. 6482;152-D1U2 Permit No. 6496; 271-D2U1 Permit No. 6501;321-D1U2 Permit No. 6491; 322-R2U2 Permit No. 6504;365-D1U2 Permit No. 6492; 490-R3U1 and 490-R3U2Permit No. 6509; and 611-D1U1, 611-G1U1, 611-G2U1,and 611-O1U1 Permit No. 6505.
One operating permit covering five undergroundpetroleum product tanks assigned individualpermit numbers: 882-D1U1 Permit No. 006530;875-D1U2 Permit No. 006549; 879-D1U1 PermitNo. 006785; 879-G3U1 Permit No. 007967; and871-D1U2 Permit No. 008013
a Permit numbers are based on actual permitted units or activities maintained and renewed by LLNL during 1999.
b See Glossary for list of acronyms.

2 Compliance Summary
2-12 LLNL Environmental Report for 1999
Table 2-5a. Inspections and tours of the Livermore site by external agencies in 1999.
Medium Description Agency(a) Date Finding
Air Emission sources BAAQMD 1/141/282/183/1111/411/1712/2
No violations
Water Sandia Recharge Basin
Tour of North and Southwest Buffer Zones, DrainageRetention Basin, Treatment Facility A recharge ponds
SFBRWQCB 1/11
11/2
No violations
Sanitarysewer
Annual compliance sampling
Categorical sampling
LWRP 10/12–13
3/1210/1212/212/8
No violations
Waste Hazardous waste facilities DTSC 6/28–6/29,7/12, 7/13,7/15, 7/16,and 8/12
16 allegedviolations(b)
Medical waste ACDEH 9/14 No violations
Storagetanks
Compliance with underground storage tank upgraderequirements and operating permits.
ACHCS 3/119/20
No violations
a See Glossary for list of acronyms.
b LLNL disputes some of these alleged violations in the final Summary of Violation (SOV) dated on 12/22/99, and responded to DTSC on2/15/00.
Table 2-5b. Inspections and tours of Site 300 by external agencies in 1999.(a)
Medium Description Agency(b) Date Finding
Air Emission sources
Review for internal combustion engine start-up
SJVUAPCD 4/14
12/16
No violations
Water Permitted operations CVRWQCB 4/13 No violations
Waste Various facilities DTSC 6/17, 7/9,and 7/13
One violation(c)
a There were no inspections of the sanitary sewer or storage tanks at Site 300 in 1999.
b See Glossary for complete list of acronyms.
c DTSC determined that Site 300 returned to compliance on 9/16/99.

Compliance Summary 2
LLNL Environmental Report for 1999 2-13
National Emission Standards for Hazardous Air Pollutants
To demonstrate compliance with the National Emissions Standards for Hazardous AirPollutants (NESHAPs) for radiological emissions (40 Code of Federal Regulations[CFR] 61, Subpart H), LLNL is required to monitor certain air release points andevaluate all potential sources of radionuclide air emissions to determine the possibleeffective dose equivalent to the maximally exposed individual of the public. Theseevaluations include air surveillance monitoring and modeling (using EPA-sanctionedcomputer codes) based on radionuclide inventory data, effluent (source emission)monitoring, or both.
The LLNL NESHAPs 1999 Annual Report (Gallegos et al. 2000), submitted to DOEand EPA, reported that the estimated total site-wide maximally exposed individualradiological doses for the Livermore site and Site 300 were 1.0 µSv/y (0.1 mrem/y)and 0.35 µSv/y (0.035 mrem/y), respectively, for 1999. Using the EPA-mandatedassumption that gaseous tritium be treated as though it were tritiated water yieldeda slightly higher dose of 1.2 µSv (0.12 mrem) for Livermore site operations.
The reported doses include contributions from both point and diffuse sources. The totalswere well below the 100 µSv/y (10 mrem/y) dose limits defined by the NESHAPsregulations. The details of these data are included in this report (see Chapter 13).
In 1999, LLNL continuously monitored radionuclide emissions from Building 331 (theTritium Facility), Building 332 (the Plutonium Building), the seismically strengthenedportion of Building 251, and five other buildings (see Chapter 4). During 1999, somesampling systems were deactivated (see Chapter 4). There were no unplannedatmospheric releases at the Livermore site or at Site 300 in 1999.
Clean Water Act and Related State Programs
Preserving clean water is one objective of local, state, and federal regulations. TheNational Pollutant Discharge Elimination System (NPDES) under the Federal CleanWater Act establishes permit requirements for discharges into waters of the U.S.In addition, the State of California, under the Porter Cologne Water Quality Control Act,requires permits, known as Waste Discharge Requirements (WDRs), for any wastedischarges affecting the beneficial uses of waters of the state. The regional water qualitycontrol boards are responsible for issuing and enforcing both permits.

2 Compliance Summary
2-14 LLNL Environmental Report for 1999
Several agencies issue other water-related permits. The Livermore Water ReclamationPlant (LWRP) requires permits for discharges of sewerable water to the city sanitarysewer system. The Army Corps of Engineers (ACOE) issues permits for work innavigable waterways below the ordinary high-water mark and for controlling filloperations in waters of the United States. The State Water Resources Control Board(SWRCB) can issue water quality certifications or WDRs. The California Departmentof Fish and Game (CDFG) under the Fish and Game Code Section 1601 et seq. requiresstreambed alteration agreements for any work that may disturb or impact rivers,streams, or lakes. The Safe Drinking Water Act requires registration with the EPA andmanagement of injection wells to protect underground sources of drinking water. TheClean Water Act also requires facilities meeting specific storage requirements to haveand implement Spill Prevention Control and Countermeasure (SPCC) plans for oil-containing equipment and tanks. Finally, Alameda County Health Services (ACHS)and San Joaquin County Environmental Health Services issue permits for operatingunderground storage tanks containing hazardous materials or hazardous waste asrequired under the California Health and Safety Code. Water-related permits aresummarized in Table 2-4 and discussed in detail in Chapters 6, 7, and 9.
In December 1998, LLNL performed the triennial review and evaluation of the SPCCplans for Site 300 and the Livermore site. Based on this review, the Site 300 SPCC planwas amended in December 1999, and the Livermore site SPCC plan will be amended in2000. No significant changes were made to the technology or practices documentedin the Spill Prevention Control and Countermeasures Plan (Campbell 1995). The changesnoted in the review reflect a reduction in the number of oil-containing tanks and equip-ment managed at the Livermore site and Site 300.
Ground Water and Surface Water
Discharges of treated ground water to surface water drainage courses and percolationponds at LLNL are governed by NPDES permits, WDRs, and CERCLA Records ofDecision (see Table 2-4). The CVRWQCB is currently in the process of reissuingWDR 94-131. The SFBRWQCB is in the process of reissuing WDR 95-174. Details aboutsurface water discharges are found in Chapter 7 of this report. Details about groundwater monitoring are found in Chapters 8 and 9 of this report, the LLNL Ground WaterProject 1999 Annual Report (Aarons et al. 2000), and the LLNL Remedial ProgramManager’s quarterly reports (Littlejohn and Lamarre 1999, and Bainer and Littlejohn1999a,b).

Compliance Summary 2
LLNL Environmental Report for 1999 2-15
LLNL discharges storm water associated with industrial activities, low-threat nonstormwater, various process waters, and domestic wastewater to surface waters, percolationpits, surface impoundments, and a sewage lagoon under four NPDES permits and fourWDRs (see Chapters 7 and 9). LLNL received no Notices of Violation (NOVs) in 1999from the regional water quality control boards that issued the NPDES and WDRpermits; however, LLNL identified nonconformance with two of the four NPDESpermits (see Table 2-6). In addition, LLNL was unable to comply with prohibitions inWDR 96-248 on three occasions in 1999, where wastewater was released to the groundfrom containment or disposal systems. These discharges were reported by phone and inwriting to the CVRWQCB and are discussed further in Chapter 9.
Table 2-6. Summary of NPDES permit nonconformance.
PermitNo. Outfall Nonconformance
Date(s) ofnonconformance
Description–solution
CAS000002 Arroyo LasPositas(Livermore site)
National Ignition Facility—Failureto repair BMPs(a) within theSWPPP(b)-specified 48-hour period.
6/98–5/99(c) Delayed repair did not result inBMP failures or releases to thestorm drainage system.Contractors and construction staffwere reminded of maintenancerequirements.
National Ignition Facility—Failure toperform and document inspectionsfor laydown areas.
6/98–5/99 Revised SWPPP compliancestrategy for laydown areas toplace them under industrialSWPPP program.
Soil Reuse Project—Failure toupdate SWPPP to incorporate themore protective BMPs beingimplemented.
9/98 Updated the SWPPP.
Elk Ravine(Site 300)
Contained Firing Facility/ChemistryMagazine Loop Project—Failure toupdate SWPPP to incorporate a newproject area.
6/98–5/99 Wrote SWPPP amendment.
Contained Firing Facility/ChemistryMagazine Loop Project—Failure toupdate SWPPP at the start of a newconstruction project.
4/99 Updated the SWPPP.
CA0081396 Corral HollowCreek(Site 300)
Failure to collect required quarterlycooling tower monitoring samples.
10–12/99 Issued an internal nonconform-ance report and established asystem to remind technologists tocollect required samples.
a BMP = Best management practice.
b SWPPP = Storm Water Pollution Prevention Plan.
c These dates reflect the construction reporting period of June 1998 through May 1999. The actual nonconformance may not have occurredover the entire time; however, specific nonconformance dates cannot be determined.

2 Compliance Summary
2-16 LLNL Environmental Report for 1999
LLNL continued construction operations on four projects during 1999. These activitiesare covered by the California General Construction Activity permit (see Table 2-4).Continuing operations included construction of the Decontamination and Waste Treat-ment Facility (DWTF), the Soil Reuse Project, and the National Ignition Facility (NIF) atthe Livermore site and the Contained Firing Facility/Chemistry Magazine Loop Projectat Site 300.
The SFBRWQCB visited the Livermore site to observe the Sandia Recharge Basinassociated with the pending reissuance of WDR 88-075, and visited the North andSouthwest Buffer Zones and the Drainage Retention Basin after a staff change at theregional water quality control board. The CVRWQCB inspected the Site 300 permittedfacilities in April 1999. No violations were found at either site (see Tables 2-5a and 2-5b).
Sewerable Water
The Livermore site’s sanitary sewer discharges are sampled continuously, daily, weekly,and monthly to satisfy various permit requirements. The monitoring results for theLLNL effluent were reported monthly to the LWRP. In 1999, LLNL had no dischargesin violation of the LWRP permit covering wastewater discharges to the sanitary sewer.Self-monitoring of categorical processes continued during 1999, as required in thepermit; results were reported semiannually. In 1999, there were no compliance issuesrelated to categorical processes.
Discharges from ground water treatment facilities to sanitary sewer under Permit 1510G(1999) are monitored as they occur and reported annually to the LWRP. In 1999, LLNLcomplied with all the terms and conditions of Permit 1510G. Chapter 6 discusses theseself-monitoring programs for the site effluent, categorical processes, and dischargesfrom ground water treatment facilities. The analytical results that document permitcompliance with the self-monitoring provisions of the permits are discussed inChapter 6.
LWRP collected split samples of site effluent as part of the annual compliance sampling.LLNL and LWRP also inspected and sampled identified federally regulated processes.No deficiencies or violations were noted during any of the inspections (Table 2-5a).

Compliance Summary 2
LLNL Environmental Report for 1999 2-17
Streambed Alteration Agreements and Nationwide Permits
CDFG, SFBRWQCB, and ACOE all issue permits for work in streambeds. CDFG issuedone five-year streambed alteration agreement for maintenance within Arroyo Seco (seeTable 2-7). LLNL continued operations allowed under a five-year streambed alterationagreement issued for the Arroyo Las Positas Maintenance Project, and the SFBRWQCBissued a WDR for this project in October 1999. At Site 300, LLNL continued to operateunder a five-year CDFG streambed alteration agreement issued in 1995 for maintenanceof drainage channels. No projects at Site 300 or the Livermore site required permitsfrom ACOE during 1999.
Table 2-7. Summary of streambed alteration agreements, 404 nationwide permits,and 401 waivers or WDRs(a).
Project Location Agency/type of permit
Yearsubmitted
Storm-generated debris removaland vegetation management(five-year agreement)
Arroyo Seco CDFG/SAA(b) 1999
Arroyo Las Positas MaintenanceProject (five-year agreement)
Arroyo Las Positas CDFG/SAASFBRWQCB/ WDR
19981998
Maintenance (five-yearagreement)
Site 300 drainage culverts CDFG, SAA 1995
a WDR = Waste discharge requirements.
b SAA = Streambed Alteration Agreement.
Tank Management
LLNL manages its underground and aboveground storage tanks through the use ofunderground tank permits, monitoring programs, operational plans, closure plans andreports, leak reports and follow-up documentation, and inspections. At LLNL, under-ground storage tanks contain diesel fuel, gasoline, waste oil, and process wastewater;aboveground storage tanks contain diesel fuel, insulating oil, and process wastewater.Some wastewater systems are a combination of underground storage tanks and above-ground storage tanks. Table 2-8 shows the status of tanks at the Livermore site andSite 300 as of December 31, 1999. All regulated underground storage tanks at theLivermore site were inspected in 1999, and no violations were found (see Table 2-5a).

2 Compliance Summary
2-18 LLNL Environmental Report for 1999
Resource Conservation and Recovery Act and Related State Laws
The Resource Conservation and Recovery Act (RCRA) and its corresponding regulationsprovide the framework at the federal level for regulating the generation and manage-ment of solid wastes, including wastes designated as hazardous. Similarly, theCalifornia Hazardous Waste Control Act (HWCA) and the California Code of Regulations(CCR) Title 22, set requirements for managing hazardous wastes in California. RCRAand HWCA also regulate hazardous waste treatment, storage, and disposal facilities,including permit requirements. Because RCRA program authorization was delegated tothe State of California in 1992, LLNL works with DTSC on compliance issues and inobtaining hazardous waste permits.
Table 2-8. Summary of in-service tanks, December 31, 1999.
Livermore site Site 300
Tank typePermitted
Permitsnot
requiredTotal Permitted
Permitsnot
requiredTotal
Underground storage tanks
Diesel fuel 7 0 7 4 0 4
Gasoline 2 0 2 1 0 1
Waste oil 1 0 1 0 0 0
Process wastewater 3 31 34 0 7 7
Subtotal 13 31 44 5 7 12
Aboveground storage tanks
Diesel fuel 0 25 25 0 6 6
Insulating oil 0 1 1 0 3 3
Process wastewater 10(a) 56 66 0 12 12
Subtotal 10 82 92 0 21 21
TOTAL 23 113 136 5 28 33
a These 10 tanks are located at the LLNL Treatment and Storage Facility.

Compliance Summary 2
LLNL Environmental Report for 1999 2-19
Hazardous Waste Permits
Livermore Site
The hazardous waste management facilities at the Livermore site consist of permittedunits (located in Area 612, Building 280, and Buildings 695 and 693 of the DWTF) andunits that operate under interim status (Area 514 Facility and the Building 233 ContainerStorage Facility). Two units formerly under interim status reverted to generator statusunder a delayed closure provision in the hazardous waste permit. These units are theArea 612-4 Container Storage Unit and Building 612 Laboratory Packing/PackagingContainer Storage Unit. Permitted and interim status waste management units includecontainer storage, tank storage, and various treatment processes (e.g., wastewaterfiltration, blending, and size reduction).
In accordance with the document, Transition Plan, Transfer of Existing Waste TreatmentUnits to the Decontamination and Waste Treatment Facility (Van Warmerdam and Finley1997), operations in the Area 514 Facility will eventually be replaced by those in the newDWTF, and the Building 233 Container Storage Facility operations will be replaced bythe Building 280 Facility.
On May 27, 1999, DTSC signed the hazardous waste permit and issued a Notice of FinalPermit Decision for DWTF. On July 2, 1999, Tri-Valley CAREs et al. filed a petition forreview to appeal the permit decision. On July 29, 1999, DTSC issued a notice of thepermit decision appeal, staying the effective date of the hazardous waste permit, whichwas scheduled to become effective on July 9, 1999. On November 19, 1999, DTSC issuedan order denying the permit appeal, and the permit immediately became effective. OnDecember 23, 1999, a California Environmental Quality Act (CEQA) lawsuit was filedby Tri-Valley CAREs et al. This lawsuit challenges many of the environmental impactevaluations made in the DTSC initial study, which formed the basis of the CEQANegative Declaration determination. The lawsuit is currently in litigation.
As reported in previous SAERs, the Building 513 shredder incident on July 2, 1997,resulted in DOE and DTSC investigations. The DOE/Oakland Operations Office (OAK)Type B Accident Investigation Committee issued its report on October 31, 1997, whichincluded several Judgments of Need (JONs). LLNL, in turn, submitted an action planin response to the JONs, and on March 11, 1999, DOE validated the completion ofcorrective actions derived from the JONs. DTSC representatives visited LLNL onNovember 12, 1997, and February 5, 1998. Their investigation of the shredder incidentresulted in a Summary of Violations (SOV) dated February 9, 1998. LLNL, DOE, andDTSC are still developing an agreement regarding these issues, but continued delayscaused by higher priority actions effectively closes our reporting of the Building 513

2 Compliance Summary
2-20 LLNL Environmental Report for 1999
incident in this report. The shredder unit involved in the incident has undergone RCRAclosure, the shredder equipment has been removed from service, and the building hasbeen released for normal use.
On May 26 and 27, 1998, DTSC conducted a compliance evaluation inspection of thehazardous waste storage and treatment facilities at the Livermore site. LLNL did notreceive the final inspection report in 1999.
On June 28 and 29; July 12, 13, 15, and 16; and August 12, 1999, DTSC conducted acompliance evaluation inspection of the hazardous waste storage and treatment facilitiesat the Livermore site (see Table 2-5a). On August 12, 1999, LLNL received a SOV listingfour alleged violations. LLNL responded to DTSC’s SOV on August 19, 1999. OnDecember 22, 1999, LLNL received the final inspection report and SOV. The final SOVlisted 16 alleged violations, incorporating some of the previous alleged violations listedin the August SOV, dismissing others that were previously listed, and adding newalleged violations. The final inspection report also requested 41 items of additionalinformation. On February 15, 2000, LLNL responded to DTSC regarding the allegedviolations and information request. LLNL has not yet received a response from DTSC.
Site 300
The Explosives Waste Treatment Facility (EWTF), which replaced the closed Building 829Open Burn Facility, became operational in March 1999. Upon receiving DTSC approval,closure operations for the Building 829 Open Burn Facility began in October 1997. Thefacility was closed in accordance with the Final Closure Plan for the High-Explosives OpenBurn Facility at Lawrence Livermore National Laboratory Experimental Test Site 300 (Mathewsand Taffet 1997). The closure report, Construction Quality Assurance for the RCRA Closureof Building 829 High Explosives Open Burn Treatment Facility (Golder Construction Services1998), was submitted to DTSC in February 1999.
On June 17, July 9, and July 13, 1999, DTSC conducted a compliance evaluation inspec-tion of Site 300 hazardous waste generator areas, the Building 883 Container StorageArea, Explosives Waste Storage Facility (EWSF), and EWTF. As a result of the inspec-tion, on July 13, 1999, DTSC issued a SOV under the category of “Minor Violations/Notice to Comply” for failing to provide annual refresher self-contained breathingapparatus training for one Building 883 Container Storage Area Hazardous WasteManagement technician (see Table 2-5b). LLNL provided the required training onJuly 27, 1999, and submitted a certification of course completion to DTSC on August 2,1999. After reviewing the submittal, DTSC issued a letter, dated September 16, 1999,stating that Site 300 is again in compliance.

Compliance Summary 2
LLNL Environmental Report for 1999 2-21
Hazardous Waste Reports
LLNL completed two annual hazardous waste reports, one for the Livermore site andthe other for Site 300, which address the 1999 transportation, storage, disposal, andrecycling of hazardous wastes. The annual reports, required under 22 CCR 66262.41,were completed and submitted to meet DTSC’s April 1, 2000, deadline. These samereports, 1999 Hazardous Waste Report—Mainsite and 1999 Hazardous Waste Report—Site 300 (Galles and Gilbert 2000a, b), were submitted to the EPA under Sections 3002and 3004 of RCRA, which requires a biennial reporting of hazardous wastes. DTSC isauthorized to receive the reports for EPA.
Hazardous Waste Transport Registration
Transportation of hazardous waste over public roads (e.g., from one LLNL site toanother) requires DTSC registration (22 CCR 66263.10). Conditions for registration mayinclude annual inspections of transport vehicles and trailers by the California HighwayPatrol (CHP), biennial terminal inspections, and special training and annual physicalexaminations for drivers. DTSC renewed LLNL’s registration in November 1999. TheCHP opted not to conduct inspections of LLNL vehicles in 1999.
Waste Accumulation Areas
In January 1999, there were 20 Waste Accumulation Areas (WAAs) at the Livermore site.Consolidation efforts resulted in the closure of one WAA; additionally, five temporaryWAAs were put into service, and four temporary WAAs were taken out of service.Program representatives conducted formal inspections at least weekly at all WAAs toensure that they were operated in compliance with regulatory requirements. Approxi-mately 1107 formal WAA inspections were conducted at the Livermore site.
In January 1999, there were two WAAs at Site 300. One WAA was closed in 1999,leaving one WAA at Site 300. Program representatives conducted 92 formal inspectionsof the WAAs at Site 300.
2 Compliance Summary
2-22 LLNL Environmental Report for 1999
California Medical Waste Management Act
All LLNL medical waste management operations comply with the California MedicalWaste Management Act, Health and Safety Code Sections 117600–118360, Chapters 1–11.The Medical Waste Management Act establishes a comprehensive program for regulatingthe management, transport, and treatment of medical wastes that contain substances thatmay potentially infect humans. The program is administered by the State Department ofHealth Services (DHS) and is enforced by the Alameda County Department of Environ-mental Health (ACDEH).
LLNL is registered with the ACDEH as a generator of medical waste and has a treat-ment permit. The ACDEH inspection of buildings at Health Services, the Biology andBiotechnology Research Program, and the Medical Photonics Laboratory did not resultin any compliance issues or violations (see Table 2-5a).
Federal Facility Compliance Act
LLNL is continuing to work with DOE to maintain compliance with the Site TreatmentPlan (STP) that was signed in February 1997. All milestones for 1999 were completed ontime. Reports and certification letters were submitted to DOE as required. The use ofcommercial facilities has allowed and will continue to allow earlier disposal of somewaste streams than the dates listed in the STP.
Toxic Substances Control Act
The Federal Toxic Substances Control Act (TSCA) and implementing regulations foundin Title 49, Code of Federal Regulations, Parts 700–789, govern the uses of newly developedchemical substances and TSCA-governed waste by establishing requirements forrecordkeeping, reporting, disposal standards, employee protection, compliance andenforcement, and cleanup standards.
In 1999, LLNL generated TSCA PCB waste from CERCLA cleanup projects, PCB oildrained from electrical equipment, electrical equipment contaminated with PCBs, liquidPCBs used to calibrate analytical equipment, and TSCA-regulated asbestos frombuilding demolition or renovation projects.

Compliance Summary 2
LLNL Environmental Report for 1999 2-23
All TSCA-regulated waste was disposed of in accordance with TSCA, state, and localdisposal requirements except for radioactively contaminated PCB waste. RadioactivePCB waste, typically known as transuranic (TRU) mixed waste or mixed waste, iscurrently stored at one of LLNL’s hazardous waste storage facilities until the WasteIsolation Pilot Project, or other approved facility, accepts this waste for final disposal.
National Environmental Policy Act
The National Environmental Policy Act (NEPA; 42 U.S. Code [USC] 4321 et seq.) establ-ished federal policy for protecting environmental quality. The major method forachieving established NEPA goals is the requirement for preparing an environmentalimpact statement (EIS) for any major federal or federally funded project that may havesignificant impact on the quality of the human environment. If the need for an EIS isnot clear, or if the project does not meet DOE’s criteria for requiring an EIS, an environ-mental assessment (EA) is prepared. A Finding Of No Significant Impact (FONSI) isissued when an EIS is determined to be unnecessary.
Certain groups of actions that do not have a significant effect on the environment eitherindividually or cumulatively can be categorically excluded from a more in-depth NEPAreview (i.e., preparation of either an EA or EIS). DOE NEPA implementing procedures(61 FR 36222 and 57 FR 15122) identify those categorical exclusions and the eligibilitycriteria for their application. If a proposed project does not clearly fit one of the exclu-sion categories, DOE determines which type of assessment document may be needed.
In 1999, one FONSI for the EA of the Terascale Simulation Facility Project was issuedby DOE. Preparation of another EA for the decommissioning and demolition ofBuildings 222 and 412 began in 1999. Eighteen categorical exclusion applications wereapproved by DOE, and there were no proposed actions at LLNL that required separateDOE floodplain or wetlands assessments under DOE regulations in 10 CFR 1022. InMarch 1999, DOE issued a Supplement Analysis (U.S. Department of Energy 1999b) thatconcluded that the 1992 Final Environmental Impact Statement and Environmental ImpactReport for Continued Operation of Lawrence Livermore National Laboratory and Sandia NationalLaboratories, Livermore (1992 EIS/EIR) (U.S. Department of Energy and University ofCalifornia 1992a and b) did not need to be supplemented and remained adequate.

2 Compliance Summary
2-24 LLNL Environmental Report for 1999
California Environmental Quality Act
In November 1992, the University of California (UC) and LLNL made a commitment toimplement 67 mitigation measures identified by the 1992 EIS/EIR and to provide annualreports on their implementation. The measures are being implemented in accordancewith the approved 1992 Mitigation Monitoring and Reporting Program associated withthat joint DOE/UC EIS/EIR. The fiscal year 1997 annual report was published in 1999;the next annual report will cover fiscal year 1998 activities. One CEQA mitigatedNegative Declaration was issued in 1999 for the Arroyo Las Positas Maintenance Project.
National Historic Preservation Act
The National Historic Preservation Act of 1966 (NHPA), as amended through 1992,requires federally operated and funded installations such as LLNL to balance agencymissions with cultural values by integrating historic preservation into federal agencyprograms. Federal agencies must take into account the effects their projects may haveon “historic properties” (cultural resources), and they must allow a reasonable timeperiod for the Advisory Council on Historic Preservation (the Council) to comment.LLNL has three significant types of cultural resources: (1) prehistoric, (2) historic(turn-of-the-century homesteading, ranching, and industrial), and (3) historic (WorldWar II and Cold War science and technology).
A draft Programmatic Agreement (PA) was developed by LLNL in 1997 in consultationwith the DOE/OAK, the Council, and the California Office of Historic Preservation tohelp LLNL implement applicable federal and state cultural resource laws and regula-tions. Activities included cultural overviews, development of theme and context forsignificance evaluation, research designs, archaeological site identification and evalu-ation methods, and records and collection management. The activities will also generateneeded data and methods in order to develop a Cultural Resource Management Plan(CRMP), the final objective of the PA.
As a result of consultation with the Council and SHPO during a joint meeting with DOEin December 1998, the 1997 Draft PA is being modified and finalized. During 1999,LLNL continued consulting with DOE/OAK, the Council, and SHPO to formulate thecontent of the revised PA. The Fire Trail Relocation Project at Site 300 cut a new sectionof fire trail outside the boundaries of a known historic archaeological site. This actionserved to protect and preserve the site from future impacts so that LLNL can evaluate itand assess its significance and eligibility for listing on the National Register of HistoricPlaces.

Compliance Summary 2
LLNL Environmental Report for 1999 2-25
Endangered Species Acts and Sensitive Natural Resources
LLNL must meet the requirements of the U.S. Endangered Species Act, the CaliforniaEndangered Species Act, and the California Native Plant Protection Act as they pertainto endangered or threatened species and habitats and other species of special concernthat may exist or are known to exist at the LLNL sites. For example, in implementingthe 1992 Mitigation Monitoring and Reporting Program in 1999, biological assessmentsurveys were performed for special-status species at 76 LLNL project construction(ground-disturbing) areas. Presence data for the San Joaquin kit fox (Vulpes macrotismutica), American badger (Taxidea taxus), and Western burrowing owl (Speotytocunicularia) were collected at each Site 300 project location, and other applicable mitiga-tion measures were implemented where appropriate.
During 1999, no active San Joaquin kit fox dens were discovered, but five potential denswere found. Ten occupied American badger dens were discovered, and 40 unoccupieddens were identified. Eighteen active burrowing owl dens were discovered and moni-tored throughout the breeding and wintering season. The owls were marked withaluminum leg bands to initiate long-term studies, monitoring, and conservation of thespecies in the rugged topography of Site 300. Livermore site populations of thefederally threatened California red-legged frog (Rana aurora draytonii) were monitoredand protected in accordance with the 1997 and 1998 amended U.S. Fish and WildlifeService Biological Opinions. In addition, a Species of Special Concern and federalcandidate, the California tiger salamander (Ambystoma tigrinum), was monitored atwetland locations at Site 300. At the Livermore site, three pairs of white-tailed kites(Elanus lecurus), a state-protected bird of prey, successfully fledged 18 young. The kiteswere marked with aluminum leg bands to initiate long-term studies of the species in asemiurban edge habitat.
Two of the three known natural populations of the large-flowered fiddleneck (Amsinckiagrandiflora), a federally listed endangered plant species, occur at Site 300. A portion ofSite 300 has been designated as federal critical habitat for the plant. In addition, LLNLhas established an experimental population within the designated critical habitat. LLNLis working with the U.S. Fish and Wildlife Service on continued monitoring of nativeand experimental Amsinckia populations, and to further develop habitat restoration andmaintenance techniques. A progress report was prepared and submitted to the U.S. Fishand Wildlife Service in October 1999 (Carlsen et al. 1999).
The smaller of the two on-site native populations of fiddleneck was extirpated in 1997when the bank containing the population washed away. No plants have been observedat this site since 1998. The number of fiddleneck plants in the larger native population

2 Compliance Summary
2-26 LLNL Environmental Report for 1999
continued to decline (six plants remaining in 1999, down from 218 plants observed in1998). The number of fiddleneck plants observed in the experimental population alsodeclined (42 plants remaining in 1999, down from 64 plants observed in 1998).
These declines were observed even though both populations were treated in 1998 toreduce competing grass cover. The three-year decline has also been observed in otherexisting natural and experimental populations of fiddleneck. A dramatic increase innutlet predation by small rodents has been observed in the Site 300 experimentalpopulation. It is likely that several years of heavy grass cover resulted in increasednumbers of seed predators. A study to determine the effect of rodent removal on nutletpredation is planned. The experimental population will also be expanded with addi-tional native grass and Amsinckia transplantation to investigate more fully the use of fireas a management tool.
Monitoring of the big tarplant (Blepharazonia plumosa, listed on the California NativePlant Society Rare Plant 1B List), and the diamond-petaled poppy (Eschscholziarhombipetala, a plant thought to be extinct until rediscovered) continued in 1999. The bigtarplant remained widespread throughout Site 300, although the individual populationswere much reduced in size. A total of nine diamond-petaled poppy plants were located(down from the 26 observed in 1998). Of these, six plants produced seed-bearing pods.
Antiquities Act (of 1906): Paleontological Resources
During soil excavation for the National Ignition Facility at the Livermore site in 1997, amolar from a 14,000-year-old mammoth was found at a depth of about 10 m below thesurface. After this discovery, LLNL obtained an excavation permit from the Departmentof Interior under the provisions of the Antiquities Act of 1906 and removed bones fromthe construction area in late 1997 and early 1998. The bones (including 11 ribs, threevertebrae, one humerus, one complete and one partial tusk, and a partial skull withpalate, jawbone, and molars) were accessioned into the UC Berkeley Museum ofPaleontology collection in 1999 and have been partially prepared for possible laterpresentation at LLNL.
Environmental Occurrences
Notification of environmental occurrences is required under a number of environmentallaws and regulations as well as DOE Order 232.1, Occurrence Reporting and Processing of

Compliance Summary 2
LLNL Environmental Report for 1999 2-27
Operations Information, and DOE Order 5484.1, Environmental Protection, Safety, andHealth Protection Information Reporting Requirements. DOE Order 232.1 providesguidelines to contractor facilities regarding categorization and reporting of environ-mental occurrences to DOE and divides occurrences into three categories: emergencyoccurrences, unusual occurrences, and off-normal occurrences.
The Environmental Protection Department’s response to environmental occurrences ispart of the larger LLNL on-site emergency response organization that also includesrepresentatives from Hazards Control (including the LLNL Fire Department), HealthServices, Plant Engineering, Public Affairs, Safeguards and Security, and Site 300. In1999, four environmental incidents were reportable under DOE Order 232.1 and werecategorized as off-normal occurrences according to DOE Order 232.1.
None of the environmental occurrences, summarized in Table 2-9, caused any adverseimpact to the public or the environment. Agencies notified of these incidents includedDOE and DTSC.
Table 2-9. Tabulation of environmental occurrences reported under the Occurrence Reporting (OR)System, 1999.
Date(a) Occurrencecategory
Description
Feb 2 Off-Normal LLNL shipped two 50-lb containers of dry explosives from the Nevada Test Site to the Pantexfacility in Texas by commercial carrier. A small amount of the dry explosives (approximately oneteaspoon) was released from one of the containers to the bed of the truck carrying thecontainers. The material was properly cleaned up, and the vehicle was released. The looseexplosive material was not capable of detonation but could have contributed to a fire. A releaseof a hazardous material meets the requirements of an Off-Normal Occurrence. OR 1999-0004.
July 13 Off-Normal Following a regulatory inspection of Site 300 by the DTSC, LLNL was issued a SOV for atraining violation. During a review of personnel training records, it was discovered that aHWM(b) field technician was two months overdue for SCBA refresher training. Receiving anSOV meets the requirements of an Off-Normal Occurrence. OR 1999–0026.
Aug 12 Off-Normal As a result of a regulatory inspection by the DTSC, LLNL was issued a SOV on Aug. 12, 1999.The initial SOV identified four alleged violations. On Dec. 22, 1999, LLNL received a DTSCInspection Report and NOV, adding 12 alleged violations to the previous four. The allegedviolations involved administrative practices, operating record issues, and training deficiencies.No findings involved compromise of public protection. Receiving an SOV/NOV meets therequirements of an Off-Normal Occurrence. OR 1999–0037.

2 Compliance Summary
2-28 LLNL Environmental Report for 1999
Table 2-9. Tabulation of environmental occurrences reported under the Occurrence Reporting (OR)System, 1999 (concluded).
Date(a) Occurrencecategory
Description
Sept 22 Off-Normal On September 21, 1999, a Hazardous Waste Management contractor employee was preparinghazardous waste for off-site shipment. The contractor was packaging a bottle containing Raneynickel, a solid that is normally suspended in water. After observing that there was no water inthe container, the contractor added water to the container, allowed time for gas generation, andthen replaced the screw cap. The contents of the container over-pressurized, blowing off theplastic screw cap. Less than 2.5 ounces of the material was discharged to the ceiling of theroom and to the contractor’s hair and shirt collar. The contractor and the room weredecontaminated. There was no release to the environment because all the contents of thebottle were contained in the room. No injuries occurred, and assistance from the FireDepartment was not needed. It was determined that this near-miss occurrence resulted from afailure to communicate or follow instructions. A courtesy phone call was made to DTSCinforming it that a DOE occurrence report was initiated. Having only one barrier to prevent therelease of a hazardous material to the environment meets the requirements of a Near Miss Off-Normal Occurrence. OR 1999–0045.
a The date indicated is the date when the occurrence was categorized, not the date of its discovery.
b See Glossary for list of acronyms.
Contributing Authors Acknowledgment
Many authors significantly contributed to this large and diverse chapter. Weacknowledge here the work of David Armstrong, Jamie Bennett, Richard Blake,John Buchanan, Winifred Burks-Houck, Tina Carlsen, Karen Doiron, Karen Folks,Gretchen Gallegos, Ted Giesing, Keith Gilbert, Charlene Grandfield, Allen Grayson,Robert Harrach, Steve Harris, Rod Hollister, Bill Hoppes, Susi Jackson, Albert Lamarre,Jennifer Larson, Saverio Mancieri, Sandra Mathews, Willie Montemayor, Barbara Nisbet,Victoria Salvo, Bill Schwartz, Judy Steenhoven, Michael Taffet, Stan Terusaki,Charlotte Van Warmerdam, Joseph Woods, Jim Woollett, Jr., and Kenneth Zahn.

3
LLNL Environmental Report for 1999 3-1
Environmental ProgramInformation
Introduction
Lawrence Livermore National Laboratory is committed to operating in a manner thatpreserves the quality of the environment. The Environmental Protection Department(EPD) leads this effort in the areas of environmental compliance and accountability.This chapter begins with a brief description of LLNL’s integrated Environment, Safety,and Health (ES&H) Management System and continues with discussions of Work SmartStandards (WSS), missions, and activities of EPD and its three divisions. Performancemeasures (PMs) used by the U.S. Department of Energy (DOE) to evaluate theLaboratory’s environmental protection efforts are then summarized. The bulk of thechapter is devoted to an account of LLNL’s activities and progress in waste minimi-zation and pollution prevention in 1999. Following descriptions of current issues andactions in the environmental program arena, this chapter concludes with a briefdiscussion of spill response and EPD environmental training.
Integrated Environment, Safety, and Health Management System
In 1998, LLNL began the process of developing and implementing an Integrated SafetyManagement System (ISMS) in accordance with the requirements of the University ofCalifornia’s (UC’s) Prime Contract W-7405-ENG-48, Clause 6.7. The LLNL ISMS isdesigned to ensure the systematic integration of ES&H considerations into managementand work practices so that missions are accomplished while protecting the public,workers, and the environment. “Safety” used in this context is synonymous withenvironment, safety, and health to encompass protection of the public, workers, andthe environment (including pollution prevention and waste minimization). The corerequirements of ISMS are based on the DOE’s Seven Guiding Principles and Five CoreFunctions.
The Seven Guiding Principles can be summarized as: (1) line management is respon-sible for ensuring the protection of employees, the public, and the environment; (2) clearroles and responsibilities for ES&H are established and maintained; (3) personnelcompetence is commensurate with their responsibilities; (4) resources are effectively

3 Environmental Program Information
3-2 LLNL Environmental Report for 1999
allocated to address ES&H, programmatic, and operational considerations withbalanced priorities; (5) safety standards and requirements are established that ensureadequate protection of the employees, the public, and the environment; (6) admini-strative and engineering controls to prevent and mitigate ES&H hazards are tailoredto the work being performed; and (7) operations are authorized.
The Five Core Functions that describe how LLNL shall manage and perform work aresummarized as: (1) define the scope of work; (2) identify and analyze the hazardsassociated with the work; (3) develop and implement hazards controls; (4) performwork within the controls; and (5) provide feedback on the adequacy of the controls forcontinuous improvement.
The implementation of a management system based on these principles and functionsresults in accountability at all levels of the organization, project planning with protectionin mind, and excellence in program execution. The ISMS Program at LLNL employs aprocess of assessing hazards and the environmental implications of work; designing andimplementing standards-based methods intended to control risks; and complying withapplicable ES&H requirements. This process is implemented using a graded approach,which increases the level of risk management as hazards increase. The completedescription of LLNL’s ISMS can be found in Integrated Safety Management SystemDescription (Clough 2000).
On November 15, 1999, the Laboratory declared its readiness for the DOE Phase IVerification of the institutional ISMS. DOE initiated the verification on November 29,1999, and the results of the verification were presented on December 9, 1999. DOErecommended approval of the LLNL ISMS description after the completion of severalaction items.
Work Smart Standards
In 1997, LLNL and DOE’s Oakland Operations Office (DOE/OAK) inaugurated aWSS process (DOE M 450.3-1), whereby safety professionals from both organizationsidentified ES&H hazards and established standards of operation appropriate for theparticular work environment.
The WSS process requires an understanding of the work, an analysis of the hazardsassociated with the work, and the selection of standards from which hazard controls aredeveloped. LLNL has traditionally identified and controlled hazards to protect theLLNL staff, the public, and the environment, but the WSS process differs from the past

Environmental Program Information 3
LLNL Environmental Report for 1999 3-3
in that responsibility for selection of appropriate and necessary standards is in the handsof both the DOE field office and LLNL. This process empowers the Laboratory and localDOE staffs, through consensus, to focus on the work being performed and to selectsitewide ES&H standards based on the actual work being conducted and its associatedhazards and threats to the environment. In 1998, several hundred individuals partici-pated in the WSS process, including more than 100 subject matter experts (SMEs) whoidentified standards based on the work and the hazards. In addition, requirements formanaging processes were identified to better connect project planning and executionwith the standards, thereby providing protection to workers, the public, and the envi-ronment. This process resulted in the identification of almost 700 individual require-ments, of which more than 250 directly relate to environmental protection. The WSSprocess also identified the need to develop nine local standards to either fill gaps orenhance existing standards; these ranged from standards on ergonomics to high-efficiency particulate air (HEPA) filters. For example, radioactive waste storage facilityand tank system design criteria standards (Wood et al. 1999) were developed to ensurethat requirements for facility design protect the environment.
WSSs were approved at the management level closest to and with the most expertisein the work. The LLNL Director and DOE/OAK Manager approved the final set ofsitewide standards on August 5, 1999, after they were confirmed by an independentpanel of external experts in March 1999. The WSS set was essentially considered partof the UC contract once it was signed by the LLNL Director and the DOE/OAKManager. Reaching these agreements with DOE on new work-based standards alignsthe Laboratory with industry practice, establishes common ES&H expectations for DOEand UC, and facilitates the tailoring of requirements to streamline and increase theeffectiveness of management at the Laboratory. The existing ES&H methodologies anddocumentation are being modified to incorporate the newly identified set of standardsand to reflect the requirements of ISMS.
Meeting new expectations for integrated ES&H management at the Laboratory will takeseveral years, but the WSS approach, coupled with enhanced, integrated management,promises further safety improvements and lower costs.
Environmental Protection Department
As the lead organization at LLNL for providing environmental expertise and guidanceto operations at LLNL, EPD is responsible for environmental monitoring, environmentalregulatory compliance, environmental restoration, environmental community relations,

3 Environmental Program Information
3-4 LLNL Environmental Report for 1999
and hazardous waste management in support of the Laboratory’s programs. EPDprepares and maintains environmental plans, reports, and permits; maintains theenvironmental portions of the ES&H Manual; informs management about pendingchanges in environmental regulations pertinent to LLNL; represents the Laboratoryin day-to-day interactions with regulatory agencies and the public; and assesses theeffectiveness of pollution control programs.
EPD monitors air, sewerable water, ground water, surface water, soil, sediments,vegetation, and foodstuff, as well as direct radiation; evaluates possible contaminantsources; and models the impact of LLNL operations on humans and the environment.In 1999, 13,372 samples were taken, and 252,469 analytes were tested. The type ofsamples collected at a specific location depends on the site and the potential pollutantsto be monitored; see the specific chapters of this report for discussions of each environ-mental medium.
A principal part of EPD’s mission is to work with LLNL programs to ensure that opera-tions are conducted in a manner that limits environmental impacts and is in compliancewith regulatory guidelines. EPD helps LLNL programs manage and minimizehazardous, radioactive, and mixed wastes; determines the concentrations of environ-mental contaminants remaining from past activities; cleans up environmental contami-nation to acceptable standards; responds to emergencies in order to minimize and assessany impact on the environment and the public; and provides training programs toimprove the ability of LLNL employees to comply with environmental regulations.
LLNL programs are supported by the Hazards Control Department’s four ES&H teamsand by EPD’s four environmental support teams (ESTs). The ESTs are integrated intothe ES&H teams at the Laboratory through the environmental analyst, who chairs theESTs. Each EST includes representatives from environmental specialties within theOperations and Regulatory Affairs Division (ORAD), the ES&H teams, and a fieldtechnician from the Hazardous Waste Management (HWM) Division. Some ESTs alsoinclude a representative from the Environmental Restoration Division (ERD) or theorganizations supported by the ESTs. These teams evaluate operations, determinepotential environmental impacts, and provide guidance on environmental regulationsand DOE orders for existing and proposed projects. ESTs assist programs in planning,implementing, and operating projects and in understanding and meeting their environ-mental obligations. When permits are obtained from regulatory agencies, ESTs aid theprograms in evaluating the permit conditions and implementing recordkeepingrequirements.

Environmental Program Information 3
LLNL Environmental Report for 1999 3-5
Operations and Regulatory Affairs Division
ORAD currently consists of seven groups that specialize in environmental complianceand monitoring and provide laboratory programs with a wide range of information,data, and guidance to make more informed environmental decisions.
ORAD prepares the environmental permit applications and related documents forsubmittal to federal, state, and local agencies; provides the liaison between LLNL andregulatory agencies conducting inspections; tracks chemical inventories; preparesNational Environmental Policy Act (NEPA) documents; conducts related field studiesfor DOE; oversees wetland protection and floodplain management requirements;coordinates cultural and wildlife resource protection and management; facilitatesand provides support for the pollution prevention and recycling programs; teachesenvironmental training courses; coordinates the tank environmental complianceprogram; conducts compliance and surveillance monitoring; and provides environ-mental impact modeling and analysis, risk assessment, and reporting.
ORAD also actively assists in responding to environmental emergencies such as spills.During normal working hours, an environmental analyst from the ORAD Environ-mental Operations Group (EOG) responds to environmental emergencies and notifies aspecially trained environmental duty officer. Environmental duty officers are on duty24 hours a day, 7 days a week, and coordinate emergency response with LLNL’s ES&Hteam and other first responders or environmental specialists.
Hazardous Waste Management Division
All hazardous, radioactive, and mixed wastes generated at LLNL facilities are managedby the HWM Division in accordance with state and federal requirements. HWMprocesses, stores, packages, solidifies, treats, and prepares waste for shipment anddisposal, recycling, or discharge to the sanitary sewer.
As part of its waste management activities, HWM tracks and documents the movementof hazardous, mixed, and radioactive wastes from waste accumulation areas (WAAs)located near the waste generator to final disposition; develops and implementsapproved standard operating procedures; decontaminates LLNL equipment; ensuresthat containers for shipment of waste meet the specifications of the U.S. Departmentof Transportation (DOT) and other regulatory agencies; responds to emergencies; andparticipates in the cleanup of potential hazardous and radioactive spills at LLNLfacilities. HWM prepares numerous reports, including the annual and biennial

3 Environmental Program Information
3-6 LLNL Environmental Report for 1999
hazardous waste reports required by the state and federal environmental protectionagencies (see Appendix B). HWM also prepares waste acceptance criteria documents,safety analysis reports, and various waste guidance and management plans.
HWM meets regulations requiring the treatment and disposal of LLNL’s mixed waste inaccordance with the requirements of the Federal Facility Compliance Act. The schedulefor this treatment is negotiated with the State of California and involves developing newon-site treatment options as well as finding off-site alternatives.
HWM is responsible for implementing a program directed at eliminating the backlog oflegacy waste (waste that is not at present certified for disposal). This effort includes alarge characterization effort to identify all components of the waste and a certificationeffort that will provide appropriate documentation for the disposal site.
Environmental Restoration Division
ERD was established to evaluate and remediate soil and ground water contaminated bypast hazardous materials handling and disposal processes and from leaks and spillsthat have occurred at the Livermore site and Site 300, both prior to and during LLNLoperations. ERD conducts field investigations at both the Livermore site and Site 300 tocharacterize the existence, extent, and impact of contamination. ERD evaluates anddevelops various remediation technologies, makes recommendations, and implementsactions for site restoration. ERD is responsible for managing remedial activities, such assoil removal and ground water extraction, and for assisting in closing inactive facilitiesin a manner designed to prevent environmental contamination.
As part of its responsibility for Comprehensive Environmental Response, Compensation,and Liability Act (CERCLA) compliance issues, ERD plans, directs, and conductsassessments to determine both the impact of past releases on the environment and therestoration activities needed to reduce contaminant concentrations to protect humanhealth and the environment. ERD interacts with the community on these issues throughEnvironmental Community Relations. Public meetings are held each year and infor-mation provided to the public as required in the ERD CERCLA Community RelationsPlans. To comply with CERCLA ground water remedial actions at the Livermore site,ERD has to date designed, constructed, and operated five fixed ground water treatmentfacilities and associated pipeline networks and wells, 16 portable ground water treatmentunits, and two soil vapor extraction facilities (see Chapter 8). At Site 300, ERD hasdesigned, constructed, and operated three soil vapor extraction facilities and sevenground water extraction and treatment facilities.

Environmental Program Information 3
LLNL Environmental Report for 1999 3-7
ERD is actively designing, testing, and applying innovative remediation and assessmenttechnologies to contaminant problems at the Livermore site and Site 300. ERD providesthe sampling and data management support for ground water surveillance andcompliance monitoring activities.
Performance Measures Summary
Since 1992, UC’s contract to manage and operate LLNL for DOE has contained per-formance objectives, criteria, and measures. Four of these performance measures (PMs)are used to evaluate LLNL’s environmental protection activities.
At the end of 1999, DOE gave LLNL an average score of excellent for its environmentalperformance in 1998. DOE scores for individual performance measures are shownin Table 3-1. As indicated in the table, performance details are described in theEnvironmental Report 1998 (Larson et al. 1999). Performance measure data for 1999 willbe included in the annual self-assessment and evaluation conducted in 2000.
DOE Pollution Prevention Goals
The Secretary of Energy committed DOE to the following Pollution Prevention (P2)goals to be achieved throughout the DOE complex by December 31, 1999, using 1993 asa baseline:
1. Reduce total releases and off-site transfers for treatment and disposal ofEmergency Planning and Community Right-to-Know Act (EPCRA)Section 313 toxic chemicals from routine operations by 50%.
2. Reduce the generation of radioactive waste from routine operations by 50%.
3. Reduce the generation of low-level mixed waste from routine operations by 50%.
4. Reduce the generation of hazardous waste from routine operations by 50%.
5. Reduce the generation of sanitary waste (after recycling) from routineoperations by 33%.
6. Divert 33% of sanitary waste from all operations for recycling.
7. Increase the affirmative procurement of EPA-designated recycled productsto 100%.

3 Environmental Program Information
3-8 LLNL Environmental Report for 1999
Table 3-1. UC Contract 48 environmental protection performance measures for environmentalperformance in 1998.
PMdesignator
Performance measure Location in Environmental Report 1998 Score
1.4.b Radiation dose to the public
Public radiation doses to the maximally exposedindividual from DOE operations will be measuredor calculated and controlled to ensure that dosesare kept as low as reasonably achievable(ALARA).
Chapter 13, Radiological Dose Assessment,section on Radiological Doses from 1998Operations.
Chapter 2, Compliance Summary, section onNational Emission Standards for HazardousAir Pollutants.
Outstanding
1.4.g Process and solid waste generation(Waste reduction and recycling)
The Laboratory continues to progress towardmeeting the DOE’s pollution prevention goals forthe year 2000.
Chapter 3, section on WasteMinimization/Pollution Prevention.
Excellent
1.4.h Environmental violations
The rate of validated environmental violationsfrom inspections and reporting requirementsfrom regulatory agencies is kept low.
Chapter 2: Compliance Summary,Tables 2-5a, 2-5b, and 2-9.
Excellent
1.4.i Environmental releases
The Laboratory controls and reduces the numberof occurrences of environmental releases andthe number of releases that result in violations.
Chapter 2: Compliance Summary,Table 2-9.
Outstanding
Progress toward achieving these goals is reported annually to the Secretary of Energyin DOE’s Annual Report of Waste Generation and Pollution Prevention Progress (U.S.Department of Energy 1994, 1996a, 1997, 1998c, and 1999a).
In November 1999, the Secretary of Energy issued a new set of pollution prevention andenergy efficiency goals in response to the President’s Executive Orders for Greening theFederal Government. These goals provide direction for continued promotion of pollu-tion prevention and waste minimization beyond the year 2000. Additionally, theyexpand the scope of previous goals to consider the following: building and facilityenergy efficiency; reduction of releases of toxic chemicals, ozone-depleting substances,and greenhouse gases; increased vehicle fleet efficiency and use of alternative fuels; andthe required purchasing of environmentally preferable products and services. The newgoals will continue to use 1993 as a baseline and have interim measurement points in2005 and 2010.

Environmental Program Information 3
LLNL Environmental Report for 1999 3-9
LLNL prepares a P2 Plan that meets the requirements of (1) DOE Orders 5820.2A and5400.1; (2) Resource Conservation and Recovery Act of 1976 (RCRA) Sections 3002(b)and 3005(h); and (3) Title 22 of the California Code of Regulations. This plan is reviewedannually and is typically updated every three years. The plan reviews past and currentpollution prevention activities and states the objectives of LLNL’s waste minimizationand pollution prevention efforts. It was last updated and submitted to DOE inMay 1997 (Celeste 1997). The timeline for the expected 2000 update to the LLNL P2Plan has been deferred per DOE guidance.
The P2 Program at LLNL is an organized, comprehensive, and continuing effort tosystematically reduce solid, hazardous, radioactive, and mixed-waste generation. TheP2 Program is designed to eliminate or minimize pollutant releases to all environmentalmedia from all aspects of the site’s operations. These efforts help protect public healthand the environment by reducing or eliminating waste management and compliancecosts, resource usage, inventories and releases of hazardous chemicals, and civil andcriminal liabilities under environmental laws.
In accordance with EPA guidelines and DOE policy, a hierarchical approach to wastereduction (i.e., source elimination or reduction, material substitution, reuse and recycling,and treatment and disposal) has been adopted and is applied to all types of waste.
Waste Minimization/Pollution Prevention
LLNL is required by UC Contract performance measure 1.4.g to annually review itswaste generation for pollution prevention opportunities and to propose implementationprojects. Previously, waste streams at LLNL were evaluated in terms of the totalquantities of waste generated. However, the waste streams of greatest concern are notnecessarily those having the largest volume. Each process that generates waste must beconsidered, as well as the individual characteristics of the components within eachwaste stream.
LLNL continues to use a weighted system to better rank the waste streams and toimprove the prioritization of waste minimization efforts. The methodology assigns toeach waste stream three weighting factors plus a factor based on annual quantity ofwaste generated. The three weighting factors use the following criteria: cost, waste type(which includes compliance and liability considerations), and operational aspects (suchas routine vs nonroutine) as discussed in A Comprehensive Opportunity Assessment forPollution Prevention at Lawrence Livermore National Laboratory (Celeste et al. 1998). Thisweighting system was used to prioritize waste minimization efforts for waste streams

3 Environmental Program Information
3-10 LLNL Environmental Report for 1999
identified in LLNL’s input to the document Source Reduction Evaluation and Plan,Hazardous Waste Management Performance Report, Summary Progress Report (U.S.Department of Energy 1999c).
In general, the 20 waste stream components having the highest priority (ranked bysumming the four weighting factors) are entirely different from the top 20 sourcesranked by quantity only. For example, transuranic waste (TRU)/TRU mixed and low-level wastes, which are problematic at LLNL, are now ranked as having the highestpriority, though their relative quantities are somewhat low.
The Environmental Protection Department’s Pollution Prevention Team reviewsHWM’s Total Waste Management System (TWMS) database monthly. By reviewing thisdatabase, which tracks waste generation, the Pollution Prevention Team can identifywaste streams with potential problems for each directorate and address issues in atimely manner. Routine waste generation by waste category, from 1993 through 1999, isshown in Table 3-2. The trend from 1993 on shows a dramatic reduction in all wastecategories, which is the result of LLNL’s proactive P2 program.
Table 3-2. Routine waste generation totals (tons), 1993–1999.
Waste category 1993(a)
(baseline)1994 1995 1996 1997 1998 1999
Low-level radioactive 256 181 136 91 68 73 66
Low-level mixed 34 26 36 23 21 25 11
Hazardous 628 368 368 360 240 232 188
Sanitary 2600 2246 2246 2001 2017 2201 2210
LLNL totals 3518 2821 2786 2475 2346 2531 2475
a Baseline values 1993 through 1997 adjusted per agreement between DOE/OAK and LLNL on Feb. 20, 1998.
Table 3-3 presents the percent reductions in routine waste generation for 1999 comparedwith the 1993 baseline. With the decreases in routine radioactive and hazardous wastegeneration, the Laboratory met the 50% reduction goal for the performance measure in1997. The 50% reduction goal for low-level mixed waste was achieved in 1999, largelybecause of an improved treatment technology and a decrease in programmatic gener-ation. Reduction of the sanitary waste stream from the baseline of 1993 is currently at15%. Further discussion of the sanitary waste stream occurs in the following section.

Environmental Program Information 3
LLNL Environmental Report for 1999 3-11
Table 3-3. Routine waste reduction, 1999.
Waste category Reduction 1999 vs 1993 (%)
Radioactive 75
Mixed 68
Hazardous 71
Sanitary 15
Nonhazardous Solid Waste Minimization
In 1999, LLNL sent 5684 tons of routine and nonroutine, nonhazardous waste (alsodesignated as sanitary waste) to a landfill. The routine portion was 2210 tons (seeTable 3-2), and the nonroutine portion was 3474 tons. The breakdown for routine andnonroutine waste is shown in Table 3-4.
Diverted Waste
The total waste diverted from landfills in 1999 was 47,161.5 tons. This year’s totaldiversions, over two times that of 1996 (Table 3-5), reflects the continued success ofLLNL’s diversion programs.
The recycling rate for nonhazardous waste is calculated by dividing the total of divertedwaste by the sum of the nonhazardous landfill total and the diverted waste total. For1999, the total of diverted waste plus nonhazardous waste generated was 52,846 tons.This results in a recycling rate of 89% for nonhazardous waste in 1999.
Table 3-4. Nonhazardous landfill totals (tons), 1999.
Landfill 1999 total
Routine
Compacted 2130
Industrial (TWMS)(a) 80
Routine subtotal 2210
Nonroutine
Construction demonstration (noncompacted) 3363
Industrial (TWMS) 111
Nonroutine subtotal 3474
LLNL total 5684
a TWMS = Total Waste Management System.

3 Environmental Program Information
3-12 LLNL Environmental Report for 1999
Table 3-5. Diverted waste totals (tons), 1996–1999.
1996 1997 1998 1999
Diverted waste totals 20,266 323,465(a) 31,513 47,161.5
a The 1997 solid waste diversion total of 323,465 reflects an increase in soil reuse, predominately driven byconstruction of the National Ignition Facility.
Table 3-6 shows a breakdown of waste diversion categories for 1999, reflecting thevariety of diversion programs in place at LLNL. Soil, a major contributor to diversiontotals, is reused both on site and at the landfill for daily cover. Asphalt and concrete arereused as road base material at the landfill. Wood waste, created by broken pallets,shipping crates, and demolition or construction scrap, cannot be cost-effectively reusedon site, so it is gathered in a collection yard for recycling by a vendor at a cost lowerthan that of other disposal alternatives. Intact pallets and other reusable wood remainon site for internal reuse.
Table 3-6. Waste diversion summary table, 1999.
Description Cumulative 1999 total (tons)
Asphalt/concrete 2,782
Batteries 25
Cardboard 172
Compost 336
Cooking grease/food 3
Diverted soil 40,877
HWM recycled materials 76
Magazines, newspapers, and phone books 33
Metals 2,028
Paper 309
Tires and scrap 64
Toner cartridges 3
Wood
Beverage containers
453
0.5
LLNL diversion total 47,161.5
Another waste reduction method converts landscape clippings from the site’s lawns,trees, shrubs, and annual plantings into compost. Once it is properly aged, the compostis used on site as a soil amendment. By generating its own soil builders, LLNL benefits

Environmental Program Information 3
LLNL Environmental Report for 1999 3-13
twice: by eliminating an organic waste stream (with no tipping fees or haulingrequired), and by saving the purchase cost of new material. Gardeners also create abright and attractive mulch by chipping office Christmas trees at the end of the holidayseason. This mulch is used year-round, reducing the amount of dry-season irrigationnecessary in tree wells.
Another well-developed and highly visible component of the LLNL recycling effort isthe office-paper collection and reclamation project. The Laboratory operates a full-siteprogram, with more than 122 facility collection points. Unclassified paper is transportedto a contract firm, where it is shredded and recycled into toilet paper and egg cartons.Classified paper is preprocessed at the Livermore site using a hammer mill destructionprocess. LLNL also collects and recycles external and internal phone books, news-papers, and magazines by placing recycling bins on site for pickup by a local vendor.These items would otherwise contribute to the solid waste stream. In 1999, LLNLexpanded the program to allow employees who are located in areas where drop-offbins are not easily accessible to mail in these items.
LLNL continues to look for diversion opportunities. A new beverage containerrecycling program serving all three on-site cafeterias was initiated in late 1999. Thisprogram collects aluminum, glass, and plastic containers, which are picked up andtaken off site for recycling by a local vendor. Preliminary data from the fourth quarterof 1999 show that a half ton of beverage containers was recycled.
LLNL’s goal in its UC contract was to reduce the routine nonhazardous waste by 33%by December 31, 1999. As shown in Table 3-4, LLNL generated 2210 tons of routinenonhazardous waste in 1999, a reduction of 15% with respect to the baseline. Becausethe 33% reduction goal was not achieved, despite an impressive 89% recycling rate fornonhazardous waste, the Laboratory has a strong incentive to continue to identify newwaste reduction measures.
Cities and counties have been required by California law to reduce nonhazardous solidwaste by 25% and 50% between the baseline year of 1990, and 1995 and 2000, respec-tively. LLNL contributes to this effort by tracking and reporting its waste diversions tothe County of Alameda. Significant reductions have already been achieved. Comparedwith the 1990 baseline, by 1995 LLNL reduced its nonhazardous waste by 46% (seeTable 3-7), which compared favorably with unincorporated Alameda County (8.9%) andthe City of Livermore (13.8%) for 1995. Additional details are discussed in Assessing theNonhazardous Solid Waste Stream at Lawrence Livermore National Laboratory (Wilson 1999).

3 Environmental Program Information
3-14 LLNL Environmental Report for 1999
Table 3-7. Nonhazardous solid waste summary table, 1990–2000.
1990 1995
Nonhazardous solid waste (routine and nonroutine) 8332 4560
Percent reduction NA 46%
Source Reduction and Pollution Prevention
In 1999, LLNL continued to survey on-site operations for opportunities to eliminate,reduce, recover, or recycle potential pollutants to all media, including air, water, soil,sediments, and biota.
Toxic Reporting Inventory Information
At LLNL only one chemical, Freon 113 (1,1,2-trichloro-1,2,2-trifluoroethane, also knownas CFC 113), was tracked and reported as part of the Toxic Release Inventory for 1999.This reporting is required by EPCRA. All other chemicals are present in quantitiesbelow the threshold reporting levels or are in a form that does not require reporting.
Freon 113, which is used in parts cleaning operations and as a coolant or refrigerant,is an ozone-depleting substance whose consumption and production are slated forelimination by the year 2000. For this reason, the replacement and recycling ofFreon 113 is a high priority at LLNL.
Implementing Cost-Saving Pollution Prevention (P2) Projects
As previously reported (Celeste et al. 1998) Pollution Prevention Opportunity Asses-sments (PPOAs) are conducted before the implementation of P2 projects. The purposeof PPOAs is to characterize waste streams and identify those P2 options that can beimplemented cost effectively.
The DOE funds P2 projects through the High-Return-on-Investment (ROI) P2 Program.To date, DOE has funded high ROI projects at LLNL worth over $2.6 million. Theannual savings attributed to the projects were reassessed in the fall of 1999. Revisedestimates of annual savings from implemented ROI projects are $1.5 million per year.LLNL additionally uses ROI calculations and estimates of project cost-effectiveness toprioritize P2 projects for resource allocation and implementation at the Laboratory.

Environmental Program Information 3
LLNL Environmental Report for 1999 3-15
Review of New Processes or Experiments
Many organizations at LLNL use a “front-end” review process that applies to newprograms, projects, or experiments that could have a significant impact on the environ-ment. In this review process, the initial hazardous materials projected to be used areidentified, and concentrations of both the starting materials and the wastes produced areestimated. The possibility for chemical substitution, process changes, and recycling isthen addressed. If an opportunity for P2 is identified, the Pollution Prevention Teamassists the generator in evaluating the options. Researchers and project managers areencouraged to implement alternatives that are less hazardous or nonhazardous.
In general, P2 activities are covered by the FY97 Pollution Prevention Plan (Celeste 1997).New activities are reviewed to identify possible P2 techniques. All personnel areencouraged to implement reasonable P2 opportunities that have been identified.
Design for Environment
Design for environment is a concept that involves developing an understanding ofpotential environmental impacts over the lifetime of a project, with the goal of mini-mizing or mitigating those potential impacts through modifications to the project at thedesign stage. Federal facilities are now required, under Executive Order 12856, to applylife-cycle analysis and total cost accounting principles to the greatest extent practicablewhen estimating P2 opportunities. Both of these can be considered elements of a newfederally funded facility. In addition, Executive Order 13101, which replaced ExecutiveOrder 12873 in September 1998, requires federal facilities to implement P2 by givingpreference to the purchase of environmentally preferable products and requires thatP2 and life-cycle analysis be considered when plans, drawings, work statements, andspecifications are developed. Executive Order 13101 also allows the use of “multi-media” EPA inspections of federal facilities for compliance with this order.
In 1997, the Pollution Prevention Team and National Ignition Facility (NIF) projectmanagement completed a design-for-environment evaluation of the opportunitieswithin the NIF project. The NIF Pollution Prevention and Waste Minimization Plan (NIFP2/WMin Plan) was completed in 1998 (Cantwell and Celeste 1998). Based on thisevaluation, the laboratory implemented recycling programs during NIF construction,began a Pollution Prevention Plan for NIF, and implemented aqueous cleaningconcepts in the design for parts and optics cleaning. The NIF P2/WMin Plan includedPPOAs on the predicted waste streams identified in the preliminary environmental

3 Environmental Program Information
3-16 LLNL Environmental Report for 1999
impact statement. The PPOAs were aimed at developing waste minimization optionsbefore NIF becomes operational.
Implementing P2 Employee Training and Awareness Programs
Pollution prevention awareness information, which covers all disciplines, is dissemi-nated in documents such as the Pollution Prevention Plan (Celeste 1997) and AComprehensive Opportunity Assessment for Pollution Prevention at Lawrence LivermoreNational Laboratory (Celeste et al. 1998); posters and videos at events such as Earth Day;training and orientation; conferences and workshops; membership on LLNL com-mittees; and formal presentations to groups such as the ES&H Working Group’sEnvironmental Subcommittee.
P2 awareness is promoted through new employee and awareness briefings as well asarticles in Newsline (LLNL’s weekly newspaper) and administrative memos. ThePollution Prevention Team developed a website to electronically distribute P2 infor-mation and prepared brochures that briefly describe the P2 program at LLNL. ThePollution Prevention Team also sponsors a yearly Earth Expo event open to employees,their families, and the local community to provide awareness of environmentally soundtechnologies and LLNL waste diversion initiatives.
Current Return-on-Investment Projects
LLNL prepared several high ROI P2 project proposals in 1999. Major high ROI projectsthat received funding and began in 1999 are listed in Table 3-8.
Table 3-8. Major high return-on-investment projects, 1999.
Operation Project
Low-Hg fluorescent lighting pilot at LBNL and LLNL Studies the benefits and drawbacks of convertingto low-Hg fluorescent tubes in office and shopspace
Executive Order 13101 specification upgrade Updates the LLNL facilities specification masters tobring them into compliance with EPA comprehensiveprocurement guidelines

Environmental Program Information 3
LLNL Environmental Report for 1999 3-17
ChemTrack
ChemTrack, which is a computerized chemical inventory system, serves as an importanttool for ensuring that LLNL complies with the Superfund Amendment and Reauthori-zation Act (SARA) Title III and California Business Plan reporting requirements andfor improving the overall management of hazardous materials. ChemTrack enhancesLLNL’s ability to obtain the toxic release information necessary to complete SARA 313submittals, to improve emergency response capabilities and management of materialsafety data sheets (MSDSs), to more closely track specific high-hazard chemicals andother regulated substances, and to screen selected LLNL facilities for preliminary hazardanalyses. ChemTrack currently has an inventory of approximately 176,000 chemicalcontainers ranging from 210-L drums to gram-quantity vials.
Current Issues and Actions
Many current issues and actions are described in this report according to chaptersubjects. This section lists several not covered elsewhere.
Miniature Optical Lair Explorer
In 1994, ORAD developed and began using the Miniature Optical Lair Explorer (MOLE)to perform biological assessment studies at Site 300. The MOLE is a miniature trackedvehicle with a tiny camera that allows scientists to investigate subterranean tunnelsystems of special-status wildlife species to determine their presence and numbers.
LLNL has used the MOLE successfully to survey for the presence of several special-status species with subterranean habitats (e.g., the San Joaquin kit fox, burrowing owl,American badger, California tiger salamander, and California red-legged frog) beforestarting ground-disturbing activities to ensure that, if they are present, they are pro-tected. Further development and use of the MOLE will continue in 2000.
Leaking Underground Fuel Tank Studies
As part of continuing state-funded leaking underground fuel tank studies, LLNLcompleted an 18-month study evaluating impacts of the fuel oxygenate methyl tertiary-butyl ether (MTBE) and submitted it to the California State Water Resources Control

3 Environmental Program Information
3-18 LLNL Environmental Report for 1999
Board (SWRCB). Conclusions of the study are found in Environmental Report 1998(Larson et al. 1998).
LLNL is continuing to work with the California SWRCB to identify groundwaterresources that may be vulnerable to MTBE impacts.
Evaluation of the Use of Ethanol to Replace MTBE in Gasoline
On March 25, 1999, California Governor Gray Davis issued Executive Order D-5-99,calling for the removal of MTBE from gasoline at the earliest possible date but no laterthan December 31, 2002. Task 10 of the Executive Order states “the California AirResources Board (ARB) and the SWRCB shall conduct an environmental fate andtransport analysis of ethanol in air, surface water, and groundwater. The Office ofEnvironmental Health Hazard Assessment (OEHHA) shall prepare an analysis of thehealth risks of ethanol in gasoline, the products of incomplete combustion of ethanol ingasoline, and any resulting secondary transformation products.”
To assist the SWRCB, LLNL has led a team of researchers in evaluating the potentialground and surface water impacts that may occur if ethanol is used to replace MTBE.These findings are reported in the document entitled Health and Environmental Assess-ment of the Use of Ethanol as a Fuel Oxygenate (Rice and Cannon 1999). This document hasbeen presented to the California Environmental Policy Council and may be viewed at:http://www-erd.llnl.gov/ethanol/
Ethanol may be used in oxygenated and reformulated gasoline (8% in federal oxyfuel or6% in federal reformulated gasoline [RFG], by volume). Oxygenated gasoline mustcontain at least 2.7% oxygen by weight unless a state obtains a waiver from the U.S.Environmental Protection Agency (EPA). Such oxygenated gasoline is used in federallydesignated carbon monoxide nonattainment zones. RFG contains a minimum averageof 2% oxygen (by weight), no more than 1% benzene (by weight), and no heavy metals.RFG is used in locations that exceed the ozone standard. Currently, about 70% ofgasoline used statewide is RFG. Ethanol is a renewable, biomass-based source of fuelwith tax incentives. Initial studies indicate that its environmental impacts are less thanthose associated with the use of MTBE. Although California has implemented improvedcontainment practices for its underground storage tanks, releases of gasoline that mayimpact surface water and groundwater resources can still be expected.
Several abiotic and biotic processes or mechanisms that affect the fate of ethanol andethanol-gasolines in the subsurface have been identified. Ethanol in gasoline will affect

Environmental Program Information 3
LLNL Environmental Report for 1999 3-19
the concentrations of BTEX that dissolve into groundwater and the residence time offuel hydrocarbons in contact with the water table (saturated zone). The presence ofethanol in groundwater may alter micobially mediated BTEX fate and transport proc-esses and could contribute to increased benzene plume lengths. Biodegradation of fuelalcohols contributes to the depletion of electron-acceptor pools, and this depletion islikely to affect temporal and spatial transitions in electron-acceptor conditions duringnatural attenuation of petroleum-product releases. Several modeling efforts evaluatingthe behavior of benzene groundwater plumes in the presence of ethanol indicate thatbenzene plumes are likely to increase in length, but the amount of this increase is notwell known. A number of recommendations have been made to address knowledgegaps in the potential ground- and surface-water impacts associated with using ethanolto replace MTBE.
During evaluation of ground- and surface-water impacts, LLNL began to develop acomprehensive life-cycle model. This life-cycle model systematically addresses impactsfrom fugitive and accidental releases associated with the production, distribution, anduse of ethanol-containing gasoline. LLNL also examined the salient environmentalproperties of alkylates, which are nonoxygenated compounds likely to be used ingreater amounts in gasoline after an MTBE phaseout.
Initiative to Improve Volatile Organic Compound Cleanup Process by Using HistoricalCase Analysis
The goal of this initiative is to evaluate a large number of nationwide historical cases toidentify common VOC release conditions that pose low risks and can be managed withminimal effort and cost, versus release conditions that pose higher risks and warrantlarger expenditures. The key to this initiative is a cross-cutting evaluation of the largeamount of VOC case data that is available.
This study is ongoing, and LLNL is continuing to gather chlorinated VOC historical casedata to improve the evaluation of the behavior of chlorinated VOC plumes. A Phase 1final report, entitled, Historical Case Analysis of Chlorinated Volatile Organic CompoundPlumes (McNab et al. 1999), has been completed and can be viewed on the Internet at:http://www-erd.llnl.gov/library/AR-133361.html

3 Environmental Program Information
3-20 LLNL Environmental Report for 1999
Response to Spills and Other Environmental Emergencies
All spills and leaks (releases) at LLNL that are potentially hazardous to the environmentare investigated and evaluated. The release response process includes identifying therelease, shutting off the source (if it is safe to do so), eliminating ignition sources, con-tacting appropriate emergency personnel, cordoning off the area containing the releasedmaterial, absorbing and neutralizing the released material, assisting in cleanup, deter-mining if a release must be reported to regulatory agencies, and verifying that cleanup(including decontaminating and replenishing spill equipment) is complete. Environ-mental analysts provide guidance to the programs on preventing spill recurrence.
To maximize efficient and effective emergency environmental response, EPD establisheda 7-day-a-week, 24-hour-a-day, on-call rotational position entitled the environmentalduty officer (EDO). Specialized EDO training includes simulated accidents to providethe response personnel with the experience of working together to mitigate an environ-mental emergency, determine any reporting requirements to regulatory agencies andDOE, and resolve environmental and regulatory issues within the LLNL emergencyresponse organization. The on-duty EDO can be reached by pager or cellular phone atany time.
During normal work hours, Laboratory employees report all environmental incidents tothe Environmental Operations Group (EOG) environmental analyst assigned to supporttheir program area. The EOG environmental analyst then notifies the on-duty EDO ofthe incident, and together they determine applicable reporting requirements to local,state, and federal regulatory agencies and to DOE. The EDO and the EOG environ-mental analyst also notify and consult with program management and have 7-day-a-week, 24-hour-a-day access to the office of Laboratory Counsel for questions concerningregulatory reporting requirements.
During off hours, Laboratory employees report all environmental incidents to the FireDispatcher, who, in turn, notifies the EDO and the Fire Department, if required. TheEDO then calls out additional EPD support to the incident scene as necessary, andfollows the same procedures as outlined above for normal work hours.
Environmental Training
Major efforts are ongoing to provide LLNL employees with training on environmentaltopics aimed at improved compliance. Training tasks address both specialized trainingfor environmental professionals and training in a variety of environmental topics for

Environmental Program Information 3
LLNL Environmental Report for 1999 3-21
employees at all levels throughout LLNL. Courses presented by EPD’s Training Sectionare listed in Table 3-9.
Table 3-9. EPD training courses.
Air Source Management Packaging and Shipping Operations
Drills and Exercises for HWM Petroleum Product Storage Tank Management
Emergency Response for Environmental Duty Officers RCRA(b) for EWSF/EWTF(c)
Environmental Duty Officer Briefings RCRA Facility Management
Field Fingerprint Verification Analyses SARA/OSHA(d) Field Experience
Hazardous Waste Generation and Certification SARA/OSHA Refresher Training
Hazardous Waste Generation and Certification Review Spill Prevention, Control, and Countermeasure Training
Hazardous Waste Sampling Storm Water Pollution Prevention
Hazardous Waste Transportation TRU(e) Waste Generation and Certification
Identification of Hazardous Material Waste Accumulation Area Operations
Legacy Waste Process Knowledge Evaluation Waste Characterization Approval
Low-Level Waste Generation and Certification Waste Management Unit OJT(f)
NEPA(a) Compliance Waste Process and Matrix Identification
New Hire Orientation Waste Retention Tank Management
a NEPA = National Environmental Policy Act.
b RCRA = Resource Conservation and Recovery Act.
c EWSF/EWTF = Explosive Waste Storage Facility/Explosive Waste Treatment Facility.
d SARA/OSHA = Superfund Amendment and Reauthorization Act/Occupational Safety and Health Administration.
e TRU = Transuranic.
f OJT = On-the-job training.
LLNL’s Other Environmental Programs
While EPD plays a central role, every directorate at LLNL is responsible for environ-mental compliance and minimizing the impacts of its operations. Several directorateshave taken particularly noteworthy steps in this direction. Some examples include theplans for Defense Nuclear Technologies Program’s Contained Firing Facility at Site 300that will move explosive tests inside a facility where the debris is contained, the LaserProgram’s efforts to design the National Ignition Facility to have minimal environmentalimpact, Engineering’s Metal Finishing Group’s efforts to reduce waste and substitute

3 Environmental Program Information
3-22 LLNL Environmental Report for 1999
less hazardous chemicals in many of its processes, and the Education Program’s effortsto enhance environmental education.
Integral to LLNL’s environmental research is the Environmental Programs Directoratethat conducts multidisciplinary research to assess and mitigate environmental andhuman risk from natural and man-made hazards and to develop and demonstrate newtools and technologies for environmental restoration. This work includes studies in thedesign, analysis, and testing of advanced waste-treatment technologies; in situ environ-mental remediation using natural and engineered processes; pathway, dosimetry, andrisk analysis of radioactive and toxic substances; atmospheric dynamics; subsurfaceimaging and characterization; and seismic processes.
Contributing Authors Acknowledgment
Major contributors to this diverse chapter were Katharine Gabor, Winifred A.Burks-Houck, C. Susi Jackson, Constance E. De Grange, David Rice, Bert Heffner,Stephanie S. Goodwin, Joseph Woods, and James S. Woollett, Jr.

4
LLNL Environmental Report for 1999 4-1
Air Effluent Monitoring
Arthur H. BiermannLinda C. Hall
Barbara Nisbet
Introduction
Lawrence Livermore National Laboratory performs continuous air effluent sampling ofatmospheric discharge points at several facilities. LLNL assesses air effluent emissionsfrom facility operations to evaluate compliance with local, state, and federal regulationsand to ensure that human health and the environment are protected from hazardousand radioactive air emissions.
Air Quality Laws
LLNL complies with local, state, and federal environmental air quality laws andDepartment of Energy (DOE) regulations. DOE Orders 5400.1, General EnvironmentalProtection Program, and 5400.5, Radiation Protection of the Public and the Environment,define standards for controlling exposures to the public from operations at DOEfacilities. Subpart H of the National Emission Standards for Hazardous Air Pollutants(NESHAPs), 40 Code of Federal Regulations (CFR) 61, requires the continuous moni-toring of certain discharge points and the estimation of dose to the public resulting fromoperations at DOE facilities. Guidance on air effluent sampling is provided in theEnvironmental Regulatory Guide for Radiological Effluent Monitoring and EnvironmentalSurveillance (U.S. Department of Energy 1991), 40 CFR 60, and NESHAPs-cited AmericanNational Standards Institute (ANSI) standards. The Environmental Protection Agency(EPA) Region IX has oversight responsibility for LLNL compliance with regulationsregarding radiological air emissions.
Enforcement authority of the Clean Air Act regulations for nonradiological air emissionshave been delegated to the local air districts: the Bay Area Air Quality ManagementDistrict (BAAQMD) for the Livermore site and the San Joaquin Valley Unified AirPollution Control District (SJVUAPCD) for Site 300. Applicable regulations andpermitting requirements are contained in the BAAQMD Regulations 1-12 for theLivermore site and the SJVUAPCD Regulations Rules 1010-9120 for Site 300.

4 Air Effluent Monitoring
4-2 LLNL Environmental Report for 1999
Monitored Emissions
LLNL uses a variety of radioisotopes—including uranium, transuranics, biomedicaltracers, tritium, and mixed-fission products—for research purposes. The majorradionuclide released to the atmosphere from the Livermore site is tritium. In additionto effluent sampling for tritium, a number of facilities at the Livermore site have aireffluent samplers to detect the release of uranium and transuranic aerosols. The aireffluent sampling systems described in this chapter apply to stationary and point sourcedischarges. LLNL also monitors diffuse, or nonpoint, sources to fulfill NESHAPsrequirements. Sampling methods to evaluate LLNL diffuse sources are described inChapter 5 of the Data Supplement. Summary data from these diffuse sources can befound in Chapter 5 of this volume.
Assessment of air effluent emissions and resulting dose to the public is performed bymonitoring emissions and/or evaluating potential emissions. Currently, the air effluentsampling program measures only radiological emissions. LLNL has operations withnonradiological discharges; however, permits for these operations are obtained throughlocal agencies, BAAQMD, and SJVUAPCD, and monitoring of the effluent is notrequired. The California Air Toxics “Hot Spots” legislation requires facilities to preparean air toxics emissions inventory and risk assessment, which LLNL has completed.Based on the assessment, BAAQMD and SJVUAPCD have ranked LLNL as a low-riskfacility for nonradiological air emissions.
Historically, monitoring of radionuclide air effluents at LLNL has been implementedaccording to the DOE as low as reasonably achievable (ALARA) policy. This policy ismeant to ensure that DOE facilities are capable of monitoring routine and nonroutineradiological releases, so that the dose to members of the public can be assessed, and sothat doses are ALARA. In addition, the NESHAPs 40 CFR 61, Subpart H, regulationsrequire that facility radiological air effluents must be continuously monitored if thepotential off-site dose equivalent is greater than 1 µSv/y (0.1 mrem/y), as calculatedusing the EPA-mandated air dispersion dose model and assuming that there are noemission control devices. The results from monitoring the air discharge points providethe actual emission source information for modeling, which is used to ensure that theNESHAPs standard, 100 µSv/y (10 mrem/y) total site effective dose equivalent, is notexceeded. Discharges from operations that have the potential to release radionuclidesbut that are not monitored are also evaluated according to the NESHAPs regulations,and the corresponding doses are added to those obtained by modeling monitoredemissions to determine radiological NESHAPs compliance.

Air Effluent Monitoring 4
LLNL Environmental Report for 1999 4-3
Operation of Monitoring Systems
Air effluent monitoring of atmospheric discharge points is used to determine the actualradionuclide releases from individual facilities and processes during routine and non-routine operations, to confirm the operation of facility emission control systems, and tocorroborate and aid in the resolution of air surveillance measurement results for the site.(The relationship can also work the other way as well—air surveillance measurementscan corroborate effluent monitoring.) Measurements made by the air surveillancesamplers located on and off site are reported in Chapter 5.
Methods
Air effluent monitoring involves the extraction of a measured volume of air from theexhaust of a facility or process and subsequent collection of particles by filters or ofvapors by a collection medium. After collection, the various radionuclides in the sampleare measured by appropriate analytical methods.
At the beginning of 1999, LLNL operated 101 sampling systems for radioactivity fromair exhausts at eight facilities at the Livermore site (see Figure 4-1). These systems arelisted in Table 4-1 along with the analytes of interest, the type of sampler, and thenumber of samplers. LLNL reassesses the need for continuous monitoring on an annualbasis and more often if warranted by new operations or changes in operations. FromNESHAPs assessments of operations during 1999, no additional discharge points werefound to require continuous sampling.
In 1999, sampling at several air effluent locations was terminated. In the past, samplingoperations performed in Buildings 175, 177, 490, and 491 have supported research anddevelopment for the separation of uranium isotopes under the Advanced Vapor LaserIsotope Separation (AVLIS) Program. In 1999, the AVLIS Program was shut down, andsamplers on a Building 490 exhaust system were deactivated because the operation ofthe ventilation system was stopped. Air effluent sampling systems at Buildings 175, 177,and 491 continue to operate as part of the maintenance and surveillance shutdown planfor AVLIS facilities. At the Heavy Element Facility (Building 251), 20 samplers weredeactivated. This facility has been in a standby mode of operation for some time, andactivities involving the use radiological materials are not expected to resume in the areaspreviously monitored by the deactivated samplers. Finally, a sampling system located atthe Expedited Technology of Molten Salt Oxidation project in Building 292 was removedbecause the project was completed. At the end of 1999, LLNL was operating 76 aireffluent sampling systems at six facilities.

4 Air Effluent Monitoring
4-4 LLNL Environmental Report for 1999
3/1/00
490
Meteorological tower
175177
292
251
331332
491
N
Figure 4-1. Facilities at the Livermore site with air monitoring systems for effluent gasstreams during all or part of 1999.
Sampling for particles containing radioactivity was conducted in seven of the facilities;sampling for tritium was conducted in the Tritium Facility (Building 331). All samplingsystems operated continuously. Samples were collected weekly or biweekly dependingon the facility. Most air samples for particulate emissions were extracted downstream ofHEPA filters and before the emissions were discharged to the atmosphere. Particles inthe extracted air were collected on sample filters and analyzed for gross alpha and betaactivity. Tritium is collected using molecular sieves. In addition to sample collection

Air Effluent Monitoring 4
LLNL Environmental Report for 1999 4-5
for environmental reporting, some facilities used real-time alarm monitors (listed inTable 4-1) at discharge points to provide faster notification in the event of a release ofradioactivity.
Analytical results from the continuous samplers are reported as a measured concen-tration per volume of air, or as less than the minimum detection concentration (MDC)when no activity is detected. In all cases, the MDC is more than adequate for demon-strating compliance with the pertinent regulatory requirements for radionuclides thatare present or may be present in the sampled air. Further details of LLNL air effluentsampling systems are included in Chapter 4 of the Environmental Monitoring Plan(Tate et al. 1999).
Table 4-1. Air effluent sampling locations and sampling systems.
Building Facility AnalytesSampler
type
Numberof
samplers
175 MARS Gross α, β on particles Filter 6
177 Extractor Test Facility Gross α, β on particles Filter 1
251 Heavy elements
Unhardened area Gross α, β on particles Filter 44(a)
Hardened area Gross α, β on particles Filter 4
Hardened area Gross α, β on particles CAM(b,c) 4(d)
292 Molten salt oxidation Gross α, β on particles Filter 1(d)
331 Tritium Tritium Ionization chamber(c) 4
Gaseous tritium and tritiatedwater vapor
Molecular sieves 4
332 Plutonium Gross α, β on particles CAM(b,c) 12
Gross α, β on particles Filter 16
490 Laser isotope separation Gross α, β on particles Filter 4(d)
491 Laser isotope separation Gross α, β on particles Filter 1
a Sixteen of these sampling systems were deactivated in 1999.
b CAM = Eberline continuous air monitors.
c Alarmed systems.
d Sampling at these locations was terminated in 1999.
Measured Radioactive Air Emissions
This section discusses the radiological air emissions from facilities that havecontinuously monitored discharge points.

4 Air Effluent Monitoring
4-6 LLNL Environmental Report for 1999
Livermore Site
In 1999, a total of 10.4 TBq (281 Ci) of tritium was released from the Tritium Facility(Building 331). Of this, approximately 7.9 TBq (214 Ci) were released as tritiated watervapor (HTO). The remaining tritium released, 2.5 TBq (67 Ci), was elemental tritiumgas (HT). HTO emissions from the facility ranged from 26 Bq/m3 (7.0 × 10⁻¹⁰ Ci/m3)to 1.6 × 10⁵ Bq/m3 (4.2 × 10⁻⁶ Ci/m3), while HT emissions ranged from 6.8 Bq/m3
(1.8 × 10⁻¹⁰ Ci/m3) to 1.3 × 10⁵ Bq/m3 (3.5 × 10⁻⁶ Ci/m3). The highest single weeklystack emission from the facility was 1.5 TBq (41 Ci), of which 0.54 TBq (15 Ci) was HTO.The emissions from Building 331 accounted for 96% of the estimated potential tritiumemissions from the Livermore site.
Emissions from Building 331 for 1999 continued to remain considerably lower thanthose during the 1980s. Figure 4-2 illustrates the HTO and HT emissions from thefacility since 1981. The tritium emissions for 1999 were greater than 1998 emissionsbecause of programmatic activities and an equipment malfunction that occurred in thefacility. The tritium air surveillance sample results (see Data Supplement, Chapter 5)accurately confirmed the facility emissions, including a slightly elevated release periodfrom January to March.
0
300
200
100
Trit
ium
em
issi
on
s (T
Bq
)
81 82 83 84 85 86 87 88 89 90Year
91 92 93 94 95 96 9897 990
1
2
3
4
5
6
7
8
Trit
ium
em
issi
on
s (k
Ci)
94
71
110
270
74
42
98
150
110
47 41
6.5 8.8 5.1 3.4 7.9 114 10
Note: The plot of Tritium Facility emissions differs in this report as compared with similar plots in previous reports, inwhich the Tritium Facility emissions were overstated for the years 1981–1987. The previous reports contained thetotal LLNL emissions of HTO and HT, not just Tritium Facility emissions.
Figure 4-2. Tritium Facility HTO and HT emissions between 1981 and 1999.

Air Effluent Monitoring 4
LLNL Environmental Report for 1999 4-7
In 1999, most sample results from the continuously sampled discharge points that havethe potential for releasing particulate radionuclides were below the MDC of the analysis.This was the case for all of the sampled discharge points at Buildings 175, 177, 332, 490,and 491 and for sampled discharge points at Building 251 except for the one discussedbelow. Sometimes as few as one to four samples (out of 25 to 50 samples per year)exhibited concentrations greater than the MDC. Generally, these few samples withresults above the MDC were only marginally above the MDC. In addition, because ofthe way some exhaust systems were configured, the monitoring systems sometimessampled air from the ambient atmosphere and HEPA-filtered air from facility opera-tions, which means that background atmospheric radioactivity was also collected.LLNL uses zero values for these results based on knowledge of the facility, the use ofHEPA filters in all significant release pathways, and alpha-spectroscopy-based isotopicanalyses of selected air sampling filters. These analyses demonstrate the presence ofnaturally occurring radionuclides, such as radon daughters, like polonium. Even ifLLNL used the MDC values to calculate the emission estimates for these facilities (whichwould be an extremely conservative approach), the total dose to a member of the publicattributable to LLNL activities would not be significantly affected.
At Building 251 (in the unhardened area), one discharge point had a significant numberof samples collected throughout the year with gross alpha results greater than the MDC.We use gross alpha as the primary indicator of potential emissions for operations, suchas those at Building 251 that involve the use of uranium and transuranic materials.We use gross beta results to further corroborate those gross alpha results with con-centrations above the MDC. The gross alpha and gross beta activity emissions forBuilding 251 were 1.4 × 10² Bq/y (3.7 × 10⁻⁹ Ci/y) and 2.5 × 10³ Bq/y (6.8 × 10⁻⁸ Ci/y).Because of the number of samples with values above the MDC, we have taken aconservative approach and are reporting gross alpha and gross beta measurements asactual emissions.
The gross alpha monitoring concentrations for Building 251 ranged from−7.8 × 10⁻⁵ Bq/m3 (−2.1 × 10⁻¹⁵ Ci/m3) to 5.7 × 10⁻⁴ Bq/m3 (1.5 × 10⁻¹⁴ Ci/m3). TheBuilding 251 facility was in a standby, limited mode of operation throughout 1999, soemissions were not anticipated. Also, the gross alpha and gross beta average activityconcentrations do not significantly differ from those of the low-volume air particulatesurveillance samplers (see Chapter 5). Therefore, it is likely that Building 251 measure-ments were caused by naturally occurring or background radioactivity and by thefacility exhaust configuration, as previously mentioned. In any case, the gross alpha andgross beta emissions from operations did not a significantly contribute to theradiological dose to the public.

4 Air Effluent Monitoring
4-8 LLNL Environmental Report for 1999
Table 4-2 lists total radiological emissions as determined from the continuous samplingof facility exhausts for 1999. Radioactive effluent concentrations from individualdischarge points at all monitored facilities are reported in Chapter 4, Data Supplement.
Table 4-2. Measured radiological air effluent emissions for the Livermore site, 1999.
Tritium
Building Facility Elemental, HT(Bq)
Tritiated water, HTO(Bq)
331 Tritium 2.5 × 10¹² 7.9 × 10¹²
Gross alpha and gross beta
Building Facility Gross alpha(Bq)
Gross beta(Bq)
251 Heavy element 1.4 × 10² 2.5 × 10³
Site 300
Currently, there is no requirement for air effluent monitoring of facilities at Site 300. Airsurveillance monitoring is performed for Site 300, and results are reported in Chapter 5,Air Monitoring.
All Potential Sources of Radioactive Air Emissions
This section discusses the evaluation of all sources of radionuclide emissions to air at theLivermore site and Site 300. LLNL evaluates all discharge points with the potential torelease radionuclides to the air according to 40 CFR 61, Subpart H, of the NESHAPsregulations. LLNL uses radionuclide usage inventories and/or monitoring data, alongwith EPA-accepted release factors for operations and EPA-suggested reduction factors foremission control devices, to estimate the potential release for each individual dischargepoint. Potential emissions are calculated using radionuclide usage inventories asdistinguished from emissions-based air effluent sampling. We conduct this evaluationannually to assess the potential dose to the public from all LLNL operations and the needfor continuous sampling of individual discharge points.
For 1999, LLNL evaluated potential emissions of radionuclides from approximately50 facilities to determine their contribution of dose to a member of the public. Potentialemissions were estimated based on radionuclide usage inventories specific to individualdischarge points, physical state of the materials involved in the processes, and reduc-tions caused by emission control systems. The effective dose equivalent (EDE) to a

Air Effluent Monitoring 4
LLNL Environmental Report for 1999 4-9
member of the public from specific operations at the Livermore site and Site 300 werepublished in LLNL NESHAPs 1999 Annual Report (Gallegos et al. 2000) and aresummarized in Chapter 13 of this report.
The radionuclide isotope responsible for the majority of the 1999 EDE was tritium.Emissions from the Tritium Facility in the form of HTO accounted for 56% of thepotential EDE to the maximally exposed member of the public from the Livermore site.Emissions from the facility in the form of HT, when modeled as HTO emissions asmandated by EPA, accounted for 18% of the potential EDE. A discussion of therelative dose impacts from HTO and HT is given in Chapter 13 in the section entitled“Assessment Assumptions Regarding Tritium.” The other measured emissions shownin Table 4-2 (Building 251) contributed negligibly to the EDE for the maximally exposedmember of the public.
When determining if continuous sampling is needed at a discharge point, LLNLevaluates operations to determine if the potential dose to the maximally exposedmember of the public will exceed 0.1 mrem for the calendar year. This evaluation issimilar to the evaluation of EDE previously described except no credit is allowed foremission control systems (according to the regulations). For 1999, LLNL reported morethan 200 potential discharge points and/or discharges at the Livermore site and Site 300.As a result of the evaluation, no additional discharge points other than those alreadybeing continuously sampled were found to require continuous sampling.
Nonradioactive Air Emissions
The Livermore site currently emits approximately 140 kg/day of criteria air pollutants(e.g., nitrogen oxides, sulfur oxides, particulate matter [PM-10], carbon monoxide, andlead, as defined by the Clean Air Act). The largest sources of criteria pollutants from theLivermore site are surface-coating operations, internal combustion engines, solventoperations, and, when grouped together, boilers (oil and natural gas fired). Table 4-3lists the estimated Livermore site 1999 total airborne releases for criteria pollutants.
When comparing the estimated releases from exempt and permitted sources of airpollutants at the Livermore site with daily releases of air pollutants for the entire BayArea, LLNL emissions are very low. For example, the total emissions of nitrogen oxidesreleased in the Bay Area for 1997 were approximately 1.4 × 10⁵ kg/day compared withan estimate for LLNL releases of 81 kg/day for the Livermore site (0.06% of total Bay
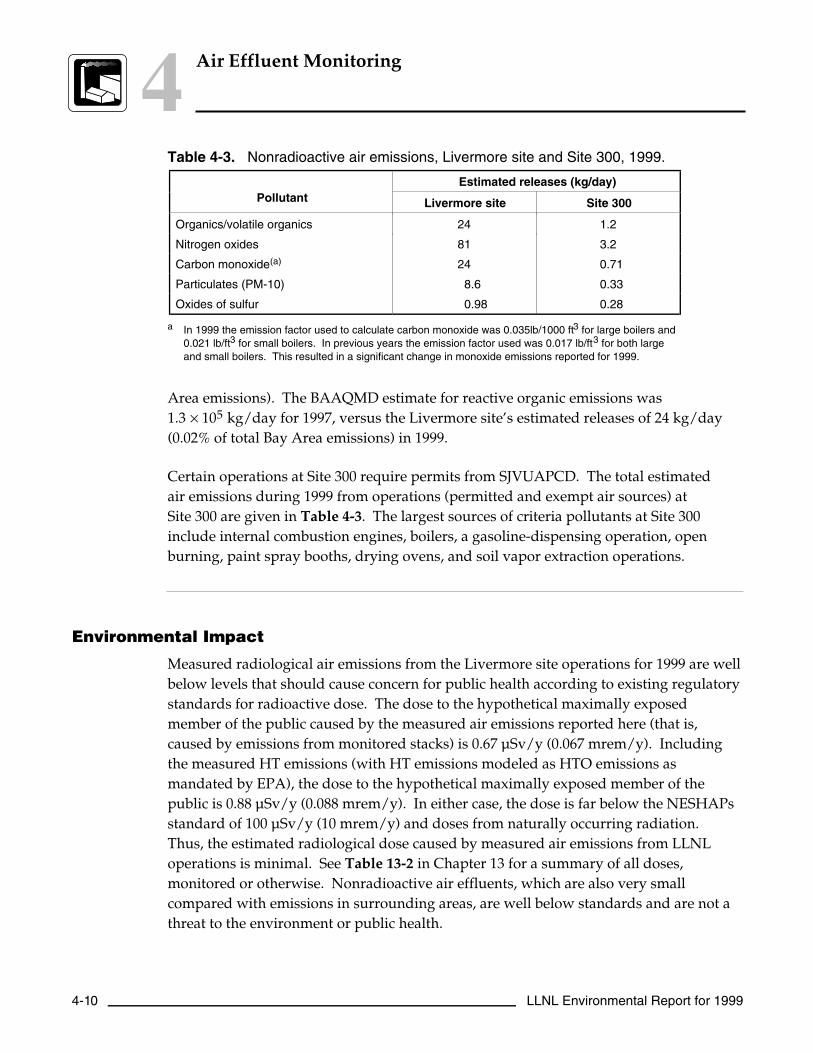
4 Air Effluent Monitoring
4-10 LLNL Environmental Report for 1999
Table 4-3. Nonradioactive air emissions, Livermore site and Site 300, 1999.
Estimated releases (kg/day)Pollutant Livermore site Site 300
Organics/volatile organics 24 1.2
Nitrogen oxides 81 3.2
Carbon monoxide(a) 24 0.71
Particulates (PM-10) 8.6 0.33
Oxides of sulfur 0.98 0.28
a In 1999 the emission factor used to calculate carbon monoxide was 0.035lb/1000 ft3 for large boilers and0.021 lb/ft3 for small boilers. In previous years the emission factor used was 0.017 lb/ft3 for both largeand small boilers. This resulted in a significant change in monoxide emissions reported for 1999.
Area emissions). The BAAQMD estimate for reactive organic emissions was1.3 × 105 kg/day for 1997, versus the Livermore site’s estimated releases of 24 kg/day(0.02% of total Bay Area emissions) in 1999.
Certain operations at Site 300 require permits from SJVUAPCD. The total estimatedair emissions during 1999 from operations (permitted and exempt air sources) atSite 300 are given in Table 4-3. The largest sources of criteria pollutants at Site 300include internal combustion engines, boilers, a gasoline-dispensing operation, openburning, paint spray booths, drying ovens, and soil vapor extraction operations.
Environmental Impact
Measured radiological air emissions from the Livermore site operations for 1999 are wellbelow levels that should cause concern for public health according to existing regulatorystandards for radioactive dose. The dose to the hypothetical maximally exposedmember of the public caused by the measured air emissions reported here (that is,caused by emissions from monitored stacks) is 0.67 µSv/y (0.067 mrem/y). Includingthe measured HT emissions (with HT emissions modeled as HTO emissions asmandated by EPA), the dose to the hypothetical maximally exposed member of thepublic is 0.88 µSv/y (0.088 mrem/y). In either case, the dose is far below the NESHAPsstandard of 100 µSv/y (10 mrem/y) and doses from naturally occurring radiation.Thus, the estimated radiological dose caused by measured air emissions from LLNLoperations is minimal. See Table 13-2 in Chapter 13 for a summary of all doses,monitored or otherwise. Nonradioactive air effluents, which are also very smallcompared with emissions in surrounding areas, are well below standards and are not athreat to the environment or public health.

5
LLNL Environmental Report for 1999 5-1
Air SurveillanceMonitoring
Paris E. AlthousePaula J. Tate
Introduction
Lawrence Livermore National Laboratory performs air surveillance monitoring toevaluate its compliance with local, state, and federal laws and regulations and to ensurethat human health and the environment are protected from hazardous and radioactiveair emissions. Federal environmental air quality laws and U.S. Department of Energy(DOE) regulations include Title 40 of the Code of Federal Regulations (CFR) Part 61; theNational Emissions Standards for Hazardous Air Pollutants (NESHAPs) section of theClean Air Act; DOE Order 5400.1, General Environmental Protection Program Chapter IV,paragraph 1.a. and paragraph 5; and DOE Order 5400.5, Radiation Protection of the Publicand the Environment, Change 2, Chapter II, Paragraph 1 (except 1.a.3.c. and 1.c), andChapter III. The Environmental Regulatory Guide for Radiological Effluent Monitoring andEnvironmental Surveillance (U.S. Department of Energy 1991) provides the guidance forimplementing DOE Orders 5400.1 and 5400.5. In general, the constituents for whichLLNL monitors are at levels far below the regulatory standards.
LLNL conducts surveillance monitoring of ambient air to determine if airborne radionu-clides or hazardous materials are being released by Laboratory operations, what theconcentrations are, and what the trends are in the LLNL environs. In the air monitoringprogram, LLNL collects particles on filters and chemically traps vapors on a collectionmedium. Concentrations of various airborne radionuclides (including particles andtritiated water vapor) and beryllium are measured at the Livermore site, Site 300, and atoff-site locations throughout the Livermore Valley and in the City of Tracy. In addition,some point sources and diffuse, or nonpoint sources, are monitored to fulfill NESHAPsrequirements (Gallegos et al. 2000).
Methods
Several monitoring networks were established for surveillance of air particulates andtritium in the environs of LLNL and Site 300, as well as in the surrounding LivermoreValley and in the City of Tracy. The sampling locations for each monitoring network arelisted in Table 5-1 and shown on Figures 5-1, 5-2, and 5-3. All monitoring networks use

5 Air Surveillance Monitoring
5-2 LLNL Environmental Report for 1999
continuously operating samplers. The radiological high-volume sampling networks useglass-fiber filters; the beryllium high-volume networks use cellulose filters; and the low-volume network uses Millipore AW-19 filters. The collection medium for tritium issilica gel.
Table 5-1. Air sampling locations listed by monitoring network.
High-volumeradiological
(glass fiber filters)
High-volumeberyllium
(cellulose filters)
Low-volume grossalpha and beta
(millipore filters)
Tritium(silica gel)
Livermore site sampling locations
B531(a) CAFE B292(a)
CAFE COW B331(a)
COW MESQ B514(a)
CRED(a) MET B624(a)
MESQ SALV CAFEMET VIS COWSALV MESQVIS MET
POOLSALVVIS
Livermore Valley sampling locations
AMON FCC AMONCHUR HOSP FIREFCC HOSPFIRE VETHOSP XRDSLWRP ZON7PATTTANKZON7
Site 300 sampling locations
801E 801EECP EOBSEOBS GOLFGOLFNPSWCPWOBS
Site 300 off-site sampling locations
PRIM TFIR PRIMTFIR
a These locations are in areas of diffuse sources and are monitored to fulfill NESHAPs requirements.

Air Surveillance Monitoring 5
LLNL Environmental Report for 1999 5-3
Patterson Pass Road
Gre
envi
lle R
oad
Vas
co R
oad
East Avenue
N
5000
Scale: Meters
LLNL perimeter
Sampling locations
Radiological particulate
Beryllium particulate
Tritium
MESQ
COW
VIS
SALV
CRED
B514B624
B331B531
B292
POOL
CAFE
MET
Figure 5-1. Air particulate and tritium sampling locations on the Livermore site, 1999.
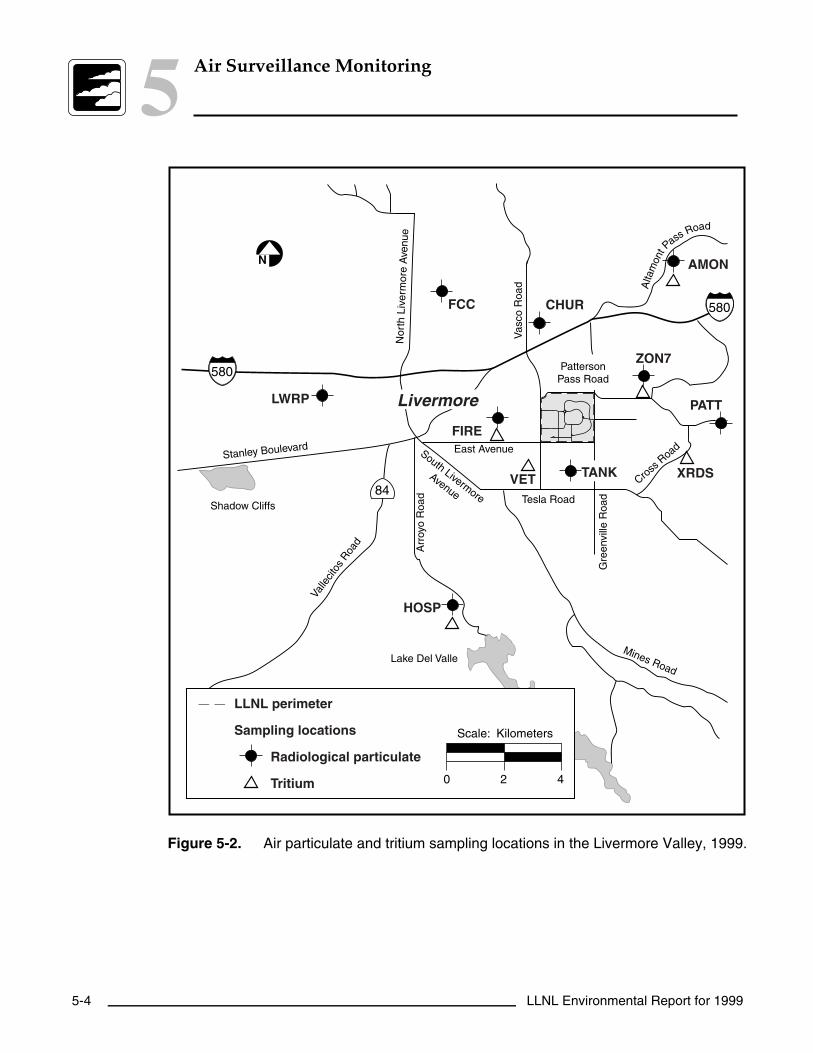
5 Air Surveillance Monitoring
5-4 LLNL Environmental Report for 1999
daoRssaPtnomatl
A
Nor
thLi
verm
ore
Ave
nue
Livermore
PattersonPass Road
Lake Del Valle
Valle
citos
Roa
d
Stanley Boulevard
Vas
co R
oad
Tesla Road
Gre
envi
lle R
oad
Mines Road
East Avenue
Shadow Cliffs
Cross
Road
Arr
oyo
Roa
d
South Livermore
Avenue
HOSP
XRDS
FIRE
LWRP PATT
ZON7
FCC
VET TANK
580
84
580CHUR
2 4
Scale: Kilometers
0
LLNL perimeter
Sampling locations
Radiological particulate
Tritium
AMONN
Figure 5-2. Air particulate and tritium sampling locations in the Livermore Valley, 1999.

Air Surveillance Monitoring 5
LLNL Environmental Report for 1999 5-5
Livermore
N
Bunker 801
Bunker 851
Bunker 850
NPSEOBS
801E
ECP
TFIR(in City of Tracy)
GOLF
PRIM
WOBS
WCP
Corral Hollow Road
0 1600
Scale: Meters
800
Sampling locationsRadiological particulateBeryllium particulateTritium
Site 300 perimeter
Bunkers
Figure 5-3. Air particulate and tritium sampling locations at Site 300 and off site, 1999.
All air samplers are positioned to provide reasonable probability that, if there were anysignificant concentration of radioactive or beryllium effluents from LLNL operations, itwould be detected. The geographical details of the particulate sampling locations aredescribed in the Environmental Protection Department’s location database. Details foraccessing the database are available in the Locations Database SOP Supplement EMP-QA-DM, Sample and Data Management.
Particulate filters are changed each week at all locations, and tritium samples arechanged every two weeks. Duplicate quality control samplers are operated for twomonths each year in parallel with the permanent sampler at a given site, and thesesamples are analyzed to confirm results.

5 Air Surveillance Monitoring
5-6 LLNL Environmental Report for 1999
Air Particulate Sampling Locations
The Livermore site radiological air surveillance sampling network consists of sixsamplers at the perimeter; in addition, two areas of special interest (B531 and CREDshown in Figure 5-1) are monitored for plutonium only. These two locations in thesoutheast quadrant are areas of known plutonium contamination attributed to historicoperations, which included the operation of solar evaporators for plutonium-containingliquid waste.
The Livermore Valley network (Figure 5-2) consists of air particulate samplers located inall compass directions from the Livermore site. For the purposes of data analysis, foursamplers (FCC, FIRE, HOSP, and CHUR) located in the least prevalent wind directionsare considered to be upwind or representative of background locations, and foursamplers (PATT, ZON7, TANK, and AMON) located in the most prevalent downwinddirections are considered most likely to be affected by Laboratory operations. Anadditional sampler is located in another area of special interest, the Livermore WaterReclamation Plant (LWRP), because of a 1967 and earlier plutonium releases to thesanitary sewer system with subsequent soil contamination and potential resuspension(see Chapter 10, Results, for a discussion of this).
Livermore site beryllium monitoring continued in 1999 at the six perimeter locations.To satisfy beryllium reporting requirements and determine the effects of the Labor-atory’s beryllium operations, LLNL conducted a technical assessment of the berylliummonitoring locations at Site 300 in 1997. Although there is no requirement to samplefor beryllium at Site 300, as a best management practice, LLNL has decided to continueberyllium monitoring at three locations on site and at one location in the City of Tracy(TFIR).
Two sampling systems were added in July 1997 as part of the new low-volumeradiological air surveillance sampling network. The samplers are situated at the FCCand HOSP locations, sites that are generally upwind of the Livermore site. The resultsare used to establish background levels of gross alpha and beta activity for directcomparison to results from the air effluent samplers (see Chapter 4). The samplingsystems are very similar to the air-effluent samplers used in facilities, includingsampling system design, sampler operation, filter media, sample tracking, sampleanalysis, and processing of results.

Air Surveillance Monitoring 5
LLNL Environmental Report for 1999 5-7
Tritium Sampling Locations
LLNL also maintains 11 continuously operating, airborne tritium samplers on theLivermore site (Figure 5-1), six samplers in the Livermore Valley (Figure 5-2), andone sampler near Site 300 (Figure 5-3) to assess historical and current activities thatinfluence environmental impacts. Four of the Livermore site locations (B331, B292,B514, and B624) monitor diffuse tritium emissions.
Radiological Analysis
As outlined in Environmental Regulatory Guide for Radiological Effluent Monitoring andEnvironmental Surveillance (U.S. Department of Energy 1991), gross alpha and gross betaair filter results are used as trend indicators; specific radionuclide analysis is done forplutonium, uranium, and gamma emitters. Radiological analytical results are reportedas a measured concentration per volume of air, or as less than the minimum detectionconcentration (MDC) when no activity is detected. In all cases, the MDC is adequate fordemonstrating compliance with the pertinent regulatory requirements for radionuclidesthat may be or are present in the air sample and for evaluating LLNL-induced environ-mental impacts. Particle size distributions are not determined because the estimatedeffective dose equivalent to the maximally exposed individual is well below the0.01-mSv (1-mrem) allowable limit as discussed in the above-mentioned environmentalregulatory guide.
Gross alpha and gross beta activities are determined by gas-flow proportional counting,plutonium by alpha spectrometry, uranium by mass spectrometry, gamma emitters bygamma spectroscopy, and tritium by liquid scintillation. Further details of the surveil-lance monitoring methods are included in Chapter 5, Data Supplement.
Results
This section discusses the air monitoring results from all air surveillance locations atthe Livermore site, Site 300, and all off-site surveillance locations.
In April 1997, the radiological air particulate sampling filter media were changed fromcellulose to glass fiber; however, blank glass-fiber filters contain detectable amounts ofsome naturally occurring radiological isotopes (Althouse 1998) including uranium-235,uranium-238, potassium-40, radium-226, radium-228 and thorium-228. LLNL adjusts

5 Air Surveillance Monitoring
5-8 LLNL Environmental Report for 1999
the measured concentrations of these isotopes according to U.S. EnvironmentalProtection Agency (EPA) procedures (Eadie and Bernhardt 1976) and subtracts theappropriate blank filter content from the gross analytical result to obtain a corrected netresult.
Livermore Site
Airborne Radioactivity
Table 5-2 summarizes the monthly gross alpha and gross beta results for the LLNLperimeter, Livermore Valley, Site 300, and Site 300 off-site sampling locations. Detectionfrequencies, median concentrations, interquartile ranges (IQR), and maximum concen-tration values for each network are included. (See Data Supplement Tables 5-1, 5-2, and5-3 for detailed location results for all high-volume networks for gross alpha and grossbeta concentrations.)
Typical gross alpha activity (median value) for the LLNL perimeter is 4.5 × 10⁻⁵ Bq/m3
(1.2 × 10⁻¹⁵ Ci/m 3); for the upwind Livermore Valley stations, the value is
3.8 × 10⁻⁵ Bq/m3 (1.0 × 10⁻¹⁵ Ci/m 3); and for the downwind Livermore Valley stations,
the value is 5.0 × 10⁻⁵ Bq/m3 (1.3 × 10⁻¹⁵ Ci/m 3). Negative values occur when the
activity of the analytical background filters is higher than the activity on the filters beinganalyzed. Typical gross beta activity (median value) for the LLNL perimeter is3.2 × 10−4 Bq/m3 (8.7 × 10⁻¹⁵ Ci/m
3); for the upwind Livermore Valley stations, thevalue is 3.0 × 10⁻⁴ Bq/m3 (8.1 × 10⁻¹⁵ Ci/m
3); and for the downwind Livermore stations,the value is 3.4 × 10⁻⁴ Bq/m3 (9.1 × 10⁻¹⁵ Ci/m
3). The primary sources of the alpha andbeta activities are the naturally occurring radioisotopes of uranium and thorium, andany residual fallout from atmospheric weapons testing and the 1986 Chernobyl reactoraccident. The values are slightly higher than those obtained from previous monitoringdata during the past several years and are likely caused by a change in March in theanalytical laboratory used to perform the gross alpha and gross beta analysis. Data werealso elevated when the analytical laboratory was changed in 1993.
The monthly median gross alpha and gross beta concentrations are plotted inFigures 5-4 and 5-5, respectively. The gross beta results followed a pattern similar toprevious years’ data. The gradual increase in beta activity throughout the summer wasmost likely caused by an increase in resuspension of soils that occurs during the dryseason.

Air Surveillance Monitoring 5
LLNL Environmental Report for 1999 5-9
Table 5-2. Gross alpha and gross beta concentration in air particulate samples summarized bymonth, 1999.
Gross alpha (10–6 Bq/m3) Gross beta (10–6 Bq/m3)
Detection Detection
Month frequency(a)Median IQR(b) Maximum frequency Median IQR Maximum
LLNL perimeter locations
Jan 4/30 28.0 59.3 85.1 30/30 712 680 1460
Feb 1/24 9.78 21.8 68.0 20/24 203 100 478
Mar 21/24 45.9 20.9 72.9 24/24 230 72.8 327
Apr 22/29 50.3 49.3 98.8 29/29 269 148 844
May 7/24 18.6 18.1 74.4 24/24 315 90.1 394
Jun 11/23 27.3 37.0 130 23/23 185 116 525
Jul 22/30 43.1 39.9 125 30/30 245 108 659
Aug 13/24 35.1 64.6 96.9 24/24 331 357 696
Sep 23/23 71.4 36.4 120 23/23 648 179 932
Oct 28/30 228 168 385 30/30 1300 607 2660
Nov 20/24 115 77.2 214 24/24 882 276 1070
Dec 24/24 86.6 94.1 277 24/24 696 778 2530
Livermore Valley upwind locations
Jan 2/20 16.1 64.8 84.6 20/20 651 822 1460
Feb 1/16 8.0 42.7 64.1 16/16 196 100 443
Mar 10/16 44.8 32.4 76.2 16/16 235 38.9 310
Apr 12/20 37.1 35.7 106 20/20 258 83.9 666
May 6/16 16.3 20.4 61.8 16/16 275 84.6 442
Jun 4/15 21.0 11.9 54.4 15/15 203 109 444
Jul 13/20 38.5 38.5 104 20/20 247 84.4 736
Aug 11/16 35.1 34.5 98.8 16/16 325 379 655
Sep 16/16 70.1 18.2 98.8 16/16 670 198 892
Oct 19/20 252 179 414 20/20 1270 566 2350
Nov 13/16 115 116 212 16/16 812 283 1120
Dec 15/16 90.8 87.0 259 16/16 605 832 2500

5 Air Surveillance Monitoring
5-10 LLNL Environmental Report for 1999
Table 5-2. Gross alpha and gross beta concentration in air particulate samples summarized bymonth, 1999 (concluded).
Gross alpha (10–6 Bq/m3) Gross beta (10–6 Bq/m3)
Detection Detection
Month frequency(a)Median IQR(b) Maximum frequency Median IQR Maximum
Livermore Valley downwind locations
Jan 3/25 11.3 50.9 101 25/25 717 696 1480
Feb 1/20 14.4 33.5 64.0 20/20 198 129 376
Mar 17/20 53.7 32.4 85.5 20/20 248 47.2 349
Apr 20/25 51.4 45.5 128 25/25 302 84.4 725
May 7/20 15.7 28.7 102 20/20 268 52.1 472
Jun 12/20 30.2 26.9 62.5 20/20 201 80.4 403
Jul 12/25 24.7 48.6 104 25/25 253 75.9 740
Aug 18/20 48.1 35.0 102 20/20 375 447 673
Sep 20/20 70.7 38.9 120 20/20 710 130 903
Oct 22/25 231 180 492 25/25 1210 648 2680
Nov 19/20 119 89.7 182 20/20 821 353 1080
Dec 18/20 92.9 129 302 20/20 677 895 2450
Site 300(c) sampling locations
Jan 2/35 20.8 42.2 110 34/35 551 651 1320
Feb 3/28 7.70 36.5 79.5 26/28 189 122 497
Mar 21/28 49.4 44.0 89.9 28/28 247 80 367
Apr 29/35 50.3 32.6 134 35/35 344 133 803
May 18/28 33.3 25.4 70.7 28/28 376 109 466
Jun 20/28 35.3 31.4 86.2 28/28 320 161 488
Jul 27/35 63.3 50.7 143 35/35 301 155 873
Aug 20/22 49.4 50.9 128 22/22 463 426 818
Sep 28/28 96.8 41.1 142 28/28 984 257 1210
Oct 32/35 221 152 352 35/35 1200 509 2330
Nov 26/28 116 93.8 214 28/28 849 369 1240
Dec 28/28 91.6 110 302 28/28 644 833 2510
a Detection frequency is the number of samples with results above the detection limit divided by the number of samples.
b IQR = Interquartile range.
c Results for Site 300 off-site locations TFIR and PRIM are given in the Data Supplement Table 5-15.
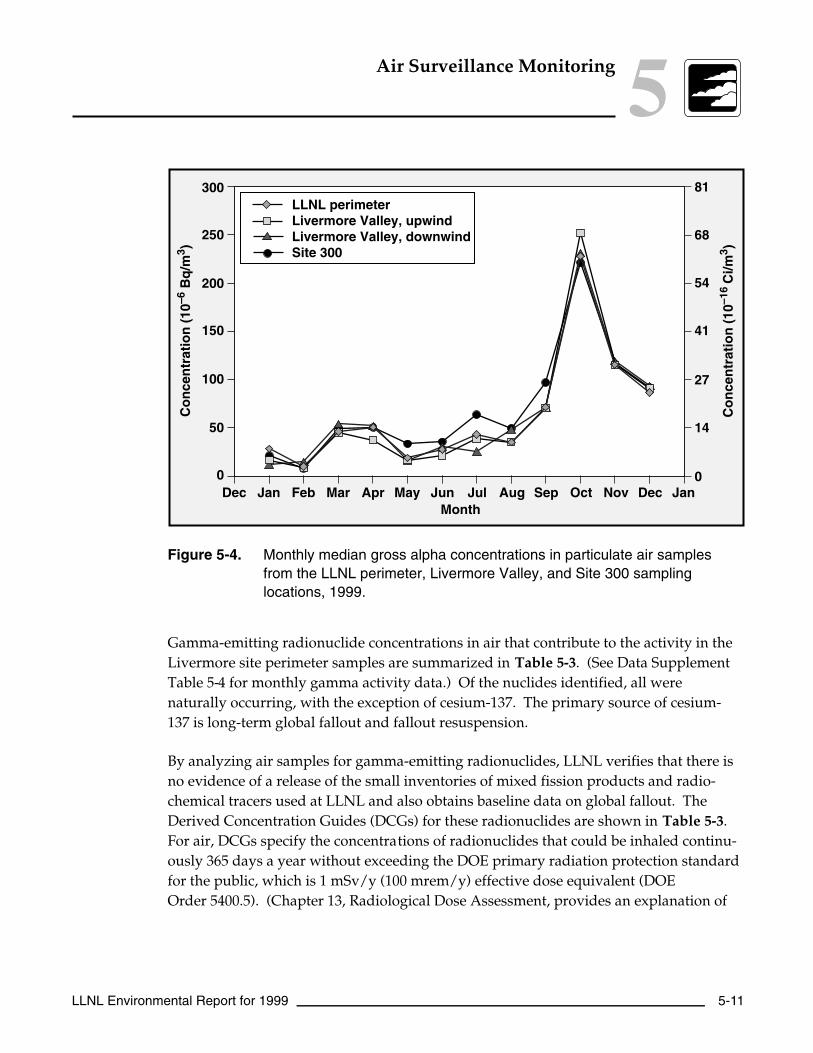
Air Surveillance Monitoring 5
LLNL Environmental Report for 1999 5-11
Co
nce
ntr
atio
n (
10–6
Bq
/m3 )
Co
nce
ntr
atio
n (
10–1
6 C
i/m3 )
MonthJan Feb Mar Apr May Jun Jul Aug Sep Oct Nov DecDec
0
81
68
54
41
27
14
0
300
250
200
150
100
50
Jan
LLNL perimeterLivermore Valley, upwindLivermore Valley, downwindSite 300
Figure 5-4. Monthly median gross alpha concentrations in particulate air samplesfrom the LLNL perimeter, Livermore Valley, and Site 300 samplinglocations, 1999.
Gamma-emitting radionuclide concentrations in air that contribute to the activity in theLivermore site perimeter samples are summarized in Table 5-3. (See Data SupplementTable 5-4 for monthly gamma activity data.) Of the nuclides identified, all werenaturally occurring, with the exception of cesium-137. The primary source of cesium-137 is long-term global fallout and fallout resuspension.
By analyzing air samples for gamma-emitting radionuclides, LLNL verifies that there isno evidence of a release of the small inventories of mixed fission products and radio-chemical tracers used at LLNL and also obtains baseline data on global fallout. TheDerived Concentration Guides (DCGs) for these radionuclides are shown in Table 5-3.For air, DCGs specify the concentrations of radionuclides that could be inhaled continu-ously 365 days a year without exceeding the DOE primary radiation protection standardfor the public, which is 1 mSv/y (100 mrem/y) effective dose equivalent (DOEOrder 5400.5). (Chapter 13, Radiological Dose Assessment, provides an explanation of

5 Air Surveillance Monitoring
5-12 LLNL Environmental Report for 1999
Co
nce
ntr
atio
n (
10–6
Bq
/m3 )
Co
nce
ntr
atio
n (
10–1
6 C
i/m3 )
1400
1200
1000
800
600
400
200
0
LLNL perimeterLivermore Valley, upwindLivermore Valley, downwindSite 300
JanDec Feb Mar Apr May JunMonth
Jul Aug Sep Oct Nov Dec Jan0
54
110
380
320
270
220
160
Figure 5-5. Monthly median gross beta concentrations in particulate air samplesfrom the LLNL perimeter, Livermore Valley, and Site 300 samplinglocations, 1999.
this and other units of dose.) Table 5-3 also presents the percent of the DCGs, whichdemonstrates that the level of gamma activity present in air at the Livermore siteperimeter was far below the DCGs.
Table 5-4 shows the concentrations of airborne plutonium-239+240 on air filters fromthe LLNL perimeter locations. (See Data Supplement Table 5-5 for the monthly databy location.) The highest concentration was registered at location VIS in May 1999; theconcentration value is reported as 3.9 × 10⁻⁸ Bq/m3 (1.1 × 10⁻¹⁸ Ci/m3), which repre-sents 0.005% of the DCG. The median concentration at location VIS is 1.3 × 10⁻⁸ Bq/m3
(3.5 × 10⁻¹⁹ Ci/m3), which is slightly lower than that for the previous year.
Table 5-4 also shows the detection frequency, median concentration, IQR, maximumconcentration, and percent of DCG for the concentration of plutonium on air filtersamples collected in the Livermore Valley. (See Data Supplement Table 5-6 for monthlydata.) The highest off-site concentration of plutonium-239+240 occurred at PATT duringOctober, which had a median observed value of 0.0004% of the DCG.

Air Surveillance Monitoring 5
LLNL Environmental Report for 1999 5-13
Table 5-3. Gamma activity in air particulate samples, Livermore site perimeter and Site 300, 1999.
7Be 40K 137Cs 22Na 226Ra 228Ra 228Th
(10–3 Bq/m3) (10–6 Bq/m3)
Livermore perimeter locations
Median 3.4 12 0.21 0.24 –0.011 0.33 0.29
Interquartile range 0.85 20 —(a) —(a) 0.95 0.98 0.72
Maximum 7.8 40 0.57 0.57 0.96 3.7 1.8
Percent of DCG(b) 2.3 × 10⁻⁴ 3.7 × 10⁻⁵ 1.4 × 10⁻⁶ 6.4 × 10⁻⁷ 2.6 × 10⁻³(c) 3.0 × 10⁻⁴ 0.019
Site 300 locations
Median 3.8 13 0.20 0.43 0.17 0.36 –0.31
Interquartile range 2.3 41 —(a) —(a) 2.0 1.5 1.2
Maximum 7.2 61 0.62 0.71 1.8 5.4 3.3
Percent of DCG 2.5 × 10⁻⁴ 3.8 × 10⁻⁵ 1.3 × 10⁻⁶ 1.1 × 10⁻⁶ 4.6 × 10⁻⁴ 3.2 × 10⁻⁴ 0.22(c)
DCG (Bq/m3) 1.5 × 10³ 33 15 37 0.037 0.11 1.5 × 10⁻³
a No measure of dispersion calculated; see Chapter 14, Quality Assurance.
b Derived Concentration Guide. Percent calculated from the median concentration.
c Percent of DCG calculated with maximum value because the median is negative.
Table 5-4 shows the median concentrations of airborne plutonium-239+240 at the twodiffuse source locations (B531 and CRED). (See Data Supplement Table 5-7 for monthlydata.) The median concentration of 2.7 × 10⁻⁸ Bq/m3 (7.3 × 10⁻¹⁹ Ci/m3) at locationB531 is higher than the median concentration for any of the other air particulatesampling locations, but it is still only 0.004% of the DCG. The higher concentrations areattributed to historic waste management operations, which included the operation ofsolar evaporators for plutonium-containing liquid waste (Silver et al. 1974).
In October, the plutonium concentrations reported were above the minimum detectiblelevel for all locations. While this is unusual, none of these values exceeded the actionlevels identified in the Environmental Monitoring Plan (Tate et al. 1999). However,because the concentrations were unusual, they were investigated at the analyticallaboratory. The analytical laboratory found no source of error or contamination. Asimilar increase was detected in nearly all other particulate surveillance data (includinglow-volume data) in October. This increase is likely the result of increased particulateresuspension and subsequent filter loading that occurs during dry months. Thisanomaly did not occur in any other months in 1999.

5 Air Surveillance Monitoring
5-14 LLNL Environmental Report for 1999
Table 5-4. Plutonium-239+240 activity in air particulate samples (10–9 Bq/m3), 1999.
Sampling Detection Interquartile Percent
location(a) frequency(b) Median range Maximum of DCG(c)
Livermore Valley downwind locations
AMON 4/12 3.58 4.16 16.1 4.84 × 10⁻⁴
PATT 4/12 2.68 4.57 25.2 3.62 × 10⁻⁴
TANK 2/12 2.01 1.99 8.66 2.71 × 10⁻⁴
ZON7 2/12 1.87 2.65 23.1 2.52 × 10⁻⁴
Livermore Valley upwind locations
CHUR 3/12 1.37 5.78 23.8 1.84 × 10⁻⁴
FCC 1/12 0.103 2.85 11.1 1.39 × 10⁻⁵
FIRE 2/12 2.10 3.12 11.1 2.84 × 10⁻⁴
HOSP 1/12 0.264 1.52 6.40 3.56 × 10⁻⁵
LLNL perimeter locations
CAFE 8/12 5.51 7.01 25.1 7.45 × 10⁻⁴
COW 3/12 4.64 2.22 28.7 6.28 × 10⁻⁴
MESQ 1/12 3.85 3.19 22.0 5.21 × 10⁻⁴
MET 2/12 2.52 2.83 7.99 3.41 × 10⁻⁴
SALV 3/12 3.88 2.43 18.0 5.25 × 10⁻⁴
VIS 7/12 13.0 20.1 38.9 1.76 × 10⁻³
Diffuse on-site sources locations
B531 12/12 26.9 50.2 94.0 3.64 × 10⁻³
CRED 7/12 6.05 4.29 33.5 8.18 × 10⁻⁴
Special interest location
LWRP 5/12 5.06 3.24 21.1 6.83 × 10⁻⁴
Site 300 on-site locations
S300composite
4/12 1.79 2.52 8.7 2.41 × 10⁻⁴
Site 300 off-site locations
PRIM 2/12 1.91 3.78 11.3 2.58 × 10⁻⁴
TFIR 3/11 2.43 5.67 12.6 3.29 × 10⁻⁴
a See Figures 5-1, 5-2, and 5-3 for sampling locations.
b Detection frequency is the number of samples with results above the detection limit divided by the number of samples.
c DCG = Derived Concentration Guide of 7.4 × 10⁻⁴ Bq/m3 (2 × 10⁻⁸ µCi/m3) for 239Pu activity in air. Percentcalculated from the median concentration.

Air Surveillance Monitoring 5
LLNL Environmental Report for 1999 5-15
Figure 5-6 shows the annual median concentrations of plutonium-239+240 for locationsSALV (on site) and FCC (off site) from 1982 to 1999. Location FCC represents a typicalupwind background location, and SALV represents a typical perimeter location. Theannual median concentration for FCC was 1.0 × 10⁻¹⁰ Bq/m3 (2.7 × 10⁻²¹ Ci/m3).
Figure 5-6 uses a log scale and, for the years in which a negative median concentrationwas calculated, the positive value closest to the median was plotted. The higher values inthe past at SALV may be attributed to historical activities at LLNL. In 1993, clean top soilwas laid over much of the area, reducing the potential for increased levels from soil resus-pension. The sampler at SALV was moved to a nearby grassy knoll, possibly resulting ina decrease in the plutonium median for 1999. The downward trend at location FCC is theresult of decreasing residual global fallout.
10–11
10–10
10–9
10–8
10–7
10–6
10–5
10–4
10–3
10–2
1980 1982 1984 1986 1988Year
Co
nce
ntr
atio
n (
Bq
/m3 )
Co
nce
ntr
atio
n (
Ci/m
3 )
1990 1992 1994 1996 1998 2000
10–21
10–20
10–19
10–18
10–17
10–16
10–15
10–14
10–13
2.7×10⁻²²
SALVFCC
DCG = 7.4 × 10⁻⁴ Bq/m3
2.7×10⁻¹³
Figure 5-6. Annual median plutonium concentrations in air particulate samples at twolocations, SALV and FCC, 1982–1999.

5 Air Surveillance Monitoring
5-16 LLNL Environmental Report for 1999
The ratio of uranium-235 to uranium-238 can be used to identify the source of theuranium. Both uranium-235 and uranium-238 occur naturally in the area, but only 0.7%of the naturally occurring uranium is uranium-235, and the remainder is almost entirelyuranium-238. The median uranium-235 and uranium-238 mass concentrations in airsamples from the Livermore site perimeter are shown in Table 5-5. (See Data Supple-ment Table 5-8 for monthly data.) The maximum measured concentration of uranium-238 (at location SALV during October) is less than 0.2% of the DCG. All uranium-235/uranium-238 median ratios are generally as expected for naturally occurring uranium;however, September monthly data in the Data Supplement show some unexpecteduranium-235/uranium-238 ratios. The cause for these anomalous data is unknown;however, these ratios may be the result of increased variability in measured concen-trations near the detection limit. No significant environmental impact stems from theobserved ratios.
The low-volume radiological air sampling locations HOSP and FCC have typicalgross alpha and gross beta activity of 4.7 × 10⁻⁵ Bq/m3 (1.3 × 10⁻¹⁵ Ci/m3) and4.8 × 10−4 Bq/m3 (1.3 × 10⁻¹⁴ Ci/m3), respectively. (See Data Supplement Tables 5-9 and5-10 for monthly median data.) These gross alpha values are slightly higher than thosereported from the high-volume sampling systems at the same locations. The differenceis probably caused by differences in the filter type. LLNL is conducting a study todetermine the cause of the differences.
Table 5-6 shows the median concentrations of tritiated water vapor for the LivermoreValley sampling locations. (See Data Supplement Table 5-11 for biweekly data foreach location.) The highest annual median concentration was observed at locationZON7. At approximately 3.9 × 10⁻² Bq/m3 (1.1 × 10⁻¹² Ci/m3), this concentrationrepresents 0.001% of the DCG. The highest biweekly concentration was observedin February at ZON7. If it were a yearly average, this concentration, 0.27 Bq/m3
(7.3 × 10⁻¹² Ci/m3), would be 0.007% of the DCG. The 1999 tritium values were slightlyhigher than those reported last year because of slightly elevated emissions from theTritium Facility (Building 331) during January, February, and March.
Table 5-6 also shows the median concentrations of tritiated water vapor that wereobserved at the Livermore site perimeter sampling locations. (See Data SupplementTable 5-12 for biweekly data.) The highest annual median concentration was observedat location POOL, which was 0.14 Bq/m3 (3.8 × 10⁻¹² Ci/m3), or 0.004% of the DCG.

Air Surveillance Monitoring 5
LLNL Environmental Report for 1999 5-17
Table 5-5. Uranium mass concentration in air particulate samples, 1999.
Samplinglocation(a)
235U(b)
(10–7 µg/m3)
238U(c)
(10–5 µg/m3)
235U/238U (d)
(10–3)
LLNL perimeter locations
CAFE
Median 4.29 6.57 6.70
Interquartile range 2.54 5.32 0.335
Maximum 11.3 17.9 NA(e)
Percent of DCG(f) 9.13 × 10⁻⁴ 2.19 × 10⁻² NA
COW
Median 4.96 7.13 6.88
Interquartile range 3.74 5.96 0.363
Maximum 10.9 15.7 NA
Percent of DCG 1.05 × 10⁻³ 2.38 × 10⁻² NA
MESQ
Median 3.90 6.43 6.97
Interquartile range 3.07 4.41 0.549
Maximum 8.88 12.4 NA
Percent of DCG 8.30 × 10⁻⁴ 2.14 × 10⁻² NA
MET
Median 2.66 3.80 6.85
Interquartile range 1.26 2.09 0.419
Maximum 9.32 13.5 NA
Percent of DCG 5.67 × 10⁻⁴ 1.27 × 10⁻² NA
SALV
Median 2.34 3.77 6.88
Interquartile range 1.62 2.39 0.931
Maximum 10.3 14.8 NA
Percent of DCG 4.97 × 10⁻⁴ 1.26 × 10⁻² NA
VIS
Median 3.25 4.76 6.85
Interquartile range 2.72 5.3 0.410
Maximum 11.4 17.1 NA
Percent of DCG 6.92 × 10⁻⁴ 1.59 × 10⁻² NA

5 Air Surveillance Monitoring
5-18 LLNL Environmental Report for 1999
Table 5-5. Uranium mass concentration in air particulate samples, 1999 (concluded).
Samplinglocation(a)
235U(b)
(10–7 µg/m3)
238U(c)
(10–5 µg/m3)
235U/238U (d)
(10–3)
Site 300 on-site locations
Site 300 composite
Median 2.91 4.55 6.29
Interquartile range 3.73 6.16 0.919
Maximum 9.06 18.6 NA
Percent of DCG 6.20 1.52 NA
Site 300 off-site location
PRIM
Median 4.01 5.70 6.98
Interquartile range 4.01 5.56 0.604
Maximum 14.7 18.2 NA
Percent of DCG 8.53 1.90 NA
a See Figures 5-1 and 5-3 for sampling locations.
b Derived Concentration Guide = 0.047 µg/m3 for uranium-235 activity in air. Uranium-235 activities in Bq/m3 can bedetermined by dividing the weight in µg/m3 by 12.5, and pCi m3 can be determined by dividing by 0.463.
c Derived Concentration Guide = 0.3 µg/m3 for uranium-238 activity in air. Uranium-238 activities in Bq/m3 can bedetermined by dividing the weight in µg/m3 by 80.3, and pCi m3 can be determined by dividing by 2.97.
d Naturally occurring uranium has a uranium-235/uranium-238 ratio of 7.1 × 10⁻³.
e NA = Not applicable.
f DCG = Derived Concentration Guide. Percent calculated from the median concentration.
Diffuse sources of tritium on the Livermore site are monitored at air tritium samplinglocations B292, B331, B514, and B624. Table 5-6 shows the median concentrationsof tritiated water vapor for these sampling locations. (See Data Supplement Table 5-13for biweekly data.) The highest median concentration was observed at location B624.This concentration was 4.5 Bq/m3 (1.2 × 10⁻¹⁰ Ci/m3) and represents 0.1% of the DCG.The highest biweekly tritium concentration, 13.8 Bq/m3 (3.7 × 10⁻¹⁰ Ci/m3), wasobserved in April at location B331. If it were a yearly average, this concentration wouldrepresent 0.4% of the DCG.
The B331 location is near the Tritium Facility (Building 331), where LLNL personnelhave reduced operations in recent years and performed significant inventory reductionand cleanup activities. During this process, tritium-contaminated equipment slated fordisposal is stored in an area outside B331 before being sent to Hazardous WasteManagement facilities. During 1999, outgassing from such waste processing released anestimated 2.7 × 10¹¹ Bq (7.3 Ci) of tritium to the atmosphere outside Building 331.

Air Surveillance Monitoring 5
LLNL Environmental Report for 1999 5-19
Table 5-6. Tritium in air samples (10–3 Bq/m3), 1999.
Samplinglocation(a)
Detectionfrequency(b) Median IQR(c) Maximum
Percent ofDCG(d)
Mediandose
(mSv)(e)
Livermore Valley locations
AMON 13/25 20.0 25.6 175 5.4 × 10⁻⁴ 4.2 × 10⁻⁶
FIRE 10/24 13.7 24.2 147 3.7 × 10⁻⁴ 2.8 × 10⁻⁶
HOSP 5/23 3.27 10.7 87.0 8.8 × 10⁻⁵ 6.8 × 10⁻⁷
VET 10/24 15.3 34.2 242 4.1 × 10⁻⁴ 3.2 × 10⁻⁶
XRDS 9/25 10.2 24.9 93.2 2.8 × 10⁻⁴ 2.1 × 10⁻⁶
ZON7 19/25 39.2 44.4 268 1.1 × 10⁻³ 8.1 × 10⁻⁶
Livermore perimeter locations
CAFE 23/26 65.0 85.5 1,890 1.8 × 10⁻³ 1.3 × 10⁻⁵
COW 25/25 52.5 95.8 688 1.4 × 10⁻³ 1.1 × 10⁻⁵
MESQ 16/25 45.9 68.1 357 1.2 × 10⁻³ 9.5 × 10⁻⁶
MET 19/26 35.8 48.6 236 9.7 × 10⁻⁴ 7.4 × 10⁻⁶
POOL 25/26 139 269 1,400 3.8 × 10⁻³ 2.9 × 10⁻⁵
SALV 20/25 50.7 71.3 485 1.4 × 10⁻³ 1.1 × 10⁻⁵
VIS 25/25 89.9 84.3 622 2.4 × 10⁻³ 1.9 × 10⁻⁵
Diffuse on-site sources locations
B292 26/26 182 228 540 4.9 × 10⁻³ 3.8 × 10⁻⁵
B331 22/22 2,530 7,930 13,800 6.8 × 10⁻² 5.2 × 10⁻⁴
B514 26/26 1,650 1,230 2,950 4.5 × 10⁻² 3.4 × 10⁻⁴
B624 26/26 4,520 2,410 9,180 1.2 × 10⁻¹ 9.4 × 10⁻⁴
Site 300 off site location
PRIM 2/25 4.11 15.0 27.4 1.1 × 10⁻⁴ 8.5 × 10⁻⁷
a See Figures 5-1, 5-2, and 5-3 for sample locations.
b Detection frequency is the number of samples with results above the detection limit divided by the number ofsamples.
c IQR = Interquartile range.
d DCG = Derived Concentration Guide of 3.7 × 10³ Bq/m3. Percent calculated from the median concentration.
e 1 mSv = 100 mrem.
The B624 location is situated in the Building 612 yard, which is dedicated to hazardouswaste, radioactive waste, and mixed-waste management activities. The yard has severalareas where waste containers that are outgassing tritium are stored outdoors.

5 Air Surveillance Monitoring
5-20 LLNL Environmental Report for 1999
The B514 sampling location is in a hazardous waste management area where tritium-contaminated waste is treated, and the B292 location is near an underground retentiontank that had previously leaked. The concentrations in air at the B514 sampling locationare variable because of the changing concentrations of tritium in the waste stream. The1999 median concentrations at B292 and B514 are similar to the median concentrationsin 1998.
Beryllium in Air
The median concentrations of airborne beryllium for the Livermore site perimetersampling locations are shown in Table 5-7. (See Data Supplement Table 5-14 formonthly data.) The highest value of 37.8 pg/m3 was found in the October compositeat location COW and was most likely attributed to resuspension and mass loading ofparticulates containing naturally occurring beryllium from construction activities anda lack of rainfall. The median concentration for this location is 0.11% of the monthlyambient concentration limit (ACL) of 10,000 pg/m3 established by the Bay Area AirQuality Management District (BAAQMD) and the EPA.
Table 5-7. Beryllium(a) in air particulate samples (pg/m3), Livermore site perimeterand Site 300 locations, 1999.
Samplinglocation(b)
Detectionfrequency(c) Median Interquartile
rangeMaximum
Livermore perimeter locations
CAFE 11/12 11.1 7.40 23.8
COW 12/12 10.8 9.10 37.8
MESQ 11/12 11.0 7.50 36.4
MET 11/12 7.83 4.28 23.9
SALV 10/12 7.47 6.31 25.7
VIS 12/12 10.3 8.02 33.2
Site 300 locations
801E 12/12 11.8 9.32 30.9
EOBS 10/12 5.53 4.77 18.2
GOLF 12/12 10.2 14.3 26.4
TFIR 11/11 13.4 6.24 32.3
a The state ambient concentration limit is 10,000 pg/m3.
b See Figures 5-1 and 5-3 for sampling locations.
c Detection frequency is the number of samples with results above the detection limit divided by the number of samples.
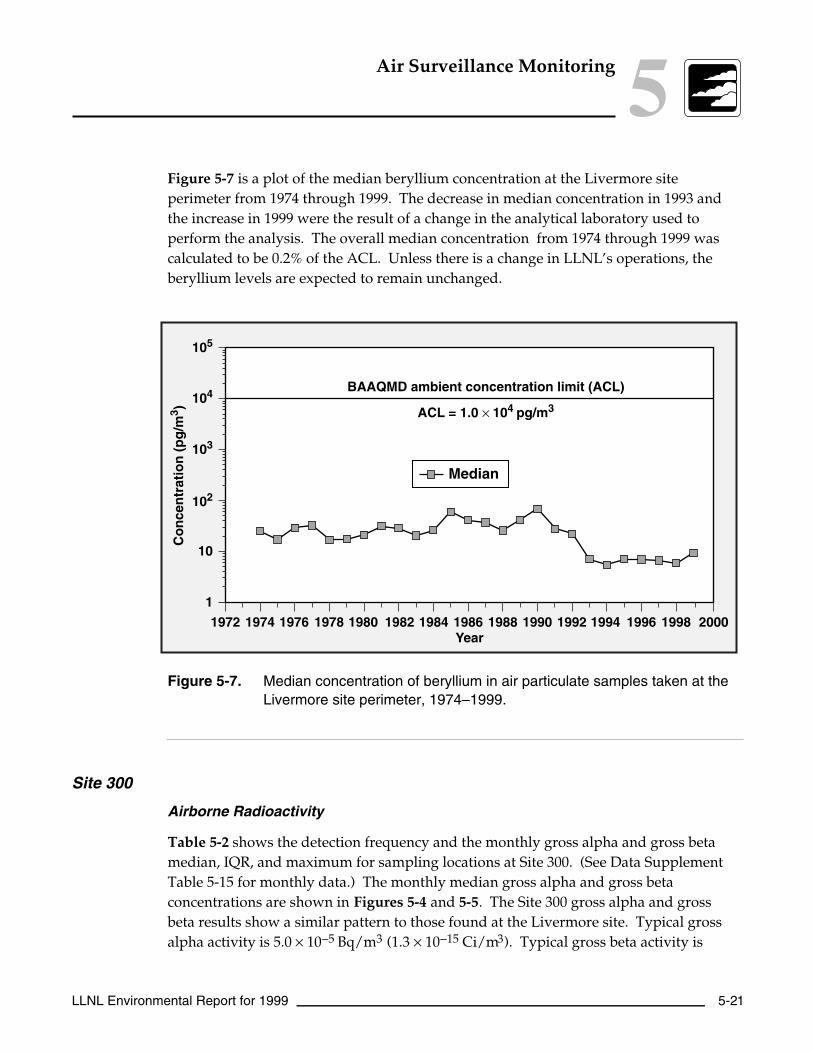
Air Surveillance Monitoring 5
LLNL Environmental Report for 1999 5-21
Figure 5-7 is a plot of the median beryllium concentration at the Livermore siteperimeter from 1974 through 1999. The decrease in median concentration in 1993 andthe increase in 1999 were the result of a change in the analytical laboratory used toperform the analysis. The overall median concentration from 1974 through 1999 wascalculated to be 0.2% of the ACL. Unless there is a change in LLNL’s operations, theberyllium levels are expected to remain unchanged.
19741972 1976 1978 1980 1982 1984Year
Co
nce
ntr
atio
n (
pg
/m3 )
1986 1988 1990 1992 1994 1996 1998 2000
1
10
102
103
104
105
BAAQMD ambient concentration limit (ACL)
ACL = 1.0 × 10⁴ pg/m3
Median
Figure 5-7. Median concentration of beryllium in air particulate samples taken at theLivermore site perimeter, 1974–1999.
Site 300
Airborne Radioactivity
Table 5-2 shows the detection frequency and the monthly gross alpha and gross betamedian, IQR, and maximum for sampling locations at Site 300. (See Data SupplementTable 5-15 for monthly data.) The monthly median gross alpha and gross betaconcentrations are shown in Figures 5-4 and 5-5. The Site 300 gross alpha and grossbeta results show a similar pattern to those found at the Livermore site. Typical grossalpha activity is 5.0 × 10⁻⁵ Bq/m3 (1.3 × 10⁻¹⁵ Ci/m3). Typical gross beta activity is

5 Air Surveillance Monitoring
5-22 LLNL Environmental Report for 1999
4.2 × 10⁻⁴ Bq/m3 (1.1 × 10⁻¹⁴ Ci/m3). These values are slightly higher than thoseobtained from previous monitoring data during the past several years and were likelycaused by the variations in how the different analytical laboratories performed theanalyses. (As mentioned above, LLNL selected a new analytical laboratory to performgross alpha and gross beta analysis in March 1999).
The primary sources of observed gross alpha and gross beta activity are naturallyoccurring radioisotopes of uranium and thorium, their decay products, and any residualfallout from atmospheric weapons testing and the 1986 Chernobyl reactor accident.
Table 5-3 lists the annual median activities, detection frequencies, IQR, maximum, thepercent of the DCG, as well as the DCG, of gamma-emitting radionuclides in samplesfrom Site 300. (See Data Supplement Table 5-16 for monthly data.) All theseradionuclides were measured at concentrations significantly below the DCGs. Of thenuclides identified, all are naturally occurring, with the exception of cesium-137. Theprimary source of 137Cs normally is long-term global fallout and resuspension.
Table 5-4 shows the median concentration of plutonium-239+240 on air-filter samplescollected from Site 300. (See Data Supplement Table 5-17 for monthly data.) The highestconcentration of plutonium-239 was recorded in the September composite at a level of8.7 × 10−9 Bq/m3 (2.3 × 10⁻¹⁹ Ci/m3), or 0.001% of the DCG.
Table 5-5 shows the median concentration of uranium-235, uranium-238, and theuranium-235/uranium-238 ratio on air samples from Site 300 and vicinity. (See DataSupplement Table 5-18 for monthly data.) The highest concentration of uranium-238was observed in the September composite at a level of 1.9 × 10⁻⁴ µg/m3. The highesturanium-235 concentration was recorded at PRIM during March at a level of1.5 × 10−6 µg/m3.
As previously discussed in the Livermore Site Results section, the ratio of uranium-235to uranium-238 is used to identify the source of the uranium. Because Site 300operations use depleted uranium that contains very little uranium-235, it follows that ifthe ratio remains constant and near 0.7% (within the limit of sampling and analyticalerror), then the uranium-238 measured is from natural sources. The uranium-235/uranium-238 ratios in the September and October Site 300 composite (and in Augustand September at location PRIM) are less than expected for natural sources, whichindicates some impact from operations at Site 300. These data are supported by Site300 activities from B851 published in the NESHAPs Report (Gallegos et al. 2000). Themedian concentration of uranium-238 for 1999, however, is only 0.02% of the DCG.

Air Surveillance Monitoring 5
LLNL Environmental Report for 1999 5-23
The uranium-235/uranium-238 median ratios for PRIM (off site) are generally asexpected for naturally occurring uranium; however, because of the higher valuerecorded for the uranium-235 during March, this ratio of 2.21 × 10⁻² indicates other thannatural uranium at this site. This sample was recounted at the analytical laboratory, andthe values were consistent with the original sample. While no significant environmentalimpact stems from the observed uranium-235 value (0.003% of the DCG), it is highlyunusual and is not corroborated with the Site 300 composite sample or seen in othermonths. Its cause is unknown; however, similar anomalous data have appeared in thepast. The overall levels were essentially the same as those reported in previous years.
Table 5-6 shows the median concentration of tritiated water vapor that was observedat the new sampling location (PRIM) near Site 300. (See Data Supplement Table 5-19for biweekly data.) The annual median concentration is 4.1 × 10⁻³ Bq/m3
(1.1 × 10⁻¹³ Ci/m3), or 0.0001% of the DCG.
Beryllium in Air
The detection frequency, median concentration, IQR, and maximum concentrations ofairborne beryllium for the Site 300 sampling locations are shown in Table 5-7. (See DataSupplement Table 5-20 for monthly data.) The highest beryllium concentration of 32.3pg/m3 occurred in October at location TFIR. The median concentration for this locationis 0.13% of the federal and state ambient concentration limit, which is 10,000 pg/m3.
Environmental Impact
The environmental impacts from both radioactive and nonradioactive effluents aredescribed in this section.
Radioactive Materials
LLNL operations involving radioactive materials had little impact on radionuclideconcentrations in ambient air during 1999. Radionuclide concentrations in air at theLivermore site and in the Livermore Valley were well below the levels that would causeconcern to the environment or public health according to existing regulatory standards.

5 Air Surveillance Monitoring
5-24 LLNL Environmental Report for 1999
The diffuse tritium sources at B292, B331, B514, and B624 had a localized effect;typically, tritium concentrations detected at the site perimeter or off site were not fromdiffuse sources.
The concentrations of radionuclides measured around Site 300 and in the City of Tracywere well below all standards and, except for uranium isotopes, reflected background ornaturally occurring levels of these materials. (See Chapter 13, Radiological DoseAssessment, for a discussion of estimated dose from these data.) The uranium-235/uranium-238 ratios in August and September were less than the ratio of naturallyoccurring concentrations of these isotopes, which suggested the presence of depleteduranium in those Site 300 air samples. This depleted uranium resulted from currenttesting as substantiated by Site 300 explosive experiments during those months(Gallegos et al. 2000). Nevertheless, the detected levels remain far below regulatorystandards.
Nonradioactive Materials
The concentrations of beryllium at both sites can be attributed to resuspension of surfacesoil containing naturally occurring beryllium. Local soils contain approximately 1 ppmof beryllium, and the air of the Livermore area and the Central Valley typically contains10 to 100 µg/m3 of particulates. Using a value of 50 µg/m3 for an average dust load and1 ppm for beryllium content of dust, a conservative airborne beryllium concentrationof 50 pg/m3 can be predicted. The overall annual medians for the Livermore siteand Site 300 are 9.3 pg/m3 and 8.6 pg/m3, respectively. These data are lower thanpredicted, well below standards, and do not indicate the presence of a threat to theenvironment or public health.

6
LLNL Environmental Report for 1999 6-1
Sewerable Water Monitoring
Jennifer M. LarsonRobert J. Vellinger Allen R. Grayson
Ted A. GiesingShari L. Brigdon
Introduction
In 1999, the Livermore site discharged an average of 1.0 million liters (ML) per day ofwastewater to the City of Livermore sewer system, an amount that constitutes 4.4% ofthe total flow to the system. This volume includes wastewater generated by SandiaNational Laboratories/California, which is discharged to the LLNL collection systemand combines with LLNL sewage before it is released at a single point to the municipalcollection system (Figure 6-1). In 1999, Sandia/California generated approximately 13%of the total effluent discharged from the Livermore site. LLNL’s wastewater containssanitary sewage and industrial wastewater and is discharged in accordance with permitrequirements and the City of Livermore Municipal Code, as discussed below in thePretreatment Discharges and Categorical Discharges sections.
The effluent is treated at the Livermore Water Reclamation Plant (LWRP). As part ofthe Livermore-Amador Valley Wastewater Management Program, the treated sanitarywastewater is transported out of the valley through a pipeline and discharged into SanFrancisco Bay. A small portion of this treated wastewater is used for summer irrigationof the adjacent municipal golf course. Sludge from the treatment process is disposed ofin sanitary landfills.
LLNL receives water from two suppliers. LLNL’s primary water source is the Hetch-Hetchy Aqueduct. Secondary or emergency water deliveries are taken from theAlameda County Flood Control and Water Conservation District Zone 7. This water isa mixture of ground water and water from the South Bay Aqueduct of the State WaterProject. Water quality parameters for the two sources are obtained from the suppliersand are used to evaluate compliance with the discharge permit conditions that limitchanges in water quality between receipt and discharge.

6 Sewerable Water Monitoring
6-2 LLNL Environmental Report for 1999
From Sandia National Laboratory
N
pH Monitoring
Station
Sewer Monitoring
Station
SewerDiversionFacility
To City of Livermore Collection System
Figure 6-1. LLNL sanitary sewer system, monitoring stations, and diversion facility.

Sewerable Water Monitoring 6
LLNL Environmental Report for 1999 6-3
Preventive Measures
Administrative and engineering controls at the Livermore site are designed to preventpotentially contaminated wastewater from being discharged directly to the sanitarysewer. Waste generators receive training on proper waste handling. LLNL personnelreview facility procedures and inspect processes to ensure appropriate discharges.Retention tanks collect wastewater from processes that might release contaminants inquantities sufficient to disrupt operations at the LWRP. Wastewater that cannot bedischarged into one or more of surface water collection units at LLNL’s ExperimentalTest Site (Site 300) is transported to LLNL’s Livermore site and managed underLivermore site retention tank administrative controls. Ground water (generated fromstartup operations associated with new, portable ground water treatment units, tests ofexperimental treatment units, and maintenance of existing treatment facilities) isanalyzed for pollutants of concern and must meet permitted criteria, or LWRP approvalmust be obtained before it can be discharged to the sanitary sewer. Finally, to verify thesuccess of training and control equipment, wastewater is sampled and analyzed notonly at the significant points of generation, as defined by type and quantity ofcontaminant generated, but also at the point of discharge to the municipal sewer system.
For facilities with installed retention tank systems, collected wastewater is dischargedto the sanitary sewer only if analytical laboratory results show that pollutant levelsare within allowable limits (Grandfield 1989). LLNL developed internal dischargeguidelines for specific sources and operations to ensure that sewer effluent for theentire site complies with LLNL’s wastewater discharge permit.
Table 6-1 shows LLNL’s internal discharge guidelines for wastewater discharged to thesewer. Any processes that discharge to the sanitary sewer are subject to the generalpretreatment self-monitoring program specified in the Wastewater Discharge Permitissued by the LWRP, and, as such, are managed by LLNL using these internal dischargeguidelines as applied at the point of discharge into the LLNL sewer.
If pollutant levels exceed internal permissible concentrations, the wastewater is treated toreduce pollutants to the lowest levels practical and below LLNL guidelines, or it isshipped to an off-site treatment or disposal facility. Liquids containing radioactivity arehandled on site and may be treated using processes that reduce the activity to levels wellbelow those required by DOE Order 5400.5 or they are shipped to an off-site treatment ordisposal facility. Internal guidelines for retention tank systems and specific sources andoperations are discussed later in the Pretreatment Discharges section. Process wastewatergeneration and discharge frequency from retention tanks vary from monthly to yearly,depending upon the process. During 1999, there were approximately 31 retention tank

6 Sewerable Water Monitoring
6-4 LLNL Environmental Report for 1999
systems in use at the Livermore site, with an average of 14 wastewater retention tanksdischarged each month, averaging a volume of 8000 liters per tank.
Table 6-1. LLNL’s internal discharge guidelines for pollutants in wastewaters.
Nonradioactive pollutants in wastewaters
Constituent Discharge guidelines
Metals (mg/L)
Arsenic 0.06(a)
Cadmium 0.9
Copper 10
Chromium (total) 4.9
Lead 4.9
Mercury 0.05
Nickel 5
Silver 1
Zinc 15
Cyanide (mg/L)(b) 5
Oil and grease (mg/L) 500
Total toxic organics (TTO) (mg/L)(c) 4.57
pH (pH units) 5–10
Radioisotopes in wastewaters(d)
Parameter Individual discharge Total daily limit for site
Gross alpha 11.1 Bq/L (300 pCi/L) 185 kBq (5.0 µCi)
Gross beta 111 Bq/L (3000 pCi/L) 1.85 MBq (50.0 µCi)
Tritium 185 kBq/L (5.0 µCi/L) 3.7 GBq (100.0 mCi)
a No specific internal discharge limit was developed for this constituent; therefore, the discharge limit in LLNL’swastewater discharge permit is used as a guideline for this parameter.
b Limits apply to cyanide discharges other than cyanide salts. Cyanide salts are classified by the State of California as“extremely hazardous waste” and cannot be discharged to the sewer.
c Total toxic organics is defined by the Livermore Municipal Code as the sum total of all detectable organic compoundsthat are on the Environmental Protection Agency’s current priority pollutant list and that are present in concentrationsof 0.01 mg/L or greater. Analysis of samples using EPA Methods 624 and 625 satisfy this requirement. A listing ofthe specific compounds included may be found in the Data Supplement, Chapter 6.
d There is no gross gamma limit; DOE Order 5400.5 isotope-specific limits apply.

Sewerable Water Monitoring 6
LLNL Environmental Report for 1999 6-5
For the year as a whole, the monitoring data reflect the success of LLNL’s dischargecontrol program in preventing any adverse impact on the operations of Livermore’streatment plant and are generally consistent with past values.
Monitoring
Monitoring at the Sewer Monitoring Station
LLNL’s sanitary sewer discharge permit requires continuous monitoring of theeffluent flow rate and pH. Samplers collect flow-proportional composite samplesand instantaneous grab samples that are analyzed for metals, radioactivity, toxicchemicals, and water-quality parameters. In addition, as a best management practice,the outflow to the municipal collection system is sampled continuously and analyzedin real time for conditions that might upset the LWRP treatment process or otherwiseimpact the public welfare. The effluent is continuously analyzed for pH, regulatedmetals, and radioactivity. If concentrations above warning levels are detected, analarm is registered at the LLNL Fire Dispatcher’s Station, which is attended 24 hoursa day, and the site effluent is diverted to the Sewer Diversion Facility (SDF). Themonitoring system provides a continuous check on sewage control, and the LWRP isnotified of contaminant alarms. Trained staff respond to all alarms to evaluate thecause and take appropriate action.
Monitoring at the Upstream pH Monitoring Station
In addition to the continuous monitoring at the Sewer Monitoring Station (SMS),LLNL monitors pH at the upstream pH Monitoring Station (pHMS) (see Figure 6-1for a system diagram). The pHMS continuously monitors pH between 7 a.m. and7 p.m. during the work week and diverts pH discharges outside the permitted 5 to 10range to the SDF. The pHMS duplicates the pH monitoring and diversion capabilitiesof the SMS, but because it is located upstream of the SDF it is able to initiate diversionearlier. Earlier detection allows LLNL to divert all of the unpermitted site effluent.
Diversion System
LLNL operates and maintains a diversion system that activates automatically wheneither the SMS continuous monitoring system or the pHMS sounds an alarm. For SMSactivated alarms, the SDF ensures that all but the first few minutes of the potentially

6 Sewerable Water Monitoring
6-6 LLNL Environmental Report for 1999
affected wastewater flow is retained at LLNL, thereby protecting the LWRP and mini-mizing any required cleanup. During pH excursions activated by the pHMS, even thefirst few minutes of affected wastewater flow is retained. Up to 775,000 L of potentiallycontaminated sewage can be held pending analysis to determine the appropriatehandling method. The diverted effluent may be returned to the sanitary sewer (if itmeets LLNL’s wastewater discharge permit limits), shipped for off-site disposal, ortreated at LLNL’s Hazardous Waste Management (HWM) Facility. All diverted sew-age in 1999 was returned to the sanitary sewer.
Pretreatment Discharges
The general pretreatment regulations establish both general and specific standards forthe discharge of prohibited substances (40 CFR 403.5) that apply to all industrial users.These regulations apply even if LLNL is subject to other federal, state, or local pretreat-ment standards. The pretreatment standards contain prohibitions intended to protectthe LWRP and its operations from interference with its treatment processes or pass-through that would cause the LWRP to violate its own effluent limitations. The LWRP,under the authorization of the San Francisco Bay Regional Water Quality ControlBoard, requires self-monitored pretreatment programs at both the Livermore site andSite 300. The sampling and monitoring of nondomestic, industrial sources covered bypretreatment standards defined in 40 CFR 403 is required in the 1999-2000 WastewaterDischarge Permit No. 1250 issued for the discharge of wastewater from LLNL into theCity of Livermore sewer system. Permit 1250 lists all the self-monitoring parametersthat are applied at the SMS before wastewater enters the municipal collection system atLLNL’s effluent outfall (see Figure 6-1). Parameters with numerical limits are listed inTable 6-2. The additional discharge limits shown in Table 6-2 are discussed below inthe Categorical Discharges and Discharges of Treated Ground Water sections. Otherrequired parameters such as flow rate, biological oxygen demand, total dissolvedsolids, total suspended solids, and tributyltin are also monitored at the SMS but haveno specific numerical limits. In 1999, no exceedances of the pollutant limitations in thedischarge permit were observed.

Sewerable Water Monitoring 6
LLNL Environmental Report for 1999 6-7
Table 6-2. Permit discharge limits for nonradioactive pollutants in LLNL wastewaters.
Permit discharge limits
Permit 1250 Permit 1510G
ParameterOutfall(a) Metal
finishing(b)Electric
component(b)Treated ground
water
Metals (mg/L)
Arsenic 0.06 —(c) 0.83 0.06
Cadmium 0.14 0.07 —(c) 0.14
Chromium (total) 0.62 1.71 —(c) 0.62
Copper 1.0 2.07 —(c) 1.00
Lead 0.20 0.43 —(c) 0.20
Mercury 0.01 —(c) —(c) 0.01
Nickel 0.61 2.38 —(c) 0.61
Silver 0.20 0.24 —(c) 0.20
Zinc 3.0 1.48 —(c) 3.00
Organics (mg/L)
TTO(d) 1.00 2.13 1.37 1.00
Other (mg/L)
Cyanide(e) 0.04 0.65 —(c) 0.04(f)
Oil and grease 100 —(c) —(c) 100
pH (pH units) 5–10 —(c) —(c) 5–10
a These standards apply at the SMS (the point of discharge to the municipal sewer). All other standards in this tableapply at the point of discharge into LLNL’s sanitary sewer system.
b These categorical standards were specified by EPA. By regulation, the EPA or City of Livermore limit is used,whichever is lower. The internal limits in Table 6-1 are applied by LLNL where no other standard is specified.
c There is no specific categorical limit for this parameter; therefore, the Table 6-1 internal discharge limits apply.
d Total toxic organics is defined by the Livermore Municipal Code as the sum total of all detectable organic compoundsthat are on the Environmental Protection Agency’s current priority pollutant list and that are present in concentrationsof 0.01 mg/L or greater. EPA Methods 624 and 625 analysis satisfies this requirement. A listing of the specificcompounds included may be found in the Data Supplement, Chapter 6..
e Limits apply to cyanide discharges other than cyanide salts. Cyanide salts are classified by the State of California as“extremely hazardous waste” and cannot be discharged to the sewer.
f Although Permit 1510G lists a discharge limit for cyanide, sample collection is not required by the self-monitoringprogram.
Categorical Discharges
The Environmental Protection Agency (EPA) publishes categorical standards as regula-tions separate from the general pretreatment regulations and developed for broad cate-gories of specific industrial processes determined to be the most significant contributors

6 Sewerable Water Monitoring
6-8 LLNL Environmental Report for 1999
to point source water pollution. These standards contain specific numerical limits forthe discharge of industry-specific pollutants from individual processes. The number ofprocesses at LLNL using these pollutants is subject to rapid and frequent change asprogrammatic requirements dictate. During 1999, the LWRP identified 17 specific LLNLwastewater generating processes that fall under the definition of two categoricalstandards: Electrical and Electronic Components (40 CFR 469), and Metal Finishing(40 CFR 433). The discharge limits for these standards are shown in Table 6-2. Underthe terms in Permit 1250, only those processes that discharge to the sanitary sewerrequire sampling, inspection, and reporting. Three of the 17 identified processes meetthese criteria. In 1999, LLNL analyzed samples for all regulated parameters from thesethree processes and the results showed that LLNL complied with all federal categoricaldischarge limits.
The first of the three categorical processes that discharge directly into the sanitary sewersystem is an abrasive jet machine (or water-jet) that is regulated under the Metal-Finishing Point Source Category; the filtered water from this process is discharged to thesanitary sewer. The other two discharging categorical processes are both regulated underthe Federal Electrical and Electronic Component Point Source Category. One is a seriesof processes clustered within a single building housing research-scale microfabricationlaboratories used for developing prototype semiconductor devices. These laboratoriesdischarge into a building wastewater retention system, and because they are housedwithin the same building, with no diluting flow, they share a single point of compliance.The second categorical process is a small gallium arsenide cutting operation; this processdischarges directly to the sanitary sewer.
The nondischarging processes, all regulated under the Metal-Finishing Point SourceCategory (40 CFR 433), were printed circuit board manufacturing, electrolysis plating,chemical etching, electroplating, anodizing, coating, painting, cleaning, electricaldischarge machining, irridite processing, and abrasive jet machining (water-jet). Thewastewater from these processes was contained for removal and appropriate disposalby LLNL’s Hazardous Waste Management Division (HWM).
Discharges of Treated Ground Water
LLNL’s ground water discharge permit (1510G, 1999) allows treated ground water fromsite-wide Comprehensive Environmental Response, Compensation and Liability Act(CERCLA) of 1980 cleanup activities to be discharged in the City of Livermore sanitary

Sewerable Water Monitoring 6
LLNL Environmental Report for 1999 6-9
sewer in compliance with Table 6-2 effluent limitations taken from the LivermoreMunicipal Code.
During 1999, the volume of ground water discharged to the sanitary sewer was approxi-mately 386,000 liters. Water discharges during this period were related to start-upoperations associated with new portable treatment units being built and installedthroughout the site, testing of an experimental nitrate removal treatment system, andmaintenance of existing ground water treatment facilities. Twelve separate dischargeswere sampled and discharged to the sewer during this period, all in compliance withself-monitoring permit provisions of Permit 1510G. Concentrations of regulatedcompounds were all below discharge limits. Monitoring data are presented in the DataSupplement, Chapter 6.
Radioactive Pollutants in SewageMonitoring Results
LLNL determines the total radioactivity released from tritium, alpha emitters, and betaemitters based either on the measured radioactivity in the effluent or on the limit ofsensitivity, whichever is higher (see Table 6-3). The 1999 combined releases of alpha andbeta sources was 0.32 GBq (0.0086 Ci). The combined total is based on the results shownin Table 6-3. The tritium total was 7.1 GBq (0.19 Ci), and the annual mean concentrationof tritium in LLNL sanitary sewer effluent was 0.019 Bq/mL (0.51 pCi/mL).
Table 6-3. Estimated total radioactivity in LLNL sanitary sewer effluent, 1999.
Radioactiveemitter
Estimate based on effluentactivity (GBq)(a)
Limit of sensitivity(GBq)
Tritium 7.1 4.2
Alpha sources 0.043 0.034
Beta sources 0.28 0.046
a 37 Gbq = 3.7 × 10¹⁰ Bq = 1 Ci.
Summary results for tritium measured in the sanitary sewer effluent from LLNL andLWRP are presented in Table 6-4. The monthly tritium numbers are based on the flow-weighted average of the individual daily sample results for a given month. The totalannual result is based on the multiplication of each daily sample result or the limit ofsensitivity, whichever is greater, by the total flow volume over which the sample was

6 Sewerable Water Monitoring
6-10 LLNL Environmental Report for 1999
collected, and summing up over all samples. (All other total annual results presentedin this chapter for radioactive emitters are also calculated conservatively; the limit ofsensitivity or minimum detectable concentration is used to determine the total annualactivity when the limit of sensitivity is greater than the sample result.) Also included inthe table are fractions of LWRP, Department of Energy (DOE) and 10 CFR 20 limits,discussed in the Environmental Impact section that follows.
Table 6-4. Tritium in sanitary sewer effluents (Bq/mL), LLNL and LWRP, 1999.
Monitoring results
LLNL LWRP
Daily Monthly average Weekly
Maximum 0.929 ± 0.018(a) 0.045(b) 0.017 ± 0.007(c)
Median 0.003 0.006 0.001
IQR(d) 0.008 0.013 0.006
LLNL annual total (GBq) 7.1
Discharge limits
Discharge Fraction of discharge limit
limit LLNL maximum LLNL median
LWRP permit daily 12 0.075 2.5 × 10⁻⁴
DOE annualized discharge limit for application ofBAT(e) (Bq/mL)
370 1.2 × 10⁻⁴(f) 1.7 × 10⁻⁵(f)
10 CFR 20 annual total (GBq) 185 0.038
a The daily result is for an October sample; the detection limit for the analysis was 0.011 Bq/mL. See the Data Supplement, Chapter 6, forall daily results.
b This is the monthly average for October. All monthly averages are plotted in Figure 6-2.
c This is a weekly result for a January sample. This result was the only weekly value above a detection limit; detection limits ranged from0.005 to 0.013 Bq/mL. See the Data Supplement, Chapter 6, for all weekly results.
d IQR = Interquartile range.
e The DOE annualized discharge limit for application of best available technology (BAT) is five times the Derived Concentration Guide (DCG;ingested water) for each radionuclide released.
f Monitoring results as a fraction of limit are calculated using LLNL monthly average results and the DOE annualized discharge limit.
The historical trend in the monthly average concentration of tritium is shown inFigure 6-2. Also included in the figure is the DOE tritium limit (370 Bq/mL), discussedin the Environmental Impact section of this chapter. The trend indicates a well-controlled tritium discharge, orders of magnitude below the DOE tritium limit.

Sewerable Water Monitoring 6
LLNL Environmental Report for 1999 6-11
10—4
10—3
10—2
10—1
102
103
10
1
10—2
10—1
102
103
104
10
1
2.7 × 10—3
2.7 × 10⁴
1981 1984 1987 1990 1993 1996 1999Year
Co
nce
ntr
atio
n (
Bq
/mL
)
Monthly average tritium values
DOE tritium limit
Co
nce
ntr
atio
n (
pC
i/mL
)
Figure 6-2. Historical trend in tritium concentration in LLNL sewage.
The concentrations of 239Pu and 137Cs measured in the sanitary sewer effluent fromLLNL and LWRP are presented in Table 6-5. The plutonium and cesium numbers arethe direct results for analyses of monthly composite samples of LLNL and LWRPeffluent, and quarterly composites of LWRP sludge. At the bottom of the table, the totalannual activity released is given by radioisotope. Also included in the table are fractionsof DOE limits, discussed in the Environmental Impact section.
Figure 6-3 shows the average monthly plutonium and cesium concentrations in sewagesince 1990. For 1999, the annual mean concentration of 137Cs was 3.2 × 10⁻⁶ Bq/mL(8.6 × 10−5 pCi/mL); the annual mean concentration of 239Pu was 1.8 × 10⁻⁷ Bq/mL(4.9 × 10−6 pCi/mL).

6 Sewerable Water Monitoring
6-12 LLNL Environmental Report for 1999
Table 6-5. Cesium and plutonium in sanitary sewer effluents, LLNL and LWRP, 1999.137Cs (µBq/mL) 239Pu (nBq/mL) 239Pu (mBq/dry g)
Month LLNL LWRP LLNL LWRP LWRP sludge(a)
Radioactivity MDC(b) Radioactivity(c) MDC(b) Radioactivity MDC Radioactivity MDC Radioactivity MDC
Jan 1.2 ± 0.6 0.4 <0.42 0.42 54.8 ± 19.4 10.1 6.5 ± 10.9 17.1
Feb 0.73 ± 1.00 0.58 <0.40 0.40 155 ± 39 13 –4.9 ± 14.4 25.8
Mar 0.81 ± 0.74 0.48 <0.36 0.36 76.6 ± 34.0 25.2 5.1 ± 19.1 44.4 0.12 ± 0.02 0.00
Apr 1.0 ± 0.9 0.5 <0.37 0.37 160 ± 83 64 17.9 ± 20.5 25.2
May 0.42 ± 5.96 5.33 –1.7 ± 8.3 7.2 67.3 ± 28.9 10.1 9.0 ± 38.1 75.9
Jun 1.2 ± 6.6 6.0 —(d) —(d) 108 ± 38 16 —(d) —(d) 0.094 ± 0.031 0.014
Jul 3.4 ± 3.2 3.1 2.6 ± 2.7 2.5 124 ± 41 24 –1.8 ± 12.6 27.4
Aug 1.1 ± 7.0 6.2 –2.6 ± 3.7 2.9 71.0 ± 25.3 13.3 –0.71 ± 1.41 8.55
Sep 2.5 ± 3.3 2.1 0.68 ± 3.89 3.46 844 ± 76 9 10.3 ± 19.2 31.4 0.18 ± 0.05 0.01
Oct –0.92 ± 5.03 4.29 –0.78 ± 3.12 2.64 264 ± 36 7 1.35 ± 2.20 6.66
Nov 2.0 ± 3.0 2.8 –0.07 ± 3.44 2.99 128 ± 28 7 0.10 ± 3.40 7.33
Dec 3.2 ± 3.6 3.4 –1.2 ± 4.0 3.4 58.5 ± 19.9 9.3 6.1 ± 15.1 22.6 0.38 ± 0.04 0.01
Median 1.1 0.4 116 5.1 0.15
IQR(e) 1.4 1.4 86 8.0 0.12
pCi/mL(f) pCi/dry g(f)
Median 3.0 × 10⁻⁵ 9.7 × 10⁻⁶ 3.1 × 10⁻⁶ 1.4 × 10⁻⁷ 0.0040
IQR(e) 3.7 × 10⁻⁵ 3.8 × 10⁻⁵ 2.3 × 10⁻⁶ 2.2 × 10⁻⁷ 0.0033
Annual total discharges by radioisotope137Cs 239Pu Total(g)
Bq/y 1.2 × 10⁶ 6.8 × 10⁴ 1.3 × 10⁶
Ci/y 3.3 × 10⁻⁵ 1.8 × 10⁻⁶ 3.5 × 10⁻⁵
Fraction of limit(h)
DOE annualized discharge limit forapplication of BAT(i)
5.7 × 10⁻⁶ 4.8 × 10⁻⁷ 3.6 × 10⁻⁶
Note: Radioactivities are reported as the measured concentration and either an uncertainty (±2σ counting error) or as being less than orequal to the detection limit or minimum detectable concentration (MDC). If the concentration is less than or equal to the uncertainty orthe detection limit, the result is considered to be a nondetection. See Main Volume, Chapter 14, Quality Assurance.
a Sludge from LWRP digesters is dried before analysis. The resulting data indicate the plutonium concentration of the sludge prepared byLWRP workers for disposal at the Vasco Road Landfill in Alameda County.
b For May through December data, decreased sample count times, lower efficiency detectors and new computer software contributed togreater MDCs than those shown for January through April. Other factors also contributed to the high MDCs shown for LLNL May and Juneand LWRP May analyses (smaller sample volumes), LLNL August analysis (low chemical recovery), and LLNL October analysis (shortersample count time than the norm of May through December data).
c The analytical laboratory provided measured concentrations and uncertainties for only the last eight months of 1999.d No data available because of analytical laboratory error in the analysis of the sample.e IQR = Interquartile range.f 1 Ci = 3.7 × 10¹⁰ Bq.g Does not include gross alpha and beta results shown in Table 6-3 or the tritium results shown in Tables 6-4 and 6-6.h Fraction of limit calculations are based on the annual total discharge for a given isotope and the corresponding concentration-based limit
(0.56 and 0.37 Bq/mL for 137Cs and 239Pu, respectively) multiplied by the annual volume of Livermore site effluent.I The DOE annualized discharge limit for application of best available technology (BAT) is five times the Derived Concentration Guide (DCG;
ingested water) for each radionuclide released.

Sewerable Water Monitoring 6
LLNL Environmental Report for 1999 6-13
10—9 2.7 × 10—810—7
10—6
10—5
10—4
10—3
10—2
10—1
1
102
10
2.7 × 10²
10—8
10—7
10—6
10—5
10—4
10—3
10—2
10—1
1
10
20001998 19991990 1991 1992 1993 1994 1995 1996 1997Year
Co
nce
ntr
atio
n (
pC
i/mL
)
Co
nce
ntr
atio
n (
Bq
/mL
)
LLNL Cs LLNL Pu
DOE Cs limit
DOE Pu limit
Figure 6-3. Historical trends in average monthly plutonium and cesium concentrationsin LLNL sewage.
Environmental Impact
During 1999, no inadvertent discharges exceeded any discharge limits for release ofradioactive materials to the sanitary sewer system.
In August 1999, the Work Smart Standards (WSSs) developed for LLNL became effec-tive, as discussed in Chapter 3. As part of the WSS process, standards were selected forsanitary sewer discharges. For radioactive material releases, complementary (ratherthan redundant) sections from DOE Order 5400.5, Radiation Protection of the Public andEnvironment, and Title 10 of the Code of Federal Regulations, Part 20, were chosen asstandards.
Prior to August 1999, DOE Order 5400.5 established DOE policy requiring that radio-logical releases to the sanitary sewer comply with legally applicable local and stateregulations and that LLNL implement standards generally consistent with those of theNuclear Regulatory Commission. The most stringent of these limits was adopted inTitle 17 of the California Code of Regulations. As a federal facility, LLNL is formally

6 Sewerable Water Monitoring
6-14 LLNL Environmental Report for 1999
exempt from the requirements of state regulations but followed those requirementsunder the guidance of DOE. In 1994, the discharge requirements previously foundin Title 17 were removed, and the requirements in Title 10 of the Code of FederalRegulations, Part 20, were incorporated by reference.
As selected from DOE Order 5400.5, the WSS for sanitary sewer discharges includes thecriteria DOE established for the application of best available technology to protect publichealth and minimize degradation of the environment. These criteria (the Derived Con-centration Guides, or DCGs) limit the concentration of each radionuclide discharged topublicly owned treatment works. If a measurement of the monthly average concentra-tion of a radioisotope exceeded its specific concentration limit, LLNL would be requiredto improve discharge control measures until concentrations were again below the DOElimits. Tables 6-4 and 6-5 include the DCGs for the specific radioisotopes of mostinterest at LLNL.
The median monthly average concentration of tritium in LLNL sanitary sewer effluentwas 1.7 × 10⁻⁵, that is, 0.0017% of the DOE DCG, and the maximum monthly averageconcentration of tritium was 1.2 × 10⁻⁴, 0.012% of the DCG (see Table 6-4). The annualaverage concentration of 137Cs was 5.7 × 10⁻⁶ (0.00057%) of the DOE DCG; and theannual average 239Pu concentration was 4.8 × 10⁻⁷ (0.000048%) of the 239Pu DOE DCG.These results are shown at the end of Table 6-5.
From 10 CFR 20, the numerical discharge limits for sanitary sewer discharges in theWSSs include the annual discharge limits for radioactivity: 185 GBq (5 Ci) of tritium,37 GBq (1 Ci) of 14C , and 37 GBq (1 Ci) of all other radionuclides combined.
The 10 CFR 20 limit on total tritium activity (185 GBq) dischargeable during a singleyear overrides the DOE Order 5400.5 concentration-based limit for tritium for facilitiessuch as LLNL that generate wastewater in large volumes. In 1999, the total LLNLtritium release was 3.8% of this Title 10 limit. Total LLNL releases (see Table 6-3), in theform of alpha and beta emitters (excluding tritium), were 0.86% of the correspondingTitle 10 limit.
In addition to the DOE concentration discharge limit for tritium and the 10 CFR 20annual total discharge limit for tritium, the LWRP established in the 1999-2000Wastewater Discharge Permit an effluent concentration discharge limit for LLNL dailyreleases of tritium. This new limit is more stringent than the DOE discharge limit: it is afactor of 30 smaller and it applies to daily rather than an annualized concentration. Themaximum daily concentration for tritium in 1999 was 7.5% of the permit discharge limit.Table 6-4 shows this result and the daily effluent discharge limit for tritium. The LWRP

Sewerable Water Monitoring 6
LLNL Environmental Report for 1999 6-15
established the limit to preserve opportunities for an expanded recycling program forthe plant’s treated wastewater.
LLNL also compares annual discharges with historical values to evaluate the effective-ness of ongoing discharge control programs. Table 6-6 summarizes the radioactivity inliquid effluent released over the past 10 years. During 1999, a total of 7.1 GBq (0.19 Ci),of tritium was discharged to the sanitary sewer, an amount that is well within environ-mental protection standards and is comparable to the amounts reported for the previousseven years. Moreover, the total tritium released by LLNL in 1999 continues the 1992 to1998 trend of significantly smaller releases than those in the years prior to 1992.
Table 6-6. Radioactive liquid effluent releases from the Livermore site, 1990–1999.
Liquid effluent (GBq)
Year 3H 239Pu
1990 25 2.3 × 10⁻⁴
1991 32 6.1 × 10⁻⁴
1992 8 1.9 × 10⁻³
1993 13 2.6 × 10⁻⁴
1994 6.9 1.9 × 10⁻⁴
1995 6.0 1.2 × 10⁻⁴
1996 12(a) 4.2 × 10⁻⁴
1997 9.1 2.1 × 10⁻⁴
1998 10 7.7 × 10⁻⁵
1999 7.1 6.8 × 10⁻⁵
a In 1995, Sandia National Laboratories/California ceased all tritium facility operations. Therefore, the annualtritium totals beginning with the 1996 value do not include contributions from Sandia/California.
Figure 6-3 summarizes the 239Pu monitoring data over the past 10 years. The historicallevels observed since 1990 average 1 µBq/mL (3 × 10⁻⁵ pCi/mL). These historical levelsgenerally are three-millionths (0.000003) of the DOE DCG for the 239Pu. The greatest partof the plutonium discharged in LLNL effluent is ultimately concentrated in LWRPsludge, which is dried and disposed of at a landfill. The median plutonium concentrationobserved in 1999 sludge (Table 6-5), 0.15 mBq/dry g is 620 times lower than the EPApreliminary remediation goal for residential soil (93 mBq/dry g) and is nearly 2500-timeslower than the remediation goal for industrial or commercial soil (370 mBq/dry g).

6 Sewerable Water Monitoring
6-16 LLNL Environmental Report for 1999
As first discussed in the Environmental Report 1991 (Gallegos et al. 1992), plutonium andcesium concentrations were slightly elevated during 1991 and 1992 over the lowestvalues seen historically. As was established in 1991, the overall upward trend wasrelated to sewer cleaning with new, more-effective equipment. The concentrations in1996 and the first quarter of 1997 were also slightly higher than the lowest values seenhistorically, although slightly lower than those of 1990 through 1992. In fact, the cyclicnature of the data points in Figure 6-3 suggests that built-up radionuclides in sewerlines are liberated by line cleaning. The higher plutonium and cesium concentrationsare all well below applicable DOE DCGs. In general, the plutonium and cesium con-centrations for 1999 are comparable to the lowest values seen historically, and are wellbelow the applicable DOE DCGs. (Note that the open triangle in the figure indicatesthat the data point was negative; because negative data points cannot be plotted directlyagainst a log scale, its absolute value has been plotted. Also, MDC values for cesiumincreased in May 1999, so most of the results plotted for the last two-thirds of the yearare below their respective MDCs.)
Nonradioactive Pollutants in SewageMonitoring Results
Table 6-7 presents monthly average concentrations for all regulated metals in LLNL’ssanitary sewer effluent for 1999. The averages were obtained by a flow-proportionalweighting of the analytical results for the weekly composite samples collected eachmonth. Each result was weighted by the total flow volume for the period during whichthe sample was collected. The results are generally typical of the values seen duringprevious years, 1994–1998. Figure 6-4 presents historical trends for the average monthlyresults from 1994 through 1999 for eight of the nine regulated metals; cadmium is notpresented because this metal is typically not detected. Trends for chromium, mercury,nickel, and zinc show that average monthly concentrations are slightly elevated overallfor mid-1996 through 1999, as compared with the previous two and a half years. Theother four metals have no discernible trends in their concentrations, although copperconcentrations are noticeably elevated in the latter part of 1999. During the period ofJanuary through early September, weekly composite sample were also analyzed forthree non/regulated metals (aluminum, beryllium, and iron). Refer to the DataSupplement, Chapter 6, for the analytical results, which were typical of values inprevious years.

Sewerable Water Monitoring 6
LLNL Environmental Report for 1999 6-17
Table 6-7. Average monthly results for regulated metals in LLNL sanitary sewer effluent (mg/L), 1999.
Month Ag As Cd Cr Cu Hg Ni Pb Zn
Jan <0.010 0.0036 <0.0050 0.013 0.095 0.00053 0.012 0.011 0.19
Feb <0.010 <0.0020 <0.0050 <0.010 0.062 0.00035 0.0091 0.010 0.20
Mar 0.012 0.0037 <0.0050 0.024 0.16 0.0017 0.014 0.025 0.35
Apr 0.012 0.0026 <0.0050 0.037 0.18 0.00078 0.011 0.021 0.45
May <0.010 0.0023 <0.0050 0.012 0.085 0.00039 0.0062 0.0074 0.17
Jun 0.011 0.0031 <0.0050 0.022 0.16 0.00053 0.0082 0.019 0.32
Jul <0.010 0.0028 0.0051 0.014 0.11 0.00019 0.0057 0.011 0.21
Aug <0.010 0.0027 <0.0050 0.020 0.19 0.00026 0.0061 0.022 0.19
Sep 0.011 0.0036 <0.0050 0.053 0.28 0.00081 0.010 0.033 0.42
Oct <0.010 0.0042 <0.0050 0.045 0.25 0.00061 0.011 0.028 0.55
Nov 0.013 0.0034 <0.0050 0.036 0.26 0.00094 0.0082 0.022 0.46
Dec <0.010 0.0038 <0.0050 0.037 0.16 0.00034 0.0066 0.025 0.48
Median <0.010 0.0033 <0.0050 0.023 0.16 0.00053 0.0087 0.022 0.34
IQR(a) 0.001 0.0009 —(b) 0.023 0.099 0.00044 0.0045 0.014 0.26
EPL(c) 0.2 0.06 0.14 0.62 1 0.01 0.61 0.2 3.0
Median fractionof EPL
<0.05 0.054 <0.036 0.037 0.16 0.053 0.014 0.11 0.11
Note: Monthly values are presented with less-than signs when all weekly composite sample results for the month are below the detectableconcentration
a IQR = Interquartile range.b Because of the large number of nondetects, the interquartile range cannot be calculated for these metals. See Chapter 14, Quality
Assurance.c EPL = Effluent pollutant limit (LLNL Wastewater Discharge Permit 1997–1998 and 1998–1999).
Weekly and 24-hour composite sample concentrations for eight of nine regulated metalsin LLNL sewage are each presented as a percentage of the corresponding effluent pol-lutant limit (EPL) in Figure 6-5; cadmium is not present because it was detected in lessthan five percent of the samples, with a maximum detected value of no more than 7.1%of the discharge limit. The EPL is equal to the maximum pollutant concentration allowedper 24-hour composite sample, as specified by the LLNL wastewater discharge permit.When a weekly sample concentration is at or above 50% of its EPL, the correspondingdaily (24-hour composite) samples collected in the SMS must be analyzed to determineif any of their concentrations are above the EPL. As discussed in the following Environ-mental Impact section, in 1999, only one weekly composite sample concentration met this50% action level, and no 24-hour composite sample concentrations were greater than theEPL.

6 Sewerable Water Monitoring
6-18 LLNL Environmental Report for 1999
00.005
0.015
0.025
0.035
0
0.002
0.006
0.01
Co
nce
ntr
atio
n (
mg
/L)
Co
nce
ntr
atio
n (
mg
/L)
0
0.02
0.04
0.06
0.05
0.25
0
0.001
0.002
0.003
0
0.01
0.02
0.03
0
0.01
0.02
0.03
0.04
0.05
1994 1995 1996 1997 1998 1999Year
0
0.2
0.4
0.6
0.8
1994 1995 1996 1997 1998 1999Year
Silver
Chromium
Mercury
Lead
Arsenic
Copper
Nickel
Zinc
0.15
Figure 6-4. Average monthly concentrations for eight of the nine regulated metals in LLNLsanitary sewer effluent showing trends from 1994 to 1999.

Sewerable Water Monitoring 6
LLNL Environmental Report for 1999 6-19
Per
cen
tag
e o
f E
PL
Per
cen
tag
e o
f E
PL
J F M A M J J A S O N D J F M A M J J A S O N D
Chromium
Silver
40
50
20
30
10
0
Nickel
Monthly samples Weekly samples
40
50
20
30
0
10
40
50
20
30
0
10
40
50
20
30
0
10
Arsenic
80
100
40
60
20
0
Zinc
80
100
40
60
20
0
Copper
80
100
40
60
20
0
Lead
80
100
40
60
20
0
Mercury
Figure 6-5. Results as percentages of effluent pollutant limits (EPLs) for eight of thenine regulated metals in LLNL sewage, 1999.

6 Sewerable Water Monitoring
6-20 LLNL Environmental Report for 1999
Detections of anions, metals, and organic compounds and summary data concerningother physical and chemical characteristics of the sanitary sewer effluent are providedin Table 6-8. (All of the corresponding analytical results are provided in the DataSupplement Table 6-7.) Although samples were analyzed for bromide, nitrite (as N),carbonate alkalinity (as CaCO3), hydroxide alkalinity (as CaCO3), selenium, andcyanide, those analytes were not detected in any sample acquired during 1999, and soare not presented in the table. The results are quite typical of those seen in previousyears except the sampling frequency for two regulated parameters was decreased.LLNL decreased the sampling frequency for oil and grease, and cyanide in response tochanges in sampling requirements made by the LWRP, as discussed in detail in the DataSupplement Chapter 6.
Environmental Impact
Table 6-7 presents monthly average and summary statistics for all regulated metalsconcentrations in LLNL’s sanitary sewer effluent. At the bottom of the table, theannual median concentration for each metal is compared with the discharge limit. In1999, the metals that approached closest to the discharge limits were copper, lead, andzinc at 16%, 11%, and 11%, respectively.
Although average monthly concentrations for chromium, mercury, nickel, and zinchave generally been slightly elevated for the last several years (see Figure 6-4), all ofthe individual weekly and 24-hour composite results for 1999 were less than 50% ofthe corresponding discharge limits. In fact, only one metal result met the 50% actionlevel in LLNL’s Wastewater Discharge Permit. In November 1999, a weekly compositesample had a copper concentration of 0.50 mg/L, or 50% of the discharge limit of1.0 mg/L (see Figure 6-5). The daily samples that correspond to the appropriateweekly composite sampling period of November 11–17 were submitted for copperanalysis. All of the analytical results for the daily samples were less than the effluentpollutant limit; no sample had a measured copper concentration greater than0.09 mg/L.
In 1999, the SMS continuous monitoring system detected four discharges outside of thepermitted pH range of 5 to 10. Two of the discharges were below pH 5 and two wereabove pH 10: all four discharges were captured in the SDF. For comparison, 2, 13,and 1 such diversions occurred in 1998, 1997, and 1996, respectively.

Sewerable Water Monitoring 6
LLNL Environmental Report for 1999 6-21
Table 6-8. Monthly monitoring results for physical and chemical characteristics of theLLNL sanitary sewer effluent, 1999.(a)
24-hour composite sample parameter(mg/L)
Detectionfrequency(b) Minimum Maximum Median IQR(c)
Alkalinity
Bicarbonate alkalinity (as CaCO3) 11/11 130 221 185 24
Total alkalinity (as CaCO3) 11/11 130 221 185 23
Anions
Bromide 2/12 <0.10 0.62 <0.11 —(d)
Chloride 10/12 22 63 44 12
Fluoride 10/12 <0.050 0.68 0.088 0.065
Nitrate (as NO3) 2/12 <0.40 1.6 <0.40 —(d)
Orthophosphate 12/12 12 198 18 5.3
Sulfate 12/12 4.0 44 9.7 8.7
Nutrients
Ammonia nitrogen (as N) 12/12 28 53 40 9.3
Total Kjeldahl nitrogen 12/12 0.61 60 46 15
Oxygen demand
Biochemical oxygen demand 11/12 <75 305 140 112
Chemical oxygen demand 12/12 130 664 302 293
Solids
Solid settling rate (mL/L/h) 12/12 19 62 27 14
Total dissolved solids 12/12 120 510 233 92
Total suspended solids 12/12 84 398 123 235
Volatile solids 12/12 55 380 255 150
Total metals
Aluminum(e) 11/12 <0.20 1.2 0.49 0.29
Beryllium(e) 0/12 <0.00020 <0.0010 <0.00050 —(d)
Calcium 12/12 11 19 14 2.8
Iron(e) 12/12 0.55 3.2 1.7 0.94
Magnesium 12/12 1.9 4.6 2.8 0.68
Potassium 12/12 13 99 18 4.3
Sodium 12/12 21 64 36 11
Total organic carbon 12/12 31 94 47 18
Tributyltin (ng/L) 2/2 7.0 33 20 13

6 Sewerable Water Monitoring
6-22 LLNL Environmental Report for 1999
Table 6-8. Monthly monitoring results for physical and chemical characteristics of theLLNL sanitary sewer effluent, 1999 (concluded).(a)
Grab sampleparameter
Detectionfrequency(b) Minimum Maximum Median IQR(c)
Semivolatile organic compounds (µg/L)
Benzoic acid 3/12 <10 <300 <44 —(d)
Benzyl alcohol 5/12 <2.0 <100 <10 —(d)
Bis(2-ethylhexyl)phthalate(f) 6/12 <5.0 <200 <17 —(d)
Butyl benzyl phthalate(f) 1/12 <2.0 55 <5.0 —(d)
Diethylphthalate 6/12 4.9 <50 <10 —(d)
m- and p- Cresol 1/3 <5.0 <50 <19 —(d)
p- Cresol 3/9 <2.0 <50 <16 —(d)
Total cyanide (mg/L) 0/7 <0.02 <0.02 <0.02 —(d)
Oil and grease (mg/L) 4/4 14 23 20 3
Total recoverable phenolics (mg/L) 3/3 0.024 0.069 0.038 —(d)
Volatile organic compounds (µg/L)
1,4-Dichlorobenzene 10/12 <0.50 3.6 1.5 0.73
Acetone 12/12 54 360 120 70
Benzene(f) 1/12 <0.50 <2.0 <0.50 —(d)
Chloroform(f) 12/12 8.5 23 14 5.8
Dichlorodifluoromethane 1/12 <0.50 <4.0 <0.50 —(d)
Methylene chloride(f) 2/12 <1.0 <2.0 <1.0 —(d)
Toluene(f) 7/12 <0.50 <2.0 0.71 0.67
a The 24-hour composite sample results plotted in Figure 6-5 and nondetected values reported in the Data Supplement,Chapter 6, are not reported in this table.
b The number of times an analyte was positively identified, followed by the number of samples that were analyzed(generally 12, one sample for each month of the year).
c IQR = Interquartile range.
d When the detection frequency is less than or equal to 50%, there is no range, or there are less than four results for asample parameter, the interquartile range is omitted.
e Weekly sampling results for these parameters are included Data Supplement Table 6-5.
f Indicates priority toxic pollutant parameter used in assessing compliance with the total toxic organic permit limit of1 mg/L (1000 µg/L) issued by the Livermore Water Reclamation Plant.
Monitoring results for 1999 reflect an outstanding year for LLNL’s sewerable waterdischarge control program and Livermore site personnel. LLNL achieved 100%compliance with the provisions of its wastewater discharge permit.
7
LLNL Environmental Report for 1999 7-1
Surface Water
Sandra MathewsErich R. Brandstetter
Karen J. FolksTed A. Giesing
Shari L. BrigdonOverview
Lawrence Livermore National Laboratory monitors surface water at the Livermore site,in surrounding regions of the Livermore Valley, and at Site 300 and vicinity in thenearby Altamont Hills. At the Livermore site and vicinity, LLNL monitors reservoirsand ponds, the Livermore site swimming pool, the Drainage Retention Basin (DRB),rainfall, tap water, and storm water runoff. At Site 300 and vicinity, surface watermonitoring encompasses rainfall, cooling tower discharges, and storm water runoff.
The water samples are analyzed for radionuclides, high explosives, total organic carbon,total organic halides, total suspended solids, conductivity, pH, chemical oxygendemand, total dissolved solids, oil and grease, metals, minerals, anions, and a widerange of organic compounds. In addition, bioassays are performed annually on waterentering and leaving the Livermore site via the Arroyo Las Positas pathway, dischargesfrom the DRB, and water contained in the DRB.
Storm Water
This section discusses general storm water information (including permits, constituentcriteria, inspections, and sampling), sampling methods, and results.
General Information
Permits
The goals of the storm water (runoff) monitoring program are to demonstrate compliancewith permit requirements, aid in implementing the Storm Water Pollution PreventionPlans (SWPPPs) (Eccher et al. 1994a and b), and measure the effectiveness of the BestManagement Practices (BMPs) in preventing contamination of storm water discharges.

7 Surface Water
7-2 LLNL Environmental Report for 1999
LLNL monitors storm water at the Livermore site in accordance with a Waste DischargeRequirements and National Pollutant Discharge Elimination System permit (WDR 95-174, NPDES Permit No. CA0030023) issued in 1995 (San Francisco Bay Regional WaterQuality Control Board [SFBRWQCB] 1995). In 1994, the Central Valley Regional WaterQuality Control Board (CVRWQCB) issued a Waste Discharge Requirements andNational Pollutant Discharge Elimination System Permit (WDR 94-131, NPDES PermitNo. CA0081396) for Site 300 (CVRWQCB 1994). These permits include specific moni-toring and reporting requirements. In addition to the storm water constituents requiredby the permits, LLNL monitors other constituents to provide a more complete waterquality profile. The current list of analyses provided for storm water samples is givenin Table 7-1.
Table 7-1. Analyses conducted on storm water samples, 1999.
Livermore site Site 300
Specific conductance Specific conductance
Total suspended solids Total dissolved solids
pH Total suspended solids
Chemical oxygen demand pH
Biochemical oxygen demand Potassium
Fish bioassay (fathead minnow) Beryllium
Anions Mercury
General minerals Volatile organic compounds
Metals Semivolatile organic compounds
Volatile organic compounds Pesticides
Pesticides PCBs
Oil and grease Total organic halides
PCBs Total organic carbon
Total organic carbon Dioxins
Semivolatile organic compounds Explosives
Gross alpha and beta Gross alpha and beta
Tritium Tritium
Plutonium Uranium
The NPDES permits for storm water require that LLNL sample effluent two times peryear. In addition, LLNL is required to visually inspect the storm drainage systemmonthly during the wet season, whenever significant storms occur, and twice during thedry season to identify any dry weather flows. Influent sampling is also required at the

Surface Water 7
LLNL Environmental Report for 1999 7-3
Livermore site. LLNL monitors up to two more storm events each year at the Livermoresite (a total of four sampling events) in support of U.S. Department of Energy (DOE)Orders 5400.1 and 5400.5. In addition, annual facility inspections are required to ensurethat the BMPs are adequate and implemented.
LLNL also meets the storm water compliance monitoring requirements of the StatewideGeneral NPDES Permit for Storm Water Discharges Associated with ConstructionActivity (Order 92-08-DWQ, NPDES Permit No. CAS000002) for construction projectsthat disturb 2 hectares of land or more (State Water Resources Control Board [SWRCB]1992). In August 1999, the SWRCB reissued Order 92-08-DWQ as Order 99-08-DWQ.The new requirements of the reissued permit were implemented by LLNL beginning inNovember 1999 as required by the permit’s conditions (SWRCB 1999). These conditionsapply to the 1999/2000 rainy season that will be discussed in the Environmental Reportfor 2000.
Storm water monitoring also follows the requirements in the Environmental RegulatoryGuide for Radiological Effluent Monitoring and Environmental Surveillance (U.S. Departmentof Energy 1991) and meets the applicable requirement of DOE Order 5400.1, GeneralEnvironmental Protection Program; DOE Order 5400.5, Radiation Protection of the Public andthe Environment; and the Comprehensive Environmental Response, Compensation, andLiability Act (CERCLA) Record of Decision for the Lawrence Livermore National LaboratoryLivermore Site (U.S. Department of Energy 1993).
Constituent Criteria
Currently, there are no numeric criteria that limit concentrations of specific constituentsin LLNL’s storm water effluent. The Environmental Protection Agency (EPA) estab-lished benchmark values for 41 parameters but stressed that these concentrations werenot intended to be interpreted as effluent limits (U.S. Environmental Protection Agency1995). Rather, the values are levels that the EPA has used to determine if storm waterdischarged from any given facility merits further monitoring. Although these criteriaare not directly applicable, the use of a broad range of criteria can help evaluate LLNL’sstorm water management program and ensure high quality storm water effluent.
Storm water sample results for the Livermore site were also compared with criterialisted in the Water Quality Control Plan, San Francisco Bay Basin (San Francisco BayRegional Water Quality Control Board 1995), and results for Site 300 were comparedwith criteria listed in The Water Quality Control Plan (Basin Plan) for the California RegionalWater Quality Control Board, Central Valley Region, Sacramento and San Joaquin River Basins(Longley et al. 1994). Criteria in the basin plans include surface water quality objectivesfor the protection of aquatic life and water quality objectives for waters designated for

7 Surface Water
7-4 LLNL Environmental Report for 1999
use as domestic or municipal supply or agricultural supply. These criteria include, byreference, California Maximum Contaminant Levels (MCLs) for drinking water. Inaddition, LLNL compared results with EPA MCLs and ambient water quality criteria(AWQC) as well as California AWQC. Criteria not specifically listed in the basin planswere obtained from A Compilation of Water Quality Goals (Marshack 1998). Criteria aresummarized in Table 7-1 in the Data Supplement, which lists Primary MCL/SecondaryMCL (PMCL/SMCL), Ambient Water Quality Criteria/Criteria for Agricultural Use(AWQC/Ag), and the EPA benchmarks.
In addition to chemical-specific monitoring, LLNL is required by NPDES permit(WDR 95-174) to conduct acute and chronic fish toxicity testing in Arroyo Las Positas(Livermore Site) once per wet season (defined as October of one year through April ofthe following year). Currently, LLNL is not required to test for fish toxicity at Site 300.
Inspections
Each directorate at LLNL conducts an annual inspection of its facilities to verify imple-mentation of the SWPPPs and to ensure that measures to reduce pollutant loadings tostorm water runoff are implemented. The Laboratory’s associate directors certify thattheir facilities comply with the provisions of WDR 94-131, WDR 95-174, and theSWPPPs. The deputy director for operations certifies the facilities directly reportingto the Director's Office, except those facilities in the Laboratory Site Operations organi-zation, which are certified by the Laboratory site manager. LLNL submits annual stormwater monitoring reports to the SFBRWQCB and to the CVRWQCB with the results ofsampling, observations, and inspections.
Monitoring for construction projects permitted by Order 92-08-DWQ included visualobservations of construction sites by the construction staff before and after storms toassess the effectiveness of implemented BMPs. Annual compliance certificationssummarize these inspections.
As in past years, the SFBRWQCB requested submission of compliance status reports forthe Livermore site projects. (The CVRWQCB has never requested compliance statusreports for projects located at Site 300.) The 1999 compliance certifications (and com-pliance status reports) covered the period of June 1998 through May 1999. During thisperiod, three Livermore site projects were inspected: the Decontamination and WasteTreatment Facility (DWTF), the National Ignition Facility (NIF), and the areas associatedwith the Soil Reuse Project. One Site 300 project, the Contained Firing Facility, was alsoinspected under this program.
Surface Water 7
LLNL Environmental Report for 1999 7-5
Sampling
To evaluate the overall impact of Livermore site and Site 300 operations on storm waterquality, storm water flows are sampled where they exit the sites and at upstreamlocations. Because of flow patterns at the Livermore site, storm water at samplinglocations includes water runoff from other sources, such as neighboring agriculturalland, parking lots, and landscaped areas. In contrast, storm water at Site 300 is sampledat locations that target specific industrial activities, with negligible run-on from othersources. These samples provide information used to evaluate the effectiveness ofLLNL’s storm water pollution control program.
Livermore Site
The natural drainage at the LLNL Livermore site was altered by construction activitiesseveral times up to 1966 (Thorpe et al. 1990) so that the current northwest flow ofArroyo Seco and the westward flow of Arroyo Las Positas do not represent historicalflow paths. About 1.6 km to the west of the Livermore site, Arroyo Seco merges withArroyo Las Positas, which continues to the west to eventually merge with ArroyoMocho (see Figure 7-1).
The DRB was excavated and lined in 1992 to prevent infiltration of storm water that wasdispersing ground water contaminants. It also serves storm water diversion and floodcontrol purposes. The DRB collects about one-fourth of the surface water runoff fromthe site and a portion of the Arroyo Las Positas drainage (Figure 7-2).
The DRB discharges north to a culvert that leads to Arroyo Las Positas. The remainderof the site drains either directly or indirectly into the two arroyos by way of stormsewers and ditches. Arroyo Seco cuts across the southwestern corner of the site. ArroyoLas Positas follows the northeastern and northern boundaries of the site and exits thesite near the northwest corner.
The routine Livermore site storm water runoff sampling network consists of ninelocations (Figure 7-2). Six locations characterize storm water either entering (influent:ALPE, ALPO, ASS2, and GRNE) or exiting (effluent: ASW and WPDC) the Livermoresite. Locations CDB and CDB2 characterize runoff from the southeastern quadrant ofthe Livermore site entering the DRB, and location CDBX characterizes water leaving theDRB. Additional locations were sampled during 1999 as part of a tritium source investi-gation and are described in this chapter in the Livermore Site Radioactive Constituentssection.

7 Surface Water
7-6 LLNL Environmental Report for 1999
East Avenue
Southern Pacific Railro
ad
Arroyo Seco
580
Vas
co R
oad
Patterson Pass Road
Gre
envi
lle R
oad
South Livermore Avenue
Arroyo Mocho
0Scale: Miles
10.5
Springtown
Tesla Road
Arroyo
Las Positas
SandiaNational
Laboratories/California
SandiaNational
Laboratories/California
LawrenceLivermoreNational
Laboratory
0 1 2Scale: Kilometers
N
Arroyo Las Positas
Figure 7-1. Surface water courses in the vicinity of the Livermore site.

Surface Water 7
LLNL Environmental Report for 1999 7-7
N
ALPE
ALPO
ASS2
ASW
WPDC
GRNE
CDBCDB2
CDBXDrainageRetentionBasin
DrainageRetentionBasin
Patterson Pass Road
Gre
envi
lle R
oad
Vas
co R
oad
East Avenue
Scale: Meters
Storm watersampling location
4002000
Arroyo Las Positas
Arroyo Seco
LLNL perimeter
Drainage RetentionBasin release sampling location
Drainage channel
Direction of flow
Figure 7-2. Storm water runoff and Drainage Retention Basin discharge samplinglocations, Livermore site, 1999.
Site 300
Surface water at Site 300 consists of seasonal runoff, springs, and natural and man-madeponds. The primary waterway in the Site 300 area is Corral Hollow Creek, an ephemeralstream that borders the site to the south and southeast. No continuously flowing streamsare present in the Site 300 area. Elk Ravine is the major drainage channel for most ofSite 300; it extends from the northwest portion of the site to the east-central area (seeFigure 9-3). Elk Ravine drains the center of the site into Corral Hollow Creek, whichdrains eastward to the San Joaquin River Basin. Some smaller canyons in the northeastportion of the site drain to the north and east toward Tracy.
7 Surface Water
7-8 LLNL Environmental Report for 1999
There are at least 23 springs at Site 300. Nineteen are perennial, and four are inter-mittent. Most of the springs have very low flow rates and are recognized only by smallmarshy areas, pools of water, or vegetation. A number of artificial surface water bodiesare present at Site 300. A sewage evaporation pond and a sewage percolation pond arelocated in the southeast corner of the site in the General Services Area (GSA), and twolined, high-explosives (HE) process water impoundments are located to the west in theExplosives Process Area. Monitoring results associated with these facilities are reportedin Chapter 9.
Other surface water flow at Site 300 results from blowdown water from cooling towersin the Building 801 complex in the East/West Firing Area and Building 836A near theeastern site boundary. Additionally, three wetlands created by now-discontinued flowsfrom cooling towers located at Buildings 827, 851, and 865 are currently maintained bydischarges of potable water. Cooling tower discharges and their potential impact arediscussed in the Final Site-Wide Remedial Investigation Report (Webster-Scholten 1994).
The Site 300 storm water sampling network began in 1994 with six locations and nowconsists of seven locations (Figure 7-3). Location CARW is used to characterize runoffin Corral Hollow Creek upgradient and therefore is unaffected by Site 300 activities.Location GEOCRK is used to characterize runoff in Corral Hollow Creek, downstreamof Site 300. The remaining locations were selected to characterize storm water runoff atlocations that could be affected by specific Site 300 activities.
Methods
Samples are collected by grab sampling from the runoff flow at specified locations.Sample bottle requirements, special sampling techniques, and preservation require-ments for each analyte are specified in the Environmental Monitoring Plan (Tate et al.1999) and summarized below.
If the water to be sampled is accessible to the technician, grab samples are collected bypartially submerging sample bottles directly into the water and allowing them to fillwith the sample water. If the water to be sampled is not directly accessible, a stainlesssteel bucket is used for sampling. The bucket is triple-rinsed with the water to besampled, then dipped or submerged into the water, and withdrawn in a smooth motion.Sampling is conducted away from the edge of the water to minimize the collection ofsediment with the sample matrix. Sample vials for volatile organics are filled first beforesample vials for all other constituents and parameters.

Surface Water 7
LLNL Environmental Report for 1999 7-9
Corral Hollow CreekCorral Hollow Road
N
Scale: Meters
0 800 1600
Route 4
Route 3
Route 4
Route 5
Route 3
Linac Road
Route 3R
oute 2
Doall Road
Ala
med
a C
ount
y
San
Joa
quin
Cou
nty
Upstream storm watersampling location
Industrial activity area storm water samplinglocation
Rain sampling location
Downstream storm watersampling location
NPT6
CARW
COMP
N829 N883
NPT7
GEOCRK
NLIN
Figure 7-3. Surface water flow in the vicinity of Site 300.
Results
Inspections
All 12 directorate-level organizations at the Livermore site conducted the permit-required annual inspections during 1999. These inspections of more than 500 facilitiesindicated that all BMPs were in place, implemented, and adequate to protect stormwater in all but five instances at the Livermore site. Three of the exceptions noted werethe absence of BMPs for the outdoor storage of materials (paint cans, batteries, anddrums). The paint cans and batteries were removed, and the drums are being evaluatedto determine if secondary storage is necessary. In addition, there was one instancewhere dumpster covers were missing. The dumpster covers are being replaced. Finally,
7 Surface Water
7-10 LLNL Environmental Report for 1999
rainwater was observed in secondary containment pallets in one area. The rainwaterwas removed and disposed of properly. All Site 300 inspections of more than100 facilities indicated that the applicable BMPs were in place, implemented, andadequate to protect storm water.
LLNL conducted the permit-required inspections before and after rain events at fourpermitted construction sites: three at the Livermore site and one at Site 300. Thefindings of these inspections indicated compliance with the permit and the constructionsite SWPPPs with these exceptions documented in the 1998/1999 annual compliancecertifications:
• There were two instances on the Contained Firing Facility constructionproject where the SWPPP was not updated as required: (1) a new area ofthe project was not included, and (2) the SWPPP was not updated at thestart of a new construction package.
• The Soil Reuse Project SWPPP was not updated as required to show themore protective BMPs being employed on the project.
• The NIF project did not perform inspections as required at some of theproject’s laydown areas, and on the main construction site some BMPswere not repaired within the 48-hour time period specified in the SWPPP.
Livermore Sampling
LLNL collected storm water samples at all nine Livermore site locations on February 8and April 8, 1999. Samples were collected from six locations on January 20, 1999. Threelocations did not produce flow on this date but were sampled during a later storm thatoccurred on January 26, 1999. Samples were collected from eight locations onNovember 8, 1999; no sample was collected at location ASS2 because there was no flowat this location. Fish toxicity analyses were conducted on the January 20, 1999, sample.
Toxicity Monitoring
As required by WDR 95-174, grab samples were collected and analyzed for acute andchronic toxicity using the fathead minnow (Pimephales promelas) as the test species. Inthe acute test, the 96-hour survival test was observed in undiluted storm water collectedfrom location WPDC. The permit states that an acceptable survival rate is 20% lowerthan the control sample. The testing laboratory provides water for the quality controlsample. As specified by the permit, upgradient water from influent locations ALPE,ALPO, and GRNE is used as an additional control. Thus, a difference of more than20% between location WPDC and the control sample with the lowest survival rate is

Surface Water 7
LLNL Environmental Report for 1999 7-11
considered a failed test. If the test is failed, the permit requires LLNL to conductadditional toxicity testing during the next significant storm event. If two consecutivetests fail, LLNL must perform a toxicity reduction evaluation to identify the source ofthe toxicity. Survival in the acute test at WPDC and all corresponding influent locations(ALPE, ALPO, and GRNE) was 100% in 1999 (sampled January 20).
In the chronic test, storm water dilutions of 0 (lab control), 6.25, 12.5, 25, 50, and 100%(undiluted storm water) were used to determine a dose-response relationship, if any, forboth survival and growth of the fathead minnow (see Table 7-2). No criteria are set forthis test; it is performed for information purposes only. Also, because this test is onlyrequired at effluent location WPDC and not conducted with water from correspondinginfluent locations, there is no way to determine if any effect should be attributed toLLNL or to upgradient water quality. From the data collected for this test, no observedeffect concentrations (NOECs) and lowest observed effect concentrations (LOECs) werecalculated using EPA/600/4-91-002. The NOECs and LOECs for survival and growthwere 100%. Thus, both the acute and chronic fish toxicity tests indicated that stormwater had no effect on survival or growth of the fathead minnow.
Table 7-2. Fish chronic toxicity test results, Livermore site, 1999.
Sample 7-day survival 7-day weight(a)
concentration(%)
Average(%)
Standarddeviation
Average (mg)
Standarddeviation
Lab control 100 0 0.64 0.060
6.25 95 5.8 0.53 0.058
12.5 98 5.0 0.44 0.221
25 95 5.8 0.52 0.084
50 95 10.0 0.58 0.056
100 98 5.0 0.56 0.100
a Weight of the fathead minnows at the end of the 7-day toxicity test.
Livermore Site Radioactive Constituents
Storm water tritium, gross alpha, and gross beta results are summarized in Table 7-3.Complete results are in the Data Supplement Tables 7-2, 7-3 and 7-4. Median activitiesat effluent locations were less than 10% of the respective MCLs. Figures 7-4 and 7-5,which show the historic trend in storm water gross alpha and gross beta, respectively,do not reveal a discernible trend. In these and other storm water historical trend figures,LLNL has aggregated all available data for the influent and effluent locations of the tworunoff pathways through the Livermore site. Also, data have been aggregated on a wet

7 Surface Water
7-12 LLNL Environmental Report for 1999
season basis—that is, October of one year through May of the next—rather than on acalendar-year basis. The 1999 points represent a partial wet season, pending collectionof year 2000 data, and are based on only one sampling event (November 8, 1999).
Table 7-3. Radioactivity in storm water runoff (Bq/L), Livermore site, 1999.
Tritium Gross alpha Gross beta
All locations
Median 17.4 0.0642 0.179
Minimum –0.903 0 0.0351
Maximum 7215 0.477 0.655
Interquartile range 36.9 0.0773 0.120
Effluent locations
Median 19.4 0.0381 0.184
Minimum –0.703 0 0.109
Maximum 129 0.0681 0.237
Interquartile range 42.4 0.0445 0.0935
MCL(a) 740 0.555 1.85
a MCL = Maximum contaminant level
0
0.1
0.2
0.3
0.4
0.5
0.6
0
5.4
10.8
16.2
87/88 88/89 89/90 90/91 91/92 92/93 93/94 94/95 95/96 96/97 97/98 98/99 99Year
Co
nce
ntr
atio
n (
Bq
/L)
Co
nce
ntr
atio
n (
pC
i/L)
Arroyo Seco influentArroyo Seco effluentArroyo Las Positas influentArroyo Las Positas effluent
MCL
Figure 7-4. Annual median gross alpha concentrations in Livermore site storm watercompared with the maximum contaminant level (MCL).

Surface Water 7
LLNL Environmental Report for 1999 7-13
0.01
0.1
1
10
0.027
1.0
0.1
10
100
270
87/88 88/89 89/90 90/91 91/92 92/93 93/94 94/95 95/96 96/97 98/9997/98 99Year
Co
nce
ntr
atio
n (
Bq
/L)
Co
nce
ntr
atio
n (
pC
i/L)
0.001
MCL
Arroyo Seco influentArroyo Seco effluentArroyo Las Positas influentArroyo Las Positas effluent
Figure 7-5. Annual median gross beta concentrations in Livermore site storm watercompared with the maximum contaminant level (MCL).
The historical trend in tritium levels is presented in Figure 7-6. Prior to the 1998/1999wet season, the analytical laboratory reported the minimum detectable level for non-detections, and these values were used in calculating medians for the plots. Beginningin the 1998/1999 wet season, changes in laboratory reporting procedures includedreporting a “calculated value” for nondetections. The calculated value is an estimate ofan unmeasurably low level. It is less than the minimum detectable level, and can evenbe negative (due to subtraction of background radiation). (See Chapter 14 for a com-plete explanation of calculated values.) Under the former reporting method, mediansinvolving nondetections were biased high. This change in reporting procedures resultsin a better estimate, on average, of the true level. At some locations the decrease intritium levels in the 1998/1999 wet season represented on Figure 7-6 may be a result ofthe new reporting procedures. The historical trend in tritium levels generally correlateswith decreased emissions (see Chapter 5), and indicates decreasing tritium levels instorm water from a peak in the 1988/1989 season.
Beginning with the 1996/1997 season, the tritium concentration in Arroyo Las Positashas been higher in storm water leaving the site than in storm water entering the site.On May 23, 1997, at location WPDC, where effluent is measured, a single higher-than-typical result for tritium in storm water (359 Bq/L) was measured.

7 Surface Water
7-14 LLNL Environmental Report for 1999
In response to the elevated effluent tritium concentrations, additional tritium investi-gations were initiated in the fall of 1998 to reconfirm the current evidence that effluenttritium concentration is greater than influent tritium concentration and to identifysources for the higher tritium concentrations. These investigations included:
• Review of air tritium sampling results (the air tritium data during andprior to 1998 did not indicate a source for the tritium).
• Increased frequency of rain sampling.
• Increased frequency and number of locations of storm water sampling.
Arroyo Seco influentArroyo Seco effluentArroyo Las Positas influentArroyo Las Positas effluent
1
10
102
10—1
103
10
102
103
104
27,000
86/87 87/88 88/89 89/90 90/91 91/92 92/93 93/94 94/95 95/96 96/97 98/9997/98 99Year
Co
nce
ntr
atio
n (
Bq
/L)
Co
nce
ntr
atio
n (
pC
i/L)
MCL
Figure 7-6. Annual median tritium concentrations in Livermore site storm watercompared with the maximum contaminant level (MCL). Negative resultswere assigned a value of 10–1 for plotting purposes

Surface Water 7
LLNL Environmental Report for 1999 7-15
The initial approach taken to evaluate tritium flow patterns across the Livermore sitewas to evaluate two locations (WPDW and 196S in Figure 7-7) where the storm drainagechannels join the main Arroyo Las Positas channel slightly upstream of where ArroyoLas Positas leaves the Livermore site effluent location (WPDC). Samples were collectedat these junctures on November 30, 1998, and reported in the Environmental Report 1998(Larson et al. 1999). Tritium was not detected in the incoming channels (calculatedvalues of 2.0 and 0.9 Bq/L at WPDW and 196S, respectively), but was detected at31 Bq/L in the main Arroyo Las Positas channel at both WPDS and 196E. Additionallocations were added in each subsequent sampling event during the spring of 1999 tofurther evaluate the tritium flow patterns (Figure 7-7). There was a general increase inrunoff tritium detected at internal sampling locations during the course of the wetseason (Data Supplement Tables 7-2 and 7-3). Figure 7-7 demonstrates that the sourcewas from the north-south channel, sampled at locations 3726 and 2582.
During this same time period (beginning in mid-January 1999), analytical results frommolecular sieves that monitor stack effluent at Building 331 (the Tritium Facility) began toshow evidence of above-normal releases of tritium (detected as both tritiated hydrogenand tritiated water, or HT and HTO). On March 28, facility staff located a glove box witha faulty pump that was causing the glove box contents to vent directly to the buildingstack. The pump/glove box was repaired on March 29, and storm water effluent tritiumlevels returned to levels seen in recent years. The highest site storm water effluenttritium level (58.5 Bq/L, or 1580 pCi/L) was collected February 8, compared to 11.1 Bq/L(301 pCi/L) collected on April 8.
Based on the sample results described above, the north-south channel containinglocations 3726 and 2582 will be the focus of the tritium source investigation for year2000. Additional storm water sampling locations will be added to this flow path tofurther investigate this source. LLNL will also evaluate sampling sediment for tritiumin this area.
LLNL began analyzing for plutonium in storm water in 1998. Samples were analyzedfrom the Arroyo Seco and Arroyo Las Positas effluent locations (ASW and WPDC).When the samples were low in suspended sediments (January 26 and February 8), theunfiltered water was analyzed. At intermediate suspended sediment levels (April 8),the runoff was filtered, and the filtered water and filtrate were analyzed. When thelaboratory determined that sufficient suspended sediment was present in the runoff (asin the November 8 sample), a portion of the runoff was analyzed unfiltered, and theremaining runoff was filtered. The filtrate and filtered water were analyzed (threeanalyses total from each location). Plutonium was never detected in the liquid portion
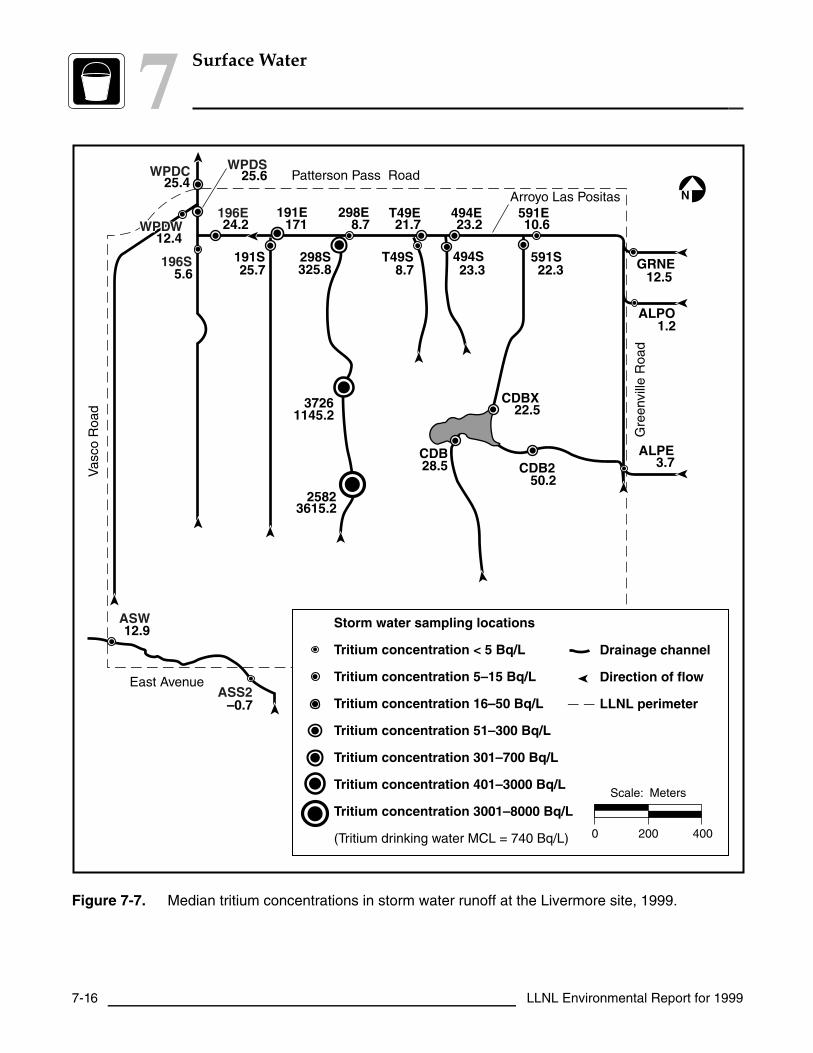
7 Surface Water
7-16 LLNL Environmental Report for 1999
Scale: Meters
Storm water sampling locations
Tritium concentration < 5 Bq/L
Tritium concentration 5–15 Bq/L
Tritium concentration 16–50 Bq/L
Tritium concentration 51–300 Bq/L
Tritium concentration 301–700 Bq/L
Tritium concentration 401–3000 Bq/L
Tritium concentration 3001–8000 Bq/L
(Tritium drinking water MCL = 740 Bq/L) 4002000
Drainage channel
Direction of flow
LLNL perimeter
N
12.4
25.4 25.6
25.7 8.7 23.3 22.3
1.2
12.5
10.6 23.221.78.717124.2
325.8
1145.2
28.5
12.9
–0.7
3.750.2
22.5
3615.2
5.6
GRNE
ALPO
ALPE
WPDWPDW
WPDSWPDS
196S
WPDC
GRNE
Arroyo Las Positas
CDB
3726
2582
CDB2
CDBX
191S T49S 494S 591S191S 298S T49S 494S 591S
191E 298E T49E 494E 591EWPDW
WPDS
196S
196E
ASS2
ASW
Patterson Pass Road
Gre
envi
lle R
oad
Vas
co R
oad
East Avenue
Figure 7-7. Median tritium concentrations in storm water runoff at the Livermore site, 1999.

Surface Water 7
LLNL Environmental Report for 1999 7-17
of 1999 runoff. The only plutonium detected in 1999 was in the filtrate from theNovember 8 sample from location WPDC (4.22 x 10⁻⁴ Bq/g of plutonium-239+240).This value is comparable to plutonium-239+240 levels routinely seen in sediments atthe location and is below the background level (4.44 × 10⁻⁴ Bq/g) for sediments. Thisbackground concentration reflects worldwide fallout and naturally occurring concen-trations (see Chapter 10). Thus, there is no evidence in the data to indicate that LLNLhas contributed plutonium to runoff. Complete plutonium results are found in DataSupplement Table 7-4.
Livermore Site Nonradioactive Constituents
Sample results were compared to the criteria in Table 7-1 of the Data Supplement. Ofgreatest concern are the constituents that exceeded comparison criteria at effluent pointsand whose concentrations are lower in influent than in effluent. If influent concen-trations are higher than effluent concentrations, the source is generally assumed to beunrelated to LLNL operations; and, therefore, further investigation is not warranted.Constituents that exceeded comparison criteria, and for which effluent concentrationswere higher than influent concentrations, are listed in Table 7-4. All the constituentsidentified by this screening process were metals, which were attributed to naturallyoccurring concentrations transported in sediments during a previous 2-year study(Brandstetter 1999). Furthermore, nearly half of the high effluent values occurred inArroyo Seco on January 26; on this date, effluent total suspended solids (TSS) concen-tration was nearly three times higher than influent TSS concentration, indicating that thesource is runoff-borne sediments. Under the requirements of WDR 99-086, LLNL willperform an analysis of Arroyo Seco and develop a management plan that includes aproposal to stabilize the channel and banks. Zinc was the only constituent identifiedby the screening process for other storm water sampling events. Complete storm waterresults for nonradioactive constituents are presented in Data Supplement Tables 7-5,7-6, and 7-7.
Site 300 Sampling
LLNL procedures specify sampling of a minimum of two storms per rainy season fromSite 300. Typically, a single storm will not produce runoff at all Site 300 locationsbecause Site 300 receives relatively little rainfall and is largely undeveloped. Therefore,at many locations, a series of large storms is required to saturate the ground beforerunoff occurs. In 1999, samples were collected at locations with flow on February 9 andApril 8. There was no detectable tritium in Site 300 storm water during 1999. Themaximum of all effluent and downstream gross alpha and gross beta results were 0.37and 0.48 Bq/L, respectively, approximately 65% and 25% of their MCLs (0.56 and1.85 Bq/L). Upstream (location CARW) gross alpha and gross beta activities ranged as

7 Surface Water
7-18 LLNL Environmental Report for 1999
high as 3.7 and 5.1 Bq/L, respectively. A previous study (Harrach et al. 1996) demon-strated a relationship in Site 300 runoff between naturally occurring isotopes in sus-pended solids, and gross alpha and gross beta. TSS concentrations in the 1999 CARWsamples are consistent with the results of that study, indicating that the high gross alphaand gross beta are from natural sources. Complete data results are in Data SupplementTable 7-8.
Table 7-4. Nonradioactive constituents above comparison criteria in storm water runoff,Livermore site, 1999.
Arroyo Seco
Metal Requested Storm Influent Effluent
(mg/L) analysis date ASS2 ASW
Dissolved Total Dissolved Total
Aluminum GENMIN 1/26 0.92 0.21 3.6
NPDESMETAL 0.88 0.27 3.3
Iron GENMIN 1/26 0.97 3.8
NPDESMETAL 0.95 3.7
Manganese GENMIN 1/26 0.074
NPDESMETAL 0.073
Zinc GENMIN 1/26 0.081 0.098
NPDESMETAL 0.078 0.097
GENMIN 2/8 0.077 0.042 0.085
NPDESMETAL 0.074 0.04 0.08
NPDESMETAL 4/8 0.058 0.062
Arroyo Los Positas
Metal Requested Storm Influent Effluent
(mg/L) analysis date ALPE ALPO GRNE WPDC
Dissolved Total Dissolved Total Dissolved Total Dissolved Total
Zinc GENMIN 1/20 0.055
NPDESMETAL 0.058
GENMIN 2/8 0.047 0.083 0.086
GENMIN 4/8 0.033 0.096 0.07 0.013
NPDESMETAL 0.088 0.034 0.079 0.046 0.097
Surface Water 7
LLNL Environmental Report for 1999 7-19
Tables 7-9, 7-10, and 7-11 in the Data Supplement list results for nonradioactiveconstituents in Site 300 storm water runoff. Because of a CERCLA remedialinvestigation finding of past releases of polychlorinated biphenyls (PCBs) and dioxinsrelated to activities in the vicinity of Building 850, analysis for PCBs and dioxins wasconducted at location NLIN, the storm water sampling location downstream ofBuilding 850. The intent of the sampling was to determine whether these constituentsare being released from the site in storm water runoff. PCBs, dioxins, and furans weredetected at low levels (maximum of 2800 pg/L, or 2.8 × 10⁻⁶ mg/L); all concentrationswere below MCLs and other comparison criteria.
Sampling at Pit 6 includes analyses required as part of the post-closure sampling(Table 7-11 in the Data Supplement). All post-closure sample results were belowcomparison criteria.
Specific conductance and TSS at Site 300 locations were at times above comparisoncriteria (see Table 7-1 in the Data Supplement); however, effluent levels were lower thanlevels at the upstream location (CARW), indicating that the levels observed in effluentare typical for the area. Results for pH were below the MCL and AWQC minimum (6.5)at location IV883 in both storm events sampled (6.04 and 6.1). All other Site 300 resultswere below comparison criteria.
Rainfall
This section discusses general information about rainfall in the Livermore site,Livermore Valley, and Site 300, as well as methods for sampling rainfall and thesampling results.
General Information
Livermore Site and Livermore Valley
Historically, the tritium activity measured in rainfall in the Livermore Valley resultedprimarily from atmospheric emissions of HTO from stacks at LLNL’s Tritium Facility(Building 331), and Sandia National Laboratories/California’s (Sandia/California)former Tritium Research Laboratory. The Building 343 rain sampling location is nearthe Tritium Facility (Building 331). The total measured atmospheric emission of HTOfrom LLNL facilities in 1999 was 7.9 TBq, equal to 214 Ci (see Chapter 4).

7 Surface Water
7-20 LLNL Environmental Report for 1999
The rain sampling station locations are shown on Figure 7-8. The fixed stations arepositioned to record the maximum activity expected down to background levels.
Tesla Road
East Avenue
Gre
envi
lleR
oad
Vas
co R
oad
Live
rmor
e A
venu
e
Flynn RoadB
uena
Vis
taA
venu
e
Arr
oyo
Roa
dL
Str
eet
CDBVIS
AQUE
SLST
ZON7
B291MET
B343
ESAN
Patterson PassRoad
SALV
COW
580
84
580
N
VET
BVA
VINE
GTES
Old Altamont Pass Road
0 1
Rain sampling locations
2
LLNL perimeter
Scale: Kilometers
Figure 7-8. Rain sampling locations, Livermore site and Livermore Valley, 1999.
Site 300
One central location (COMP) is used to collect rainfall for tritium activity measurementsat Site 300 (Figure 7-3). Rainfall is composited (i.e., added together) for each month andanalyzed when there is sufficient volume.
Methods
Rainfall is sampled for tritium according to written procedures, described in Appendix Bof the Environmental Monitoring Plan (Tate et al. 1999) and summarized here. Rainfallis collected in stainless steel buckets mounted about 1 m above the ground at specified
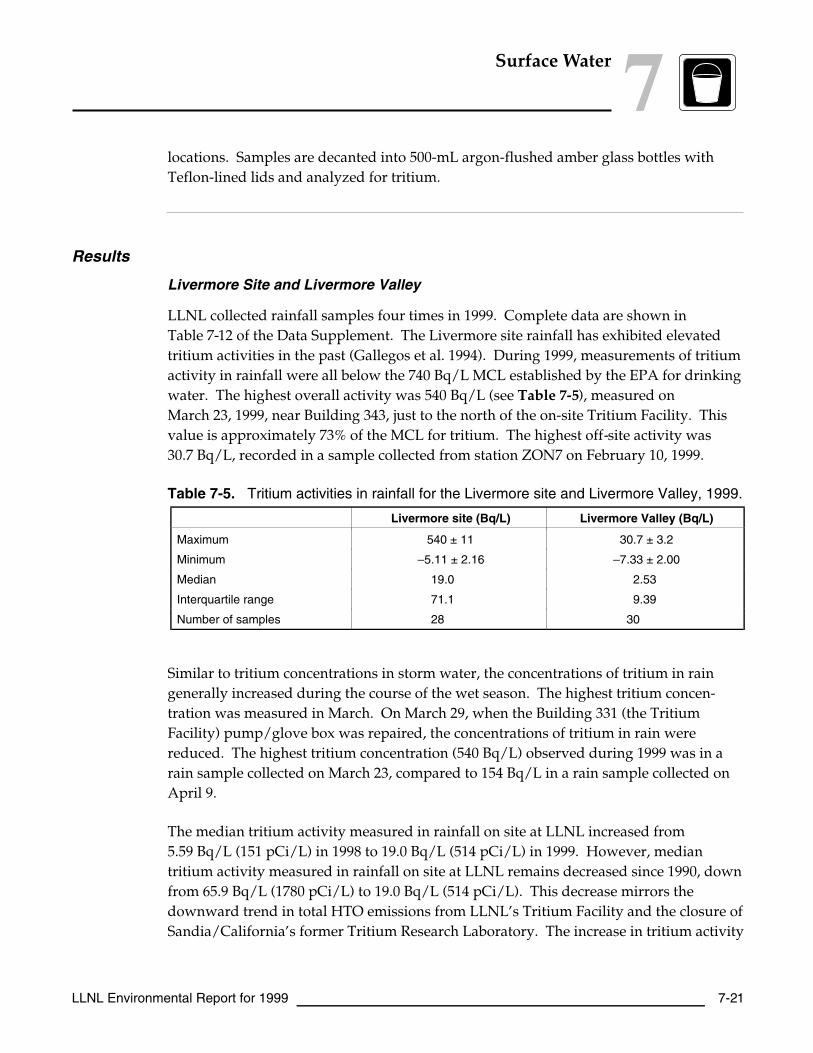
Surface Water 7
LLNL Environmental Report for 1999 7-21
locations. Samples are decanted into 500-mL argon-flushed amber glass bottles withTeflon-lined lids and analyzed for tritium.
Results
Livermore Site and Livermore Valley
LLNL collected rainfall samples four times in 1999. Complete data are shown inTable 7-12 of the Data Supplement. The Livermore site rainfall has exhibited elevatedtritium activities in the past (Gallegos et al. 1994). During 1999, measurements of tritiumactivity in rainfall were all below the 740 Bq/L MCL established by the EPA for drinkingwater. The highest overall activity was 540 Bq/L (see Table 7-5), measured onMarch 23, 1999, near Building 343, just to the north of the on-site Tritium Facility. Thisvalue is approximately 73% of the MCL for tritium. The highest off-site activity was30.7 Bq/L, recorded in a sample collected from station ZON7 on February 10, 1999.
Table 7-5. Tritium activities in rainfall for the Livermore site and Livermore Valley, 1999.
Livermore site (Bq/L) Livermore Valley (Bq/L)
Maximum 540 ± 11 30.7 ± 3.2
Minimum –5.11 ± 2.16 –7.33 ± 2.00
Median 19.0 2.53
Interquartile range 71.1 9.39
Number of samples 28 30
Similar to tritium concentrations in storm water, the concentrations of tritium in raingenerally increased during the course of the wet season. The highest tritium concen-tration was measured in March. On March 29, when the Building 331 (the TritiumFacility) pump/glove box was repaired, the concentrations of tritium in rain werereduced. The highest tritium concentration (540 Bq/L) observed during 1999 was in arain sample collected on March 23, compared to 154 Bq/L in a rain sample collected onApril 9.
The median tritium activity measured in rainfall on site at LLNL increased from5.59 Bq/L (151 pCi/L) in 1998 to 19.0 Bq/L (514 pCi/L) in 1999. However, mediantritium activity measured in rainfall on site at LLNL remains decreased since 1990, downfrom 65.9 Bq/L (1780 pCi/L) to 19.0 Bq/L (514 pCi/L). This decrease mirrors thedownward trend in total HTO emissions from LLNL’s Tritium Facility and the closure ofSandia/California’s former Tritium Research Laboratory. The increase in tritium activity

7 Surface Water
7-22 LLNL Environmental Report for 1999
in rainfall from 1998 to 1999 follows an increase in tritium emissions from LLNL’sTritium Facility from 4 TBq in 1998 to 10 TBq in 1999. These trends are shown inFigure 7-9. Rainfall will be sampled at additional locations and at an increased frequencyin 2000 in order to understand the pattern of tritium activity in rainfall samples.
Rain (Bq/L)
Emissions (TBq)
Tri
tiu
m in
sta
ck e
mis
sio
ns
(TB
q)
20
40
60
80
100
1989 1990 1991 1992 1993 1994 1995 1996 1997 1998 1999Year
0
20
40
60
80
100
Tri
tiu
m in
rai
n (
Bq
/L)
0
Figure 7-9. Trends of median tritium activity in rain and total stack emissions of HTOfrom the Livermore site and Sandia/California, 1989–1999. Emissionsfrom 1996–1999 are from LLNL only.
Values for median tritium activity shown in Figure 7-9 are derived from the six on-siterain sampling locations (Building 343, Building 291, CDB, SALV, VIS, and COW) thathistorically have given the highest activities. A decrease in total HTO emissions hasoccurred since 1990, down from 34.9 TBq (943 Ci) to 8.1 TBq (220 Ci).
Site 300
During 1999, Site 300 rain samples were analyzed for January, February, March, and April,with tritium activities of –5.74 ± 1.49, 0.241 ± 1.88, –1.45 ± 1.27, and 1.01 ± 2.70 Bq/L,(–155 ± 40.4, 6.52 ± 50.8, –39.1 ± 34.3, and 27.4 ± 73.1 pCi/L), respectively. These values areall below the minimum detectable activity.
Livermore Site Drainage Retention Basin
This section discusses general information about the DRB, sampling methods, andsampling results.

Surface Water 7
LLNL Environmental Report for 1999 7-23
General Information
Previous environmental reports detail the history of the construction and managementof the DRB (see Harrach et al. 1995−1997). In 1997, LLNL began to discharge treatedground water routinely to the DRB. In 1999, discharges from Treatment Facility D,Treatment Facility E, and related portable treatment units continued to be a year-roundsource of water entering the DRB. Wet weather flows into the DRB are still dominatedby storm water runoff, but dry weather discharges from the treatment facilities nowconstitute a substantial portion of the total water entering and exiting the DRB.
The SFBRWQCB regulates discharges from the DRB within the context of the Livermoresite CERCLA Record of Decision (U.S. Department of Energy 1993), as modified by theExplanation of Significant Differences for Metals Discharge Limits at the Lawrence LivermoreNational Laboratory Livermore Site (Berg 1997a). The CERCLA Record of Decisionestablishes discharge limits for all remedial activities at the Livermore site to meetapplicable, relevant, and appropriate requirements derived from the Federal CleanWater Act, the Federal and State Safe Drinking Water Acts, and the California Porter-Cologne Water Quality Act.
The DRB sampling program implements requirements established by the SFBRWQCBand modified in 1997 (Galles 1997a). The program consists of monitoring wet and dryweather releases for compliance with discharge limits, and monitoring internal DRBwater quality to support management actions, characterize water quality before itsrelease, and perform routine reporting.
LLNL samples DRB discharges (at location CDBX) and the corresponding site outfall (atlocation WPDC) during the first release of the rainy season, and from a minimum of oneadditional storm (chosen in conjunction with storm water runoff sampling). Duringthe dry season, samples are collected from each discrete discharge event. Dischargesampling locations CDBX and WPDC are shown in Figure 7-2. Samples are collected atCDBX to determine compliance with discharge limits. Sampling at WPDC is done toidentify any change in water quality as DRB discharges travel through the LLNL stormwater drainage system and leave the site. Sampling frequencies for CDBX and WPDCand effluent limits for discharges from the DRB, applied at CDBX, are found inTable 7-13 of the Data Supplement.
The routine management constituents, management action levels, and the monitoringfrequency that apply to water contained in the DRB are identified in Data SupplementTable 7-14. Sampling to determine whether water quality management objectives aremet is conducted at several points within the DRB. Dissolved oxygen content andtemperature are measured at eight locations (Figure 7-10). Because of limited variability

7 Surface Water
7-24 LLNL Environmental Report for 1999
Scale: Meters
0 5 10
CDBC (surface)
Pump
Sampling location
Deep zoneDeep zone
Boat ramp
CDBD (surface)CDBE (middle)CDBF (bottom)
CDBJ (surface)CDBK (middle)CDBL (bottom)
CDBA (surface)
Path
ShelfShelf
ShelfShelf
N
Figure 7-10. Sampling locations within the Drainage Retention Basin, 1999.
among sampling locations, all samples are routinely collected from sample locationCDBE. CDBE is located at the middle depth of the DRB. For purposes of determiningdischarge monitoring requirements and frequency, the wet season is defined asOctober 1 through May 31, the period when rain-related discharges usually occur(Galles 1997a). Discharge limits are applied to the wet and dry seasons as defined inthe Explanation of Significant Differences for Metals Discharge Limits at the LawrenceLivermore National Laboratory Livermore Site (Berg 1997a) (wet season December 1through March 31, dry season April 1 through November 30).
Every quarter LLNL submits a report summarizing weekly, monthly, quarterly,semiannual, and annual monitoring of the basin to the SFBRWQCB. The DrainageRetention Basin Management Plan (DRB Management Plan) (Limnion Corporation 1991)identifies biological and microbiological surveys that are to be used as the primarymeans to assess the long-range environmental impact of the DRB. LLNL monitors plantand animal species at the DRB, the drainage channels discharging into the DRB, anddownstream portions of Arroyo Las Positas. These surveys are conducted semiannuallyto identify the presence or absence of species. Surveys include amphibians, birds, fishes,

Surface Water 7
LLNL Environmental Report for 1999 7-25
and mammals. Plant surveys are also done in the spring and the fall. During 1999,LLNL lacked resources to conduct the microbiological surveys but continued thebiological surveys.
Methods
Sample collection procedures are discussed in Appendix B of the EnvironmentalMonitoring Plan (Tate et al. 1999). All samples from the DRB are collected as grabsamples. Field measurements for dissolved oxygen and temperature are made usinga dissolved oxygen/temperature meter. Turbidity is measured using a Secchi disk.Certified laboratories analyze the collected samples. Flow measurements were notmade during 1999.
Biological and microbiological methods are discussed in detail in the EnvironmentalMonitoring Plan (Tate et al. 1999). Biological surveys are conducted by LLNL's biologist.Animal surveys follow standard survey protocols such as Raptor Management TechniquesManual (Pendleton 1987), Inventory and Monitoring of Wildlife Habitat (Cooperrider 1986),and Wildlife Management Techniques Manual (Schemnitz 1980). Vegetation surveys useprotocols identified in the U.S. Army Corps of Engineers Wetlands Delineation Manual(Environmental Laboratory 1987).
Results
Samples collected during 1999 within the DRB at CDBE did not meet the managementaction levels for dissolved oxygen concentration and saturation, temperature, turbidity,nitrate (as N), total dissolved solids (TDS), total phosphorus (as P), ammonia nitrogen(as N), chemical oxygen demand, pH, specific conductance, and lead (Table 7-6). Noaction was taken to adjust nutrient levels. LLNL continued to operate the DRB circula-tion pumps to increase the dissolved oxygen levels. No action was taken in response tothe temperature changes because the low temperatures were consistent with normalseasonal patterns.
Releases were outside the allowable pH discharge range of 6.5 to 8.5 four times(January 20, 8.77; April 8, 8.75; June 28, 8.82; and November 8, 8.52). The February 8DRB discharge exceeded the lead discharge limit of 6.4 µg/L (7.9 µg/L) (DataSupplement Table 7-15).

7 Surface Water
7-26 LLNL Environmental Report for 1999
Table 7-6. Summary of Drainage Retention Basin monitoring exceeding management action levels atsampling location CDBE.
ParameterManagementaction level
Jan Feb Mar Apr May Jun Jul Aug Sep Oct Nov Dec
Field dissolved oxygen(mg/L)(a)
> 5 – – – – – – – – 4.5 4.9 – –
Oxygen saturation (%)(a) < 80%saturation
– 78 – – 70 72 – 64 52 51 66 65
Temperature (°C)(a) <15.6 and>26.7
8.7 10.4 12.6 13 – – – – – – 13.6 9.7
Turbidity (meters)(a) <0.91 0.57 0.43 0.52 0.77 0.61 0.45 0.26 0.381 0.50 0.57 0.51 0.4826
Nitrate (as N) > 0.2 1.7 1.2 0.57 – 0.33 0.77 1.2 0.59 0.49 1.2 2 1.9
pH < 6.0 and> 9.0
9.09 – 9.24 9.08 9.13 9.06 – – – – – –
Specific conductance(µmho/cm)
> 900 910 – – – – 1000 1180 1160 1200 1210 1210 1100
Total dissolved solids (TDS)(mg/L)
> 360 510 457 372 414 435 600 745 680 695 700 735 653
Total phosphorus (as P)(mg/L)
> 0.02 0.08 0.12 0.17 0.1 0.21 0.21 0.21 0.12 0.14 0.14 0.13 0.1
Ammonia nitrogen (as N)(mg/L)
> 0.1 – – – – 0.22 – – – 0.14 – – –
Chemical oxygen demand(mg/L)
> 20 – – – 46 – – – 27 – – – –
Lead (mg/L)(b) Wet season > 0.0064
– 0.0093 – – – – – – – – – –
a Monthly average
b Wet-season management action level applies from April 1 through November 30.
Data for maintenance and release monitoring at sampling locations CDBA, CDBC,CDBD, CDBE, CDBF, CDBJ, CDBK, CDBL, CDBX, and WPDC and from the biologicalsurvey are presented in Tables 7-15 through 7-20 in the Data Supplement.
Chemical and Physical Monitoring
Surface water dissolved oxygen concentration monthly averages were at or above themanagement action level of at least 80% saturation of oxygen during all but 3 months.Middle depth samples monthly averages indicated that dissolved oxygen was below 80%saturation during 6 months, while the bottom depths samples were below 80% saturationin all but 2 months. (Figure 7-11). Dissolved oxygen concentrations can be manuallyincreased using aeration pumps. These pumps are started whenever oxygen concen-trations at any level of the DRB drop close to or below the critical management actionlevel of 5 mg/L. In 1999, all three pumps operated continuously. During the colder

Surface Water 7
LLNL Environmental Report for 1999 7-27
4
20 5 15 20 25 3010
6
10
8
12
14
16
18D
isso
lved
oxy
gen
(m
g/L
)
80% saturation curve
Minimum dissolvedoxygen concentration
Temperature (°C)
Top (CDBJ)
Middle (CDBK)
Bottom (CDBL)
Figure 7-11. Monthly average dissolved oxygen vs temperature at each depth locationin the Drainage Retention Basin, 1999.
winter months when the water has an increased capacity to contain oxygen, the dissolvedoxygen levels were consistently above 5 mg/L. Dissolved oxygen concentrations at thesurface, middle, and bottom elevations continued to differ during 1999 (Figure 7-12).Temperature, the other important parameter in determining how much oxygen isdissolved in water, showed characteristic seasonal trends (Figure 7-13). The uniformdistribution of temperature in the top, middle, and bottom elevations reflects that theaerators were providing uniform physical mixing of the water.
Chemical oxygen demand was above management action levels during the second andthird quarters of 1999. Chlorophyll-a had one winter and one summer peak. Theelevated pH levels correspond to the period of the winter peak and may be associatedwith an occurrence of increased photosynthesis. The elevated pH within the DRB wasreflected in the elevated pH during releases. The chlorophyll-a levels can be used as anindicator of alga population and of the duration and intensity of alga blooms.

7 Surface Water
7-28 LLNL Environmental Report for 1999
CDBJ (top)CDBK (middle)CDBL (bottom)
0
2
4
8
6
10
12
16
14
18D
isso
lved
oxy
gen
(m
g/L
)
1993 1994 1995 1996 1997 1998 1999Year
Sample location
Minimum dissolved oxygen concentration
Figure 7-12. Monthly average dissolved oxygen concentration variations from thebeginning of Drainage Retention Basin operations.
Turbidity rose above acceptable management levels during the 1993/1994 wet seasonand, through 1999, remained above the turbidity management action level. Wet seasonturbidity probably results from sediments that pass through the sediment traps dis-charging into the DRB. Turbidity seen during the warmer summer months is mostlikely the result of alga growth (Harrach et al. 1996). Turbidity is also caused by theoperation of the aerators resuspending sediments and preventing smaller particles fromsettling. Lead exceeded the management action level at sample locations CDBE andCDBX during February.
Nutrient levels continued to be high during 1999. Nitrate and total phosphorous concen-trations were well above management action levels throughout the year. Nitrateexceeded management action levels for all but one month of the year, while phosphorousexceeded management action levels every month. Sources of nitrate and phosphorousinclude storm water runoff and treated ground water discharges. In addition, ammoniaexceeded the management action level during 2 months of the year. Ammonia formationis normally an indication of anoxic conditions. During 1999, total dissolved solidscontinued to exceed the management action levels with the concentration exceeding

Surface Water 7
LLNL Environmental Report for 1999 7-29
0
5
10
15
20
25
30W
ater
tem
per
atu
re (
°C)
1993 1994 1995 1996Year
1997 1998 1999
Maximum temperature
Minimumtemp
CDBJ (top)CDBK (middle)CDBL (bottom)
Sample location
Figure 7-13. Monthly average seasonal temperature variation measured at sample top,middle, and bottom levels from the start of operations in 1993.
360 mg/L in all 12 months. Related to the increase in total dissolved solids is the increaseseen in specific conductance. Specific conductance exceeded the management action levelof 900 µmho/cm for 8 months.
Biological Monitoring
Biological monitoring has not been conducted long enough to identify any trendsresulting from operation of the DRB. However, biological monitoring has shown anexpansion in the wetland areas in Arroyo Las Positas as a result of the continuousdischarges of water from the DRB and other sources of treated ground water throughoutthe dry season. The California red-legged frog (Rana aurora draytonii), a federally listedthreatened species, was found in Arroyo Las Positas, the DRB, and in the southwesternDRB tributary (upstream from sample location CDB). A number of other speciesroutinely use the DRB and are listed in Data Supplement Table 7-20.

7 Surface Water
7-30 LLNL Environmental Report for 1999
Site 300 Cooling Towers
This section discusses general information about the Site 300 cooling towers, samplingmethods, and sampling results.
General Information
LLNL samples cooling tower wastewater discharges as required by the Self-MonitoringProgram of WDR 94-131, NPDES Permit No. CA0081396, and reports the results of thecompliance sampling to the CVRWQCB quarterly.
Two primary cooling towers, located at Buildings 801 and 836A, regularly discharge tosurface water drainage courses. The remaining 13 secondary cooling towers routinelydischarge to percolation pits under a waiver of Waste Discharge Requirements from theCVRWQCB. Cooling tower locations are shown in Figure 7-14. (The Building 815secondary cooling tower was removed from service in 1999.) The permit establishesseparate effluent limits for the regular discharges from the primary cooling towers andsecondary cooling towers that discharge only occasionally to surface water drainagecourses. One secondary cooling tower discharged to a surface water drainage coursein 1999.
Blowdown flow is monitored biweekly from the cooling towers located at Buildings 801and 836A. TDS and pH are monitored quarterly at both locations.
Methods
Sample collection procedures are discussed in Appendix B of the EnvironmentalMonitoring Plan (Tate et al. 1999) and summarized here. To determine the effects of thecooling tower blowdown on Corral Hollow Creek, the permit requires quarterly pHmonitoring of the creek, both upstream (background) and downstream of the coolingtower discharges, whenever the creek is flowing. CARW is the upstream samplinglocation, and GEOCRK is the downstream sampling location (Figure 7-14). TheGEOCRK sampling location is also fed by discharges of treated ground water fromLLNL. Therefore, even when the upstream location is dry, there is often flow atGEOCRK. Field pH measurements, taken by LLNL technicians using calibrated meters,are used to monitor Corral Hollow Creek. These technicians also perform the requiredvisual observations that are recorded on the field tracking forms along with the field pHmeasurements.
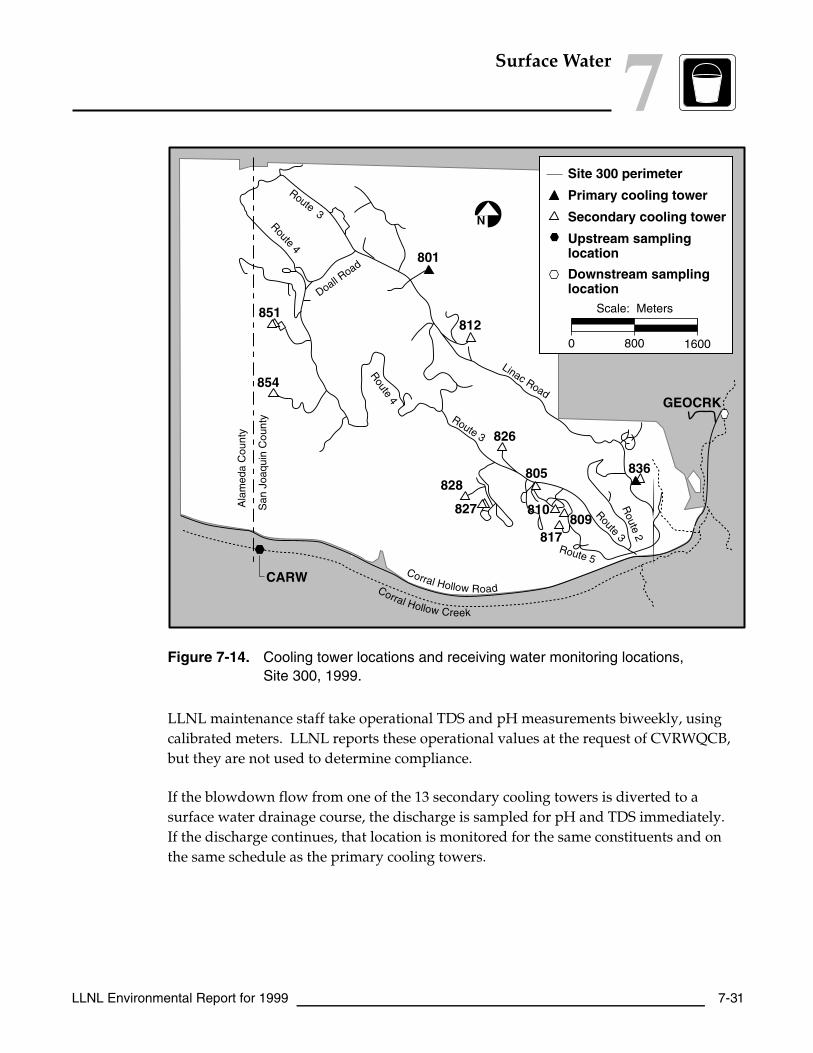
Surface Water 7
LLNL Environmental Report for 1999 7-31
828
Route 4
Route 3
Route 4
Route 5
Route 3
Linac Road
Route 3R
oute 2
Doall Road
Ala
med
a C
ount
y
San
Joa
quin
Cou
nty
Corral Hollow RoadCorral Hollow Creek
854
851812
801
827
826
817
805 836
809
Upstream sampling location
CARW
GEOCRK
Secondary cooling tower
Downstream samplinglocation
Primary cooling tower
Site 300 perimeter
Scale: Meters
0 800 1600
810810
N
Figure 7-14. Cooling tower locations and receiving water monitoring locations,Site 300, 1999.
LLNL maintenance staff take operational TDS and pH measurements biweekly, usingcalibrated meters. LLNL reports these operational values at the request of CVRWQCB,but they are not used to determine compliance.
If the blowdown flow from one of the 13 secondary cooling towers is diverted to asurface water drainage course, the discharge is sampled for pH and TDS immediately.If the discharge continues, that location is monitored for the same constituents and onthe same schedule as the primary cooling towers.

7 Surface Water
7-32 LLNL Environmental Report for 1999
Results
Biweekly and quarterly monitoring results are detailed in the quarterly self-monitoringreport to the CVRWQCB. Summary data from primary cooling tower compliancemonitoring and operational monitoring are found in Tables 7-7 and 7-8, respectively.
Table 7-7. Summary data from compliance monitoring of primary cooling towers, Site 300, 1999.
Test Towerno.
Permittedmaximum
Minimum Maximum Median Interquartilerange
Number ofsamples
Total dissolved solids(TDS) (mg/L)(a)
801 2,400 1,200 1,700 1,300 —(b) 3
836A 2,400 1,200 1,500 1,200 —(b) 3
Flow (L/day) 801 16,276 1,802 9,886 6,227 2,981 26
836A 8,138 0 29,166 1,464 1,968 26
pH (pH units) 801 10 8.5 9.0 8.6 —(b) 3
836A 10 8.3 8.9 8.5 —(b) 3
a Fourth quarter samples were inadvertently omitted. Samples collected 1/7/00 resulted in the following: 8.5 pH units, 1300 mg/L TDS at801; 8.3 pH units, 1200 mg/L TDS at 836A.
b Not enough data points to determine.
Table 7-8. Summary data from operational monitoring of primary cooling towers, Site 300, 1999.
Test Towerno.
Permittedmaximum
Minimum Maximum Median Interquartilerange
Number ofsamples
Total dissolved solids(TDS) (mg/L)
801 2400 1050 1450 1200 188 26
836A 2400 700 2000 1100 150 26
pH (pH units) 801 10 8.8 9.1 9.0 0.1 26
836A 10 8.6 9.1 9.0 0.1 26
All pH samples collected from the cooling tower discharges were below the permittedmaximum of 10. All TDS concentrations were below both the daily maximum(2400 mg/L) and monthly average (2000 mg/L) limits. Fourth quarter samples wereinadvertently omitted. Samples collected January 7, 2000, and the November 8, 1999,operational values, indicate fourth quarter compliance. These monitoring resultsdemonstrate that cooling tower discharges were consistently in compliance withpermitted limits (Tables 7-7 and 7-8).
Blowdown flow was below the maximum permitted design flow for 1999 with oneexception. On July 7, 1999, blowdown from the Building 836A cooling tower exceededthe maximum permitted design flow of 8138 liters per day by 21,029 liters per day. By

Surface Water 7
LLNL Environmental Report for 1999 7-33
the next scheduled measurement on July 21, blowdown flow was 1382 liters per day,well below permitted design flow. Operational flow measurements taken on July 5(2593 liters per day) and July 19 (2120 liters per day) demonstrated normal blowdownflow. High blowdown flow was attributed to a stuck solenoid on the blowdown valve,which has since been replaced.
First quarter pH samples collected on February 3 measured a pH of 8.63 at CARW and8.60 at the downstream GEOCRK location. Although these values are slightly over the8.5 pH limit, biweekly flow monitoring data show that there was no discharge fromthe Building 836A cooling tower that day. Additionally, observations of the drainagecourses leading from both the Building 801 and Building 836A cooling towers onFebruary 3 were dry at approximately 500 yards downstream and 200 yards down-stream, respectively. This indicates that the flow did not reach Corral Hollow Creekand, therefore, was not responsible for the elevated pH value in the creek.
Second quarter pH monitoring was done on April 28, 1999. The pH was 8.59 at CARWand 8.62 at GEOCRK. On May 25, flow was observed only at GEOCRK; the pH was8.62. Although these values are slightly above the 8.5 pH limit, it is unlikely that thecooling tower blowdown caused the pH elevation in the receiving water because theflow can only reach Corral Hollow Creek if there is significant rain, and there was nosignificant rain during the second quarter. Previous studies have shown that the maxi-mum blowdown rate from the cooling towers at Buildings 801 and 836A percolates intothe ground before reaching Corral Hollow Creek (Fisher 1993 and Folks 1999).
During the third quarter, flow was observed only at GEOCRK. This downstream flowwas sampled on August 4; the resulting pH was 8.56. As with the second quartersamples, this is slightly above the 8.5 pH limit; however, there was no rain during thethird quarter.
During the fourth quarter, flow was observed only at GEOCRK, but samples wereinadvertently omitted during this timeframe. As soon as the omission was noted,samples were collected even though the monitoring period had ended. The pH atGEOCRK was 8.8 on January 7, 2000. As with the second and third quarters, this isslightly above the 8.5 pH limit. However, there was no runoff at the time of thesampling event. (The most recent rain event preceding the sampling occurred onDecember 8, 1999.)
Visual observations of Corral Hollow Creek were performed each quarter as required inthe permit. The ambient pH did not change by more than 0.5 units, and no visible oil,grease, scum, foam, or floating suspended material was noted in the creek during 1999.

7 Surface Water
7-34 LLNL Environmental Report for 1999
One discharge occurred from a secondary cooling tower in 1999. The Building 827cooling tower percolation pit overflowed on August 20, 1999, because a coating of clayhad sealed the gravel layer. The flow was diverted to the surface water drainage courseuntil the pit was repaired (August 20–September 9, 1999). As required by the permit,monitoring samples were collected immediately from both cooling towers that dischargeto that pit. Permit limits for the secondary cooling towers are as follows: TDS must notexceed a monthly average of 2000 mg/L or 5000 mg/L daily, pH must not exceed 10,and flow must not exceed the permitted design maximum. Analytical results(1820 mg/L TDS and 8.83 pH for cooling tower 827-1; 1440 mg/L TDS and 8.7 pH forcooling tower 827-2) were below the permit limits. The September 1, 1999, flowmeasurements were inadvertently omitted for this location. The operational flow valuesfor this interval demonstrate compliance. For the period ending August 30, 1999, theoperational values were 4088 liters per day for cooling tower 827-1 and 1968 liters perday for cooling tower 827-2. These values are below the 11,355 liters per day maximumpermitted design flow.
Other Waters
Additional surface water monitoring is required by DOE Order 5400.1, General Environ-mental Protection Program, and DOE Order 5400.5, Radiation Protection of the Public and theEnvironment. Surface and drinking water near the LLNL Livermore site and in theLivermore Valley are sampled at locations shown in Figure 7-15. Sampling locationsDEL, ZON7, DUCK, ALAG, SHAD, and CAL are surface water bodies; of these DEL,ZON7, and CAL are drinking water sources. BELL, GAS, PALM, ORCH, and TAPare drinking water outlets. Location POOL is the on-site swimming pool. Data fromdrinking water sources and drinking water outlets are used to calculate drinking waterstatistics (see Table 7-9) and doses.
Methods
Samples are analyzed for gross alpha, gross beta, and tritium, according to proceduresset out in Appendix B of the Environmental Monitoring Plan (Tate et al. 1999). LLNLsampled these locations semiannually for gross alpha, gross beta, and tritium. Theon-site swimming pool (POOL) was sampled semiannually for gross alpha and grossbeta, and quarterly for tritium.

Surface Water 7
LLNL Environmental Report for 1999 7-35
DUCK
Lake Del Valle
Valle
citos
Roa
d
Stanley Boulevard
Livermore Avenue
Gre
envi
lle R
oad
PattersonPass Road
ShadowCliffs
PALM
GAS
BELL
SHAD
ORCH
Mines
Road
ZON7
ALAG location in Arroyo de la Laguna
East Avenue
84
Livermore
580
CAL location atCalaverasReservoir
TAP
POOL
Drinking water sampling locations
Surface water sampling locations 4
Scale: Kilometers
0 2
DEL
LLNL perimeter
N
Figure 7-15. Surface and drinking water sampling locations, Livermore Valley, 1999.
Results
The median activity for tritium in surface waters was a result of nondetect; themaximum tritium activity was 1% of the MCL. Median activities for gross alpha andgross beta radiation in surface water samples were approximately 5% of the MCL.

7 Surface Water
7-36 LLNL Environmental Report for 1999
However, maximum activities detected for gross alpha and gross beta, respectively,were 0.374 Bq/L (10.1 pCi/L) and 0.18 Bq/L (4.9 pCi/L); both less than 10% of theirrespective MCLs (see Table 7-9). Detailed data are in Table 7-21 of the Data Supple-ment. Historically, gross alpha and gross beta radiation have fluctuated about thelaboratory reporting limits. At these very low levels, the error measurements are nearlyequal to the measured values so that no trends are apparent in the data.
Table 7-9. Radioactivity in surface and drinking water in the Livermore Valley, 1999
Tritium (Bq/L) Gross alpha (Bq/L) Gross beta (Bq/L)
All locations
Median –1.34 0.0459 0.181
Minimum –5.96 –0.00181 0.0353
Maximum 10.1 0.374 0.18
Interquartile range 4.84 0.0734 0.271
Drinking water locations
Median –3.12 0.0330 0.132
Minimum –5.96 –0.00181 0.0353
Maximum 0.356 0.374 1.03
Interquartile range 4.55 0.0466 0.314
Environmental Impacts
This section discusses environmental impacts of storm water, rainfall, the DRB, coolingtowers, and other waters.
Storm Water
The potential off-site impact of tritium was estimated by determining the effective doseequivalent (EDE). (See Appendix A for the method LLNL used to calculate dose.)Median tritium activity in storm water (runoff) effluent (location WPDC) was 19.4 Bq/L,about 3% of the MCL. The EDE to an adult who ingested 2 liters of water per day at themaximum storm water tritium concentration for 1 year would be less than 0.0003 mSv(0.03 mrem), or 0.03% of the 1 mSv DOE standard allowable dose for ingestion. Medianeffluent gross alpha and gross beta activities in storm water were 0.038 and 0.18 Bq/L,both less than 10% of their respective MCLs.
Concentrations of some metals were above comparison criteria; this was caused by metalsassociated with suspended solids in the storm water. Although some 1999 storm water

Surface Water 7
LLNL Environmental Report for 1999 7-37
results were above criteria, there is no evidence that indicates any impact to off-site biota.The acute and chronic fish toxicity tests conducted during 1999 showed no toxicity inLLNL storm water runoff, further supporting the conclusion that LLNL storm water hasno adverse effect on off-site biota.
Rainfall
Livermore Site and Livermore Valley
The environmental impact of tritium measured in rainfall samples from the Livermoresite and the Livermore Valley was negligible. The median tritium activity measured inrainfall on site at LLNL increased from 5.59 Bq/L (151 pCi/L) in 1998 to 19.0 Bq/L(514 pCi/L) in 1999. However, median tritium activity measured in rainfall on site atLLNL has decreased since 1990: down from 65.9 Bq/L (1780 pCi/L) to 19.0 Bq/L(514 pCi/L). In 2000, rainfall samples will be collected at an increased frequency andat additional locations in an attempt to further understand the pattern of tritium activityobserved in rainfall.
Site 300
The environmental impact of tritium measured in rainfall samples from Site 300 wasnegligible. The measured tritium activities of rainfall samples taken at Site 300 were alleither less than the minimum detectable activity or less than the 2σ uncertainty. Overthe past 27 years, 166 measurements of rainfall samples collected at this location give amaximum tritium activity of only 9.1 Bq/L. The tritium activity measured in rainfall atSite 300 has been indistinguishable from atmospheric background levels over the past27 years.
Drainage Retention Basin
There is no evidence of adverse environmental impact resulting from releases from theDRB. Although mild toxicity was observed in the DRB and in water discharged fromthe DRB, there is no evidence that the discharge had an effect on the downstreamreceiving water. Because of the frequent dry season discharges that occurred from theDRB, discharges from ground water treatment facilities, and the wetter rainfall yearsthat occurred from 1997 through 1999, wetland vegetation has increased both up- anddownstream of the DRB. The federally listed threatened California red-legged frog hascolonized these wetland areas.

7 Surface Water
7-38 LLNL Environmental Report for 1999
Cooling Towers
Both primary cooling towers that discharge to surface were within their permitted limitsfor pH and TDS. With one exception, flow from these cooling towers was below themaximum permitted design flow. Corral Hollow Creek was not flowing during the July1999 flow excursion from the Building 836A cooling tower, and even with the higherflow, the blowdown is unlikely to have reached the creek during the hot dry weathertypical of July. Thus, data indicate no negative impact to surface waters from thesecooling towers. The secondary cooling tower percolation pit overflow at Building 827was also within permitted limits, which indicates no negative impact to surface watersfrom this one-time event.
Because blowdown flow from the cooling towers does not reach Corral Hollow Creek, itis unlikely to have a negative impact on the receiving water. Run-off from livestockareas or natural pH variations may have a more significant impact than cooling towerblowdown.
Other Waters
The potential impact of tritium on drinking water supplies was estimated by determin-ing the EDE (see Appendix A). Maximum tritium activity in drinking waters was0.36 Bq/L (9.6 pCi/L). The EDE to an adult who ingested 2 liters of water per day atthis maximum concentration for 1 year would be 0.000005 mSv (0.0005 mrem), or 0.013%of the DOE standard allowable dose of 0.04 mSv for drinking water systems. Grossalpha and gross beta activities were below their MCLs. The sample data indicate thatthe impact of LLNL Livermore site operations on surface and drinking waters isnegligible.

8
LLNL Environmental Report for 1999 8-1
Ground Water Investigationand Remediation
Richard BlakeMichael Taffet
Introduction
During 1999, ground water investigations and remediations under the ComprehensiveEnvironmental Response, Compensation and Liability Act (CERCLA) continued at boththe Livermore site and Site 300. LLNL regularly samples and analyzes ground waterfrom areas of known or suspected contamination. Portions of the two sites that containground water with concentrations of chemicals of concern are actively investigated todetermine the magnitude of the contamination and its source. Remediation strategiesare developed and evaluated in preparation for a CERCLA removal action or throughthe feasibility study process. An approved remedy for each study area is developed inconsultation with the regulatory agencies and the community. This chapter reviews thedistribution of contaminants in ground water, and the progress LLNL has made inremoving contaminants from ground water and from the unsaturated zones (soil vapor)at the Livermore site and Site 300.
Livermore Site Ground Water ProjectPhysiographic Setting
The general topography of the Livermore site is described in Chapter 1. The LivermoreValley ground water system is a sequence of semiconfined aquifers in which groundwater moves downslope from the valley uplands toward the east-west axis of the valley.It then flows generally westward toward the southwest portion of the basin. Fromthere, ground water has historically flowed south into the Sunol Valley Ground WaterBasin. The largest quantities of ground water are pumped from the central and westernportions of the Livermore Valley, where the valley fill is thickest.
The valley fill sediments make up two aquifers: the Livermore Formation and its over-lying alluvium. The Livermore Formation averages about 1000 m in thickness andoccupies an area of approximately 250 km2. The alluvium, which is about 100 m thick,is the principal water-producing formation within the valley.

8 Ground Water Investigation and Remediation
8-2 LLNL Environmental Report for 1999
Hydrogeology
Sediment types at the Livermore site are grouped into four categories—clay, silt, sand,and gravel—based on dominant particle size. Ground water flow beneath the site isprimarily in alluvial sand and gravel lenses and channels, bounded by the less perm-eable clays and silts. The alluvial sediments have been mapped into seven hydrostra-tigraphic units (HSUs) beneath the Livermore site using data collected over the years.HSUs can be defined as sedimentary sequences whose permeable layers show evidenceof hydraulic connection. The HSUs of concern beneath the Livermore site are theQuaternary alluvial deposits of the upper Livermore member of the Livermore Forma-tion (see Figure 8-1). HSUs 1B, 2, 3A, 3B, 4, and 5 contain contaminants that areprimarily solvents (Blake et al. 1995 and Hoffman et al. 1998).
Remedial Activities
In 1999, the Livermore site Ground Water Project (GWP) treated more than 1100 ML ofground water, brought new treatment facilities on line, installed wells, conductedhydraulic tests, developed ground water models, published required documents, andmaintained close contact with regulatory agencies and the community.
LLNL operated ground water treatment facilities and vapor treatment facilities (VTF)in the TFA, TFB, TFC, TFD, TFE, TFG, TF406, TF518, and TF5475 areas. A total of69 ground water extraction wells operated at 20 separate locations at an average flowrate of 3.0 ML/day in 1999. A total of three vapor extraction wells operated at twoseparate locations at an average flow rate of 2846 m3/day. Table 8-1 shows the volumesof ground water and soil vapor treated at the facilities and the estimated volatile organiccompound (VOC) mass removed from the subsurface during 1999 and since the begin-ning of the remediation. A graph of VOC mass removal at the Livermore site since 1989is presented in Figure 8-2. Concentrations of remaining VOCs in the fourth quarter of1999 are depicted as concentration maps in the six HSUs in Figures 8-3 through 8-8.
Table 8-2 lists the extraction wells according to the hydrostratigraphic unit in whichthey are screened and the total flow rate for each treatment area. Together, the groundwater and vapor treatment facilities removed approximately 267 kg of VOC mass in1999. Since operations began, approximately 4247 ML of ground water and almost0.48 million m3 of vapor have been treated, and more than 752 kg of VOCs have beenremoved. The VOC plumes in HSUs 1B, 2, 3A, 3B, 4, and 5 continue to be hydraulicallycontrolled based on trends in ground water chemistry, capture zone analysis, and thetotal VOC isoconcentration maps (Figures 8-3 through 8-8) for each HSU.

Ground Water Investigation and Remediation 8
LLNL Environmental Report for 1999 8-3
Saturated zoneUnit 3AUnit 3AUnit 3A
Unit 7Unit 7Unit 6Unit 6Unit 5Unit 5
Unit 4Unit 4
Unit 1AUnit 1AUnit 1AUnit 1B
Unit 2Unit 2
Unit 3BUnit 3B
Unit 7Unit 6Unit 5
Unit 4
Unit 1B
Unit 2
Unit 3B
Unsaturated zone
TFA
TFB
TFC
TFD
TFCSoutheast
TFD West
TFD SouthTFE
NorthwestCRD
TFDSoutheast
PTU-10
STU-01
PTU-4
TF406 TF518
TFE East
VTF518
TFG-1TFA-EastSTU07 East AvenueEast Avenue
Patterson Pass Road
Ele
vati
on
(m
eter
s ab
ove
mea
n s
ea le
vel)
200
150
100G
reen
ville
Roa
d
Vasc
o R
oad
Fixed facilities
Portable treatmentunits
N
TFD East
VTF-5475TF5475-2
Figure 8-1. Map and cross section of the Livermore site showing hydrostratigraphic units and thelocations of the treatment plants.
The numbers and locations of new wells installed in 1999 are shown in Table 8-3. Wellconstruction details, well closure data, and results of drawdown tests are provided inthe LLNL Ground Water Project 1999 Annual Report (Aarons et al. 2000).

8 Ground Water Investigation and Remediation
8-4 LLNL Environmental Report for 1999
Table 8-1. Volatile organic compounds (VOCs) removed from ground water and soil atthe Livermore site.
1999 Cumulative total
Treatmentfacility(a)
Startupdate
Water treated(ML)(b)
VOCsremoved (kg)
Water treated(ML)(b)
VOCsremoved (kg)
TFA 9/89 519 14 2,468 123
TFB 10/90 114 7.6 430 38
TFC 10/93 93 9.0 316 32
TFD 9/94 226 88 696 235
TFE 11/96 108 38 201 72
TFG 4/96 10 0.6 38 1.8
TF406 8/96 28 1.0 83 4.2
TF518 1/98 3.6 0.2 14 1.2
TF5475 9/97 0.64 0.4 0.76 2.3
Total 1,102 159 4,247 510
Soil vaportreated (m3)
VOCsremoved (kg)
Soil vaportreated (m3)
VOCsremoved (kg)
VTF518(c) 9/95 101,834 13.1 418,258 147
VTF5475(c) 1/99 59,274 94.9 59,274 95
Total 161,108 108 477,531 242
a Includes fixed and portable units.b ML = 1 million liters.c Vapor extraction facility.
Treatment Facility A
Treatment Facility A (TFA) is a fixed facility that is located in the southwestern quadrantof the Livermore site near Vasco Road and East Avenue (Figure 8-1). Ground water istreated using the large-capacity air-stripping system that was installed in June 1997.The VOCs are stripped from the ground water, and the effluent air from the stripper ispassed through granular activated carbon (GAC) filters to remove the VOCs. Thetreated effluent air is then vented to the atmosphere. The California Regional WaterQuality Control Board (RWQCB) permits LLNL to treat up to 500 gallons per minute(gpm) of ground water. Treated ground water from TFA is discharged to the RechargeBasin, located about 600 m southeast of TFA on Department of Energy (DOE) propertyadministered by Sandia National Laboratories/California. Since startup of the newsystem, TFA has not exceeded the 5 parts per billion (ppb) total VOC discharge limit.

Ground Water Investigation and Remediation 8
LLNL Environmental Report for 1999 8-5
Wells at TFA pumped at a combined flow rate of about 1150 L/min and treated 519 MLof ground water containing an estimated 14 kg of VOCs.
Treatment Facility A—East (TFA-East) began operating in September 1999. This facilityconsists of one extraction well operating at a flow rate of 5.6 L/min. The water istreated at a portable solar-powered treatment unit that discharges its treated water toArroyo Seco.
One monitor well was installed in the TFA area in 1999 (see Table 8-3). Two otherpiezometer wells were installed as a part of ongoing work at the infiltration study area.
Year
Total VOC mass removed byground water extraction
Cumulative total VOC mass removed through 1999 = 752 kg
which includes total VOC mass removed by:ground water extraction = 510 kg
soil vapor extraction = 242 kg
0102030405060708090
100110120130140150160170
1989 1990 1991 1992 1993 1994 1995 1996 1997 1998 1999
To
tal V
OC
mas
s re
mo
ved
(kg
) Total VOC mass removed bysoil vapor extraction
Figure 8-2. Total VOC mass removed from the subsurface of the Livermore site,1989–1999.
Treatment Facility B
Treatment Facility B (TFB) is located in the west-central portion of the Livermore site.Ground water is treated using the large-capacity air-stripping system that was installedin October 1998. This unit replaced an ultraviolet/hydrogen peroxide (UV/H2O2)system that had been in use since 1990. Ground water is also treated for chromium(VI)in an ion-exchange unit during the winter months, based on the current RWQCB

8 Ground Water Investigation and Remediation
8-6 LLNL Environmental Report for 1999
discharge substantive requirements. Wells at TFB pumped at a combined flow rate ofabout 287 L/min, and treated about 114 ML of ground water containing an estimated7.6 kg of VOCs. Treated ground water from TFB is discharged into the north-flowingdrainage ditch parallel to Vasco Road that empties into Arroyo Las Positas to the north.TFB was in compliance throughout 1999. No new wells were installed at TFB during1999 (Table 8-3).
Area whereHSU 1B is
unsaturated
Area whereHSU 1B is
unsaturated
W-620
W-610
W-556
W-408
W-701
W-1501
W-1426
W-1425
W-602W-601
W-262W-520W-521
W-1102
W-1116
W-1015
W-1427W-1104
W-1428
W-1213
W-571
W-1103
W-1425
W-1001
W-601
W-520W-521W-602
W-262
W-1501
TF406
10
10
1010
5
10
50
50
10050
50
50100
50 50
5
1
50
50
50
50
50
100
50
5
5
5
10
55
5
51
1
5 51 1
1
1
1
100
100
TFA-E
TFA
TFB
TFC
TFDTFD-W
TFE-NW
TFE-E
TF406
TFG-1
TF518
TFD-ETFC-SE
TF5475-1
TFD-SE
TFE-E
TFD-E
TF5475-1
TFD-SE
VTF518TF518 VTF518
PTU-4(<12/98
location)
STU-01
Well
10Total VOCisoconcentrationcontour (ppb),dashed whereinferred.
Scale: Meters
0 250 500
Vas
co R
oad
Patterson Pass Road
East Avenue
N
Figure 8-3. Isoconcentration contour map of total VOCs within HSU 1B.

Ground Water Investigation and Remediation 8
LLNL Environmental Report for 1999 8-7
East Avenue
Vas
co R
oad
Patterson Pass Road
Rhonewood Subdivision
5
1010
10
10
10
10
1050
50
50
50
50
50100
100
100
100
500
500
500
500
500
1000
555
5
5
5
1
1
5
1
11
1
1
1
1
1000500
W-903W-457W-904
W-522
W-518W-609W-603
W-109
W-621
W-605
W-714
W-655
W-1009
W-1423W-1420
W-415
W-1111
W-1308
W-1405
W-1306
W-906W-1215
W-1216
TFA-E
TFA
TFB
TFC
TFD
TFD-W
TFE-NW
TFE-E
TF406
TFG-1
TF518TF518
TF5475-1TF5475-1
VTF518VTF518TF518
TFD-E
TFC-SE
TF5475-1
TFD-SE
VTF518
PTU-4(<12/98
location)
STU-01
Well
10Total VOC isoconcen-tration contour (ppb),dashed where inferred.Tick marks indicatedepression contour
Arroyo Seco
Arroyo Seco
N
Scale: Meters
0 250 500
Area whereHSU 2 is
unsaturated
Area whereHSU 2 is
unsaturated
Figure 8-4. Isoconcentration contour map of total VOCs within HSU 2.
Treatment Facility C
Treatment Facility C (TFC) is located in the northwest quadrant of the Livermore site(Figure 8-1). Portable Treatment Unit (PTU) location TFC Southeast (TFC-SE), locatednear the intersection of Avenue A and Sixth Street in the northwest quadrant of theLivermore site, treats ground water from one HSU 1B well (W-1213). The combinedTFC facilities operated at an average flow rate of 212 L/min in 1999. TFC and TFC-SEprocess VOCs in ground water using air stripping. The effluent air from the stripper istreated with granular activated carbon prior to discharge to the atmosphere. Groundwater is treated for chromium(VI) in an ion-exchange unit during the winter months, inorder to meet the current RWQCB discharge substantive requirements. Wells in the TFC

8 Ground Water Investigation and Remediation
8-8 LLNL Environmental Report for 1999
area pumped at a combined flow rate of about 212 L/min and treated about 93 ML ofground water containing an estimated 9.0 kg of VOCs. Treated ground water from TFCis discharged into Arroyo Las Positas. Treated ground water from TFC-SE is dischargedinto a north-flowing drainage ditch that empties into Arroyo Las Positas to the north.The TFC effluent chromium(VI) concentration was 32 ppb in February 1999, above thewet season discharge limit of 22 ppb. The ion exchange unit was regenerated andsubsequent samples were below the chromium(VI) discharge limit through the end of1999. TFC–SE was in compliance with all permits throughout 1999. No new wells wereinstalled at TFC during 1999 (Table 8-3).
TFA-ETFA
TFB
TFC
TFD
TFD-W
TFE-NW
TFE-E
TF406
TFG-1
TFD-ETFC-SE
TF5475-1
TFD-SE
VTF518VTF518TF518
PTU-4 (<12/98location)
STU-01
Area whereHSU 3A is
unsaturated
Area whereHSU 3A is
unsaturated
10
10
10
50
50
50
50
50
5050
50
100
100
100
100
100
500
500
500
1000
10001000
1000
1000
5
5
5
5
5
1
1
11
1
1
1
1
1
1
5000
W-712
W-1208
Scale: Meters
0 250 500
10
WellTotal VOCisoconcentrationcontour (ppb),dashed whereinferred
Gre
envi
lle R
oad
East AvenueArroyo Seco
Vas
co R
oad
Patterson Pass Road
Rhonewood Subdivision
N
Figure 8-5. Isoconcentration contour map of total VOCs within HSU 3A.

Ground Water Investigation and Remediation 8
LLNL Environmental Report for 1999 8-9
Area whereArea whereHSU 3B is
absent
Area whereHSU 3B is
absent
105
50
50
100
10010
500
500
500
500
1000
5
5
1
1
1
1
1
50
PTU-10
TFA-ETFA
TFB
TFC
TFD
TFD-W
TFE-E
TF406
TFG-1
TF518
TFD-E
TFC-SE
TF5475-1TF5475-2VTF5475
TFD-SE
VTF518
TFE-NW
PTU-10
PTU-4
STU-01TFD-S G
reenville R
oad
East Avenue
Vas
co R
oad
Patterson Pass RoadWell
Total VOC isoconcentrationcontour (ppb), dashedwhere inferred
10
Scale: Meters
0 250 500
Gre
envi
lle R
oad
Arroyo
Seco
N
Figure 8-6. Isoconcentration contour map of total VOCs within HSU 3B.
Treatment Facility D
The Treatment Facility D (TFD) area is located in the northeast quadrant of theLivermore site (see Figure 8-1). Treatment facilities operating in this area include TFD;portable treatment units (PTUs) operating at TFD-East (TFD-E), TFD-West (TFD-W),TFD-South (TFD-S), TFD-Southeast (TFD-SE); and a solar-treatment unit (STU)operating along the south side of the Drainage Retention Basin (DRB). The combinedTFD facilities operated at an average flow rate of 484–590 L/min in 1999. During 1999,these units treated about 226 ML of ground water containing an estimated 88 kg ofVOCs. The STU contributed about 1.9 ML of ground water containing an estimated2.5 kg of VOCs of that total.

8 Ground Water Investigation and Remediation
8-10 LLNL Environmental Report for 1999
Gre
envi
lle R
oad
East Avenue
Vas
co R
oad
Patterson Pass Road
Arroyo Seco
N
10
10
10
50
5010
0
100
500
500
500
1000
1000
5
5
5
1
1
1
1
1000
TFA
TFB
TFC
TFD
TFD-W
TFE-NW
TFE-E
TF406TFG-1TF518
TFD-E
PTU-4
STU-1
TFC-SE
TF5475-1
TFD-SE
VTF518
Area whereHSU 4 is
unsaturated
Area whereHSU 4 is
unsaturated
TFE-E
TF518
TFD-E
TF5475-1
TFD-SE
VTF518
Well
10Total VOC isoconcentrationcontour (ppb), dashedwhere inferred
GSW-445
W-1309
W-1307W-1307W-1307
W-1309
Scale: Meters
0 250 500
Figure 8-7. Isoconcentration contour map of total VOCs within HSU 4.
Fixed and portable facilities operating in the TFD area process VOCs in ground waterusing air stripping, although the STU uses granular activated carbon. The effluent airfrom the air strippers is treated with granular activated carbon prior to discharge to theatmosphere. Treated ground water from TFD and TFD-E is discharged either into theDRB or into an underground pipeline downstream of the DRB weir and flows north-ward to Arroyo Las Positas. Treated ground water from TFD-W is discharged into anearby storm sewer that also empties into Arroyo Las Positas. Treated ground waterfrom TFD-S and TFD-SE is discharged into drainage ditches, each flowing north into theDRB. All TFD facilities were in compliance throughout 1999.

Ground Water Investigation and Remediation 8
LLNL Environmental Report for 1999 8-11
10
50
50
10
100
500
500
5
5
5
10
10
50
1
5
1
1
1
5
55010
1
1
1
1
1
50
5
1,000TFA-E
TFA
TFB
TFC
TFDTFD-W
TFE-NW
TFE-E
TF406
TFG-1
TF518
TFD-E
TFC-SE
TF5475-1
TFD-SE
VTF518
PTU-4 (<12/98location)
STU-01
W-566
W-112
W-1310
W-907
Gre
envi
lle R
oad
East Avenue
Arroyo Seco
Vas
co R
oad
Well
10Total VOCisocon-centrationcontour (ppb),dashed whereinferred
Scale: Meters
0 250 500
N
Figure 8-8. Isoconcentration contour map of total VOCs within HSU 5.
The TFD area extraction wells hydraulically control VOCs in HSUs 2, 3A, 3B, 4, and 5.Distal VOC plumes in the western TFD area should be hydraulically controlled onceplanned TFC-E and TFC-NE treatment facilities are operating, scheduled for June 2002and May 2003, respectively.
Eleven new monitoring or remediation wells were installed and three new sourceinvestigation boreholes were drilled in the TFD area during 1999. Two of those threeboreholes were completed as piezometer wells.
In 1999, one-hour drawdown tests were conducted on TFD area wells W-1502, W-1503,W-1504, W-1510, and W-1550 (Aarons 2000).
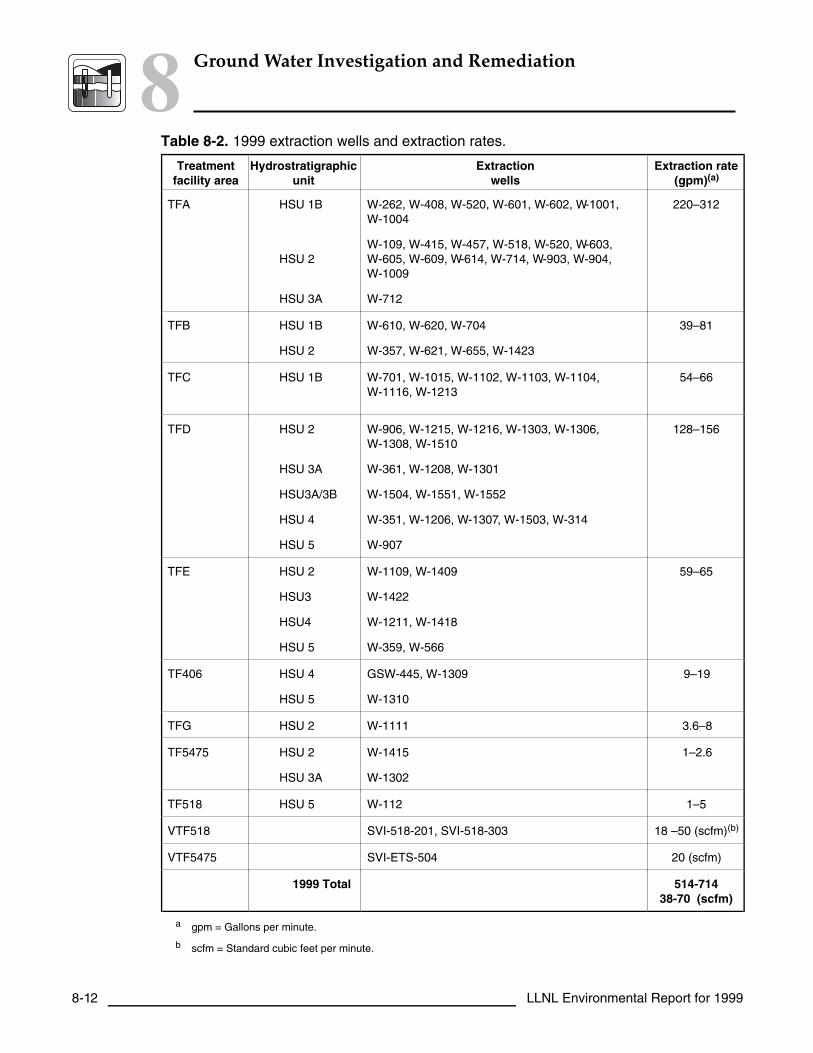
8 Ground Water Investigation and Remediation
8-12 LLNL Environmental Report for 1999
Table 8-2. 1999 extraction wells and extraction rates.
Treatmentfacility area
Hydrostratigraphicunit
Extractionwells
Extraction rate(gpm)(a)
TFA HSU 1B
HSU 2
HSU 3A
W-262, W-408, W-520, W-601, W-602, W-1001,W-1004
W-109, W-415, W-457, W-518, W-520, W-603,W-605, W-609, W-614, W-714, W-903, W-904,W-1009
W-712
220–312
TFB HSU 1B
HSU 2
W-610, W-620, W-704
W-357, W-621, W-655, W-1423
39–81
TFC HSU 1B W-701, W-1015, W-1102, W-1103, W-1104,W-1116, W-1213
54–66
TFD HSU 2
HSU 3A
HSU3A/3B
HSU 4
HSU 5
W-906, W-1215, W-1216, W-1303, W-1306,W-1308, W-1510
W-361, W-1208, W-1301
W-1504, W-1551, W-1552
W-351, W-1206, W-1307, W-1503, W-314
W-907
128–156
TFE HSU 2
HSU3
HSU4
HSU 5
W-1109, W-1409
W-1422
W-1211, W-1418
W-359, W-566
59–65
TF406 HSU 4
HSU 5
GSW-445, W-1309
W-1310
9–19
TFG HSU 2 W-1111 3.6–8
TF5475 HSU 2
HSU 3A
W-1415
W-1302
1–2.6
TF518 HSU 5 W-112 1–5
VTF518 SVI-518-201, SVI-518-303 18 –50 (scfm)(b)
VTF5475 SVI-ETS-504 20 (scfm)
1999 Total 514-71438-70 (scfm)
a gpm = Gallons per minute.
b scfm = Standard cubic feet per minute.

Ground Water Investigation and Remediation 8
LLNL Environmental Report for 1999 8-13
Table 8-3. Wells installed in 1999.
Treatment facility area Hydrostratigraphic unit Monitoring/extraction wells
TFA HSU 1B W-1509, SIP-INF-301, SIP-INF-302
TFB None
TFC None
TFD HSU 2
HSU 3A
HSU 3B
HSU 3A/3B
HSU 4
SIP-ETC-301, SIP-ETC-303,W-1510, W-1512, W-1602
W-1603
W-1511, W-1601
W-1550, W-1551, W-1552,W-1553
W-1523
TFE HSU 2
HSU 3B
HSU 4
HSU 5
W-1506, W-1517, W-1518,SIP-ETS-601, W-1508
W-1522
W-1505, W-1520
W-1507, W-1516
TFG None
TF406 HSU 3A/3B
HSU 5
W-1513, W-1514, W-1515
W-1519
TF518 None
TF5475 HSU 4 W-1604
In 1999, wells at TFD pumped at a combined flow rate of about 518 L/min and treatedabout 226 ML of ground water containing an estimated 88 kg of VOCs. An additionalPTU operated at wells W-1551 and W-1552 from September to December 1999 in theTFD-E area to expedite VOC mass removal and site cleanup near the TFD source area.Wells W-1551 and W-1552 pumped at a combined flow rate of about 17 L/min, andtreated about 2.1 ML of ground water containing an estimated 14 kg of VOCs, which isincluded in the facility annual total.
Treatment Facility E
The Treatment Facility E (TFE) area is located in the southeastern quadrant of theLivermore site (Figure 8-1). In 1999, TFE East (TFE-E) continued treating ground waterusing a PTU. TFE-E is located in the east-central portion of the Livermore site. TFE-NWtreats ground water from extraction wells in HSU 2 and HSU 4 and is located south ofthe Inner Loop Road, immediately west of Southgate Drive. TFE-E and TFE-NW

8 Ground Water Investigation and Remediation
8-14 LLNL Environmental Report for 1999
process ground water for treatment of VOCs using an air stripper, and the effluent airis treated using granular activated carbon to remove VOCs before it is vented to theatmosphere. Treated ground water from TFE-E is discharged into a drainage ditch thatflows north into the DRB. Treated ground water from TFE-NW is discharged into astorm drain that flows north into Arroyo Las Positas. TFE-E and TFE-NW were incompliance throughout 1999.
In the TFE area, the TFE-E extraction wells provide hydraulic containment of someportions of VOC plumes in HSUs 2, 4, and 5. The VOC plumes in HSUs 3A, 4, and 5,located in the western and southern TFE areas, should be hydraulically controlled oncethe TFE-SW, TFE-SE, and TFE-W treatment facilities are operating. The planned start-up dates for these treatment facilities are June 2000, and January and April 2001,respectively.
In 1999, wells at TFE pumped at a combined flow rate of about 227 L/min and treatedabout 108 ML of ground water containing an estimated 38 kg of VOCs. An additionalPTU operated at wells W-1418 and W-1422 from January to December 1999 in the TFEarea to expedite VOC mass removal and site cleanup. Wells W-1418 and W-1422pumped at a combined flow rate of about 49 L/min and treated about 24.5 ML ofground water containing an estimated 13 kg of VOCs, which is included in the facilityannual total.
Ten new wells were installed in the TFE area during 1999. Also, two additional PTUsoperated in the TFE area during 1999. PTU-4 continued to operate at wells W-1418(HSU 4) and W-1422 (HSU 3B) in the northern part of the TFE area to expedite VOCmass removal and site cleanup.
PTU-10 operated at TFE-SE extraction well W-359 (HSU 5) from March to June 1999.During 1999, well W-359 pumped at an average flow rate of about 37 L/min, andPTU-10 treated about 4.9 ML of ground water containing an estimated 2.9 kg of VOCs,which is included in the facility annual total.
Treatment Facility G
Treatment Facility G (TFG) is located in the south-central portion of the Livermore site(Figure 8-1). Treatment Facility G-1 (TFG-1) is located near Avenue B, about 90 m northof East Avenue. TFG-1 treats ground water for VOCs and chromium(VI). Under thecurrent RWQCB discharge substantive requirements, water from TFG-1 requires treat-ment for chromium(VI) only during the winter months. Treated ground water fromTFG-1 is discharged to a storm drain located about 50 ft north of TFG-1, which emptiesinto Arroyo Seco. No boreholes or wells were drilled, and no hydraulic tests wereconducted in the TFG area during 1999.

Ground Water Investigation and Remediation 8
LLNL Environmental Report for 1999 8-15
Before May 1999, TFG-1 processed ground water for VOC treatment using an airstripper, and the effluent air was treated using GAC to remove VOCs before they werevented to the atmosphere. In May 1999, the PTU at TFG-1 was replaced by a GACtreatment unit (GTU). A year-long treatability study conducted in 1998 and 1999demonstrated that the GAC treatment was effective in the efficient removal of VOCsfrom TFG area ground water. Three 400-lb GAC canisters in series are used to processthe water from well W-1111 from HSU 2 (Figure 8-4). Ground water is no longer treatedfor chromium(VI) because concentrations from March 1997 through November 1999 hadconsistently been below the discharge limit of 22 ppb.
TFG-1 was in compliance with all permits from January to October 1999. The TFG-1effluent chloroform concentrations in November and December were 6.7 and 49 ppb,respectively, exceeding the discharge limit because the GAC filters exceeded theircapacity to contain contaminants. The carbon in the unit was replaced and subsequentsamples were nondetect for chloroform.
Treatment Facility 406
Treatment Facility 406 (TF406) is located east of Southgate Drive near East Avenue inthe south-central part of the Livermore site. TF406 treats ground water to remove VOCsusing an air stripper. The effluent air is passed over granular activated carbon toremove VOCs before it is vented to the atmosphere. All treated ground water wasdischarged to a storm drain that flows to Arroyo Las Positas. TF406 was in compliancethroughout 1999.
TF406 processed ground water from extraction wells GSW-445, W-1309, and W-1310.
Passive bioremediation to remediate fuel hydrocarbons continued in the TF406 areaduring 1999 in HSUs 3A and 3B. Active ground water extraction and treatment forresidual dissolved fuel hydrocarbons at Treatment Facility F was discontinued in 1996with regulatory agency concurrence (San Francisco Bay Regional Water Quality ControlBoard 1996).
The TF406 extraction wells provide significant hydraulic control of VOC plumes inHSUs 4 and 5 near the TF406 facility. The VOC plumes in HSUs 3A, 4, and 5 shouldbe hydraulically controlled throughout the TF406 area once treatment facilities atTF406-NW and TF518-N are installed in January 2000 and 2002, respectively. Four newwells were drilled and completed at TF406 during 1999 (Table 8-3).
During 1999, TF406 operated at an average flow rate of 60 L/min, treating more than26 ML of ground water containing an estimated 1.0 kg of VOCs (see Table 8-2). Since

8 Ground Water Investigation and Remediation
8-16 LLNL Environmental Report for 1999
system startup in 1996, TF406 has treated about 28 ML of ground water and removedabout 1.0 kg of VOC mass from the subsurface (see Table 8-1).
During 1999, DOE/LLNL began evaluating electro-osmosis for remediating VOCs infine-grained, low-permeability sediments. The TF406 area was chosen as a test locationbecause prior characterization indicated the presence of good candidate lithologicsequences. Initial testing was conducted to determine design parameters (e.g., electrodespacing, voltage gradients), to evaluate operational issues (e.g., control of high pH andhydrogen gas at the cathode), and to measure electrochemical properties of the soil (e.g.,electrical and electro-osmotic conductivity). The results of this work will be used forsubsequent analysis and modeling necessary to evaluate electro-osmosis for potentialdeployment at LLNL. A report summarizing the results of the qualifications phase testswas issued in December 1999 (McNab 1999).
Ground Water Treatment Facility 518
Treatment Facility 518 (TF518) is located in the southeastern quadrant of the Livermoresite, north of East Avenue and near Avenue H, adjacent to VTF518 (Figure 8-1). TF518was constructed in 1997 and began operating in January 1998. In 1999, TF518 treatedground water from one extraction well, W-112 (HSU 5).
Sustainable flow rates from well W-112 have decreased steadily during 1999 from about75 L/min to about 3.8 L/min in May 1999. TF518 periodically shut down during 1999because of lack of sustainable flow and low water level conditions within well W-112.Hydraulic data indicate that the cumulative pumping from HSU 5 wells at TF406, TFE,and TF518 has significantly lowered ground water levels in the southeastern portion ofthe Livermore site and reduced yields observed in well W-112.
In July 1998, MTU-1 was activated in the TF518 area, replacing the PTU that had proc-essed ground water there since January 1998. The MTU processes ground water forVOC treatment using an air stripper, and the effluent air is treated using GAC to removeVOCs prior to venting to the atmosphere. All treated ground water is discharged to astorm drain located about 250 ft north of TF518 that empties into Arroyo Las Positas.TF518 was in compliance with all permits throughout 1999.
During 1999, TF518 operated at an average flow rate of 7.6 L/min and treated about3.6 ML of ground water from well W-112 containing an estimated 0.2 kg of VOCs (seeTable 8-2). Since the facility started up in January 1998, TF518 has processed more than14 ML of ground water containing an estimated 1.2 kg of VOCs (see Table 8-1). Noboreholes or wells were drilled in the TF518 area during 1999. A step-drawdown testwas conducted on proposed TF518-N extraction well W-1410.

Ground Water Investigation and Remediation 8
LLNL Environmental Report for 1999 8-17
A two-month recovery test was conducted on HSU 5 wells in the southwestern corner ofthe Livermore site to evaluate the effects of dewatering by extraction and recharge inthis hydrostratigraphic unit. Between July 15 and September 7, 1999, the pumps in allHSU 5 extraction wells at the Livermore Site were shut off, and the rate of ground waterrecovery was observed in both the extraction wells and in surrounding HSU 5 monitorwells. While the rate of recovery at extraction wells W-1310 (TF406) and W-566 (TFE-E)and adjacent observation wells performed as expected by recovering at a relatively fastrate when pumping ceased, recovery in well W-112 (TF518) and surrounding monitorwells was very slow. The cause for this apparently was a lack of available ground waterin the vicinity. The impact of the dewatering on the cleanup of the TF518 area iscurrently being evaluated.
PTU-10 was operated at proposed TF518-N extraction well W-1410 (HSU 3B) inSeptember 1999. During this period, well W-1410 pumped at an average flow rate ofabout 44 L/min, and treated about 0.49 ML of ground water containing an estimated0.1 kg of VOCs. These data are included in the TF518 volume and mass totals, aspresented in Table 8-1.
Vapor Treatment Facility 518
Vapor Treatment Facility 518 (VTF518) is located in the southeastern quadrant of theLivermore site. Soil vapor is extracted from the vadose zone, and VOCs are removedfrom the vapor using granular activated carbon canisters. Following treatment, theeffluent air is discharged to the atmosphere. VTF518 was in compliance with the BayArea Air Quality Management District (BAAQMD) permit throughout 1999.
Two instrumented membrane system (IMS) sampling/monitoring wells, SEA-518-301and SEA-518-304, continue to monitor vadose zone remediation in the VTF518 area.The IMS system is used to collect vapor pressure, soil temperature, soil moisture, andsoil vapor concentration data at various discrete depths.
During 1999, VTF518 operated at an average flow rate of 1.4 m3/min, treating about101,952 m3 of vapor containing an estimated 13.1 kg of VOCs (see Table 8-2). Sincesystem startup in 1995, VTF518 has treated about 418,258 m3 of vapor and removedabout 147 kg of VOC mass from the subsurface (see Table 8-1).
Treatment Facility 5475
The Treatment Facility 5475 (TF5475) area is located in the east-central portion of theLivermore site where tritium and VOCs are present in HSU 3A ground water in concen-trations above the MCL. TF5475-1, which was activated in September 1998, uses down-hole, in situ catalytic reductive dehalogenation (CRD) to treat VOCs in ground water.

8 Ground Water Investigation and Remediation
8-18 LLNL Environmental Report for 1999
This technology is based upon the reaction of dissolved hydrogen on a palladium-alumina catalyst to form ethane, methane, and chloride. Because of the high CRDreaction rates, water is treated in one pass through the unit, and the treatment unit canbe placed in the well casing. This technology treats VOCs in ground water whilekeeping the tritium in the subsurface.
The CRD unit operates in extraction well W-1302, a dual-screened well in which the unitextracts ground water from the lower screened interval and injects treated ground watercontaining tritium into the upper screened interval. The required destruction efficiencyis 90% or higher. The unit’s destruction efficiency at TF5475-1 was 80% in April becauseof low hydrogen supply. The hydrogen supply cell was replaced and the unit’s destruc-tion efficiency improved. TF5475-2 was in compliance throughout 1999. One new wellwas drilled and completed at TF5475 during 1999 (see Table 8-3).
TF5475-2 employs an STU that uses a direct-current- (DC-) powered pump to extractground water and a series of aqueous-phase GAC canisters for treatment. Treatedground water from TF5475-2 is discharged into a storm sewer that flows north into theDRB, and eventually into Arroyo Las Positas. TF5475-2 was in compliance throughout1999 although anomalous data were reported in June and July that indicated break-through of VOCs from the carbon. Subsequent samples from the same carbon indicatedno detectable VOCs. The effluent water was collected into a storage tank until thesamples were analyzed and results indicated no detectable VOCs in the effluent.
Vapor Treatment Facility 5475
Vapor Treatment Facility 5475 (VTF5475) is located on the northern side of Trailer T5475in the east-central portion of the Livermore site, and it treats soil vapor from vadosezone well SVI-ETS-504 (see Figure 8-1). VTF5475 began operation on January 21, 1999,ahead of the January 29, 1999, Remedial Action Implementation Plan (RAIP) milestonedate.
Soil vapor is extracted from the vadose zone using a vapor extraction system and isprocessed using GAC. Because of elevated tritium concentrations in the vadose zone,VTF5475 has been designed as a closed-loop system. Following removal of VOCs fromthe process air stream, the tritiated vapor is reinjected into the subsurface at soil vaporinlet well SVI-ETS-505. Because no effluent vapor from VTF5475 is released to theatmosphere, BAAQMD has granted the facility a letter of exemption for 24-houroperation.
Since system startup in 1999, VTF5475 has operated at an average flow rate of0.6 m3/min and treated about 59,472 m3 of vapor containing an estimated 95 kg ofVOCs (see Table 8-2).

Ground Water Investigation and Remediation 8
LLNL Environmental Report for 1999 8-19
Two IMS sampling/monitoring wells, SEA-ETS-506 and SEA-ETS-507, are used tomonitor vadose zone remediation in the VTF5475 area. The IMS system is used tocollect vapor pressure, soil temperature, soil moisture, and soil vapor concentration datafrom various discrete depths.
Ground Water Flow and Transport Modeling
Ground water flow and transport models are used at the Livermore site to supportremediation system design and performance evaluation; to support ongoing subsurfacecharacterization activities; and to improve LLNL’s ability to forecast, monitor, andinterpret the progress of the ground water remediation program. In 1999, developmentcontinued on our three-dimensional ground water model for the Livermore site. Thethree-dimensional model builds vertical resolution into the two-dimensional modelpreviously developed for the Livermore site (Tompson et al. 1995).
Treatment Facility A and B Model
In 1999, LLNL continued to use the three-dimensional ground water flow and con-taminant transport model of HSUs 1B and 2 to evaluate perchloroethene (PCE) andtrichloroethene (TCE) transport in the TFA, TFB, TFC, and TFG areas. The developmentof this model is described in detail in Demir et al. (1997) and Vogele et al. (1996). Thismodel, developed using the CFEST (Coupled Flow, Energy and Solute Transport)computer code (Gupta et al. 1987), was calibrated to measured ground water elevationdata collected from Livermore site monitoring wells.
Environmental Impact
Notable results of VOC analyses of ground water received from January throughDecember 1999 are discussed below. Figures 8-3 through 8-8 are isoconcentration mapsfor total VOCs underlying the Livermore site and vicinity within HSU 1B, HSU 2,HSU 3A, HSU 3B, HSU 4, and HSU 5, respectively.
The HSU 1B off-site VOC plume contours greater than the MCL of 5 ppb cover an areaof approximately 20 acres. This is approximately one-third of its size in 1989 when ourfirst ground water treatment facility began operating. The size of the HSU 2 off-siteVOC plume over the MCL shows a reduction of 40 percent since 1989 and currentlycovers an area of about 62 acres.

8 Ground Water Investigation and Remediation
8-20 LLNL Environmental Report for 1999
During the most recent sampling events, the highest VOC concentration in an HSU 1Boff-site well was 15.4 ppb in November 1999 at well W-1425. The highest VOCconcentration in an HSU 2 off-site well was 40.4 ppb in well W-903 in October 1999.
Overall, the Livermore site VOC plumes have remained relatively stable with respect tosize in 1999, and changes in VOC concentrations are mostly observed in response toactive ground water extraction. Concentrations in the HSU 1B, 2, and 3A VOC plumesalong the western margin of the Livermore site in the TFA, TFB, and TFC areascontinued to decline in response to ground water extraction. VOC concentrations nearthe source area east of TFA continue to decline. Total VOC concentrations at extractionwell W-254 declined from 195 ppb in January 1998 to 125 ppb in October 1999. At TFA,off-site VOC plume contours greater than the MCL of 5 ppb are estimated to cover anarea of approximately 7 acres in HSU 1B and 42 acres in HSU 2.
In the TFD area, VOC concentrations in parts of HSU 2 continue to decline in response topumping the TFD extraction wells. VOC concentrations in HSU 2 extraction well W-906have decreased from 789 ppb in 1995 to 104 ppb in October 1999. In HSU 2 monitor wellW-355, VOC concentrations have decreased from concentrations that were consistentlyabove 1000 ppb prior to pumping at well W-906 to 58 ppb in November 1999.
Prior to pumping in the TFD-E area, high VOC concentrations (in the 5000 to 7000 ppbrange) were observed in HSU 3A/3B wells W-1551 and W-1552. After three months ofground water extraction from these two wells, VOC concentrations have remainedconsistently above 5000 ppb. Well W-1551 has the highest VOC mass removal rate,accounting for 7.7% of the total VOC mass removed from the entire site by ground waterextraction.
In the TF518 area, the off-site HSU 5 VOC plume has shown significant decreases inVOC concentrations since pumping started at the TF406 and TF518 facilities in August1996 and January 1998, respectively. Total VOC concentrations in off-site monitorwell W-219 declined from 114 ppb in October 1997 to 3 ppb in October 1999.
In the TFE-SE area, LLNL conducted a pilot long-term pumping test for distal plumecapture and VOC mass removal at proposed TFE-SE extraction well W-359 betweenMarch and June 1999. VOC concentrations in well W-359 increased from 326 ppb inMarch to 1395 ppb in October 1999. These data indicate that well W-359 is wellpositioned to capture VOCs from source areas to the south.
In the TFE-E area, VOC concentrations in well W-1109 decreased from 1744 ppb inJanuary 1998 to 787 ppb in October 1999. Ground water extraction rates from wellW-1109 increased from 2.5 to 8.8 gpm in 1999 in response to well redevelopment.

Ground Water Investigation and Remediation 8
LLNL Environmental Report for 1999 8-21
In the TFE-SE area, the initial total VOC concentration in newly installed HSU 2piezometer SIP-ETS-601 was 1874 ppb. This high concentration confirms the presenceof a source area that had been indicated on isoconcentration maps.
Site 300 CERCLA Project
Environmental investigations and cleanup activities at Site 300 began in 1981. Site 300became a CERCLA/Superfund site in 1991, when it was placed on the NationalPriorities List (NPL). The CERCLA environmental restoration study areas are shownin Figure 8-9. The major contaminants of concern are listed in Table 8-4.
Table 8-4. Major contaminants of concern found in soil, rock, and ground water atSite 300.
Study area Contaminant of concern
General Services Area (GSA) VOCs (primarily TCE)
Building 834 Complex VOCs (primarily TCE),organosilicate oil, nitrate
High Explosives Process Area VOCs (primarily TCE)HE(a) (primarily HMX[b])
Nitrate, perchlorate
East and West Firing Areas (EFA/WFA) TritiumDepleted uraniumVOCs (primarily TCE and Freon-113)Nitrate, perchlorate
Building 854 VOCs (primarily TCE)
Nitrate, perchlorate
Pit 6 VOCs (primarily TCE)
Tritium, nitrate, perchlorate
Building 832 Canyon VOCs (primarily TCE)
Nitrate, perchlorate
a HE = high explosives.
b HMX = octahydro-1,3,5,7-tetranitro-1,3,5,7-tetrazocine.

8 Ground Water Investigation and Remediation
8-22 LLNL Environmental Report for 1999
Scale: Kilometers
Site 300 perimeter
Study area boundary
Access road
Building 834Complex
Study Area
N
0 1 2
Pit 6Study Area
Building 854Study Area
East and West Firing Area(EFA/WFA) Study Area
Building832
Canyon StudyArea
GSAStudy Area
ExplosivesExplosives Process Area Process Area
Study AreaStudy Area
High Explosives
Process AreaStudy Area
Figure 8-9. Environmental restoration study areas at Site 300.
Geology of Site 300
Site 300 is located in the sparsely populated Altamont Hills, which are part of the CoastRanges Physiographic Province and separate the Livermore Valley to the west from theSan Joaquin Valley to the east. Site 300 stratigraphy is shown in Figure 8-10. Rocksexposed in the region are classified into three groups:
• Late Tertiary-Quaternary (0–5 million years ago)—alluvium andsemilithified sediments, mainly of continental origin.
• Early to late Tertiary (5–65 million years ago)—shallow marine andcontinental sedimentary and volcaniclastic rocks.

Ground Water Investigation and Remediation 8
LLNL Environmental Report for 1999 8-23
• Jurassic-Cretaceous (65–180 million years ago)—Great Valley sequence(marine sedimentary rocks and ophiolites) and Franciscan Complex(sheared and variably metamorphosed sedimentary and igneous rocks).
Distinctive blue-gray to brown weathering volcaniclastic sandstone and sandy siltstone,interbedded with light gray weathering tuffaceous claystone and conglomerate, areexposed extensively within Site 300. These rocks are mapped as the late Miocene NerolyFormation (Huey 1948; Dibblee 1980). The Neroly Formation is also present in thesubsurface beneath the southeastern portion of Site 300.
Geologicalperiod
HolocenePleistocene Qt Qal/Qls
Tps
Tnbs2
Tnbs0
Tnsc2
Sandstone and siltstone
Sandstone and siltstone
Unconsolidated sediments
Siltstone and claystone
Sandstone and conglomerate
Siltstone and sandstone
Shelf and slope deposits
Turbidites
Ophiolites
Cierboformation
Teslaformation
Great Valleysequence
Tnsc1
Tnbs1
Tmss
CoalTts
Kgv
Jkf Franciscancomplex
Pliocene
Late
Mid
Mid
Miocene
EoceneLate Paleocene
LateCretaceous
LateJurassic
Stratigraphic units
Qu
atTe
rtia
ry
San
Pab
lo G
rou
p Neroly formation (Tn)
Figure 8-10. Site 300 stratigraphy (Webster-Scholten 1994).

8 Ground Water Investigation and Remediation
8-24 LLNL Environmental Report for 1999
The Neroly Formation is the principal hydrologic unit within Site 300 and has thereforebeen the focus of the detailed geologic and hydrogeologic studies conducted duringrecent years (summarized in the Final Site-Wide Remedial Investigation Report, LawrenceLivermore National Laboratory Site 300, hereafter referred to as the Final SWRI Report[Webster-Scholten 1994]). The complete section of the Neroly Formation is about 150 mthick beneath Site 300.
The floodplain of Corral Hollow Creek lies along the southern boundary of Site 300 andborders portions of the General Services Area (GSA), the High Explosives Process Area,and the area of closed landfill Pit 6. Floodplain alluvium consists dominantly of coarsecobble and boulder-bearing terrace gravel derived from sources to the south, with lensesand local cappings of sandy silt and silty clay.
The bedrock sequence within Site 300 has been slightly deformed into several gentle, low-amplitude folds. The locations and characteristics of these folds, in combination with theregional fault and fracture patterns, locally influence ground water flow within the siteand have therefore been studied in great detail as part of the CERCLA investigations.
Hydrogeology of Site 300
Site 300 is semiarid, with an average annual rainfall of 27 cm (10.5 in). The site isunderlain by gently dipping sedimentary bedrock dissected by steep ravines. Thebedrock comprises interbedded conglomerates, sandstones, siltstones, and claystones(see Figure 8-10).
Ground water primarily occurs in the Neroly Formation upper and lower blue sandstoneunits (Tnbs2 and Tnbs1) and in the underlying Cierbo Formation (Tmss). Ground watercan also be present in permeable Quaternary alluvium valley fill (Qal) during the winterrainy season. Some ground water is present as perched water-bearing zones beneathhilltops. The perched water-bearing zones primarily occur in the unconsolidated sedi-ments of the Miocene-age nonmarine unit (Tps) in the Building 833 and 834 areas and inthe Explosives Process Area. However, an extensive perched water-bearing zone occursin Tnbs1 sandstones in the northwestern portion of the East and West Firing Area. Fine-grained siltstone and claystone interbeds in Tnbs1 and Tmss act as aquitards, confininglayers, or perching horizons. Portions of the bedrock section at Site 300 are abundantlyfractured, and thus much of the ground water flow occurs in fractures as well as in pores.Ground water is present under confined conditions in the southern half of the site but isgenerally unconfined elsewhere. Figure 8-11 is a map of the potentiometric surface forthe first continuous water-bearing zone at Site 300, which principally occurs in the Nerolylower blue sandstone aquifer (Tnbs1).

Ground Water Investigation and Remediation 8
LLNL Environmental Report for 1999 8-25
Corral Hollow Road
Livermore
Tracy
N
420
?
?
0 1600800
Scale: Meters
Ground water elevation contour(meters above mean sea level)
Ground water elevation contourDashed where approximate
Ground water elevation contourQueried where uncertain
?
Site 300 perimeter
Surface elevation contour(meters above mean sea level)
150
150
160
160
17017
0180
180
190
200
200
190
210
21028
0
290
300
290
310320
330340
350360370
390380370410
400
430 366
366
366
366
305
305
305
305
305
245
245
245
245
245
183
427
427
305
305
Figure 8-11. Approximate ground water elevations in the principal continuous water-bearing zone atSite 300.

8 Ground Water Investigation and Remediation
8-26 LLNL Environmental Report for 1999
Recharge occurs where saturated alluvial valley fill is in contact with underlyingpermeable bedrock, and where bedrock strata crop out. Local recharge occurs onhilltops, creating the perched water-bearing zones in the Building 832, 834, and 854areas. Low rainfall, high evapotranspiration rates, steep topography, and interveningaquitards generally preclude direct vertical recharge to the deeper bedrock aquifers.
Ground water flow in the bedrock follows the inclination, or dip, of the layers. Thetectonic forces that uplifted the Altamont Hills faulted, gently folded, and tilted theonce-horizontal sedimentary strata. A major structure, the east-west trending Pattersonanticline, occupies a central location within the site. North of the anticline, bedrock dipseast-southeast, and ground water flows generally east-northeast. South of the anticline,bedrock dips south-southeast, and thus ground water flows roughly south-southeast.
The Cierbo Formation (Tmss) is saturated beneath Doall Ravine, the Building 851 and854 areas, and the southern part of the East Firing Area. The Tmss unit is unsaturated ordoes not otherwise yield water to wells in other parts of the East and West Firing Areas.The thickness of the Cierbo Formation is not well known because most boreholes are notdeep enough to completely penetrate this formation. Some of the deeper wells in theGSA penetrate the uppermost Tmss. The continuity of saturation in the Tmss betweenthe northwest and southeast areas of Site 300 is undetermined. Ground water in theTmss occurs under unconfined to artesian conditions.
The Tps unit is the youngest bedrock unit identified at Site 300 and is generally presentonly on hilltops. Where present, ground water is typically perched, discontinuous, andephemeral. The exception to this condition exists in the Explosives Process Area, wherethe extent of saturation in Tps sediments is significant. Ground water in the Tps unit isgenerally unconfined, although water under confined conditions does occur locally.
Quaternary alluvium (Qal) is present as valley fill in ravines throughout Site 300, but issaturated only in the Corral Hollow Creek stream channel, in Doall Ravine in the WestFiring Area, and in southern Elk Ravine in the East Firing Area near a spring. SaturatedQuaternary terrace alluvium deposits (Qt) are present at Pit 6, in the GSA, and in theBuilding 832 Canyon area; some of these ground water occurrences are ephemeral.Small quantities of ground water are present in some local landslide (Qls) deposits.
All ground water contaminant plumes at Site 300 occur in Neroly Formation (Tn)rocks, unamed Pliocene nonmarine sediments (Tps), or unconsolidated Quaternarysediments (Qal , Qls, or Qt) stratigraphic units. The extent of ground water contam-ination at Site 300 is shown on Figure 8-12.

Ground Water Investigation and Remediation 8
LLNL Environmental Report for 1999 8-27
Study Area Highlights and Activities
Background information for LLNL environmental characterization and restorationactivities at Site 300 can be found in the Final Site-Wide Remedial Investigation Report,Lawrence Livermore National Laboratory Site 300 (Webster-Scholten 1994). In 1999, LLNLsubmitted the Draft Final and Final Site-Wide Feasibility Study for Lawrence LivermoreNational Laboratory Site 300 (Ferry et al. 1999c) and the Draft Final Proposed Plan forEnvironmental Cleanup at Lawrence Livermore National Laboratory Site 300 (Dresenet al. 1999).
Background and activities for each of the study areas are described in the followingsections. Ground water remediation for Site 300 is discussed in more detail later in thischapter. See Chapter 9 for a discussion of 1999 ground water monitoring.
General Services Area
In the General Services Area (GSA), past leaks of solvents from storage areas and otherfacilities have resulted in several plumes of VOCs in ground water. Two ground waterTCE plumes and two corresponding treatment facilities are present at both the easternand central GSA. The VOC ground water plume in the eastern GSA is present in streamchannel alluvium (Qal) at 3–9 m below ground surface; the plume, as defined by thedetection limit, is about 183 m long (Figure 8-13). Ground water in the alluvium flowsdown Corral Hollow Creek, east and northeast. Maximum fourth quarter 1999 total VOCground water concentrations from eastern GSA monitoring wells were 10 ppb. The Qalis hydraulically connected to the Neroly Formation lower blue sandstone (Tnbs1) unit.
The two VOC ground water plumes in the central GSA are present in terrace alluvium(Qt) and Neroly Formation upper blue sandstone (Tnbs2), at a depth of 3–9 m belowground surface. These VOC plumes are about 170 m and 350 m long (Figure 8-14).Maximum fourth quarter 1999 total VOC alluvial ground water concentrations were1100 ppb. Deeper regional ground water also contains total VOCs at a maximum fourthquarter 1999 concentration of 20 ppb. This ground water occurs at depths of 11−56 mbelow ground surface.
Details of current and planned environmental restoration activities at the GSA aresummarized in the Final Remedial Design document (Rueth et al. 1998). The remedialdesign document includes the Contingency Plan and Compliance Monitoring Plan forthe GSA operable unit (OU).

8 Ground Water Investigation and Remediation
8-28 LLNL Environmental Report for 1999
N
0 300
Scale: Meters
Pit 6 Study Area
Pit 6
0 300
Scale: Meters
Building 854 Study Area
Building 854
0 300
Scale: Meters
Building 850Firing Table
Pits 3,5 & 7
Building 851Firing Table
Building 801Dry Well& Pit 8
EFA/WFA Study Area
Site 300 perimeter
Tritium
Uranium-238
Volatile organic compounds
Nitrate
Perchlorate
High explosive compounds
Access road
Scale : Meters
0 600
Figure 8-12. Extent of ground water contamination at Site 300.

Ground Water Investigation and Remediation 8
LLNL Environmental Report for 1999 8-29
N
Building 815,HE Lagoons
Building833
Building 832
Building 832 Canyon &High Explosives Process Area Study Areas
High ExplosivesBurn Pit
0 300
Scale: Meters
Building 830Building 830
EasternGSA
GSA Study Area
Central GSA
0 300
Scale: Meters
Building 834 Complex Study Area
Building834
0 300
Scale: Meters
Scale : Meters
0 600
Site 300 perimeter
Tritium
Uranium-238
Volatile organic compounds
Nitrate
Perchlorate
High explosive compounds
Access road

8 Ground Water Investigation and Remediation
8-30 LLNL Environmental Report for 1999
W-7D*(<0.5) (<0.5)
W-26R-032.5
W-25N-20<0.5
W-25N-011.4
W-26R-11
W-25N-245.7
W-25N-22
W-25N-23
W-25N-08*
<0.5
0.92
(NS)
W-25N-09*
W-25N-15<0.5
W-25N-18*(<0.5)(<0.5)
(<0.5)<0.5
W-25N-12*W-25N-07
W-25N-11*W-25N-10*
W-25N-13*(<0.5)
W-25N-25*(<0.5)CDF-1*
(<0.2)CON-1*CON-2*(<0.2)(<0.5)
W-26R-02
W-26R-04
W-26R-05
W-25N-04*(<0.5)
<0.5
W-25N-21(1.0)
<0.5
W-25N-28
W-25N-05
(0.72)
5.0
W-25N-26*(<0.5)
W-26R-01
W-26R-07NS
NS
10.0
W-26R-06
1.6
7.7
NSW-26R-08
<0.5
<0.5Debris burial
trench area
W-7DS
Corral Hollow Road
Sewage treatment pond
W-25N-061.2
1
1
?
?
55
Monitoring well
Active water-supply well
Site 300 boundary
Total VOC isoconcentrationcontour (µg/L), dashedwhere approximate
10
N
Scale: Meters
0 200100
Figure 8-13. Total VOC concentrations in ground water in the eastern GSA and vicinity(fourth quarter, 1999). Monitor wells are completed in alluvial/shallowbedrock aquifer.
Using the results from several hydraulic tests, LLNL determined that the direction ofplume migration may follow a previously unknown, now subterranean, river bed. Itwas observed in the fall of 1999 that the eastern GSA off-site plume (as defined by the>5 ppb TCE contour line) has been restricted to the Site 300 property. It had previouslyextended more than a mile down the Corral Hollow stream channel toward the City ofTracy, before the treatment facility started up in 1991. We estimate that, through thecontinued efforts of source elimination and hydraulic containment, LLNL will be able toclose the eastern GSA within a few years.
After determining that the eastern GSA VOC plume was restricted to the site, LLNLreconsidered the need for an off-site treatment facility as originally planned for

Ground Water Investigation and Remediation 8
LLNL Environmental Report for 1999 8-31
Sewagetreatment
pond
Corral Hollow Road
Corral H
ollow C
reek
883
878
875
872
874
879
876
873
1010
100
1
1
1
1?
?
?
1,000
Monitoring well
Total VOC isoconcentrationcontour (µg/L), dashedwhere approximate.
Inactive water-supply well
10
N
Scale: Meters
0 10050
Figure 8-14. Total VOC concentrations in ground water in the central GSA (fourth quarter, 1999).Question marks indicate that the contour is unknown. Monitoring wells are completed inthe Qt-Tnsc1 hydrologic unit.
in the Record of Decision, or ROD. Chemical data indicate that trichloroethylene (TCE)concentrations have decreased to below drinking water standards in ground water fromall off-site wells. Based on this information, LLNL has determined that an off-siteextraction and treatment system is not needed or justified. The regulatory agencies haveconcurred that the off-site treatment system milestone could be delayed and the needwould be re-evaluated during the GSA Five-Year Review.

8 Ground Water Investigation and Remediation
8-32 LLNL Environmental Report for 1999
Building 834 Area
The Building 834 facility contains buildings where, in the past, TCE was used as a heattransfer fluid. Several large spills of TCE to the ground resulted in TCE contaminationof a shallow perched water-bearing zone beneath the site. An isolated, discontinuous,perched water-bearing zone occurs in Pliocene non-marine gravels (Tps) and occurs at amaximum depth of 9 m (30 ft) below the center of the complex. This perched zone cropsout on all sides of the hill housing the Building 834 complex and is isolated from theunderlying regional aquifer by more than 90 m of vadose zone. The water-bearing zonecontains maximum 1999 concentrations of TCE and 1,2-DCE of about 94,000 and110,000 ppb, respectively. The resulting VOC plume is about 600 m long (Figure 8-15).Maximum ground water nitrate concentrations are about 205 ppm. A silicate oil (tert-butyl orthosilicate) has been detected at maximum 1999 concentrations of 770,000 ppb.Site characterization was enhanced by surveying the Building 834 area using passive soilvapor monitoring tools (Halden et al. 2000). Currently, ground water and soil vaporextraction and treatment, using air-sparging and GAC, respectively, are in progress.
High Explosives Process Area
The High Explosives Process Area was established in the 1950s to chemically formulate,mechanically press, and machine high explosives (HE) compounds into detonationdevices that are tested in explosives experiments in the East and West Firing Areasof Site 300. Process waste water from HE machining operations containing HMX, RDX,and nitrate was discharged to nine former unlined lagoons at concentrations highenough to impact ground water. A TCE hardstand located near the former Building 815steam plant is considered to be the primary source of TCE ground water contamination.HMX and RDX are the most frequent and widespread HE compounds detected in soiland ground water. TCE, nitrate, perchlorate, and RDX occur in two water-bearing zoneswithin the HE Process Area. These two water-bearing zones occur in Tps sediments andTnbs2 sandstone, respectively. Ground water occurs in these two zones at depths of2−30 m, and 20–76 m, respectively. The VOC (principally TCE) plumes in Tps strata areabout 300 m and 200 m long. The TCE plume in Tnbs2 strata is about 900 m long(Figure 8-16). The RDX plume is about 900 m long. The nitrate plume in Tnbs2 strata isabout 900 m long. The perchlorate plume in Tnbs2 strata is 1500 m long. Current 1999maximum concentrations of TCE, RDX, nitrate, and perchlorate are 160, 100, 102, and33 ppb, respectively. In 1999, a treatment facility (B815-TF1) was installed near theSite 300 boundary to prevent off-site migration of VOCs in ground water. A small plumeof TCE (maximum 1999 concentration of 310 ppb) also occurs in a local perched water-bearing zone that occurs in Tnsc1 strata at a depth of 24−30 m below the HE burn pits;this plume is less than 5 m long. These burn pits were closed and capped under RCRAin 1998.

Ground Water Investigation and Remediation 8
LLNL Environmental Report for 1999 8-33
950900
850
950
900
950
850
1000
1050
1050
1000
1000
1000
1050
G
A
H
D
M
JK
C
F
E B
100
100
100
100
10
10
10
10 ?
10,0
00
10,0
00
10,0
00
1,00
0
1,000
1,00
0
1,000
Building 834Complex
Monitoring well
TCEisoconcentration contour (µg/L)10
00
N
Scale: Meters
0 10050
Figure 8-15. Distribution of total VOCs in ground water in the Qt-Tpsg hydrologic unitat the Building 834 complex (second quarter, 1999).

8 Ground Water Investigation and Remediation
8-34 LLNL Environmental Report for 1999
832 Canyon
50 10
1020
20
20
5
5
5
W-35C-04Gallo-10.66
3
Spring 5
Well 20
Well 6
Well 18
W-6BR
Well 4
Building815
832 Canyon
GSA
Monitoring well
Private water-supply well
TCE isoconcentrationcontour (µg/L)10
0
N
Scale: Meters
0 200100
Figure 8-16. Trichloroethene (TCE) isoconcentration contour map in the Tnbs2 aquiferin the HE Process Area (fourth quarter, 1999).
East and West Firing Areas
Explosives experiments conducted at outdoor firing tables in this area have generatedwastes that in the past were disposed at several unlined landfills. Tritium has beenreleased to ground water from landfill Pits 3 and 5 and the Building 850 firing table(Figure 8-17). Depleted uranium has been released to ground water from landfill Pits 5and 7 and the Building 850 firing table. The resulting plumes occur in a perched water-bearing zone within Qal and Tnbs1. The water-bearing zone occurs at depths of 5–20 mbelow surface. There are two overlapping plumes of tritium in ground water.

Ground Water Investigation and Remediation 8
LLNL Environmental Report for 1999 8-35
Well 8Spring
3704
741
741
741
741
11
37
11
37
Pit 7Pit 3
Pit 5
Building850
Pit 2
Pit 1
Pit 4
Monitoring well
Tritium activityisoconcentrationcontour (Bq/L)
Spring
300
N
0 400200
Scale: MetersMCL – 741 Bq/L,background concentration<11 Bq/L
Figure 8-17. Distribution of tritium in ground water in the first water-bearing zone in theBuilding 850/Pits 3 and 5 area (second quarter, 1999).
The maximum 1999 tritium activity is about 36,963 Bq/L (999,000 pCi/L). The totallength of the commingling tritium plumes is about 3000 m. The perched water-bearingzone is connected to the regional Tnbs1 aquifer at the Elk Ravine Fault. Maximum 1999ground water tritium activities in this aquifer are about 703 Bq/L (19,000 pCi/L). Thereare two smaller plumes of depleted uranium (uranium-238) in ground water, withmaximum 1999 activities of less than 3.7 Bq/L (100 pCi/L). The depleted uranium isconfined to the perched water-bearing zone; the lengths of these two uranium plumesare 370 m and 500 m. Computer modeling of the transport and fate of the tritiumindicates that by the time the tritium and uranium in ground water reach the Site 300boundary, these radionuclides will exist at near-background activity levels.
During 1999, LLNL installed a total of 15 new monitor wells in the East and West FiringArea. Ten of these wells were drilled to define the extent of tritium in ground water andthe effects of the Elk Ravine Fault on ground water flow in the area northeast of the

8 Ground Water Investigation and Remediation
8-36 LLNL Environmental Report for 1999
valley that houses landfill Pits 3, 5, and 7. Ground water tritium activity data fromthese wells indicate that the tritium plume emanating from the pits is somewhat moreextensive than previously thought. The plume is now bounded by wells that sampleground water that contains background tritium activities. The other five wells werecompleted to monitor alluvial ground water in the landfill valley.
To determine the appropriate remediation strategy for the landfills, LLNL is currentlyconducting an evaluation of tritium sources within the landfills and is building a three-dimensional structural model and a finite element model of ground water flow andcontaminant transport. To this end, during 1999, LLNL analyzed 68 samples from16 boreholes for tritium activity and water content. The highest activity found was255,300 Bq/Lsm (6.9 MpCi/Lsm) in a sample of waste from Pit 3.
Although tritium continues to leach into ground water from vadose zone sources atBuilding 850, the long-term trend in total ground water tritium activity in this portion ofthe tritium plume is one of decreasing activity at approximately the radioactive decayrate of tritium. The extent of the 740 Bq/L (20,000 pCi/L) MCL contour for this portionof the plume is shrinking.
During 1999, LLNL began its characterization of Freon-113 at Building 865 (the closedAdvanced Testing Accelerator). Freon-113 was used as a degreasing agent at thefacility. The Freon-113 was originally discovered in ground water samples from wellsin the Pit 1 monitoring network, downgradient and southeast of Building 865. During1999, LLNL completed two wells northeast of Building 865. Maximum Freon-113concentrations in ground water in this area are significantly less than the 1.2 ppm MCLfor Freon-113.
During 1999, LLNL began geological reconnaissance at the Building 812 firing table area.No monitor wells have yet been drilled at Building 812, a firing table where depleteduranium and thorium were used in explosives experiments. However, samples from anadjacent perennial spring indicate depleted uranium signatures. Well drilling will beginat the Building 812 area in 2000.
Several other contaminants in ground water are being investigated by LLNL at the Eastand West Firing Areas. Nitrate and perchlorate in the Building 850/Pits 3 and 5 areasoccur at maximum 1999 concentrations of less than 110 ppm and 5 ppb, respectively.Trace amounts of TCE (less than 3 ppb) are also present in ground water near Pit 5.TCE also occurs in a small ground water plume monitored by two wells at theBuilding 801 firing table.

Ground Water Investigation and Remediation 8
LLNL Environmental Report for 1999 8-37
Depleted uranium isotopic signatures have been detected in ground water samples fromwells adjacent to the Building 851 firing table, indicating that some depleted uranium isreaching ground water.
Building 854 Study Area
Trichloroethene in ground water was previously found to arise principally from leaksin the former overhead TCE brine system at Buildings 854E and 854F. Trichloroethene,nitrate, and perchlorate occur in ground water in the Building 854 area in NerolyFormation Tnbs1 strata at maximum 1999 concentrations of 270 ppb, 200 ppm, and16 ppb, respectively. The affected aquifer occurs at depths of 9–50 m below groundsurface. The TCE plume is about 970 m long (Figure 8-18).
During 1999, LLNL continued to define the extent of TCE in ground water. Four newmonitor wells were installed. On April 1, 1998, LLNL submitted the CharacterizationSummary Report for the Building 854 Operable Unit (Ziagos and Reber-Cox 1998c) to theregulatory agencies. On May 28, 1998, LLNL submitted to the regulatory agencies aletter detailing the CERCLA pathway for the operable unit (U.S. Department of Energy1998d). LLNL installed and began operating a solar-powered portable treatment unit atBuilding 854 to treat extracted ground water containing VOCs. A second treatment unitwill be installed in the future. Several additional wells will be installed during thesummer of 2000.
Pit 6 Area
A small ground water TCE plume in a perched terrace alluvium (Qt) water-bearingzone discharges to the surface at small springs at the southeastern edge of the Pit 6area. The perched water-bearing zone occurs at depths of 0–11 m below groundsurface. The source of the TCE plume is the southeast corner of the Pit 6 landfill. TheTCE plume is about 200 m long (Figure 8-19). Concentrations of VOCs in the plumehave declined by more than tenfold since 1992. Current maximum TCE concentrationsare about 6.3 ppb. Tritium (at maximum activities of 92.5 Bq/L [2500 pCi/L], nitrate(at maximum concentrations of 228 ppm), and perchlorate (at maximum concentrationsof 57 ppb) also occur in the perched water-bearing zone. The lengths of the tritium andperchlorate plumes are 200 and 400 m, respectively. During 1997, a 2.4-acre engineeredcap was constructed over the landfill as a CERCLA nontime-critical removal action.During 1998, the Post-Closure Plan (Ferry et al. 1998) for the Pit 6 cap was submitted tothe regulatory agencies.

8 Ground Water Investigation and Remediation
8-38 LLNL Environmental Report for 1999
C
BA
A
B
C
G
H
J
ED
F
V
Building 858
Building 857
A
B
Building 856
Building 855 Complex
100
100
0.5
0.50.5
5
5
100
100
0.5
0.5
5
55
5
Building854 Complex
Spring
Building
Monitoring well
G
TCEisoconcentration contour (µg/L)
5
N
Scale: Meters
0 100 200
Figure 8-18. Distribution of TCE in ground water in the Building 854 area (secondquarter, 1999).
Building 832 Canyon Study Area
At the Building 832 Canyon area (Buildings 830 and 832), solvents were released fromweapons component test cells in the past. TCE and nitrate occur in ground water in Qalalluvium and in Neroly Formation sandstone units within Tnsc1 silty-claystone strata15–25 m beneath the Building 832 Canyon Study Area at maximum 1999 concentrationsof 8000 ppb and 174 ppm, respectively. The TCE plume emanates from both theBuilding 830 and 832 areas and is about 1300 m long (Figure 8-20). Perchlorate has alsobeen detected at a maximum concentration of 51 µg/L. Well drilling during 1999

Ground Water Investigation and Remediation 8
LLNL Environmental Report for 1999 8-39
CarnegieSVRAresidencearea
Carnegie State VehicleRecreation Area (SVRA)Headquarters
Corral Hollow Road 899B899A
Landfill cap
Monitoring well
Intermittent spring
Approximate locations of disposal trenches and animal pits (buried)
Building
Inactive water-supply well
Site 300 boundary
Active water-supply well
TCE isoconcentration contour (µg/L)5
N
Scale: Meters
0 10050
Pond
Site 300boundary
Approximate northern
limit of Carnegie Fault ZoneSpring 15
Spring 7
2
1
3
2
1
3
Location of formerPit 6 fence
0.50.50.5
55
Figure 8-19. Distribution of TCE in ground water in the Pit 6 area (fourth quarter, 1999).
indicated that the TCE contaminant plume and the nitrate in ground water, bothemanating from the Building 832 complex, are likely merging with the TCE and nitratein ground water from the Building 830 area. Perchlorate has also been detected inground water samples from 15 monitor wells in the area.
In 1999, LLNL linked ten wells in the Building 832 complex, near the suspected test cellrelease sites, to the Building 832-TF1 for vapor and ground water extraction and treat-ment and completed construction of the treatment system. LLNL also plans to useinnovative, environmentally friendly (green) technologies to treat ground water in theBuilding 832 Canyon area. A DOE Technology Deployment Initiative (TDI) using ironfilings as a treatment system for TCE is in the design and testing phase.

8 Ground Water Investigation and Remediation
8-40 LLNL Environmental Report for 1999
Route 2
837B
C
D
B
A 836
833835
830
M50
Route 1
Route 1
Equip.Bldg.
B
A
FE
832838C D
M52
Route 2
Route 3
874
871
877870
891A891BT8806
880
844
814
819
820
811 842
T-2
882
55
55
55
0.50.5
0.50.5
0.50.5
0.50.5
1000
1000
100100
100
100
100
1000
GeneralServices
Area
GeneralServices
Area
Building 832 Complex
HE ProcessArea
Monitoring well
TCE isoconcentration contour (µg/L)5
Scale: Meters
0 200100
N
Figure 8-20. Distribution of TCE in ground water in the Building 832 Canyon (fourthquarter, 1999).

Ground Water Investigation and Remediation 8
LLNL Environmental Report for 1999 8-41
Environmental Remediation at Site 300
Dedicated ground water and soil vapor extraction and treatment facilities exist at theeastern GSA, central GSA, and Building 834 areas. During 1999, portable ground watertreatment systems were installed at the Building 815 (HE Process Area) and Building 854areas. A combined soil vapor and ground water treatment system was installed in theBuilding 832 Canyon Area. The central GSA, eastern GSA and Building 815 treatmentfacilities discharge to surface drainage courses. The other treatment systems dischargeto air. Table 8-5 summarizes calendar year 1999 and cumulative totals of volumes andmasses of contaminants removed from ground water and soil vapor at Site 300. Also in1999, treatment facility construction, design, and treatability testing activities continuedat the High Explosives Process Area and the Building 832 Canyon area.
Table 8-5. Volatile organic compounds (VOCs) removed from ground water and soilvapor at Site 300.
1999 Cumulative total
Treatmentarea
Startupdate
Water treated(ML)(a)
VOCsremoved (kg)
Water treated(ML)(a)
VOCsremoved (kg)
General Services Area
Eastern GWTF(b) 1991 79.4 0.26 557.4 5.86
Central GWTF 1993 4.16 1.04 8.96 7.54
Building 834 1995 0.169 5.45 0.584 24.7
Building 815 1999 0.34 0.01 0.34 0.01
Building 832 1999 32.4 0.004 32.4 0.004
Building 854 1999 0.189 0.04 0.189 0.04
Pit 6 1998 —(c) —(c) 0.268 0.0014
Soil vaportreated (m3 )
VOCsremoved (kg)
Soil vaportreated (m3 )
VOCsremoved (kg)
General Services Area
Central 1994 489,078 4.24 1,492,743 64.62
Building 834 1998 390,415 27.58 439,605 34.9
Building 832 1999 3,385.9 0.374 3,385.9 0.374
a ML = 1 million liters.
b GWTF = Ground water treatment facility.
c Pit 6 is not routinely used for ground water treatment. A hydraulic pump test was conducted there in 1998.
General Services Area
The Remedial Design Document for the GSA Operable Units was submitted to the regula-tory agencies in 1998. During 1999, the soil vapor extraction and treatment system in thecentral GSA dry-well source area was consistently operated and maintained to reduce

8 Ground Water Investigation and Remediation
8-42 LLNL Environmental Report for 1999
VOC concentrations in soil vapors, remediate dense nonaqueous-phase liquids in the soil,and mitigate the VOC inhalation risk inside Building 875. The ground water extractionand treatment systems in the central and eastern GSA area were consistently operatedand maintained to reduce VOC concentrations in the ground water to drinking watermaximum contaminant levels (MCLs), prevent further migration of the contaminantplume, and dewater the shallow water-bearing zone in the Building 875 dry-well areato enhance soil vapor extraction. Wells W-7Q, W-7R, W-7S, and W-7T were installedwithin the central GSA as monitor wells. These wells are being considered as possibleextraction wells for the expansion of the ground water treatment facility. Based on theNPDES permit five-year review, sampling requirements were reduced at the eastern GSAgroundwater treatment facility.
The eastern GSA treatment facility employs granular activated carbon (GAC) canistersto remove VOCs from extracted ground water. Extracted central GSA ground water isrun through an air-sparging PTU to remove VOCs. Extracted soil vapor at the centralGSA is run through GAC canisters to remove VOCs.
Ground water treated at the eastern GSA ground water treatment facility was dischargedoff site to Corral Hollow Creek, in accordance with NPDES Permit No. CA0082651.Table 8-5 shows the amount of the water treated and VOCs removed at the eastern GSA.The length of the eastern GSA TCE plume with concentrations over the cleanup standardof 5 ppb (MCL) has been reduced by more than 1400 m. The off-site portion of the plumenow extends 200 m beyond the site boundary. TCE concentrations in influent from theeastern GSA ground water treatment system were reduced from 64 ppb in January 1992to 3 ppb in November 1999. No longer do any off-site wells in the eastern GSA yieldground water TCE concentrations in excess of the cleanup standard of 5 ppb (MCL).LLNL estimates that 2 more years of ground water extraction and treatment will berequired to achieve and maintain ground water VOC concentrations below MCLs at theeastern GSA.
At the central GSA, treated ground water was collected and batch-discharged in aremote Site 300 canyon, in accordance with the substantive requirement for wastewaterdischarge. TCE concentrations in central GSA ground water treatment system (GWTS)influent have been reduced from 9400 ppb in 1993 to 58 ppb in 1999. Volumes of waterextracted and masses of VOCs removed from Central GSA ground water are tabulatedin Table 8-5.
Four quarterly reports were submitted to the EPA and RWQCB in 1999 that detail theperformance of the treatment facilities (Lamarre 1999a, b, c, and d). During 1999, theground water extraction system at the central GSA was expanded to further contain thecontaminant plume, increase mass removal, and eliminate contaminant sources as part
Ground Water Investigation and Remediation 8
LLNL Environmental Report for 1999 8-43
of a regulatory-driven milestone. Two monitoring wells located at known contaminantsources and one monitoring well located downgradient of the source were converted toextraction wells. With the increased flow, the existing treatment system was convertedand upgraded from batch mode to continuous flow operation.
Following dewatering of bedrock through ground water extraction, soil vapor extractionand treatment of VOCs began in 1994. Table 8-5 shows the amounts of soil vaportreated and VOCs removed at the central GSA. From 1994 through the end of 1998,VOC concentrations in the central GSA soil vapor extraction influent stream werereduced from 450 parts per million by volume (ppmv) to 2.3 ppmv. VOC concentrationsin individual central GSA soil vapor extraction wells have also been significantlyreduced.
The central GSA ground water treatment system is operating under substantive require-ments for wastewater discharge issued by the Central Valley RWQCB. The central GSAtreatment facility discharges to bedrock in the eastern GSA canyon, where the waterpercolates into the ground. The eastern GSA ground water treatment system operatesunder NPDES Permit No. CA0082651, issued by the Central Valley RWQCB fordischarges into Corral Hollow Creek. The system operated under WDR91-052 untilDecember 5, 1997, when WDR 97-242 was issued. Permit requirements for the centraland eastern GSA ground water treatment system are listed in Table 8-6. Both thecentral and eastern GSA treatment systems operated in compliance with regulatoryrequirements during 1999. LLNL submitted quarterly reports for the GSA treatmentsystems to the California EPA and the RWQCB in accordance with the NationalPollutant Discharge Elimination System Order No. 97-242 for the eastern GSA and theSubstantive Requirements for Waste Discharge for the Central GSA (Lamarre 1999a,b, c, and d).
With the increased flow caused by the central GSA well field expansion, the existingtreatment system was converted and upgraded from batch mode to continuous flowoperation. An additional interlock was added to stop ground water extraction from allwells with pneumatic and electrical pumps during system shutdown. A new vortexmeter was installed at the soil vapor extraction and treatment system to more accuratelymeasure extracted air flow. A new 1000-gallon polyethylene effluent surge tank withliquid level switches replaced the Baker tank at the central GSA ground water extractionand treatment system.

8 Ground Water Investigation and Remediation
8-44 LLNL Environmental Report for 1999
Table 8-6. General Services Area ground water treatment system surface discharge permitrequirements.
Treatment facility
Parameter Central General Services Area Eastern General Services Area
VOCs Halogenated and aromatic VOCs Halogenated VOCs
Maximum daily 5.0 µg/L 5.0 µg/L
Monthly median 0.5 µg/L 0.5 µg/L
Dissolved oxygen Discharges shall not cause the concentrations ofdissolved oxygen in the surface water drainagecourse to fall below 5.0 mg/L.
Discharges shall not cause the concentrationsof dissolved oxygen in the surface waterdrainage course to fall below 5.0 mg/L.
pH (pH units) Between 6.5 and 8.5, no receiving water alterationgreater than +0.5 units.
Between 6.5 and 8.5, no receiving wateralteration greater than +0.5 units.
Temperature No alteration of ambient receiving water conditionsmore than 3°C.
No alteration of ambient receiving waterconditions more than 3°C.
Place of discharge To ground water during dry weather and to surfacewater drainage course in eastern GSA canyon duringwet weather.
Corral Hollow Creek.
Flow rate 272,500 L (30-day average daily dry weathermaximum discharge limit).
272,500 L per day.
Mineralization Mineralization must be controlled to no more than areasonable increment.
Mineralization must be controlled to no morethan a reasonable increment.
Methods anddetection limits forVOCs
EPA Method 601—detection limit of 0.5 µg/L.
EPA Method 602—method detection limit of 0.3 µg/L.
EPA Method 601—detection limit of 0.5 µg/L.
Building 834 Complex
In 1999, the GWTS was operated at full scale. The system was automated to allow for24-hour operation, in effect switching from a 5-day, 10-hour schedule, to around-the-clock operation for the five weekdays. The soil vapor extraction system tripled themass removal at the site over 1998 by extracting an additional 7 kg of VOCs from thesubsurface. To increase the effectiveness of the treatment system even more, LLNLexpanded the extraction wellfield in 1999 by converting a number of monitoring wellsinto combined ground water and soil vapor extraction wells.
During 1999, there was a 357% increase in overall VOC mass removal over the removalin 1998. During 1998 the combined ground water and soil vapor VOC mass removal atBuilding 834 was 10.93 kg. During 1999, the combined VOC mass removal at Building834 was 39.03 kg, of which 6 kg of VOCs were destroyed by in situ microbially mediated

Ground Water Investigation and Remediation 8
LLNL Environmental Report for 1999 8-45
reductive dehalogenation. The LLNL team working on Building 834 remediationreceived $210,000 in additional funding to study the applicability of in situ bioremedi-ation as a treatment technology (Ziagos et al. 1999). A peer-reviewed publicationreported on the novel microbial process that exploits alkoxysiloxane lubricants asdrivers for TCE bioattenuation at Building 834 (Halden et al. 1999).
Table 8-5 shows the amounts of water treated and VOCs removed at Building 834.Quarterly reports for the Building 834 treatment facility were submitted to the CaliforniaEPA and the RWQCB in accordance with the Substantive Requirements for WasteDischarge (Lamarre 1999e, f, g, and h). Because treated ground water is discharged tomisters and is not discharged to the ground, there are no treatment system surfacedischarge permit requirements for Building 834.
High Explosives Process Area
The final Action Memorandum for the Building 815 Operable Unit Removal Action atLawrence Livermore National Laboratory Site 300 (Ziagos and Jakub 1998) was submittedto the regulatory agencies on August 17, 1998. This report describes the maincomponents of the removal action, estimates removal action costs, and addresses allverbal and written comments submitted by the community during the public workshop.The Building 815 Removal Action Design Workplan for the High Explosives Process Area atLawrence Livermore National Laboratory Site 300 (Ziagos and Reber-Cox 1998a) wassubmitted to the regulatory agencies on November 15, 1998. This report describes theremoval action in more detail and provides a contingency plan to address foreseeableproblems that may arise during this removal action.
Treatability testing began in 1998 to evaluate cost-effective ground water treatmenttechnologies for the second phase of ground water cleanup. Removal and destructiontechnologies are being considered to remediate nitrates and HE compounds, includingperchlorate. These technologies use granular-activated carbon, ion-exchange, or electro-migration for contaminant removal and ex-situ bioremediation for contaminantdestruction. Phytoremediation, using indigenous grasses, is also being evaluated fortreating nitrate-bearing ground water.
In 1999, a ground water treatment facility (B815-TF1) was installed near the Site 300boundary to prevent off-site migration of VOCs in ground water. Using granular-activated carbon, the system pumps and treats water from two existing ground watermonitoring wells. Depending on the performance from these two wells, additionalwells may be added. Table 8-5 shows amounts of water treated and VOCs removed inthe treatment system.

8 Ground Water Investigation and Remediation
8-46 LLNL Environmental Report for 1999
Pit 6 Landfill Area
The volume of water extracted and TCE mass removed during a hydraulic pump test atPit 6 is tabulated in Table 8-5. The test ran from October 11 to December 3, 1998. Thewater was treated at an adjacent portable treatment unit using granular activatedcarbon.
Building 854 Area
In December 1999, a ground water treatment facility (B854-TF1) was installed near theTCE source area at Building 854F as a part of a ground water treatability study. Thefacility uses granular activated carbon to treat ground water and operates under draftwaste discharge requirements. Table 8-5 shows amounts of water treated and VOCsremoved in the treatment system. Treated ground water is misted to air. A secondfacility will begin operation in the future.
Building 832 Canyon
The first step toward TCE mass removal in the operable unit (OU) was completed withthe submittal and acceptance of the Building 832 Canyon OU Treatability StudyWorkplan in November 1997. This workplan set forth plans for ground water and soilvapor TCE extraction and treatment in 1999 and beyond, using portable treatmentunits, solar-powered water activated-carbon treatment units, and soil vapor extractionsystems. Also under consideration is the use of a subsurface iron filings permeablereactive treatment wall in the lower canyon area to intercept the TCE-laden groundwater, destroy the TCE and degradation products, and help control the migration of theTCE plume off site. In October 1999, the Building 832 Canyon ground water and soilvapor treatment system, B832-TF1, began continuous operation. This facility isoperating under draft waste discharge requirements. Table 8-5 shows volume of watertreated and mass of VOCs removed in the treatment system. The treated water isdischarged into the canyon.
Community Relations
During 1999, LLNL met three times with members of Tri-Valley Citizens Against aRadioactive Environment and their technical advisor as part of the activities funded byan EPA Technical Assistance Grant. A public workshop for the Draft Site-Wide FeasibilityStudy (Ferry et al. 1999) was held on March 23, 1999. A public workshop for the DraftSite-Wide Proposed Plan (Dresen et al. 1999) was held on December 30, 1999.

9
LLNL Environmental Report for 1999 9-1
Ground Water Monitoring
Eric ChristoffersonRichard A. Brown Sandra Mathews
Introduction
Lawrence Livermore National Laboratory regularly samples and analyzes groundwaters in the Livermore Valley and in the Altamont Hills. LLNL maintains multipleground water monitoring programs to comply fully with environmental regulations,U.S. Department of Energy (DOE) orders, and the requirements of the Ground WaterProtection Management Program (GWPMP). The objectives of the ground watermonitoring programs described in this chapter are to measure compliance with wastedischarge requirements and post-closure plans and to assess the impact, if any, ofcurrent LLNL operations on ground water resources.
DOE Order 5400.1 and the to-be-promulgated 10 CFR 834 require all DOE facilities toprepare a GWPMP that describes the site’s ground water regime, areas of knowncontamination, remediation activities, programs to monitor the ground water, andthe means to monitor and control potential sources of ground water contamination.Considerable ground water monitoring and remediation, discussed in Chapter 8, arecarried out under Comprehensive Environmental Response, Compensation andLiability Act (CERCLA) restoration efforts. Soil and sediment surveillance monitoringunder the GWPMP is described in Chapter 10. Additional programs address thesanitary sewer system, building drains, and underground storage tanks.
Surveillance Monitoring
Ground water monitoring at LLNL complies with DOE Order 5400.1, which affirmsDOE’s commitment to protect the environment. LLNL conducts surveillance moni-toring of ground water in the Livermore Valley and in the Altamont Hills throughnetworks of wells and springs that include private wells off site and DOE CERCLAwells on site. The two monitored areas are not connected hydrologically; they areseparated by a major drainage divide and numerous faults. The Livermore site in theLivermore Valley drains to San Francisco Bay via Alameda Creek. Most of Site 300drains to the San Joaquin River Basin via Corral Hollow Creek, with a small unde-veloped portion in the north draining to the north and east toward Tracy. In order tomaintain a comprehensive, cost-effective monitoring program, LLNL determines the

9 Ground Water Monitoring
9-2 LLNL Environmental Report for 1999
number and locations of surveillance wells, the analytes to be monitored, the frequencyof sampling, and the analytical methods to be used.
A wide range of analytes is monitored to assess the impact, if any, of current LLNLoperations on local water resources. Because surveillance monitoring is geared todetecting substances at very low concentrations in ground water, it can detectcontamination before it significantly impacts ground water resources. Wells at theLivermore site, in the Livermore Valley, and at Site 300 in the Altamont Hills areincluded in LLNL’s surveillance monitoring plan. Historically, the surveillance andcompliance monitoring programs have detected relatively elevated concentrations ofvarious metals, nitrate, perchlorate, and depleted uranium (uranium-238) in groundwater at Site 300. Subsequent CERCLA studies have linked several of these contam-inants to past operations, while others are the objects of continuing study. Present-dayadministrative, engineering, and maintenance controls in place at both LLNL sites arespecifically tailored to prevent damage to the environment.
Compliance Monitoring
The Compliance Ground Water Monitoring Program complies with numerous federaland state controls (see Chapter 2, Table 2-4, for a summary of LLNL permits).Compliance monitoring of ground water is conducted at Site 300 to satisfy state-issuedpermits associated with closed landfills containing solid wastes and with continuingdischarges of liquid waste to surface impoundments, sewage ponds, and percolationpits. Ground water compliance monitoring at Site 300 is specified in Waste DischargeRequirement (WDR) orders issued by the Central Valley Regional Water QualityControl Board (CVRWQCB) and in landfill closure and postclosure monitoring plans.The WDRs and postclosure plans specify wells and effluents to be monitored, constitu-ents of concern (COCs) to be measured, measurement frequency, inspections to beconducted, and the frequency and form of required reports. These monitoring pro-grams include quarterly and semiannual monitoring of ground water, monitoring ofvarious influent waste streams, and visual inspections. LLNL conducts additionaloperational monitoring of wastewater effluents discharged to surface impoundmentsand sewage evaporation and percolation ponds to comply with WDRs issued underCalifornia’s Porter-Cologne Water Quality Control Act. Quarterly and annual writtenreports of analytical results, inspection findings, and maintenance activities are requiredfor each monitoring network.
Table 9-1 in the Data Supplement shows the analytical methods and reporting limits forinorganic constituents (including specific radioisotopes analyzed by alpha spectroscopyand other sensitive methods), organic constituents, and radioisotopes in ground water.

Ground Water Monitoring 9
LLNL Environmental Report for 1999 9-3
Livermore Site and Environs
Livermore Valley
LLNL has monitored tritium in water hydrologically downgradient of the Livermoresite since 1988. Tritium is potentially the most mobile ground water contaminantemanating from LLNL. Rain and storm water runoff in the Livermore Valley, whichrecharges local aquifers, contains small amounts of tritium from natural sources, pastworldwide atmospheric nuclear weapons tests, and atmospheric emissions from LLNL.(See Chapters 4, 5, and 7 for further discussion of air emissions, rain, and storm waterrunoff.) Ground water samples were obtained during 1999 from 18 of 21 wells in theLivermore Valley (see Figure 9-1) and measured for tritium activity.
Ground water is recharged at the Livermore site from arroyos by rainfall. Rechargeenters primarily through the arroyos (see also Chapter 7). Ground water flow at theLivermore site, which is generally westward, is discussed generally in Chapter 1 and
Shadow Cliffs
Zone 7Ground waterbasin boundary
Alluvialplain
Livermore
LivermoreAvenue
Santa RitaRoad
Pleasanton
Stanley Boulevard16L7
2R111B1
1H3
1R212A2
1P3
16L5
HopyardRoad
N
84
Monitoring well
Ground watersamples not provided
Scale: Kilometers
0 2 4
9M29M3
8P1
16B1
12G118A1
9Q17P3
8F17C2
004
1P2
12D2
17D2
East Avenue
84
LLNLLLNLLLNL
580580
680
680
Figure 9-1. Locations of off-site tritium monitoring wells in the Livermore Valley.
9 Ground Water Monitoring
9-4 LLNL Environmental Report for 1999
in detail in the CERCLA Remedial Investigation Report for the LLNL Livermore Site(Thorpe et al. 1990) and the annual LLNL Ground Water Project reports (Aaronset al. 2000).
Livermore Site Perimeter
LLNL designed a surveillance monitoring program to complement the LivermoreGround Water Project (discussed in Chapter 8). The intent of this network is tomonitor for possible contaminants other than volatile organic compounds (VOCs),which are handled under the Livermore Site Ground Water Project. The perimeterportion of this surveillance ground water monitoring network makes use of threebackground monitoring wells near the eastern boundary of the site and seven westernperimeter monitoring wells, located near the western boundary (see Figure 9-2). Theseseven wells located in the regions of Treatment Facilities A, B, and C (see Figure 8-1)meet the requirements of DOE Order 5400.1. These western perimeter wells monitorthe uppermost aquifers for COCs that are outside, but very near to, the areas whereground water is being treated.
The screened interval for each surveillance monitoring well is in the uppermost satu-rated aquifer (or aquifers) at that well location. As discussed in Chapter 8, the alluvialsediments have been divided into seven hydrostratigraphic units (HSUs). HSUs aredescribed in Chapter 8 and shown in Figure 8-1.
Two of the background wells, W-008 (screened in HSUs 3A/3B) and W-221 (screenedin HSU 3A), were sampled and analyzed once for semivolatile organic compounds(SVOCs), semiannually for minerals, and quarterly for trace metals and most radioactiveconstituents in order to obtain sufficient data for statistical analyses. Background wellW-017 (screened in the deeper HSU 5) was sampled and analyzed once during the thirdquarter for trace metals and radioactive constituents. The seven western perimeterwells screened in shallower HSUs 1B and 2 were sampled and analyzed annually fornonradioactive constituents and quarterly for many radioactive constituents. Each wellwas sampled and the water analyzed for metals and minerals, herbicides, gross alphaand beta, tritium, and other radioisotopes. Routine surveillance monitoring data for1999 are presented in the Data Supplement (Tables 9-2 through 9-11). These monitoringresults help establish baseline conditions for future monitoring and detect the presenceof any COCs that may adversely affect public health or the environment.

Ground Water Monitoring 9
LLNL Environmental Report for 1999 9-5
W-306
East Avenue
Arroyo Seco
Scale: Meters
0 150 300
Monitoring well sampled in 1999Old waste disposal areafrom remedial investigation(Thorpe et al. 1990)Current hazardous/mixed-waste storage
LLNL perimeter
Radioactive material
N
Taxi stripTaxi strip
East YrafficCircle Landfill
DWTFDWTF
East TrafficCircle Landfill
Building 322
Patterson Pass Road
Gre
envi
lle R
oad
W-008
W-221W-221
Vas
co R
oad
W-373
W-556W-556
W-1012W-1012
W-121
14B1
DowngradientWells
Upgradientwells
Upgradientwells
W-008W-593W-593
W-221
W-359
W-270W-270
W-359
W-148W-148SIP-331-001SIP-331-001
W-305W-305
W-204W-204
W-363W-363
W-017
W-1308W-1308
W-119W-119
W-1306W-1306
W-906W-906
W-1303W-1303
W-270GSW-011GSW-011
W-373
W-1012
Downgradientwells
W-151 W-571
RhonewoodSubdivision
W-017
Building 322Buildings 331, 332
Buildings331, 332
W-307
W-226
Building 253
W-307
W-226
Building 253
Building 514
Building612
Building612
Figure 9-2. Locations of routine surveillance ground water monitoring wells at the Livermore site.
Livermore Site
Livermore site (interior) ground water sampling locations include areas where releasesto ground may have occurred in the recent past or where previously detected COCshave low concentrations that do not require CERCLA remedial action. Monitoring wellsscreened in the uppermost aquifers are situated downgradient from, and as near aspossible to, the potential release locations.
The Taxi Strip Area and the East Traffic Circle Landfill are two potential sources ofground water contamination for which surveillance monitoring wells were added to thesurveillance monitoring network in 1997 (see Figure 9-2). Ground water samples frommonitoring wells screened in HSUs 2 and 3A downgradient from the Taxi Strip Areaand East Traffic Circle Landfill were analyzed for americium, plutonium, thorium,

9 Ground Water Monitoring
9-6 LLNL Environmental Report for 1999
uranium, gross alpha and beta radiation, radium-226, radium-228, tritium, metals,polychlorinated biphenyls (PCBs), and general minerals. The locations of these wells—W-204, W-363, W-119, W-906, W-1303, W-1306, and W-1308—are shown in Figure 9-2.All surveillance monitoring analytical data for the Taxi Strip Area and the East TrafficCircle Landfill are presented in Data Supplement Tables 9-12 through 9-18.
Another potential source of ground water contamination is the Decontamination andWaste Treatment Facility (DWTF) in the northeastern portion of LLNL. Ground watersamples were obtained downgradient from this facility from well W-593 during 1999and were analyzed for the same suite of analytes as the East Traffic Circle Landfill andTaxi Strip Area (see Data Supplement Table 9-19).
The hazardous waste/mixed waste storage facilities around Buildings 514 and 612 aremonitored by wells W-270, W-359, and GSW-011. These wells were sampled andanalyzed for trace metals and radioactive constituents in 1999. In addition, groundwater samples from well W-359 were also analyzed for minerals and for SVOCs. Allsurveillance monitoring analytical data from the Hazardous Waste Management Areaare presented in Data Supplement Tables 9-20 through 9-22.
Ground water samples were also obtained downgradient from areas where minorreleases of metals to ground have occurred. Samples were obtained from monitoringwell W-307 (screened in HSU 1B), downgradient from a fume hood vent on the roofof Building 322. Soil samples obtained from the area show elevated concentrations(in comparison with LLNL’s site background levels) of chromium, copper, lead,nickel, zinc, and occasionally other metals. LLNL removed contaminated soils nearBuilding 322 in 1999 and replaced them with clean fill. The area was then paved over,making it less likely that metals will migrate from the site. Analytical results fordissolved metals in 1999 ground water samples are presented in Data SupplementTable 9-23.
Ground water samples were also obtained downgradient from a location wheresediments containing metals (including cadmium, copper, lead, mercury, and zinc) hadaccumulated in a storm water catch basin near Building 253 (Jackson 1997). Theseground water samples were obtained from monitoring wells W-226 and W-306 screenedin HSUs 1B and 2, respectively. Analytical results for dissolved metals in these samplesare presented in Data Supplement Tables 9-24 and 9-25.
The additional surveillance ground water sampling locations for 1999 surround the areawhere the Plutonium Facility (Building 332) and the Tritium Facility (Building 331) arelocated (see Figure 9-2). Possible contaminants include plutonium-239 and americium-241from the Plutonium Facility and tritium from the Tritium Facility. Both plutonium and

Ground Water Monitoring 9
LLNL Environmental Report for 1999 9-7
americium are more likely to bind to the soils rather than to migrate into the ground water.Tritium, on the other hand, is likely to migrate into ground water if spilled in sufficientquantities. Upgradient of these facilities, well W-305 is screened in HSU 2; downgradientwell W-148 is screened in HSU 1B; and SIP-331-001 is screened in HSU 2. Analyticalresults are presented in Data Supplement Tables 9-26 through 9-28.
Site 300
For surveillance and compliance ground water monitoring at Site 300, LLNL uses DOECERCLA wells on site and private wells and springs off site. Representative groundwater samples are obtained at least once per year; they are routinely measured forvarious elements (primarily metals), a wide range of organic compounds, nitrate,general radioactivity (gross alpha and gross beta), uranium activity, and tritium activity.Typically, Environmental Protection Agency- (EPA-) approved analytical methods areused because they are both accurate and sensitive. (See Data Supplement Table 9-1 for acomplete list of COCs and for the EPA or other standard analytical methods used tomeasure them.)
Figure 9-3 shows the ground water sampling locations with wells and springs atSite 300. Although ground water from the uppermost water-bearing zone is the targetof most of the sampling, at several locations up to three vertically separated water-bearing zones are sampled by means of multiple-completion installations fitted withBarcad devices. Barcads are identified in Figure 9-3 by the capital letters A, B, and C atthe end of a monitoring installation’s identifier code. (“A” is assigned to the Barcad thatsamples the deepest of three, or deeper of two, water-bearing zones.)
Twelve ground water monitoring locations are off site. Two are springs, identified asMUL2 and VIE1, which are located near the northern boundary of Site 300. Off-sitesurveillance well VIE2 (not shown in Figure 9-3) is located 6 km west of Site 300 in theupper reaches of the Livermore Valley watershed. Nine off-site surveillance locationsare wells located near the southern boundary of Site 300 in, or adjacent to, the CorralHollow Creek floodplain.
On-site wells that were installed for CERCLA characterization studies during the 1980scontinue to be used to monitor several former landfills, a former open-air burn pit, twoconnected surface water impoundments, and two connected sewer ponds. The formerlandfills—which are identified as Pit 1, Pit 2, Pit 7 Complex, Pit 8, and Pit 9—are locatedin the Elk Ravine drainage area, while Pit 6, the former burn pit, the two surface

9 Ground Water Monitoring
9-8 LLNL Environmental Report for 1999
Ala
med
a C
ount
y
San
Joa
quin
Cou
nty
VIE26 km
MUL12.4 km
MUL2 (spring 13)
STONEHAM1
Corral Hollow Road
Spring sampling location
Well or Barcad samplinglocation
Closed landfill (Pit)
Site 300 perimeter
CARNRW2
CON1GALLO1
0 1
Scale: Kilometers
0.5
CARNRW1
CON2
Tesla Road
W35A-04Well 20
Well 18
NC7-69
NC2-11D
NC2-12D
K1-02A,B
K2-04S
K2-04D
K2-01A,B,C
Process waterimpoundments
HE burn pit SewagepondsPit 6
Pit 7 Complex
Pit 9
K2-02A,B
Pit 1
N
VIE1 (spring)
Pit 2
CDF1
Elk Ravinedrainage area
Corral Hollow Creekdrainage area
K7-07
K1-01C
channel
dividedivide
812CRK (spring 6)
NC2-07
NC7-61Pit 8
Figure 9-3. Locations of surveillance ground water wells, Barcads, and springs atSite 300.
impoundments, and the sewer ponds are located in the Corral Hollow Creek drainagearea. Two on-site water supply wells, well 18 and well 20, are also used for surveillancemonitoring purposes. Well 20 provides potable water to the site. Well 18 is maintainedas a standby supply well.
Brief descriptions of the Site 300 ground water monitoring networks are given below.Networks within the Elk ravine drainage area are described first, followed by thenetworks in the Corral Hollow creek drainage area. CERCLA wells within Site 300 have

Ground Water Monitoring 9
LLNL Environmental Report for 1999 9-9
been selected for compliance and surveillance monitoring use based on their locationsand our general understanding of local geologic and hydrogeologic conditions atSite 300 as described in Webster-Scholten 1994 (see also Chapter 8 for a summary ofSite 300 stratigraphy and hydrogeology.) Ground water measurements made during1999 that have not been published elsewhere are listed in tables in the Data Supplementthat accompanies this volume. References to the publications that contain the remainingground water data collected during 1999 are cited herein.
Elk Ravine Drainage Area
The Elk Ravine drainage area, a branch of the Corral Hollow Creek drainage system,includes most of northern Site 300 (see Figure 9-3). Storm water runoff from closedlandfills within the Elk Ravine drainage area (Pits 1–5 and 7–9) collects in arroyosand quickly infiltrates into the ground. Ground water from wells that lie within theElk Ravine drainage area are monitored for COCs because of the system of surfaceand underground flows that connect the entire Elk Ravine drainage area. The areacontains eight of the nine closed landfills (Pits 1–5 and 7–9) and a number of firing tableswhere explosives tests have been conducted. The following descriptions of monitoringnetworks within Elk Ravine begin with the headwaters area and proceed downstream.(See Chapter 8 for a review of ground water contamination in this drainage area asdetermined from numerous CERCLA investigations.)
Pit 7 Complex
Monitoring requirements for the closed Pit 7 landfill in the Elk Ravine drainage area arespecified in Waste Discharge Requirements Order 93-100 (WDR 93-100) administered bythe CVRWQCB (1993 and 1998) and in LLNL Site 300 RCRA Closure and Post-ClosurePlans— Landfill Pits 1 and 7 (Rogers/Pacific Corporation 1990).
The Pit 7 complex area is located at an elevation of about 400 m in the most elevatedportion of the Elk Ravine drainage area. The complex comprises four adjacent landfillsidentified as Pits 3, 4, 5, and 7 (see Figure 9-4). From 1963 to 1988, the landfills receivedwaste gravels and debris from hydrodynamic tests of explosive devices conducted onfiring tables at Site 300. The gravels contained concrete, cable, plastic, wood, tritium,depleted uranium (uranium-238), beryllium, lead, and other metals in trace amounts. In1988, 9440 m3 of gravel were removed from six firing tables at Site 300 and placed inPit 7 (Lamarre and Taffet 1989). These were the last solid wastes to be placed in alandfill at Site 300.

9 Ground Water Monitoring
9-10 LLNL Environmental Report for 1999
Pit 3Pit 7 NC7-25
Pit 4
K7-10
K7-03
NC7-47
K7-06NC7-26
Monitoring well
Access road
Pit 5
Route 4
NC7-48
K7-01
K7-09
Ala
med
a C
ount
y
San
Joa
quin
Cou
nty
N
0 200100
Scale: Meters
Ground water
flow direction
Figure 9-4. Locations of compliance ground water monitoring wells, Pit 7 complex.
The main objective of monitoring is the early detection of any release of COCs from Pit 7to ground water. All detected COCs are investigated. Most of the COCs detected by thePit 7 monitoring network have been previously linked to historical releases from otherpits near Pit 7. Detected COCs such as arsenic, barium, and uranium are released fromthe underlying rocks and sediments where they occur naturally. Comparison of newdata with historical data helps analysts to identify releases from wastes buried in Pit 7,versus releases from sources other than Pit 7, including natural sources. Most of theCOCs detected during 1999 in the ground water near Pit 7 were released historicallyfrom Pits 3 and 5 (Webster-Scholten 1994). (See Chapter 8 for a review of thestratigraphy, hydrogeology, and ground water contamination in the Pit 7 area.)
As required by the monitoring and reporting program contained in WDR 93-100, LLNLobtained ground water samples quarterly from Pit 7 monitoring wells during 1999 andanalyzed them for inorganic COCs (mostly metallic elements), general radioactivity(gross alpha and beta), activity of certain radioisotopes (tritium, radium, uranium, andthorium), explosive compounds (HMX and RDX), and VOCs (EPA Method 601). Fieldmeasurements of ground water depth, temperature, pH, and specific conductance wereobtained at each well at the time of sample collection. Three quarterly reports and oneannual report covering monitoring activities at Pit 7 during 1999 have been publishedpreviously (Christofferson and MacQueen 1999a, 1999b, 1999c, 2000). Tables and graphsof Pit 7 ground water data for 1999 can be found in LLNL Experimental Test Site 300

Ground Water Monitoring 9
LLNL Environmental Report for 1999 9-11
Compliance Monitoring Program for RCRA-Closed Landfill Pits 1 and 7, Annual Report for1999 (Christofferson and MacQueen 2000).
Elk Ravine
As planned, ground water samples were obtained twice (semiannually) during 1999from the widespread Elk Ravine surveillance monitoring network. Samples wereanalyzed for inorganic COCs (mostly metallic elements), general radioactivity (grossalpha and beta), tritium and uranium activity, explosive compounds (HMX and RDX),and VOCs (EPA Method 601).
Pit 2
The closed Pit 2 landfill lies in the upper portion of Elk Ravine, about 320 m above sealevel (Figures 9-3 and 9-5). The landfill primarily contains gravels and debris fromhydrodynamic tests of explosive devices conducted at the Building 801 and 802 firingtables. The buried waste material contains depleted uranium (uranium-238), and traceamounts of beryllium, thorium, and (possibly) tritium.
As planned for surveillance purposes, LLNL obtained ground water samples twice(semiannually) during 1999 from the Pit 2 monitoring network (comprising mostlyBarcad installations) and analyzed them for inorganic COCs (mostly metallic elements),general radioactivity (gross alpha and beta), activity of certain radioisotopes (tritiumand uranium), and explosive compounds (HMX and RDX).
Pit 1
Monitoring requirements for the closed Pit 1 landfill are specified in Waste DischargeRequirements Order 93-100 (WDR 93-100) administered by the CVRWQCB (1993 and1998) and in LLNL Site 300 RCRA Closure and Post-Closure Plans— Landfill Pits 1 and 7(Rogers/Pacific Corporation 1990).
Pit 1 lies in the Elk Ravine drainage area about 330 m above sea level. The ResourceConservation and Recovery Act (RCRA)-closed Pit 1 landfill and the positions of theeight ground water wells used to monitor it are shown in Figure 9-5.
As required by the monitoring and reporting program contained in WDR 93-100, LLNLobtained ground water samples from Pit 1 monitoring wells every quarter during 1999.Samples were analyzed for inorganic COCs (mostly metallic elements), generalradioactivity (gross alpha and beta), activity of certain radioisotopes (tritium, radium,uranium, and thorium), explosive compounds (HMX and RDX), and VOCs (EPAMethod 601). Every other quarter, analyses were conducted for an additional seven
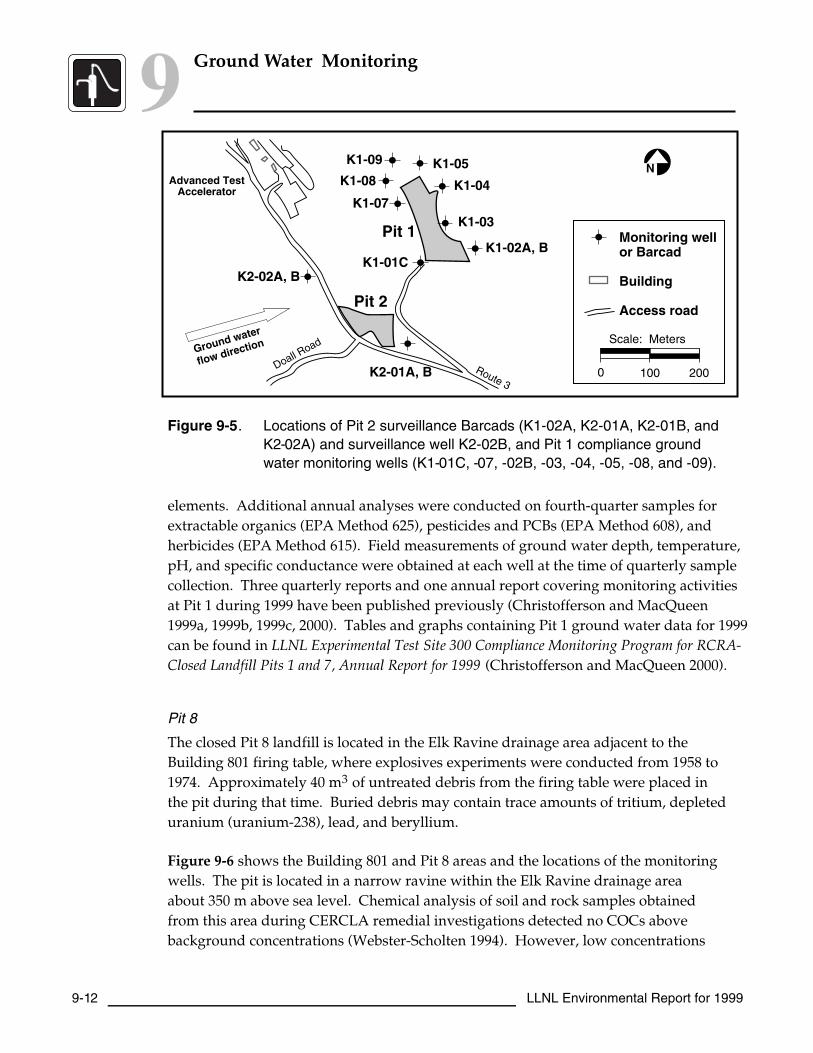
9 Ground Water Monitoring
9-12 LLNL Environmental Report for 1999
Route 3
Doall Road
Advanced TestAccelerator
K2-01A, B
Pit 2
Pit 1
K1-01C
K1-07
K1-08
K1-09 K1-05
K1-04
K1-03
K1-02A, B
K2-02A, B
N
Monitoring wellor Barcad
Building
Access road
Scale: Meters
2001000
Ground water
flow direction
Figure 9-5. Locations of Pit 2 surveillance Barcads (K1-02A, K2-01A, K2-01B, andK2-02A) and surveillance well K2-02B, and Pit 1 compliance groundwater monitoring wells (K1-01C, -07, -02B, -03, -04, -05, -08, and -09).
elements. Additional annual analyses were conducted on fourth-quarter samples forextractable organics (EPA Method 625), pesticides and PCBs (EPA Method 608), andherbicides (EPA Method 615). Field measurements of ground water depth, temperature,pH, and specific conductance were obtained at each well at the time of quarterly samplecollection. Three quarterly reports and one annual report covering monitoring activitiesat Pit 1 during 1999 have been published previously (Christofferson and MacQueen1999a, 1999b, 1999c, 2000). Tables and graphs containing Pit 1 ground water data for 1999can be found in LLNL Experimental Test Site 300 Compliance Monitoring Program for RCRA-Closed Landfill Pits 1 and 7, Annual Report for 1999 (Christofferson and MacQueen 2000).
Pit 8
The closed Pit 8 landfill is located in the Elk Ravine drainage area adjacent to theBuilding 801 firing table, where explosives experiments were conducted from 1958 to1974. Approximately 40 m3 of untreated debris from the firing table were placed inthe pit during that time. Buried debris may contain trace amounts of tritium, depleteduranium (uranium-238), lead, and beryllium.
Figure 9-6 shows the Building 801 and Pit 8 areas and the locations of the monitoringwells. The pit is located in a narrow ravine within the Elk Ravine drainage areaabout 350 m above sea level. Chemical analysis of soil and rock samples obtainedfrom this area during CERCLA remedial investigations detected no COCs abovebackground concentrations (Webster-Scholten 1994). However, low concentrations

Ground Water Monitoring 9
LLNL Environmental Report for 1999 9-13
of trichloroethylene (TCE) have been detected in ground water samples from Pit 8surveillance monitoring wells, including upgradient well K8-01, since 1987. Previousremedial investigation links the TCE to a dry well near Building 801 that was once usedto dispose liquid wastes (Webster-Scholten 1994).
K8-01
K8-03B
NC2-11D
Firing table gravel
K8-02B
Storagearea
Route 3
Pit 8
N
K8-05
K8-04
Closed Pit 8 landfill
Active monitoring well
Inactive monitoring well
Scale: Meters
0 10050
Building 801 complex
Figure 9-6. Locations of surveillance ground water monitoring wells, Pit 8, 1999.
Because of construction activities in the vicinity of Pit 8, ground water samples could beobtained from only two surveillance monitoring wells during 1999. Ground watersamples from wells K8-01 and K8-02B were analyzed for inorganic COCs (mostlymetallic elements), general radioactivity (gross alpha and beta), activity of certainradioisotopes (tritium and uranium), explosive compounds (HMX and RDX), and VOCs(EPA Method 601).
Pit 9
The Pit 9 landfill is centrally located within Site 300 about 340 m above sea level. Similarto the other closed landfills in Elk Ravine, the closed Pit 9 landfill contains firing tablegravels and debris from explosives experiments conducted on the Building 845 firingtable nearby.
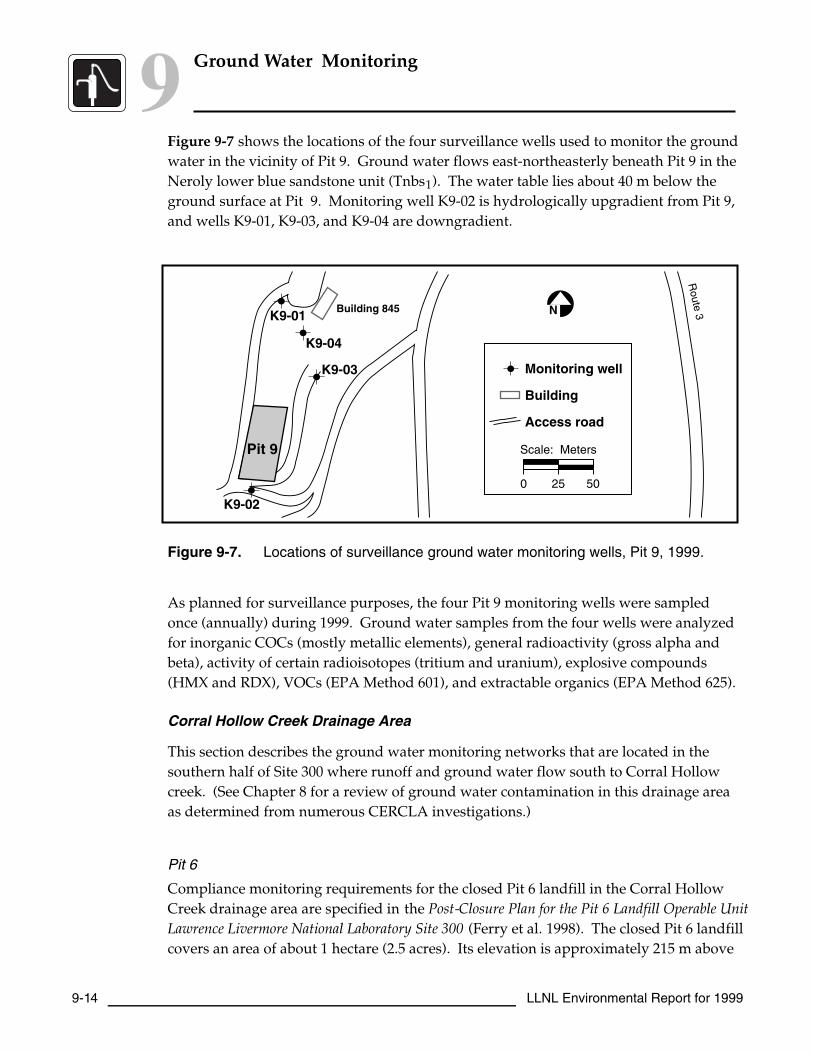
9 Ground Water Monitoring
9-14 LLNL Environmental Report for 1999
Figure 9-7 shows the locations of the four surveillance wells used to monitor the groundwater in the vicinity of Pit 9. Ground water flows east-northeasterly beneath Pit 9 in theNeroly lower blue sandstone unit (Tnbs1). The water table lies about 40 m below theground surface at Pit 9. Monitoring well K9-02 is hydrologically upgradient from Pit 9,and wells K9-01, K9-03, and K9-04 are downgradient.
K9-04
K9-01
K9-02
K9-03
Route 3Building 845
Pit 9
N
Monitoring well
Building
Access road
500 25
Scale: Meters
Figure 9-7. Locations of surveillance ground water monitoring wells, Pit 9, 1999.
As planned for surveillance purposes, the four Pit 9 monitoring wells were sampledonce (annually) during 1999. Ground water samples from the four wells were analyzedfor inorganic COCs (mostly metallic elements), general radioactivity (gross alpha andbeta), activity of certain radioisotopes (tritium and uranium), explosive compounds(HMX and RDX), VOCs (EPA Method 601), and extractable organics (EPA Method 625).
Corral Hollow Creek Drainage Area
This section describes the ground water monitoring networks that are located in thesouthern half of Site 300 where runoff and ground water flow south to Corral Hollowcreek. (See Chapter 8 for a review of ground water contamination in this drainage areaas determined from numerous CERCLA investigations.)
Pit 6
Compliance monitoring requirements for the closed Pit 6 landfill in the Corral HollowCreek drainage area are specified in the Post-Closure Plan for the Pit 6 Landfill Operable UnitLawrence Livermore National Laboratory Site 300 (Ferry et al. 1998). The closed Pit 6 landfillcovers an area of about 1 hectare (2.5 acres). Its elevation is approximately 215 m above

Ground Water Monitoring 9
LLNL Environmental Report for 1999 9-15
sea level. From 1964 to 1973, approximately 1500 m3 of solid wastes were buried there innine separate trenches. The trenches were not lined, consistent with historical disposalpractices. Three larger trenches contain 1300 m3 of solid waste that includes emptydrums, glove boxes, lumber, ducting, and capacitors. Six smaller trenches contain 230 m3
of biomedical waste, including animal carcasses and animal waste. Minor releases ofVOCs—primarily the solvent TCE, and tritium—occurred prior to closure. During 1997,a multilayered cap was constructed over all the trenches, and a drainage control systemwas installed around the cap. The cap and the drainage control system are engineered tokeep rainwater from contacting the buried waste (Ferry et al. 1998).
The Pit 6 disposal trenches were constructed in Quaternary terrace deposits (Qt) aboveand north of the Corral Hollow Creek flood plain. Surface runoff from the pit areaflows southward to Corral Hollow Creek. The Carnegie-Corral Hollow Fault zoneextends beneath the southern third of Pit 6. The northern limit of the fault zone isshown in Figure 9-8. Beneath the northern two-thirds of Pit 6, ground water flowssouth-southeast, following the inclination (dip) of the underlying sedimentary rocks.Ground water seepage velocities are less than 10 m/y. Depths to the water table rangefrom 10−20 m. Beneath the southern third of Pit 6, a trough containing terrace gravelwithin the fault zone provides a channel for ground water to flow southeast, parallel tothe Site 300 boundary fence (Webster-Scholten 1994). (See Chapter 8 for a review of thestratigraphy, hydrogeology, and ground water contamination in the Pit 6 area.)
Two ground water monitoring programs were implemented at the Pit 6 landfill during1998 to ensure compliance with all regulations: (1) The Detection Monitoring Program(DMP), designed to detect any new release of COCs to ground water from wastes buriedin the Pit 6 landfill, and (2) the Corrective Action Monitoring Program (CAMP), whichoperates under CERCLA, and monitors the movement of existing releases (see Chapter 8for a summary of CAMP monitoring results for Pit 6). Twenty-four COCs, includingVOCs and radioisotopes, are monitored in ground water near Pit 6 (Ferry et al. 1998).Figure 9-8 shows the locations of Pit 6 and the wells used to monitor ground water there.
As required by the monitoring program contained in the postclosure plan, ground waterat the Pit 6 monitoring wells was sampled quarterly during 1999. Samples were analyzedfor inorganic COCs (mostly metals), general radioactivity (gross alpha and beta), tritiumactivity, uranium activity, VOCs (EPA Method 624), extractable organics (EPA Method625), pesticides and PCBs (EPA Method 608), and herbicides (EPA Method 615). Fieldmeasurements of ground water depth, temperature, pH, and specific conductance wereobtained at each well at the time of sample collection. Three quarterly reports and oneannual report covering monitoring activities at Pit 6 during 1999 have been publishedpreviously (Christofferson and Taffet 1999a, 1999b, 1999c, 2000). Tables listing the 1999ground water data for Pit 6 can be found in Christofferson and Taffet 2000.

9 Ground Water Monitoring
9-16 LLNL Environmental Report for 1999
K6-04
K6-15
K6-03
EP6-07
BC6-10
K6-26
K6-24K6-27
K6-18
K6-25K6-14
BC6-13K6-17 K6-23
W-33C-01
BC6-11
K6-16K6-22
K6-21
Corral Hollow Road
Site 300 boundary fence
K6-32
K6-33
K6-01
EP6-09
EP6-06
BC6-12
EP6-08
K6-01SK6-19
Scale: Meters
0 25 50
Pit 6 cover
Monitoring wells
Upgradient
Detection
Corrective action
Building, trailer, or canopy
Disposal trenches and pits
Approximate northern limit of fault zone
N
ORAD-98-0003
Figure 9-8. Locations of Pit 6 ground water monitoring wells.
HE Process Area Closed Burn Pits
The former High-Explosives (HE) Open Burn Treatment Facility, part of the Building 829Complex, is located on a ridge within the southeast portion of Site 300 at an elevation ofabout 320 m (1050 ft) (see Figure 9-9). The facility included three shallow unlined pitsconstructed in unconsolidated sediments that cap the ridge (Tps formation). The formerburn facility was covered with an impervious cap during 1998 following RCRA guidance.The facility was used to thermally treat explosives waste generated by researchoperations at Site 300. Surface water drains southward from the facility toward CorralHollow Creek. The nearest site boundary lies about 1.6 km (4500 ft) to the south

Ground Water Monitoring 9
LLNL Environmental Report for 1999 9-17
800
900
828
829
827
900Ground elevation contour(ft above mean sea level)
Monitoring wells
Scale: Meters
0 200100
W-827-05
W-829-06
W-829-22W-829-08
Closed BurnTreatmentFacility Area
Complex
W-829-15 W-827-04
N
Figure 9-9. Locations of monitoring wells in Building 829 closed burn facility area.
at Corral Hollow Road. Stratified rocks of the Neroly (Tn) formation underlie thefacility and dip southeasterly. Two water-bearing zones exist at different depthsbeneath the facility. The shallower zone, at a depth of about 30 m (100 ft), is perchedwithin the Neroly upper siltstone/claystone aquitard (Tnsc2). The deeper zone, at adepth of about 120 m (400 ft), represents a regional aquifer within the Neroly uppersandstone member (Tnbs2). (See Chapter 8 for a review of the stratigraphy,hydrogeology, and ground water contamination in this area.)
Based on ground water samples recovered from boreholes, previous CERCLA remedialinvestigations determined that the perched ground water beneath the burn facility wascontaminated with VOCs, primarily TCE, but that the deeper regional aquifer was freeof any contamination stemming from operation of the facility (Webster-Scholten 1994).

9 Ground Water Monitoring
9-18 LLNL Environmental Report for 1999
Subsequent assays of soil samples obtained from shallow boreholes prior to closurerevealed that low concentrations of HE compounds, VOCs, and metals exist beneath theburn pits (Mathews and Taffet 1997). Conservative transport modeling indicates thatthe shallow contamination will not adversely impact the regional aquifer, primarilybecause its downward movement is blocked by a 100-m-thick intervening aquitard.However, beginning in 1999, LLNL implemented the intensive ground water moni-toring program for this area described in the post-closure plan (Mathews and Taffet1997) to track the fate of contaminants in the perched water-bearing zone and to watchthe deep regional aquifer for the appearance of any potential contaminants from theclosed burn facility.
Figure 9-9 shows the locations of the closed burn treatment facility area and the six wellsused to monitor the ground water. Two wells, W-829-06 and W–829-08, are screened inthe perched water-bearing zone beneath the former burn facility. The remaining fourwells are screened in the deep regional aquifer downgradient of the closed facility.During 1999, quarterly samples were obtained from five of the six monitoring wells.One of the deep wells, W-829-04, was dry during 1999. Ground water samples from thewells screened in the deep regional aquifer were analyzed quarterly for inorganic COCs(mostly metals), general minerals, explosive compounds (HMX, RDX, and TNT), VOCs(EPA Method 624), extractable organics (EPA Method 625), pesticides and PCBs (EPAMethod 608), general radioactivity (gross alpha and beta), activity of certain radioiso-topes (tritium, radium, and uranium), total organic carbon (TOC), total organic halides(TOX), and coliform bacteria. Ground water samples from the two wells screened in theshallow perched water-bearing zone were analyzed for explosive compounds and VOCsfor the first three quarters of 1999. Fourth-quarter samples of the perched ground waterwere subjected to the same analyses as described above for the deep ground water in theregional aquifer.
Water Supply Wells
Water suppy wells 18 and 20 are located in the southeastern part of Site 300 (Figure 9-3).Both are deep, high-production wells. Well 20 supplied potable water at the site during1999, while well 18 was maintained as a standby water supply well. Both wells arescreened in the Tnbs1. The well 18 screen extends upwards into the aquitard unit (Tnsc1)that separates the upper (Tnbs2) and lower blue sandstone units of the Neroly Formation.Each well can produce up to 1500 L/min of potable water. For many years, well 18ground water samples have shown trace amounts of TCE. CERCLA studies have not yetdetermined the source of the TCE in well 18 (see Chapter 8 for locations of TCE plumes atSite 300).

Ground Water Monitoring 9
LLNL Environmental Report for 1999 9-19
As planned for surveillance purposes, ground water samples were obtained quarterlyfrom these two on-site supply wells. Quarterly water samples from well 20 wereanalyzed for inorganic COCs (mostly metals), VOCs (EPA Method 502.2) explosivecompounds (HMX, RDX), general radioactivity, and tritium activity. Quarterly watersamples from standby well 18 were analyzed for arsenic, zinc, and VOCs; generalradioactivity (gross alpha and gross beta); and tritium.
Explosives Process Area
WDR Order No. 96-248 establishes the basis for compliance monitoring of the twoadjacent surface impoundments (see Figure 9-10). This includes quarterly monitoringof the ground water, monitoring of various influent waste streams to the surfaceimpoundments, and visual observations of leachate collection and removal systems.Influent wastewater monitoring complements administrative controls that regulate thedischarge of chemicals that could degrade the polyethylene liners of the impoundments.A three-tiered monitoring program comprising weekly visual inspections of the leachatecollection and removal systems, quarterly inspections of lysimeters, and quarterlysampling of monitoring wells is in place to detect any release of chemicals from thesurface impoundments in the Explosives Process Area.
As part of the Monitoring and Reporting Program (MRP) for the surface impoundments,contained in WDR 96-248, LLNL is required to obtain ground water samples quarterlyfrom four monitoring wells (see Figure 9-10) and to establish statistical concentrationlimits for COCs in ground water beneath the surface impoundments.
WDR 96-248 establishes limits for discharges of COCs into the surface impoundmentsand requires monitoring of the photographic process and chemistry area wastewaterretention tanks that discharge to the surface impoundments as well as direct dischargesto the surface impoundments from explosives processing. Influent streams aremonitored at a prescribed frequency for area-specific COCs.
Retention tanks containing photographic process rinsewater from Buildings 801, 823,850, and 851 are sampled to confirm that discharges are consistent with effluent dis-charge limits specified in WDR 96-248. Discharges to the surface impoundments occurafter samples are obtained, except for rinsewater from the Building 823 retention tanks,which is discharged automatically to the surface impoundments and sampled quarterly.
Samples of process wastewater from the Chemistry Area (Buildings 825, 826, and 827complex) are collected when the retention tanks are ready for discharge to the surfaceimpoundments. The wastewater is held in retention tanks until analytical resultsindicate compliance with WDR 96-248.

9 Ground Water Monitoring
9-20 LLNL Environmental Report for 1999
Building 823Ground water flow direction
Building 818
Building 815
W-817-01
Building 817
W-817-02
Process waterimpoundments
W-817-03
W-817-04
Route 5
Monitoring well
Building
Access road
150
Scale: Meters
0 75
N
Figure 9-10. Locations of compliance ground water monitoring wells in the ExplosivesProcess Area.
Process water discharges to the surface impoundments are analyzed for COCs that havebeen found (or are likely to be found) in the process water from each specified buildingwithin the Explosives Process Area. This monitoring program includes process areawastewater from Buildings 806/807, 809, and 817. WDR 96-248 requires annual analysisof this waste stream from Buildings 806/807, 809, and 817.
Percolation Pits
Percolation pits that are designed to accept discharges from mechanical equipment arelocated at Site 300 Buildings 806A, 827A, 827C, 827D, and 827E. In other remote Site 300facilities, these types of waste streams are discharged to septic systems. This dischargeis permitted by WDR 96-248. WDR 96-248 specifies monthly observations and moni-toring requirements for overflows. Overflows of the percolation pits, should they occur,are sampled and analyzed to determine if any metals are present.
Sewage Evaporation and Percolation Ponds
Site 300 is not serviced by a publicly owned treatment works (POTW) as is theLivermore site; therefore, alternate methods of treating and disposing of sanitary wasteare necessary. Sewage generated at buildings in the General Services Area is dischargedinto a lined evaporation pond. The wastewater is disposed of through evaporation fromthe pond. However, during rare periods of high rainfall, treated wastewater mayoverflow into an unlined percolation pond, where it enters the ground and the shallowground water.

Ground Water Monitoring 9
LLNL Environmental Report for 1999 9-21
The environmental monitoring requirements for the sewage evaporation and percola-tion ponds (hereafter sewage ponds) are specified in MRP 96-248. The monitoringrequirements include both wastewater monitoring and monitoring of the ground waterto detect potential impacts of the sewage on ground water quality.
Wastewater is sampled quarterly at an influent location (ISWP) and within the pond(ESWP). Overflows are sampled as needed at location DSWP. The sampling locationsare shown in Figure 9-11.
Sewage evaporation
pond
Sewage evaporation
pond
W-7DS
W-26R-11
W-35A-04W-7E
W-7ES
W-7PS
W-26R-01
W-25N-20
W-26R-05
ISWP
ESWP
Ground water flow direction
in upper aquifer
DSWP
Building
Scale: Meters
0 6030
Road
In pondMonitoring well
Discharge from pondInfluent to pond
Corral Hollow Road
N
Sewage percolation pond
Figure 9-11. Sewage evaporation and percolation ponds, compliance ground watermonitoring wells, and wastewater monitoring locations.
Nine ground water monitoring wells are sampled semiannually to provide informationon the ground water quality in the vicinity of the sewage ponds (Figure 9-11). The wellsare screened in three different geological formations (Qal, Tnbs1, and Tnsc1—seeChapter 8). Tnbs1 (Neroly Formation lower blue sandstone unit) is the regional aquifer.
Off-site Surveillance Wells and Springs
As planned for surveillance purposes, ground water samples were obtained fromtwo off-site springs and ten off-site wells during 1999. With the exception of one well,all off-site monitoring locations are near Site 300. The exception, well VIE2, is located at
9 Ground Water Monitoring
9-22 LLNL Environmental Report for 1999
a private residence 6 km west of the site. It represents a typical Altamont Hills potablewater supply well. One stock watering well, MUL1, and two stock watering springs,MUL2 and VIE1, are adjacent to Site 300 on the north. Eight wells, CARNRW1,CARNRW2, CDF1, CON1, CON2, GALLO1, STONEHAM1, and W-35A-04, are adjacentto the site on the south (Figure 9-3). Seven of the wells to the south are privately ownedand were constructed to supply water for human consumption, stock watering, or firesuppression. The exception is well W-35A-04, which is a DOE CERCLA well that wasinstalled for monitoring purposes only.
Ground water samples were obtained quarterly during 1999 at six off-site surveillancewell locations south of Site 300. Of these, CARNRW1 and CON2 samples were analyzedfor VOCs only (EPA Method 601). Samples from CARNRW2, CDF1, CON1, andGALLO1 were analyzed quarterly for inorganic COCs (mostly metals), generalradioactivity (gross alpha and beta), tritium activity, explosive compounds (HMX andRDX), and VOCs (EPA Method 502.2). Additional analyses were conducted on third-quarter samples for uranium activity, extractable organics (EPA Method 625), pesticidesand PCBs (EPA Method 608), and herbicides (EPA Method 615).
Ground water samples were obtained once (annually) during 1999 from four off-sitesurveillance monitoring locations—MUL1, MUL2, VIE1, and VIE2 (north of Site 300)and STONEHAM1 and W-35A-04 (south of Site 300). Samples were analyzed forinorganic COCs (mostly metals), general radioactivity (gross alpha and beta),tritium and uranium activity, explosive compounds (HMX and RDX), VOCs (EPAMethod 502.2), extractable organics (EPA Method 625), pesticides and PCBs (EPAMethod 608), and herbicides (EPA Method 615).
Sampling and Analytical Methods
Representative samples of ground water were obtained from monitoring wells inaccordance with the LLNL Livermore Site and Site 300 Environmental Restoration ProjectStandard Operating Procedures (SOPs) (Dibley and Depue 1999). These protocols coversampling techniques and specific information concerning the chemicals in ground waterthat are routinely searched for. Different sampling techniques were applied to differentwells depending on whether they were fitted with submersible pumps, had to be bailed,or contained Barcad devices. See the Data Supplement for sampling details.
At Site 300, wastewater samples from the photographic and explosives process areas,sewage evaporation pond influent, water in the pond, and overflow water from thepercolation pits pond were obtained in accordance with the standardized procedures

Ground Water Monitoring 9
LLNL Environmental Report for 1999 9-23
of the Operations and Regulatory Affairs Division (Tate et al. 1999). Standard samplehandling and hygiene procedures were employed to prevent cross-contamination (e.g.,wearing disposable gloves, decontaminating equipment between uses, and maintainingsamples at 4 ± 2°C). Replicates, field blanks, and trip blanks were obtained for qualityassurance/quality control purposes. Analyses were performed by state-certifiedcontract analytical laboratories.
Technologists collected wastewater samples from retention tanks in the Chemistry Areaassociated with Buildings 825, 826, and 827 using Hazardous Waste ManagementProcedure 411. Wastewater was held in retention tanks until analytical results werereviewed for compliance with WDR 96-248. Some of the analyses were performed byLLNL, which is state-certified for some analyses. The remainder of the analyses weredone by off-site contract laboratories late in the year.
Results
This section presents the monitoring results for the Livermore site and environs as wellas Site 300.
Livermore Site and Environs
Livermore Valley
Measurements of water samples obtained during the summer of 1999 from 18 wells(some of the wells were dry in 1999) in the Livermore Valley continue to show very lowtritium levels compared with the 740 Bq/L (20,000 pCi/L) maximum contaminant level(MCL) established by the State of California. The highest tritium activity measured offsite was 8.5 ± 2.4 Bq/L in a ground water sample from well 11B1 (see Figure 9-1),located about 11 km west of LLNL (results are reported in Data Supplement Table 9-29).
Tritium activity has been decreasing in Livermore Valley ground waters downgradientof LLNL. The median activities of tritium in ground water samples from these down-gradient wells decreased from 4.59 Bq/L in 1989 to –0.01 Bq/L in 1999 based on the fivepositive detections of tritium and 13 calculated values.

9 Ground Water Monitoring
9-24 LLNL Environmental Report for 1999
Livermore Site Perimeter
Tritium activity ranged from –2.8 (calculated) Bq/L to 4.4 Bq/L in ground watersamples from on-site background monitoring wells and from –4.4 (calculated) to10.5 Bq/L in western perimeter monitoring wells.
The semivolatile organic compound di(2-ethylhexyl)adipate was detected in groundwater samples collected from wells W-556 and W-373 (see Figure 9-2). This compoundis a plasticizer. Concentrations analyzed were 3.9 µg/L in the W-556 sample and5.2 µg/L in the W-373 sample (see Data Supplement Tables 9-10 and 9-11, respectively).The California drinking water MCL for di(2-ethylhexyl)adipate is 400 µg/L. No otherorganic compounds, excluding VOCs that were not COCs for this surveillancemonitoring effort, were detected in the ground water during 1999.
The inorganic compounds detected, including dissolved trace metals and minerals,occur naturally in the ground water at variable concentrations. Table 9-1 shows thethree anions with the highest concentrations in two of the background wells (W-008and W-221) and the seven western perimeter wells at LLNL. Concentrations of thesemajor anions are higher in the background wells than in the western perimeter wells(see Tables 9-2 through 9-11 in the Data Supplement). Concentrations of chloride inbackground wells W-008 and W-221 are higher than California’s recommendedsecondary MCL of 250 mg/L, while chloride concentrations in none of the westernperimeter wells exceed 250 mg/L. Likewise, sulfate concentrations in background wellW-008 exceed California’s recommended secondary MCL of 250 mg/L, while sulfateconcentrations in none of the western perimeter wells exceed 250 mg/L. Additionally,the boron concentration of 9.4 mg/L in background monitoring well W-008 in February1999 is an order of magnitude higher than it is in the western perimeter wells. Poorground water quality in the background portions of the site has been describedpreviously in the remedial investigations (Thorpe et al. 1990).
Table 9-1. Concentration ranges for three major anions in background and westernperimeter monitoring wells.
Hydrologic Concentration range (mg/L)
Flow Bicarbonate (HCO3–) Chloride (Cl–) Sulfate (SO4
2–)
Range Median Range Median Range Median
Background 220–330 270 280–560 400 77–340 209
Western perimeter 190–270 240 76–130 87 12–65 38

Ground Water Monitoring 9
LLNL Environmental Report for 1999 9-25
In March 1996, nitrate was first detected at concentrations greater than the MCL of45 mg/L (68 to 80 mg/L) in ground water samples obtained from western perimetermonitoring well W-1012 (screened in HSU 2) (see Figure 9-2). From a ground watersample collected in February 1999, the concentration of nitrate for this well was 79 mg/L(see Data Supplement Table 9-9). This is the highest nitrate concentration measuredin any on-site monitoring well during 1999. Because of the hydrologic influence ofTreatment Facility B that pumps and treats ground water from HSUs 1B and 2 (seeChapter 8), ground water with high nitrate concentrations is not moving off site to thewest. The highest concentration measured in an off-site well was below the MCL at31 mg/L, in downgradient monitoring wells W-151 and W-571 (see Data SupplementTables 9-7 and 9-8). Monitoring well W-571 is off site and downgradient from wellW-1012, but is screened in HSU 1B. During 1999, concentrations of nitrate in on-sitebackground wells W-008 and W-221 ranged from <0.5 mg/L (not detected) to 31 mg/L.Detected concentrations of nitrate in site western perimeter wells ranged from 12 to31 mg/L. Fluctuations in nitrate concentrations have occurred since regular surveillancemonitoring began in 1996, but nitrate concentrations have not increased overall inground water from the western perimeter monitoring wells since 1996. The nitrate mayoriginate as an agricultural residue (Thorpe et al. 1990).
Of the 22 metal COCs, nine were detected in western perimeter surveillance wellsduring 1999. Only chromium and hexavalent chromium exceeded California’s MCL of50 µg/L in western perimeter well W-373 (see Data Supplement Table 9-11). Groundwater samples collected from this well are from HSU 1B, and the nearby TreatmentFacility C (see Figure 8-1) treats ground water from HSU 1B for chromium. Conse-quently, concentrations of chromium (including hexavalent chromium) have beencontinually decreasing. Concentrations of iron reach 23% of California’s secondaryMCL in off-site monitoring well 14B1 (see Data Supplement Table 9-5). No other metalCOC concentration exceeded 23% of its MCL or secondary MCL in ground watersamples collected from western perimeter monitoring wells during 1999 (see DataSupplement Tables 9-2 through 9-11).
None of the ground water samples obtained from surveillance monitoring wellsduring 1999 had of any radioactivity that exceeded a drinking water MCL. A groundwater sample collected from well W-593 reached 75% of the MCL (0.41 ± 0.12 Bq/L, seeData Supplement Table 9-19) for gross alpha radioactivity, but that radioactivity wasnot significantly higher than for background well W-008 (0.38 ± 0.10 Bq/L, see DataSupplement Table 9-2). Gross beta radioactivity was highest in background well W-008(0.20 ± 0.10 Bq/L, see Data Supplement Table 9-2), but was only 11% of California’sMCL for gross beta radioactivity. The highest tritium activity measured in a Livermoresite perimeter ground water sample was 10.5 Bq/L, equal to 1.4% of the tritium MCL.The sample was from monitoring well W-373 (see Data Supplement Table 9-11).

9 Ground Water Monitoring
9-26 LLNL Environmental Report for 1999
Activities of total uranium (U-234 + U-235 + U-238) continued to be highest in thebackground wells W-008, W-017, and W-221 during 1999. Activities of total uranium inthose wells range from 0.19 ± 0.02 Bq/L to 0.30 ± 0.03 Bq/L (41% of California’s MCL).(See Data Supplement Tables 9-2, 9-3, and 9-4). Activities of total uranium are signif-icantly lower, from 0.024 ± 0.005 Bq/L (in well W-121) to 0.14 ± 0.02 Bq/L (19% ofCalifornia’s MCL in well W-1012), in ground water from each of the western monitoringwells. Uranium and its radioactive daughters, thorium-230, radium-226, and radon-222,occur naturally in the sediments and rock layers beneath and surrounding LLNL.Uranium activities did not exceed drinking water limits.
Livermore Site
Ground water downgradient of potential sources showed possible impact from tworeleases of metals to ground. Ground water at well W-307 near Building 322 showeda maximum concentration of chromium(VI) at 13 µg/L, just slightly greater than11 µg/L, measured in background well W-017 (see Data Supplement Tables 9-23 and9-4, respectively). Chromium (total) and chromium(VI) were detected at elevatedconcentrations in ground water samples from wells W-226 and W-306, downgradientfrom the Building 253 catch basin. Chromium (total) concentrations were measured as71 µg/L and 19 µg/L (at well W-226) and 37 µg/L (at well W-306); chromium(VI)concentrations were 27 and 24 µg/L (at well W-226) and 25, 33, and 13 µg/L (at wellW-306) (see Data Supplement Tables 9-24 and 9-25). The accumulated sediment in thecatch basin is a potential source of several metals (Jackson 1997). Only the concentrationof chromium (total) measured in a ground water sample collected from well W-226 onFebruary 11, 1999, exceeded the MCL of 50 µg/L for chromium drinking water.Chromium concentration was measured again during the fourth quarter and was belowthe MCL (see Data Supplement Table 9-24).
The initial analytical results from well W-148, downgradient from both the Plutoniumand Tritium Facilities, show plutonium-238 detected at 0.006 ± 0.002 Bq/L(0.17 ± 0.06 pCi/L). Meanwhile, the activity for plutonium-239+240 was analyzed atonly 0.0002 ± 0.0004 Bq/L (0.006 ± 0.012 pCi/L). This was considered unusual becauseplutonium-239 might be expected, but not plutonium-238. Plutonium-239 is the isotopethat was used in weapons development at LLNL, and all historical waste records atLLNL indicate the presence of plutonium-239 rather than plutonium-238. A secondaliquot of this sample was analyzed with a result of 0.01 ± 0.01 Bq/L for plutonium-238.Another ground water sample was collected from this well on March 15, 2000, andwas analyzed for americium-241 and expected plutonium radioisotopes; no radioiso-topes were detected. A ground water sample was collected downgradient fromthe Plutonium Facility from SIP-331-001 on October 21, 1999, and analyzed forplutonium-239+240 along with other analytes. The initial analytical result forplutonium-239+240 was 0.004 ± 0.002 Bq/L (0.10 ± 0.06 pCi/L). However, this sample

Ground Water Monitoring 9
LLNL Environmental Report for 1999 9-27
from SIP-331-001 appeared to contain too much particulate matter. The remainingsample was then filtered and reanalyzed by both the off-site analytical laboratory andthe on-site laboratory, and neither result indicated the presence of plutonium. Theconclusion is that no dissolved plutonium is present in the ground water downgradientfrom the Plutonium Facility. Ground water samples will continue to be collectedbiannually from these wells and analyzed for americium and plutonium radioisotopes.(Analytical results from first quarter 2000 samples from both wells are below detectablelimits for americium-241 and plutonium radioisotopes.)
Tritium activity in ground water samples collected from well W-148, downgradientfrom the Tritium Facility, reached 59 ± 7 Bq/L (1600 ± 180 pCi/L). This activity is lessthan 10% of the MCL of 740 Bq/L for tritium. The maximum tritium activity in groundwater samples from SIP-331-001, downgradient from the Plutonium Facility butupgradient from the Tritium Facility, was 18 ± 3 Bq/L (480 ± 80 pCi/L), and themaximum tritium activity in well W-305, upgradient of both Superblock buildings,was 4.8 ± 2.5 Bq/L (128 ± 69 pCi/L) (see Data Supplement Tables 9-26 through 9-28).
Site 300
The following are summaries of Site 300 ground water surveillance and compliancemonitoring results for 1999. Site 300 compliance monitoring results for 1999 have beenpublished previously (Brown et al. 1999a, b, c, and 2000; Christofferson and MacQueen1999a, b, c, and 2000; Christofferson and Taffet 1999a, b, c, and 2000). Compliancemonitoring results for Site 300 that exceeded permitted concentration limits, i.e.,statistical limits (SLs), or otherwise suggested a release of a COC to ground water, arediscussed again in the following summaries. Surveillance monitoring results for 1999have not been published elsewhere.
Elk Ravine Drainage Area
Pit 7
Compliance monitoring results for 1999 suggest that zinc was released to ground waterfrom the RCRA-closed Pit 7 landfill. However, it is more likely that it came from wasteburied in one of the other closed landfills nearby. Zinc has been detected historically atlow, but increasing, concentration in ground water at monitoring well K7-03 sincecompliance monitoring began there in 1993 (see Figure 9-4). During 1999, zinc exceededthe SL of 72 µg/L set in 1998 for well K7-03. It peaked at 160 µg/L during the thirdquarter. Its fourth-quarter concentration was 70 µg/L, slightly below the SL. Theabrupt rise and fall of zinc concentration observed during 1999 was likely caused by a

9 Ground Water Monitoring
9-28 LLNL Environmental Report for 1999
slug release from a nearby source. Well K7-03 is located hydraulically downgradient ofall four closed landfills constituting the Pit 7 Complex. Although LLNL is directed byWDR 93-100 to report any concentration of zinc in excess of its SL as an indication of arelease from Pit 7, if such a release occurred, it must have predated pit closure in 1993.Since postclosure monitoring began in 1993, zinc has been detected only sporadically atmonitoring well locations other than K7-03. It is improbable that there has been apostclosure release of zinc from Pit 7 because zinc was not detected at well NC7–48,which is located immediately downgradient of Pit 7 (Figure 9-4). Although a pre-1993release of zinc from Pit 7 is not excluded by the historical data, it was likely releasedmore recently from waste buried in the closed Pit 5 landfill, which is close to well K7–03.Pit 5 was inundated from below by rising ground water levels during several pastwinter rainy seasons (Taffet et al. 1996; Ziagos and Reber-Cox 1998b), which could havereleased metals to ground water.
A second-quarter total uranium activity of 0.7 Bq/L in ground water at monitoring wellK7-01 slightly exceeded the statistical limit of 0.6 Bq/L set for that well. LLNL reportedsimilar statistical evidence of a uranium release during 1998 (Galles 1998). Pits 3 and 5are located near well K7-01 (Figure 9-4). Both Pits 3 and 5 are known to have beenpartially inundated by rising ground water during the El Niño winter of 1997–1998,when the site received more than double the average seasonal rainfall (Ziagos andReber-Cox 1998b). Earlier CERCLA uranium investigations have characterized twosmall ground water plumes containing depleted uranium (uranium-238) that wasreleased in the past from Pit 5, Pit 7, and possibly Pit 3 (Taffet et al. 1996; see Chapter 8for a map of depleted uranium plumes existing at Site 300).
Tritium activity in the ground water at the Pit 7 monitoring well continued to increaseabove the MCL of 740 Bq/L (20,000 pCi/L) during 1999, reaching 28,500 Bq/L(770,000 pCi/L) during the fourth quarter. Previous CERCLA tritium investigationshave characterized three coalescing plumes of tritium-bearing ground water thatoriginate at Pits 3 and 5 and the Building 850 firing table on the west. The Building 850plume extends eastward to Pit 1 (Webster-Scholten 1994, Taffet et al. 1996, Ziagos andReber-Cox 1998b; see Chapter 8 for a map of tritium plumes existing at Site 300).Tritium activity above background occurs in ground water at several Pit 7 monitoringwells, but not at well NC7-48, which excludes Pit 7 as a significant tritium source.Modeling indicates that, given tritium’s short half-life of 12.3 years and the relativelyslow rate of ground water movement across the site, the activity of the released tritiumin ground water will decrease to below the MCL before it reaches a site boundary(Taffet et al. 1996).

Ground Water Monitoring 9
LLNL Environmental Report for 1999 9-29
As in the past, traces of VOCs including TCE, 1,1-DCE, and trichlorofluoromethane(Freon 11) were detected by the monitoring network during 1999 at concentrationsbelow their respective MCLs. Pit 7 is the likely source of the Freon 11. PreviousCERCLA remedial investigations have characterized a small plume containing VOCsthat were released in the past from waste buried in Pit 5 (Webster-Scholten 1994; seeChapter 8 for a map of VOC plumes existing at Site 300).
Elk Ravine
Analytical results for the Elk Ravine drainage area surveillance monitoring network for1999 are listed in Data Supplement Table 9-30 (see Figure 9-3). As in past years, arsenic,barium, chromium, selenium, vanadium, and zinc were detected at low concentrationstypical of ground water elsewhere in the Altamont Hills. Nitrate appears primarily inthe uppermost water-bearing zone. Maximum concentrations were measured in groundwater at monitoring wells NC7-61 (62 mg/L and 72 mg/L) and K2-04S (49 mg/L and61 mg/L). Well NC7-69, which monitors a deeper water-bearing zone, shows very lownitrate concentration (2.7 mg/L). A CERCLA investigation of nitrate in Site 300 groundwater is in progress (see Chapter 8 for a map of nitrate plumes existing at Site 300).
The explosive compounds HMX and RDX were detected at low concentrations up to7 µg/L in shallow ground water at one location, well NC7-61. Although these were theonly explosives detected in ground water by surveillance monitoring outside the HEProcess Area, it is not surprising at this location. This surveillance well is proximal tothe Building 850 firing table, where explosives have been detonated for decades. Thefiring table is a known source of depleted uranium (uranium-238) and tritium in theground water (see Chapter 8 for the CERCLA map of contaminant plumes).
Tritium activity was above background in many of the shallow ground water surveil-lance samples obtained during 1999 from Elk Ravine. Tritium, as tritiated water (HTO),has been released in the past from beneath the firing table at Building 850 (Taffet et al.1996). HTO was transported to ground water beneath the Building 850 firing tablegravels by percolating rainwater. HTO has also been released from closed landfill Pits 3and 5 over the past decade during wetter-than-normal winters when ground water roseand contacted buried firing table wastes (Ziagos and Reber-Cox 1998b). The most recentrelease occurred during the wet El Niño winter of 1997−1998. The plumes are mostlyshallow in the Neroly lower blue sandstone unit and overlying alluvium (see Chapter 8for the CERCLA map of tritium plumes). Tritium activity was not discernible in groundwater samples from the deeper water-bearing zone monitored at surveillance wellNC7-69.

9 Ground Water Monitoring
9-30 LLNL Environmental Report for 1999
The majority of the Elk Ravine surveillance network tritium measurements made during1999 support earlier CERCLA studies, which show that, despite additional releases, thetritium contents and extents of the plumes are generally diminishing over time becauseof natural decay and dispersion (Ziagos and Reber-Cox 1998b). LLNL observe smallincreases in tritium activity at the distal end of the plume (wells K2-01C, NC2-11D, andNC2-12D), while those wells monitoring the bulk of the plume (NC7-61, K2-04D, andK2-04S) show relatively large decreases in tritium activity over the past several years.For example, tritium activity in ground water at well NC7-61 decreased from 6500 Bq/Lin 1996 to 3500 Bq/L in 1999.
Surveillance measurements in Elk Ravine of gross alpha, gross beta, and uraniumradioactivity were all low and indistinguishable from background. (Note that grossbeta measurements do not detect the low-energy beta emission from tritium decay.)
Pit 2
No release of a COC from Pit 2 to ground water is indicated by the surveillance moni-toring data obtained during 1999 (see Figure 9-5). Analytical results for the Pit 2surveillance monitoring network are presented in Data Supplement Table 9-31. Severalmetals were detected at low concentrations. Most were below analytical reportinglimits, which are in the parts per billion (ppb) range. None exceeded an MCL. Arsenicand barium concentrations were within the range of natural (background) concentra-tions in ground waters at Site 300 (Webster-Scholten 1994). The radioactivity measure-ments show only low background activities for gross alpha, gross beta, and tritium.
Pit 1
Compliance monitoring results for 1999 suggest that lead was released to ground waterfrom the RCRA-closed Pit 1 landfill (see Figure 9-5). However, it more likely came fromanother source. Over the years, lead has been detected sporadically at low concentra-tions in ground water samples from monitoring wells located both upgradient anddowngradient from Pit 1. Lead was detected more frequently in ground water samplesobtained prior to the capping and RCRA-closure of Pit 1 in 1993, implying that the capis effectively limiting the release of lead. The monitoring data do not point to Pit 1 asbeing a source of any other COC to ground water. More likely, the lead detected inground water sampled at downgradient well K1–04 during 1999 is the same leaddetected years before at upgradient well K1-01C.
Throughout 1999, tritium activity measured above background in the ground water atPit 1 monitoring wells K1-01C, K1-02B, and K1-03, where it exceeded the SL. However,no release of tritium from Pit 1 is indicated by these measurements. Rather, the tritium

Ground Water Monitoring 9
LLNL Environmental Report for 1999 9-31
activity represents a distal lobe of the Building 850 tritium plume, which extendseastward to Pit 1 (see Chapter 8 for a CERCLA map of the Building 850 tritium plumeextending to Pit 1).
Measurements of radium, thorium, and uranium made during 1999 in ground watersamples from Pit 1 compliance monitoring wells all showed low activities indistinguish-able from background.
The VOC 1,1,2-trichloro-1,2,2-trifluoroethane (Freon 113) was detected during 1999 at amaximum concentration of 140 µg/L in ground water at Pit 1 monitoring wells K1-05,K1-08, and K1-09 (Figure 9-5). The drinking water MCL for this VOC is 1200 µg/L.Previous CERCLA investigations have linked the appearance of Freon 113 in Pit 1monitoring wells to past spills in the Advanced Test Accelerator area, about 200 m westand cross-gradient from the affected wells (Webster-Scholten 1994; Taffet et al. 1996).
Pit 8
No release of a COC to ground water from Pit 8 is indicated by the surveillance moni-toring data obtained during 1999. Analytical results for the Pit 8 surveillance monitoringnetwork are presented in Data Supplement Table 9-32. Two VOCs, TCE and 1,2-DCA,were detected below their 5 µg/L MCLs. A relatively small VOC plume exists beneaththis area (see Chapter 8 ), which originated prior to 1981 from waste discharged to a drywell upgradient of Pit 8, near Building 801 (Webster-Scholten 1994).
Arsenic, chromium, selenium, and vanadium were detected in concentrations similar totheir natural levels in ground water elsewhere in the Altamont Hills.
Pit 9
No evidence for a release from Pit 9 is indicated by the surveillance monitoring dataobtained during 1999. Analytical results for the Pit 9 surveillance monitoring networkare presented in Data Supplement Table 9-33. COCs either were not detected or wereindistinguishable from natural background concentrations. Since annual surveillancemonitoring of ground water began there more than a decade ago, no evidence of arelease of any COCs from Pit 9 has been recorded.
Corral Hollow Creek Drainage Area
Pit 6
No new release of designated COCs from Pit 6 is indicated by the compliance monitor-ing results for 1999. However, a release of benzoic acid, which is not a designated COC,

9 Ground Water Monitoring
9-32 LLNL Environmental Report for 1999
is suggested by the data. Designated COCs known to have been released to groundwater prior to pit closure continued to be detected, but their concentrations eitherremained steady during 1999, or followed historically decreasing trends.
Quarterly COC measurements were mostly below SLs. The few COC measurementsthat exceeded SLs were not confirmed by retests. At the time of the fourth-quartersampling in October 1999, designated COCs were all below their respective MCLs.
During 1998, the VOC, 1,2-dichloroethane (1,2-DCA), exceeded its SL in ground water atwell EP6-09 (see Figure 9-8). Subsequently, during the fall of 1998, a volume of about270,000 L of VOC-contaminated water was pumped from well EP6-09. VOCs, including1,2-DCA and TCE, were removed from the pumped water by air-sparging. Evidence ofthe success of this action was the subsequent decrease in TCE concentration to below theMCL, and the disappearance of detectable concentrations of 1,2-DCA in the groundwater sampled at well EP6-09 during 1999.
The extractable organic compound bis(2-ethylhexyl)phthalate, which is not a designatedCOC, was detected during 1999 in one upgradient ground water sample at a concentra-tion of 4 µg/L and in two downgradient samples at concentrations of 15 and 24 µg/L.This compound, with an MCL of 4 µg/L, was previously detected in 1998 in fourground water samples at concentrations up to 41 µg/L. The source of this compound isunknown. There is no record of it being placed in Pit 6, but the chemical has been usedat Site 300.
The extractable organic compound benzoic acid, which has no MCL, was detectedquarterly during 1999 at concentrations up to 75 µg/L in ground water samples fromdowngradient well K6-19. Of 104 total analyses made since November 1997 in groundwater samples obtained throughout Site 300, benzoic acid has been detected in only fiveground water samples, all obtained from well K6-19 during 1999. Although the first-quarter detection was not confirmed by two additional retest analyses, the chemicalreappeared in increasing concentration during the second, third, and fourth quartersof 1999.
During 1999, tritium activity remained above background and relatively constant inground water samples from two downgradient wells. The maximum activity recordedwas 93.2 Bq/L, which is less than 13% of the 740 Bq/L MCL for tritium in drinkingwater. Relatively elevated tritium activity is contained within a small volume of groundwater adjacent to Pit 6. Continued monitoring of tritium there is being conducted underCERCLA auspices (see Chapter 8 for a CERCLA map of the small tritium plume).

Ground Water Monitoring 9
LLNL Environmental Report for 1999 9-33
Building 929 Closed HE Burn Facility
Analyses of ground water samples obtained quarterly from the regional aquiferdowngradient of the closed HE burn facility show no evidence of contamination frompast operation of the facility. Except for the presence of coliform bacteria detected inground water samples from a new well, W-829-22, the analytical results representbackground concentrations of substances dissolved from natural sources in theunderlying rocks (see Figure 9-9). Monitoring well W-829-22 was newly constructed in1998. Bacteria may have been introduced during construction. Continued monitoring isnecessary to determine their source. Analytical results for 1999 for three of the fourwells that are used to monitor the deep regional aquifer are listed in Data SupplementTable 9-34. (A fourth deep well, W-827-04, was dry during 1999.)
As in the past, analyses of ground water samples obtained from the shallower perchedground water beneath the closed facility do show evidence of contamination. Analyticalresults for 1999 for the two wells that are used to monitor the perched ground water arelisted in Data Supplement Tables 9-35. The primary contaminant in the perched groundwater is TCE. TCE concentrations up to 310 µg/L were measured during 1999. Theperched water has a high total concentration of dissolved substances. Many of theinorganic analytes measured have natural sources in the surrounding rocks. Theperched ground water does not contain clearly anthropomorphic chemicals such aspesticides, PCBs, herbicides, or the explosives compounds that were burned at thefacility and that are known to exist at shallow depth in the soil above the perchedground water. However, perchlorate was detected in the perched ground water atconcentrations up to 21 µg/L, and it may be linked to past operations at the closed burnfacility. Similarly, nitrate was measured in the perched ground water at concentrationsup to 230 mg/L, and it may be a contaminant from the closed facility above it. CERCLAinvestigations of perchlorate and nitrate in ground water at Site 300 are in progress.
Water Supply Wells
Analytical results for Site 300 water supply wells 18 and 20 are presented in DataSupplement Tables 9-36 and 9-37. As in past years, TCE was detected below the MCL of5 µg/L in surveillance ground water samples from well 18 (0.63, and 0.54 µg/L) (seeFigure 9-3). The source of the TCE has not yet been identified. Methylene chloride wasdetected at low concentration in two quarterly water samples from well 20. However,both detections were accompanied by similar detections in field blanks or methodblanks, which invalidate the results. Gross alpha, gross beta, and tritium activities inwater samples from both production wells are very low and are indistinguishable fromnatural background activities. Barium (62 µg/L) and copper (11 µg/L) were detectedonce in well 20 water samples during 1999 at concentrations far below their MCLs of1000 µg/L.

9 Ground Water Monitoring
9-34 LLNL Environmental Report for 1999
Surface Impoundments
The two leachate collection and removal systems were monitored weekly for thepresence of liquids. In 1999, no water was recovered from the leachate collection andremoval system. The visual inspections indicate that the impoundment liners did notleak wastewater during 1999. No water has been observed in the leachate collection andremoval system since liner repairs were made in 1997. No water was found in fivelysimeters, which also indicates that the impoundment liners did not leak wastewaterduring 1999. Analytical results for all monitored constituents in Site 300 ground waterbeneath the surface impoundments are contained in the LLNL Experimental Test Site 300Compliance Monitoring Report for Waste Discharge Requirements 96-248, Annual/FourthQuarter Report 1999 (Brown et al. 2000).
The explosive compounds (HMX, RDX, and TNT) and perchlorate are the compoundsmost indicative of discharges to ground water from the Explosives Process Area surfaceimpoundments. However, prior to 1985, explosives wastewater was discharged intounlined ponds in the vicinity of the surface impoundments, where it infiltrated thesoil and some reached ground water. Because of this past practice, it is necessary todiscriminate between new releases from the surface impoundments and past releasesfrom the unlined ponds. Analyses of ground water from upgradient monitoring wellW-817-01 during 1999 showed HMX concentrations between 8.5 and 17.6 µg/L (seeFigure 9-10). HMX was not detected above the analytical reporting limit of 1.0 µg/L inany of the ground water samples from the downgradient monitoring wells. Groundwater samples from three wells contained detectable concentrations of the explosivecompound RDX above the analytical reporting limit of 0.85 µg/L. The ground watersamples containing RDX were from upgradient well W-817-01 (from 24 to 54 µg/L) andlower concentrations in downgradient wells W-817-03 and W-817-04. The RDX andHMX originated at closed disposal sites upgradient of the present surface impound-ments (Raber and Carpenter 1983, Webster-Scholten 1994). Other explosive compoundsor components of explosive compounds, 4-amino-2,6-dinitrotoluene and perchlorate,were detected in upgradient well W-817-01 and in several downgradient wells in thismonitoring network. The concentrations observed in the downgradient wells do notexceed their permitted limits, but concentrations of perchlorate exceed the CaliforniaDepartment of Health Services’ recommended limit of 18 µg/L in drinking water. Theremediation of these compounds is discussed in Chapter 8 of this document.
As in the past, ground water concentrations of arsenic and nitrate continued to exceeddrinking water MCLs in ground water samples from all the surface impoundmentmonitoring wells during 1999. Concentrations of both arsenic and nitrate in groundwater have historically exceeded their respective MCLs (0.050 mg/L for arsenic and45 mg/L for nitrate) in this area. Background concentrations of arsenic in ground watermonitoring wells upgradient from the surface impoundments have been measured at

Ground Water Monitoring 9
LLNL Environmental Report for 1999 9-35
concentrations above the drinking water MCL (Webster-Scholten 1994). Although thedistribution of arsenic over time and throughout the area suggests a natural source,the occurrence and concentration of arsenic at Site 300 is the subject of a continuingCERCLA study. The remediation of all of these compounds (except for the elementarsenic) is discussed in Chapter 8 of this document.
During 1999, all discharges into the surface impoundments were in compliance withdischarge concentration limits. See the LLNL Experimental Test Site 300 ComplianceMonitoring Report for Waste Discharge Requirements 96-248, Annual/Fourth Quarter Report1999 (Brown et al. 2000).
Percolation Pits
During 1999, the percolation pits at Buildings 806A, 827D, and 827E operated normallywith no overflows. Standing water was regularly noted in the Building 827C percola-tion pit inspections, and the pit overflowed during the third quarter. A sample formetals analysis was collected from the overflow water. Ten metals were detected abovethe analytical reporting limit: aluminum, boron, total chromium, copper, iron, lead,manganese, molybdenum, nickel, and zinc. Water from the overflow infiltrated andsaturated the soil surrounding the percolation pit but did not reach a surface waterdrainage course. Metals data for this overflow event are contained in the LLNLExperimental Test Site 300 Compliance Monitoring Report for Waste Discharge Requirements96-248, Annual/Fourth Quarter Report 1999 (Brown et al. 2000).
Sewage Evaporation and Percolation Ponds
All wastewater parameters for the sewage evaporation and percolation ponds compliedwith permits provisions and specifications throughout 1999, and there were nooverflows to the percolation pond.
In June 1999 LLNL performed corrective actions to mitigate odors from the evaporationpond and modified operations to prevent a recurrence (see Figure 9-11). The modifiedoperations included raising and maintaining a higher water level in the evaporationpond. LLNL requested permission from the CVRWQCB to operate the pond withreduced freeboard because of the change in operations. All other observations—leveecondition, color, and odor—indicated normal operations.
All of the ground water monitored constituents were also in compliance with permittedlimits. Nitrate concentrations in downgradient monitoring wells W-26R-01 andW-26R-05 decreased to 33 and 38 mg/L, respectively, during the third quarter. LLNLhas not been able to determine the origin of this nitrate, but a sitewide study of nitrate at

9 Ground Water Monitoring
9-36 LLNL Environmental Report for 1999
Site 300 is continuing, and LLNL continues to monitor these wells and nearby off-sitewells for nitrate concentrations (see also Chapter 8).
Off-Site Water Supply Wells
Analytical results for the off-site water supply wells for 1999 are presented in DataSupplement Tables 9-40 to 9-44. Generally, no COC attributable to LLNL activities wasdetected in the off-site ground water samples. Arsenic and barium were widelydetected at these locations, but their concentrations were below MCLs and consistentwith natural sources in the rocks. Scattered detections of metals were all below MCLsand were probably related to metals used in pumps and supply piping.
As in past years, TCE was detected at concentrations up to 0.74 µg/L in the groundwater samples obtained from well GALLO1 (see Figure 9-3). Previous CERCLAremedial investigations concluded that the TCE in the GALLO1 well water was likelycaused by a localized surface spill on the property, possibly solvents used to service theprivate well (Webster-Scholten 1994). (Surveillance monitoring of a similarly sited well,GALLO2, was terminated in 1991 because of contamination from chemicals leaking fromthe pumping apparatus.) Radioactivity measurements of off-site ground water are allindistinguishable from natural background activities.
Environmental Impacts
The overall impact of LLNL Livermore site and Site 300 operations on off-site groundwaters is minimal. With the exception of VOCs being remediated under CERCLA atboth sites, current LLNL operations have no measurable impact on ground watersbeyond the site boundaries.
Livermore Site and Environs
Ground water monitoring at the LLNL Livermore site and in the Livermore Valleyindicates that LLNL operations have minimal impact on ground water beyond the siteboundary. (See Chapter 8 for CERCLA remediation activities with VOCs.) During 1999,neither radioactivity nor concentrations of elements or compounds detected in groundwater from any off-site monitoring well exceeded primary drinking water MCLs. Themaximum tritium activity of 10.5 Bq/L (283 pCi/L), only 1.4% of the MCL, was detectedin the ground water sample collected from on-site well W-373 in June (see Figure 9-2).

Ground Water Monitoring 9
LLNL Environmental Report for 1999 9-37
The maximum tritium activity measured off site in the Livermore Valley was evenlower, 8.5 Bq/L, in well 11B1 (see Figure 9-1).
Of the Livermore on-site monitoring wells, no inorganic data exceeded primary MCLs,with the exceptions of chromium in monitoring well W-373 and nitrate in monitoringwell W-1012 (see Figure 9-2). Chromium(VI) in ground water in the vicinity of moni-toring well W-373 is being removed at Treatment Facilities B and C. The LLNL GroundWater Project reports on the treatment of ground water in the vicinity of the treatmentfacilities (see Chapter 8). Concentrations of nitrate in ground water samples collectedfrom well W-1012 in June 1999 exceeded California’s MCL of 45 mg/L. Nitrate abovethe MCL has not migrated off site. LLNL continues to monitor this well and monitoringwell W-571, which is off site and about 350 meters downgradient from well W-1012, todetermine if nitrate at concentrations above the MCL migrates off site.
The arroyo sediment data included in Chapter 10 indicate no potential adverse impacton ground water through the arroyos that cross the Livermore site.
Site 300
Ground water monitoring at Site 300 and adjacent properties in the Altamont Hillsshows minimal impact of LLNL operations on ground water beyond the siteboundaries.
Within Site 300, the chemicals detected in ground water beneath the High ExplosivesProcess Area will not migrate off site. Plans to remediate TCE, explosive compoundssuch as RDX, perchlorates, and nitrate are currently being implemented under CERCLAauspices (see Chapter 8). Additionally, LLNL is investigating the distribution andorigins of arsenic and zinc in this area.
VOCs, primarily the solvent TCE, have been released historically to shallow groundwater at numerous locations at Site 300 (see Chapter 8 and references cited therein).With the exceptions of a small plume in the General Services Area area that extendsminimally off site along Corral Hollow Road, all of the TCE-bearing ground water is onsite. The plume extending off site from the Eastern GSA area is being drawn back to thesite by pumping, and the TCE is being removed from the ground water.
Tritiated water and depleted uranium have been released to ground water from landfillsand several firing tables in the northern part of Site 300. The boundaries of the slowlymoving ground water plumes lie entirely within the site boundaries. Fate and transportmodels predict that the tritium will decay naturally to an activity below the drinking
9 Ground Water Monitoring
9-38 LLNL Environmental Report for 1999
water MCL before the tritium-bearing ground water reaches a site boundary (Webster-Scholten 1994, Taffet et al. 1996).
Maximum uranium activities that could reach potential exposure points (hypotheticalground water supply wells) at the northern boundary of Site 300 are estimated to be0.08 Bq/L from plumes originating at Pits 5 and 7, and 0.05 Bq/L at the easternboundary of Site 300 from the plume originating at Building 850. These conservativelyestimated maximum activities are small when compared with the 0.74 Bq/L CaliforniaMCL for uranium in drinking water. The predicted incremental lifetime cancer risksfrom the released uranium are less than one-in-a-million at the hypothetical exposurepoints on the Site 300 boundary (Taffet et al. 1996). The VOCs, tritium, nitrate, Freon,perchlorate, and depleted uranium in the shallow ground water beneath Site 300 presentno current health risks because the contaminated water is not used for potable domestic,livestock, or industrial water supplies.

10
LLNL Environmental Report for 1999 10-1
Soil and Sediment Monitoring
Gretchen M. GallegosErich R. Brandstetter
Donald H. MacQueen
Introduction
The soil and sediment monitoring analysis that Lawrence Livermore National Laboratoryperformed in 1999 included work in four areas: surface soil in the Livermore Valley andat Site 300, sediment at the Livermore site, vadose zone soils at the Livermore site, and aspecial study at Big Trees Park in the City of Livermore.
Soil is weathered material, mainly composed of disintegrated rock and organic material,that sustains growing plants. Soil can contain pollutants originally released directly tothe ground, to the air, or through liquid effluents. Department of Energy (DOE) guid-ance for environmental monitoring states that soil should be sampled to determine ifthere is measurable, long-term buildup of radionuclides in the terrestrial environmentand to estimate environmental radionuclide inventories (U.S. Department of Energy1991). The guidance recommends monitoring for radionuclides specific to a particularoperation or facility as well as those that occur naturally. Particulate radionuclides areof major interest in the LLNL soil monitoring program because airborne particulatereleases are the most likely pathway for LLNL-induced soil contamination.
Sediments are defined, for the purposes of this chapter, as finely divided, solid materialsthat have settled out of a liquid stream or standing water. The accumulation of radio-active materials in sediment could lead to exposure of humans through their ingestionof aquatic species, through sediment resuspension into drinking water supplies, or asan external radiation source (U.S. Department of Energy 1991). However, the LLNLLivermore site and Site 300 do not have habitats for aquatic species that are consumed bypeople, nor do they have surface drainage that directly feeds drinking water supplies.
Soils in the vadose zone—the region below the land surface where the soil pores are onlypartially filled with water—are collected in arroyo channels at the Livermore site as part ofthe Ground Water Protection Management Program (GWPMP). Infiltration of naturalrunoff through arroyo channels is a significant source of ground water recharge, account-ing for an estimated 42% of resupply for the entire Livermore Valley ground water basin(Webster-Scholten 1994). Soils in the shallow vadose zone are collected and analyzed to

10 Soil and Sediment Monitoring
10-2 LLNL Environmental Report for 1999
provide information about possible constituents that may be dissolved as runoff waterinfiltrates through the arroyo to the ground water.
In addition to the soil, sediment, and vadose zone soil sampling conducted on an annualbasis, LLNL may also conduct special sampling to address areas of interest or concern, asin the case of Big Trees Park in Livermore. During previous sampling at this park in 1993and 1995, plutonium had been detected at concentrations above fallout background.Continuing the work initiated by soil sampling at Big Trees Park in 1998, LLNL and theAgency for Toxic Substances Disease Registry (ATSDR) published reports summarizingthe analytical results for soil samples collected at the park.
Sampling Locations
Since 1971, surface soil sampling in the vicinity of the LLNL Livermore site and Site 300has been part of a continuing LLNL monitoring program designed to measure anychanges in environmental levels of radioactivity and to evaluate any increase in radio-activity that might have resulted from LLNL operations. These samples have beenanalyzed for plutonium and gamma-emitting radionuclides, such as depleted uraniumthat is used in some explosive tests at Site 300. The inclusion of other gamma-emitting,naturally occurring nuclides (potassium-40 and thorium-232) and the long-lived fissionproduct, cesium-137, provides background information and baseline data on globalfallout from historical aboveground nuclear weapons testing. In addition, LLNLanalyzes Site 300 soils for beryllium because it is a potentially toxic metal used at thissite. Soils in the Livermore vicinity were analyzed for beryllium from 1991 to 1994.However, analysis for beryllium was discontinued at the Livermore site in 1995 becauseberyllium was never measured above background values.
Surface soil samples are collected at 19 locations in the Livermore Valley (Figure 10-1)and 15 locations at or near Site 300 (Figure 10-2). The locations were selected to repre-sent background concentrations (distant locations unlikely to be affected by LLNLoperations) as well as areas where there is the potential to be affected by LLNL opera-tions. Areas with known contaminants, such as the Livermore Water Reclamation Plant(LWRP), are also sampled.
Site 300 soil sampling locations are established around firing tables and other areas ofpotential soil contamination. PRIM location was added to the sampling program in 1998to correspond with air sampling conducted at that location. The PRIM site is downwindof Site 300 and sufficiently close to the Site 300 boundary to potentially be affected by

Soil and Sediment Monitoring 10
LLNL Environmental Report for 1999 10-3
Livermore
Lake Del Valle
Valle
citos
Roa
d
Stanley Boulevard
VascoRoad
TeslaRoad
Gre
envi
lleR
oad
Mines Road
East Avenue
Shadow Cliffs
NorthLivermore
Avenue
Cross
Roa
dSouth Livermore
Avenue
Arr
oyo
Roa
d
HOSP
WRP1–WRP6 PATT
ZON7
AMONCHUR
FCC
N
580
84
580
3 6
Scale: Kilometers
0
Soil samplinglocations
LLNL perimeter
MET
COW
VISSALV
MESQ
TANK
NEP
Alta
mon
t Pass Road
Figure 10-1. Surface soil sampling locations, Livermore Valley, 1999.
Site 300 operations. Approximately 10% of locations are sampled in duplicate; twoidentical samples are collected at each location chosen for this sampling. All soil andsediment sampling locations have permanent location markers for reference.
Similarly, sediment samples have been collected from selected arroyos and otherdrainage areas at and around the Livermore site since 1988; these locations largelycoincide with selected storm water sampling locations (see Chapter 7). The number ofsediment sampling locations was reduced in 1994 to correspond to reductions in stormwater sampling locations. Although ALPO was added as a new sediment samplinglocation in 1997, it was not sampled in 1997, 1998, or 1999 because the location wascontinually under water from releases upstream of the Livermore site. Sedimentsampling locations have not been established at Site 300. The drainage courses atSite 300 are steep, causing flowing water to scour the drainages, so that sediment is notdeposited. Because of these conditions, sediment sampling at Site 300 is not warranted.

10 Soil and Sediment Monitoring
10-4 LLNL Environmental Report for 1999
Corral Hollow Road
Livermore
Tracy
858S
NPS
812N
DSW
EVAP
851N
856N
834W
GOLF
801W
801N
WOBS 0 1600800
Scale: Meters
Soil samplinglocations
Site 300 perimeter
801E
EOBS
N
PRIM
Figure 10-2. Site 300 surface soil sampling locations, 1999.
Vadose zone soil sampling has been conducted since 1996. These sampling locationscorrespond to the same selected storm water sampling locations as the sedimentsampling locations (see Figure 10-3). The collocation of sampling for these three mediafacilitates comparison of analytical results. As with sediment samples, vadose zonesamples are not collected at Site 300.
Methods
Surface soil, sediment, and vadose zone soil sampling is conducted according to written,standardized procedures (Tate et al. 1999). Soil samples are collected from undisturbedareas near permanent location markers. These areas generally are level, free of rocks,and unsheltered by trees or buildings. All surface soil samples are collected from the

Soil and Sediment Monitoring 10
LLNL Environmental Report for 1999 10-5
Arroyo Las Positas
Arroyo Seco
ASS2
ASW
WPDC
CDBESB ALPE
ALPO
GRNE
Patterson Pass Road
Gre
envi
lle R
oad
Vas
co R
oad
East Avenue
Scale: Meters
Sampling locations
Drainage channel
Direction of flow
LLNL perimeter
4002000
N
Figure 10-3. Sediment and vadose zone sampling locations on or near the Livermoresite, 1999.
top 5 cm of soil because aerial deposition is the primary pathway for potential contami-nation, and resuspension of materials from the surface into the air is the primaryexposure pathway to nearby human populations. Sediments are collected annuallyfrom drainages at and around the LLNL Livermore site after the cessation of springrunoff. Samples to be analyzed for particulate radionuclides are collected from the top5 cm of soil; samples to be analyzed for tritium are collected 5–15 cm deep to obtainsufficient water in the sample for analysis. Vadose zone soil samples are collected at30−45 cm deep for metals analysis, and at 45–65 cm deep for semi-volatile organiccompound analysis.

10 Soil and Sediment Monitoring
10-6 LLNL Environmental Report for 1999
In 1999, surface soil samples in the Livermore Valley were analyzed for plutonium andgamma-emitting radionuclides. Samples from Site 300 were analyzed for gamma-emitting radionuclides and beryllium. Analysis of Site 300 soil samples for plutoniumwas discontinued in 1997 because plutonium has not been used at the site, and sampleresults have continuously been at background levels since sampling was begun in 1972.Sediment samples collected at the Livermore site were analyzed for plutonium andgamma-emitting radionuclides and tritium. Vadose zone samples were analyzed fortotal and soluble metals and for semi-volatile organic compounds.
Prior to radiochemical analysis, surface soil and sediment samples are dried, ground,sieved, and homogenized. The samples are analyzed by LLNL’s Chemistry and MaterialsScience Environmental Services (CES) laboratory. The plutonium content of a 100-gsample aliquot is determined by alpha spectroscopy. Other sample aliquots (300 g) areanalyzed for more than 150 radionuclides by gamma spectroscopy using a high-puritygermanium (HPGe) detector (Hall and Edwards 1994a, b, and c). The 10-g subsamplesfor beryllium analyses are sent to a contract analytical laboratory and are analyzed bygraphite-furnace atomic absorption spectroscopy. For sediment samples collected fortritium analyses, CES uses freeze-drying techniques to recover water from the samplesand determines the tritium content of the water by liquid-scintillation counting. Vadosezone soil samples are analyzed by a contract laboratory. The analytical methods includethe toxicity characteristic leaching procedure (TCLP, EPA Method 8240) for semi-volatileorganic compounds, and soluble metals and total metals by EPA Methods 200.7, 245.2,7471A, and 6010B. Chain-of-custody procedures are followed throughout the sampling,delivery, and analytical processes.
Livermore Valley Surface Soil Results
Table 10-1 presents summary data on the concentrations of plutonium-239+240,plutonium-238, americium-241, cesium-137, potassium-40, thorium-232, uranium-235,and uranium-238 in surface soils from the Livermore Valley sampling locations.Complete data for 1999 soil and sediment sampling are presented in Table 10-1 of theData Supplement.
The concentrations and distributions of all observed radionuclides in soil for 1999 arewithin the ranges reported in previous years and generally reflect worldwide falloutand naturally occurring concentrations. The ratio of uranium-235 to uranium-238generally reflects the natural ratio of 0.7%; however, there is significant uncertainty inthe uranium-235/uranium-238 ratio because of the difficulty in measuring smallquantities of uranium-238 by gamma spectroscopy.

Soil and Sediment Monitoring 10
LLNL Environmental Report for 1999 10-7
Table 10-1. Summary of surface soil and sediment radioanalytical data, 1999.
Analyteand location
Detectionfrequency(a) Median IQR(b) Maximum
238Pu (µBq/dry g)
Livermore Valley soils 12/13 2.7 3.0 22.8
LWRP(c) soils 6/6 108 130 354
Livermore site sediments 4/7 5.0 23.6 211239+240Pu (µBq/dry g)
Livermore Valley soils 13/13 72.5 51 507
LWRP soils 6/6 2150 2230 6960
Livermore site sediments 7/7 84 382 2180137Cs (mBq/dry g)
Livermore Valley soils 12/13 1.6 1.9 6.1
LWRP soils 6/6 1.1 1.4 4.0
Livermore site sediments 5/7 0.5 0.4 1.3
Site 300 soils 15/15 3.2 2.6 5.640K (Bq/dry g)
Livermore Valley soils 13/13 0.466 0.067 0.581
LWRP soils 6/6 0.359 0.040 0.407
Livermore site sediments 7/7 0.466 0.052 0.529
Site 300 soils 15/15 0.440 0.087 0.574232Th (µg/dry g)(d)
Livermore Valley soils 13/13 7.5 1.2 9.2
LWRP soils 6/6 7.2 0.6 7.8
Livermore site sediments 7/7 5.9 2.0 8.6
Site 300 soils 15/15 10.2 2.5 14.2235U (µg/dry g)(e)
Livermore Valley soils 13/13 0.020 0.005 0.024
LWRP soils 6/6 0.018 0.002 0.020
Livermore site sediments 7/7 0.016 0.006 0.024
Site 300 soils 15/15 0.025 0.012 0.148238U (µg/dry g)(f)
Livermore Valley soils 13/13 1.6 0.5 2.5
LWRP soils 6/6 2.0 0.2 2.2
Livermore site sediments 6/7 1.9 0.8 2.7
Site 300 soils 15/15 2.3 2.1 71.3

10 Soil and Sediment Monitoring
10-8 LLNL Environmental Report for 1999
Table 10-1. Summary of surface soil and sediment radioanalytical data, 1999(concluded).
Analyteand location
Detectionfrequency(a) Median IQR(b) Maximum
3H (Bq/L extracted water)(g)
Livermore site sediments 4/7 4.5 —(i) 75.1
241Am (mBq/dry g)(h)
LWRP soils 2/6 <1.1 —(i) 2. 9
Be (mg/kg)(j)
Site 300 soils 15/15 0.6 0.2 2.5
a Detection frequency = the fraction of samples having a measured value above the detection limit.
b IQR = Interquartile range; the difference between the top of the third and the top of the first quartiles of the data.
c LWRP = Livermore Water Reclamation Plant.
d Thorium-232 activities in Bq/dry g can be determined by dividing the weight in µg/dry g by 247.3, and pCi/dry g can bedetermined by dividing by 9.15.
e Uranium-235 activities in Bq/dry g can be determined by dividing the weight in µg/dry g by 12.5, and pCi/dry g can bedetermined by dividing by 0.463.
f Uranium-238 activities in Bq/dry g can be determined by dividing the weight in µg/dry g by 80.3, and pCi/dry g can bedetermined by dividing by 2.97.
g Only sediment samples are analyzed for tritium.
h Americium-241 is detected only in LWRP soil samples.
i IQR is not calculated because of high incidence of reported values below detection limits.
j Only Site 300 samples are analyzed for beryllium.
Plutonium has, in the past, been detected at levels above background at ZON7, theoff-site soils sampling location near the LLNL Livermore site and in the prevailingdownwind direction. Because of the high level of variability inherent in the measure-ment of soils, we do not always find plutonium above background levels at thislocation. In 1999, as in 1994 through 1998, plutonium-239+240 was detected atbackground levels, 156 µBq/dry g (4.2 × 10⁻³ pCi/dry g), at location ZON7. Since 1973,soil samples in this area have generally shown plutonium-239+240 values that arehigher than background, and location VIS, one of the on-site locations upwind of ZON7,did exhibit a plutonium-239+240 value slightly above background, 507 µBq/dry g(1.4 × 10⁻² pCi/dry g), in 1999. The slightly higher values at and near the Livermore sitehave been attributed to historic operations, which included the operation of solar evap-orators for plutonium-containing liquid waste in the southeast quadrant (Silver et al.1974). LLNL no longer operates the solar evaporators or engages in any other open-airtreatment of plutonium-containing waste. Nonetheless, plutonium-239+240 fromhistoric operations is carried off site by resuspension of soil by wind. Similarly, elevated

Soil and Sediment Monitoring 10
LLNL Environmental Report for 1999 10-9
levels of plutonium-239+240 (resulting from an estimated 1.2 × 10⁹-Bq [32-mCi]plutonium release to the sanitary sewer in 1967 and earlier releases) were first observedin soils near LWRP during the early 1970s, and were again detected at LWRP samplinglocations. As in 1997 and 1998, americium-241 was detected in LWRP samples; it is mostlikely caused by the natural decay of the trace concentrations of plutonium-241 thatwere present in the release.
Historical plots of median plutonium-239+240 concentrations in soil in the LivermoreValley upwind and downwind of the center of the LLNL Livermore site, at Site 300, andat LWRP are shown in Figure 10-4. Livermore Valley upwind and Site 300 concentra-tions have remained relatively constant since monitoring began and generally areindicative of worldwide fallout. Greater variation can be noted in the downwindconcentration data, which in 1999 included sampling locations VIS, PATT, NEP, COW,and ZON7, compared with the upwind and historic Site 300 data. The concentrationsof plutonium at the downwind locations reflect resuspension of low-level plutoniumcontamination from soils in the southeast quadrant of the Livermore site. Greatervariability in plutonium-239+240 is seen in samples from LWRP. Because theplutonium-239+240 is likely to be present in discrete particles, the random presenceor absence of the particles dominates the measured plutonium-239+240 in any givensample.
Livermore Site Sediment Results
Table 10-1 presents summary data on radionuclides detected in the sediment samples;a complete presentation of 1999 sediment data is found in Table 10-1 of the DataSupplement. The levels of plutonium-239+240 were generally at backgroundconcentrations, reflective of worldwide fallout. The moderately higher values atsampling locations CDB and ESB (see Figure 10-3) than the values at other locations maybe attributed to historic activities in the southeast quadrant at LLNL; these locations areboth in drainages for that area. Most other radionuclides were detected at levels similarto those reported from 1988 through 1998: cesium-137, a fission product, was found atworldwide background concentrations; potassium-40, thorium-232, uranium-235, anduranium-238—naturally occurring radionuclides—were detected at backgroundconcentrations. Tritium concentrations were within the range of previous data. Tritiumin sediments was evaluated for differences upwind and downwind of the Livermore sitefor all data collected from 1988 to 1999. A statistically significant difference was foundusing the Tukey-Kramer honestly significant difference (HSD) test, with the downwindsediment samples having higher measured concentrations than the upwind sedimentsamples. Tritium in sediments will continue to be evaluated.

10 Soil and Sediment Monitoring
10-10 LLNL Environmental Report for 1999
10–5
10–4
10–3
10–2
10–1
1 2.7 × 101
2.7 × 10⁻⁴
10–3
10–2
10–1
1
10EPA preliminary remediation goal
for industrial/commercial sites
1975 1980 1985 1990Year
1995 2000
Plu
ton
ium
act
ivit
y (B
q/d
ry g
)
Plu
ton
ium
act
ivit
y (p
Ci/d
ry g
)Downwind of Livermore site
Upwind of Livermore site
Site 300
Livermore Water Reclamation Plant
Figure 10-4. Median plutonium-239+240 activities in surface soils, 1976–1999.Upwind and downwind designations are relative to the center of theLivermore site.
Livermore Site Vadose Zone Soil Results
Analytical results for vadose zone soil samples are compared with soil reuse standardsdeveloped by LLNL and the San Francisco Bay Regional Water Quality Control Board(RWQCB) (Folks 1997, Marshack 1991). Metals background concentrations are based onnaturally occurring levels in the soil, considering first the results for total metals andthen the soluble metals test. There are no background levels for organic compounds ortritium. Soils containing materials at levels above background still may not adverselyaffect the ground water. If a metal exceeds both the total and soluble backgroundvalues, or if there are any detected organic compounds or tritium, the designated levelmethodology (DLM) (i.e., application of a simple attenuation factor and specific waterquality objectives) is used to determine the soluble levels of contaminants that wouldnot adversely impact ground water beyond its beneficial uses. (Background and DLMde minimis values are presented in Tables 10-3 to 10-5 in the Data Supplement.)

Soil and Sediment Monitoring 10
LLNL Environmental Report for 1999 10-11
All analytical results for organic compounds were below detection limits. All totalmetals concentrations were below background (see Tables 10-6 to 10-8 in the DataSupplement). Tritium results from the sediment sampling were evaluated by the DLMmethod and were all below de minimis levels (see the Data Supplement, Table 10-1).
Site 300 Results
Table 10-1 presents summary data on the concentrations of cesium-137, potassium-40,thorium-232, uranium-235, uranium-238, and beryllium in soil from the Site 300sampling locations; a complete presentation of 1999 soils data for Site 300 is found inTable 10-2 of the Data Supplement. The concentrations and the distributions of allobserved radionuclides in Site 300 soil for 1999 lie within the ranges reported in all yearssince monitoring began. The ratio of uranium-235 to uranium-238 generally reflects thenatural ratio of 0.7%. Historical trends of uranium-238 concentrations from both theLivermore Valley and Site 300 are shown in Figure 10-5. Median values have remainedrelatively constant for both places. The highest values at Site 300 result from the use ofdepleted uranium in explosive experiments.
Environmental Impact
This section discusses the environmental impacts of operations at the LLNL Livermoresite and Site 300 inferred from soil, sediment, and vadose zone soil monitoring.
Livermore Site
Routine surface soil, sediment, and vadose zone soil sample analyses indicate that theimpact of LLNL operations on these media in 1999 has not changed from previous yearsand remains insignificant. Most analytes of interest or concern were detected atbackground concentrations or in trace amounts, or could not be measured abovedetection limits.
The highest value of 7.0 mBq/dry g (0.19 pCi/dry g) for plutonium-239+240 measuredat LWRP during 1999 represents 1.9% of the Environmental Protection Agency (EPA)preliminary remediation goal for commercial or industrial sites of 0.37 Bq/dry g(10 pCi/dry g) (U.S. Environmental Protection Agency 1991). Statistical analysis showsno general increase or decrease in plutonium-239+240 values with time. Moreover, allmeasured concentrations, regardless of location and year, have been a small fraction ofthe EPA preliminary remediation goal (shown in Figure 10-4 for comparison). LLNL

10 Soil and Sediment Monitoring
10-12 LLNL Environmental Report for 1999
sampling of surface soil, sediment, and vadose zone soil will continue on anannual basis.
104
103
102
101
1
Ura
niu
m-2
38 a
ctiv
itie
s (p
Ci/d
ry g
)
Ura
niu
m-2
38 c
on
cen
trat
ion
s (µ
g/d
ry g
) 103
102
101
1
3.4 × 10⁻¹
3.4 × 10³
1975 1980 1985 1990 1995 2000Year
Downwind of Livermore site, median
Upwind of Livermore site, median
Livermore Water Reclamation Plant, median
Site 300, median
Site 300, maximum
Figure 10-5. Uranium-238 concentrations in surface soils, 1976–1999.
Site 300
The concentrations of radionuclides and beryllium observed in soil samples collectedat Site 300 are within the range of previous data and are generally representative ofbackground or naturally occurring levels. The uranium-235/uranium-238 ratios thatare indicative of depleted uranium occur near active and inactive firing tables atBuildings 801 and 812, from a small fraction of the operations at the firing table thatdisperse depleted uranium.

Soil and Sediment Monitoring 10
LLNL Environmental Report for 1999 10-13
Big Trees Park
During the 1993 EPA investigation of plutonium in soils present in the southeastquadrant of the LLNL Livermore site, EPA personnel collected a soil sample at Big TreesPark in Livermore to obtain a background sample. This soil sample showed plutoniumat a concentration higher than what is expected from global fallout for this region.The park was resampled by the EPA, LLNL, and the California Department of HealthServices (DHS) in 1995. (Over the years, LLNL has frequently investigated the presenceof radionuclides in local soils. Several of the studies are listed in Table 10-2.)
Table 10-2. Special soil studies.
Year Subject Reference
1971–1972 Radionuclides in Livermore Valley soil Gudiksen et al. 1972;Gudiksen et al. 1973
1973 Radionuclides in San Joaquin Valley soil Silver et al. 1974
1974 Soil study of southeast quadrant of Livermore site Silver et al. 1975
1977 Sediments from LLNL to the San Francisco Bay Silver et al. 1978
1980 Plutonium in soils downwind of the Livermore site Toy et al. 1981
1990 195 samples taken in southeast quadrant for study Gallegos et al. 1992
1991 Drainage channels and storm drains studied Gallegos 1991
1993 EPA studies southeast quadrant Gallegos et al. 1994
1993 Historic data reviewed Gallegos 1993
1995 LLNL, EPA, and DHS sample soils at Big Trees Park MacQueen 1995
1999 Summary of results of 1998 sampling at Big Trees Park Gallegos et al. 1999
2000 Health Consultation, Lawrence Livermore NationalLaboratory, Big Trees Park 1998 Sampling
Agency for ToxicSubstances DiseaseRegistry 2000
As reported in MacQueen (1995), samples from 13 of the 16 locations sampled at the parkduring 1995 had plutonium concentrations consistent with background levels foundthroughout the Bay Area. These levels were 1/600 to 1/10,000 of the EPA’s risk-basedpreliminary remediation goal (PRG) for plutonium for residential areas of 0.09 Bq/dry g(2.5 pCi/dry g) (U.S. Environmental Protection Agency 1991). Background values werefound in all sandboxes, school grounds, and picnic areas, and under the large eucalyptustrees for which the park is named. Samples from two locations had plutonium concen-trations slightly above background levels but were still 1% to 2% of the EPA’s risk-basedpreliminary remediation goal for plutonium for residential areas. The four samples

10 Soil and Sediment Monitoring
10-14 LLNL Environmental Report for 1999
collected in 1995 near the 1993 EPA sampling location had results above background,with the highest concentration at this location, 0.038 Bq/dry g (1.02 pCi/dry g), being40% of the PRG.
Based on the 1995 work, both the EPA and the California DHS concurred that therewas no regulatory concern from any of the sample results, that there was no significantlifetime cancer risk resulting from the low concentrations of plutonium-239+240 inthe soil samples, and that there was no unacceptable risk to human health or theenvironment.
In 1997, the ATSDR (which had contracted with the California DHS, EnvironmentalHealth Investigations Branch, to conduct a health consultation for plutonium) held apublic meeting on the subject of plutonium at Big Trees Park. At this meeting, theregulatory agencies restated that, although the levels of plutonium at Big Trees Parkwere not a health concern, they were interested in knowing how the plutonium got tothe park and the vertical extent of contamination at the park. The regulatory agenciesdetermined that these questions warranted further investigation. ATSDR issued a draftreport discussing these questions in 1998 and the final report in May 1999.
On the basis of the 1998 draft report, LLNL volunteered to conduct additional samplingand analysis to investigate how plutonium got to the park and to work with the regula-tory agencies to ensure public concerns were addressed. In August and September 1998,more than 300 additional soil samples were collected at Big Trees Park. The samplingstrategy was based on choosing sampling locations and analytes to provide (1) data tobetter determine the vertical and lateral extent of plutonium in soils at Big Trees Park,(2) data at locations and depths that are believed to be unique to each of three plutoniumdistribution pathways, (3) data at areas of public concern, and (4) additional data forlocations previously identified as exhibiting above-background plutoniumconcentrations in soil.
The results of the 1998 sampling effort have provided much more information aboutthe vertical and lateral extent of plutonium levels in soil at Big Trees Park. The resultsclearly show no systematic distribution of plutonium at depth. Of the 130 samplescollected deeper than 10 cm to characterize the vertical extent of contamination, onlyfour had concentrations of plutonium-239+240 above background levels determinedfrom historic surveillance sampling. The results for samples collected to evaluate thelateral extent of contamination clearly show an increased level of plutonium along thepark’s northern boundary, where the ornamental trees are planted (Gallegos et al. 1999).
The results can also be used to draw conclusions about the route of transport of theplutonium to the park. Three routes to the park were investigated: (1) water-borne,

Soil and Sediment Monitoring 10
LLNL Environmental Report for 1999 10-15
plutonium-contaminated sediments transported via Arroyo Seco, which cuts across thesouthwestern corner of the Livermore site and flows past Big Trees Park on its northernboundary; (2) plutonium-contaminated sewage sludge used as a soil amendment forplanting the ornamental trees along the northern boundary of the park; and (3) aerialdistribution of releases from the LLNL Plutonium Facility. The results for the samplescollected to investigate the water-borne hypothesis were nearly all below detection limits.Because the concentrations of plutonium-239+240 were so low in these samples, thewater-borne hypothesis is considered to be unlikely. In addition, annual surveillancemonitoring of the arroyo shows no residual of past releases or evidence of recent release.
The sewage sludge hypothesis is based on the fact that from the early 1960s to the mid-1970s, the LWRP distributed sewage sludge to the public for use as soil amendments.The probable source of plutonium in the sludge is LLNL releases to the sanitary sewer,with the largest single release occurring in 1967. It is also known that the ornamentaltrees were planted in a row along the northern border of the park next to the arroyosome time between 1972 and 1975. Ten trees along the northern boundary of the parkwere selected for sampling. Paired with each tree location was another location at least1 m beyond the irrigation berm that surrounds each tree. The results from thesesamples clearly show elevated levels of plutonium in samples taken near the trees butonly background levels outside the tree wells. This distribution of plutonium at thepark supports the theory that contaminated sewage sludge was used to fertilize trees atthe northern border of the park.
In January 2000, ATSDR issued a report presenting that agency’s evaluation of the dataobtained as a result of the 1998 sampling (Agency for Toxic Substances Disease Registry2000). The ATSDR concluded:
The most credible pathway by which plutonium radioisotopes reached BigTrees Park was the application of plutonium contaminated sewage sludge asa soil amendment. This is based on a comparison of the concentrations ofboth plutonium and heavy metals collected from within tree wells to theconcentrations present outside the tree wells. Although there is an elevatedconcentration of plutonium in the park, the levels are below the levels ofhealth concern set by EPA (Region IX preliminary remediation goals; lessthan a risk of one in a million) and below the recommended levels whichNCRP [National Council on Radiation Protection] has set for requiringadditional activities. No other pathway appears to be a viable pathway forthe presence of plutonium in the park.

10 Soil and Sediment Monitoring
10-16 LLNL Environmental Report for 1999
Impact
The results of this extensive sampling effort demonstrate that the plutonium is notpresent at Big Trees Park, Livermore, at a level of health concern. All sample resultswere less than the PRG and were less than values measured as the result of previoussampling efforts at the park. The highest sample concentration from the 1998 samplingeffort was 0.029 Bq/dry g (0.79 pCi/dry g) plutonium-239+240, well below theresidential PRG of 0.093 Bq/dry g (2.5 pCi/dry g). Again, EPA, California DHS, andATSDR concur that there is no unacceptable risk to human health or the environmentfrom the levels of plutonium at the park.

11
LLNL Environmental Report for 1999 11-1
Vegetation and FoodstuffMonitoring
S. Ring Peterson
Introduction
Lawrence Livermore National Laboratory has a vegetation and foodstuff monitoringprogram to comply with U.S. Department of Energy (DOE) guidance, which states thatperiodic sampling and analysis of vegetation should be performed to determine if thereis measurable, long-term buildup of radionuclides in the terrestrial environment (U.S.Department of Energy 1991).
Tritium is the nuclide of major interest in the LLNL vegetation and foodstuff monitoringprogram. LLNL has historically released tritium to the air accidentally and duringroutine operations and tritium is the only radionuclide released from LLNL activities thatoccurs in detectable concentrations in vegetation and foodstuff. Tritium moves throughthe food chain as tritiated water and can be rapidly assimilated into plant water and thenincorporated into the organic matter of plants through photosynthesis. It can contributeto human radiation dose if it is inhaled, absorbed through the skin, or ingested via vege-tables, or milk and meats from animals that have eaten tritiated vegetation.
LLNL has been monitoring tritium in vegetation to some extent since 1966 and hasperformed vegetation sampling in the vicinity of the Livermore site and Site 300 as partof a continuing monitoring program since 1972. The monitoring program is designed tomeasure changes in the environmental levels of radioactivity, to evaluate the environ-mental effect of LLNL operations, and to calculate potential human doses from radionu-clides in the food chain.
In 1977, LLNL added wine to the LLNL monitoring program. Wine is now the mostimportant agricultural product in the Livermore Valley, representing an approximately$80-million annual industry, based on sales. Although the tritium concentrations in allwines are low, the sampling data indicate that Livermore Valley wines contain statistic-ally more tritium than do wines from other California wine-producing regions.
In the past, other foodstuffs (cow milk, goat milk, and honey) leading to potential dosewere also monitored for tritium. At present, however, only tritium concentrations invegetation and wine are used to assess potential ingestion dose from tritium emitted

11 Vegetation and Foodstuff Monitoring
11-2 LLNL Environmental Report for 1999
during LLNL operations. During 1999, LLNL collected and analyzed samples ofherbaceous vegetation and wine. Potential human doses from these foodstuffs werecalculated using the monitoring data and the dose models presented in Appendix A. Inaddition, as part of a continuing study, LLNL determined the potential tritium dose tothe maximally exposed individual from a pine tree at the Livermore site. This treeserves as a diffuse source of tritium because it loses tritium to the air through evapo-transpiration of tritium-contaminated water in the root zone. The dose was calculatedusing the U.S. Environmental Protection Agency (EPA) model, CAP88-PC.
Methods
The methods used for monitoring vegetation and wine are presented briefly in thefollowing sections and in more detail in the Data Supplement. All vegetation and winesampling was conducted according to written and approved standardized procedures(Tate et al. 1999).
Vegetation
LLNL staff collected vegetation samples, usually annual grasses, quarterly from 22 fixedlocations in the Livermore Valley, San Joaquin County, and Site 300. The samples werethen analyzed for tritium.
Location maps are provided in Figures 11-1 and 11-2. Sample locations were selected torepresent vegetation from: (1) locations near LLNL that can be affected by LLNL opera-tions, (2) background locations where vegetation is similar to that growing near LLNL butis unlikely to be affected by LLNL operations, and (3) areas of known or suspected LLNL-induced contamination. Sampling locations for 1999 were the same as those in 1998.
Wine
Three types of wine samples were collected and analyzed for tritium concentrations:wine produced from grapes grown in the Livermore Valley, wine produced from grapesgrown in California outside the Livermore Valley, and wine produced from grapesgrown in Europe (France, Germany, and Italy). The wines were purchased from localretailers to represent what the general public could buy and drink during 1999.

Vegetation and Foodstuff Monitoring 11
LLNL Environmental Report for 1999 11-3
Altamont Pass Road
Flynn Road
Tesla RoadG
reen
ville
Roa
d
East Avenue
Patterson Pass Road
Lupin Way
580
PattersonPass Road84
FCC
AQUE
PATTMESQ
GARD
NPER
I580
ZON7
TESW
MET
VISPIN2
PIN1
PARK
CAL
Vegetationsampling locations
LLNL perimeter
Scale: Kilometers
0 1
580
N
2
LivermoreAvenue
VascoRoad
Cross Road
(Camp Parks)
(CalaverasReservoir)
Figure 11-1. Livermore site and Livermore Valley vegetation sampling locations, 1999.
Data from the analysis of tritium in wine can be used to estimate the potential tritiumdose received by consumers during the year of purchase. However, because winespurchased in 1999 are from grapes that were harvested in 1996, 1997, and 1998, the 1999sampling data cannot be used to indicate how LLNL’s operations affected concentra-tions of tritium in wines produced from grapes grown in 1999. To analyze trends andhelp determine the impact of LLNL operations on tritium in wine for the year when thegrapes were harvested, LLNL corrects the wine sample concentrations for the radiolog-ical decay that has occurred between the approximate date of the grape harvest and thedate when the wine was analyzed in the laboratory. Comparisons can then be madeof wine concentrations that represent the year when the grapes were exposed tothe tritium.

11 Vegetation and Foodstuff Monitoring
11-4 LLNL Environmental Report for 1999
Livermore
Tracy
Corral Hollow Road
0 1200600
Scale: MetersBunker 801
Bunker 851
Vegetation samplinglocations
Bunkers
Pits
Site 300 perimeterBunker 850 801E
EVAP
DSW
CARN GOLF
GEOPRIM
N
Figure 11-2. Site 300 vegetation sampling locations, 1999.
Results
The results of vegetation monitoring for the Livermore site and Site 300 and of winemonitoring are presented in the following sections.
Livermore Site
Vegetation
The Livermore site and Livermore Valley vegetation locations are put into four groupsfor statistical evaluation:
• Near—locations within 1 km of the Livermore site perimeter. Nearlocations include AQUE, GARD, MESQ, NPER, MET, PIN2, and VIS.

Vegetation and Foodstuff Monitoring 11
LLNL Environmental Report for 1999 11-5
• Intermediate—locations in the Livermore Valley 1–5 km from theLivermore site perimeter that are often downwind and, thus, potentiallyunder the influence of tritium releases at the site. The intermediatelocations are I580, PATT, TESW, and ZON7.
• Far—locations unlikely to be affected by LLNL operations. Onebackground location (CAL) is more than 25 km away. The other two(FCC and PARK), although in the Livermore Valley, are unlikely to beaffected by LLNL operations because they are more than 5 km from theLivermore site and are generally upwind.
• PIN1—location of a pine tree rooted in an area of known tritiumcontamination on the Livermore site.
Table 11-1 shows summary tritium data for vegetation collected for the LLNL vegetationmonitoring program in 1999 (individual sampling values are presented in the DataSupplement of this report). Figure 11-3 shows the 1999 medians of the tritium concen-trations for PIN1, Near, and Intermediate Livermore locations as a continuation ofhistoric median concentrations from 1971 to 1998. The values for 1998 and 1999 Farlocations are the lowest positive measured concentrations rather than the medians;medians for 1998 and 1999 are negative for the Far location and, hence, cannot be plottedon a logarithmic scale. Although the concentration in Far vegetation appears to drop byabout a factor of 10 in 1998, it is highly unlikely that any difference exists among 1998,1999, and recent preceding years. The apparent difference is caused by a change in howthe analytical laboratory reported concentrations less than the detection limit.
For 1999, the data for tritium in vegetation were compared using Scheffé’s andGames/Howell multiple comparisons (Scheffé 1953; Games and Howell 1976). Thesetests are the most appropriate tests for these distributions of data. Unlike previousyears, the Near group was not found to be significantly different from the Intermediateand Far groups. This was caused by unusually high observed values of tritium invegetation at VIS, PIN2, and I580 for the first quarter of 1999 when tritium releases wereunusually high. When the Near group (without first quarter values for VIS and PIN2) iscompared with the Intermediate group (without the first quarter value for I580) and theFar group, results are similar to previous years. Both tests show concentrations of theNear group to be significantly higher than concentrations from both the Intermediateand Far groups. The highest median tritium results for individual vegetation samplinglocations were found at the Near locations, PIN2 and VIS, which are located near eachother downwind of the Livermore site.

11 Vegetation and Foodstuff Monitoring
11-6 LLNL Environmental Report for 1999
Table 11-1. Concentrations of tritium in plant water (Bq/L), 1999.
Detection Interquartile Dose (µSv/y)(c)
Location(a) frequency(b) Median range Maximum Median Maximum
Near Livermore site(d) 25/28 7.0 9.9 100 0.034 0.48
Livermore site PIN1(e) 4/4 150 120 280 8.0 × 10⁻⁶(f) 1.5 × 10⁻⁶(f)
Livermore site intermediate locations 7/16 1.4 4.2 100 0.0068 0.48
Livermore site far locations 0/12 –0.72 1.8 0.68 —(g) 0.0033
Location DSW at Site 300(e) 1/4 1.6 1.3 3.1 0.0078 0.015
Location EVAP at Site 300(e) 3/4 170 370 480 0.81 2.3
All other locations at Site 300 5/20 –0.015 1.6 4.0 —(g) 0.019
Note: Radioactivities are reported as the measured concentration and either an uncertainty (±2σ counting error) or as being less than orequal to the detection limit. If the concentration is less than or equal to the uncertainty or the detection limit, the result is considered tobe a nondetection. See the main volume, Chapter 14, Quality Assurance.
a See Figures 11-1 and 11-2 for sampling locations.
b Detection frequency means the fraction of samples taken having a measured value above the detection limit.
c Ingestion dose is calculated based on conservative assumptions that an adult's diet is exclusively vegetables with this tritiumconcentration, and that meat and milk are derived from livestock fed on grasses with the same concentration of tritium. See Appendix A,Methods of Dose Calculations.
d Includes PIN2; plant water concentrations are similar among plant types.
e Sampling location in known area of contamination.
f For this dose calculation, PIN1 is treated as a diffuse source of tritium (because human beings do not eat pine needles). Dose, calculatedusing CAP88-PC, is to the maximally exposed individual.
g Dose is not calculated when the median concentration is negative.
In 1997, PIN1, a pine tree growing in a known area of tritium contamination at theLivermore site, was monitored on a monthly basis to estimate emissions for compliancewith National Emissions Standards for Hazardous Air Pollutants (NESHAPs). In 1998,the tree sampling was coordinated with the quarterly vegetation sampling. Since 1998,NESHAPs calculations to the sitewide maximally exposed individual (SW-MEI) arebased on quarterly observations. To assess the contribution of soil water tritium toPIN1, LLNL also sampled a second tree (PIN2) that is not in tritium-contaminatedsoil. Concentrations of tritium in PIN2, like in all other vegetation sampled near theLivermore site, are from air and soil water in quasi-equilibrium with air. When samplesfrom PIN1 were compared with samples from each Near location, concentrations oftritium in PIN1 were found to be significantly higher than concentrations at all otherlocations except the downwind locations, VIS and PIN2.

Vegetation and Foodstuff Monitoring 11
LLNL Environmental Report for 1999 11-7
103
102
10—1
10—2
101
1970 1975 1980 1985Sampling year
FarIntermediatePIN1Near
1990 1995 2000
102
103
104
101
2.7 × 10⁴
2.7 × 10—1
100
Tri
tiu
m c
on
cen
trati
on
(B
q/L
)
Tri
tiu
m c
on
cen
trati
on
(p
Ci/L
)
100
Figure 11-3. Median tritium concentrations in Livermore site and Livermore Valley plantwater samples, 1971–1999. (For Far vegetation for 1998 and 1999, thevalues are the lowest positive.)
Wine
The results from the 1999 wine tritium analyses are shown in Table 11-2. Tritiumconcentrations are within the range of those reported in previous years and remainlow in wines from all areas. The data for the 1999 sampling year were analyzed usingScheffé and Games/Howell multiple comparisons. The results of the comparisons arethe same as in previous years. Both analyses show that the mean tritium concentrationof the 12 Livermore wines is statistically greater than that of the six California wines.When the Livermore, California, and European wines were compared using the Scheffétest, no significant difference was noted among the groups because of the high

11 Vegetation and Foodstuff Monitoring
11-8 LLNL Environmental Report for 1999
variability of Livermore Valley wines. The variability in the Livermore Valley wines isdue to some grapes being exposed to higher concentrations of tritium in air and inprecipitation than others.
Table 11-2. Tritium in retail wine (Bq/L), 1999.(a)
Region Detectionfrequency(b) Median Interquartile
rangeMean Maximum Dose(c)
(nSv/y)
Livermore Valley 12/12 1.7 0.68 2.4 8.3 2.2
California 6/6 0.43 0.15 0.45 0.57 0.40
Europe 4/4 1.5 0.30 1.3 1.6 1.2
Note: Radioactivity is reported as the measured concentration and an uncertainty (±2σ counting error). If the uncertaintyis greater than the concentration, the result is considered to be a nondetection.
a Wines from a variety of vintages were purchased and analyzed during 1999. The concentrations reported are those atthe time the bottles were opened.
b Detection frequency means the fraction of samples taken having a measured value above the detection limit.
c This dose is calculated using the assumption of drinking 52 L wine/year and using the mean concentration ofsampled wines.
Concentrations corrected to vintage year are plotted in Figure 11-4. The downwardtrend seen in wines from all locations is not statistically significant. Depending uponthe test used, 1982 and 1983 are statistically different from several other vintage years.The 1996 Livermore Valley wines were significantly higher in tritium than those fromboth 1995 and 1997 (Scheffé’s test) and were significantly higher than those in just 1997(Games/Howell test). Data from 1998 could not be included because the sample com-prised only two bottles. As mentioned, wines are sampled randomly; and, quite bychance, the 1996 wines unequally represent vineyards close to LLNL.
Site 300
Vegetation
There are seven monitoring locations for vegetation at Site 300. Of these, five (CARN,GOLF, GEO, 801E, and PRIM) detect changes in atmospheric tritium concentrations.Vegetation from locations DSW and EVAP grows in areas of known ground watercontamination. Plants with long roots sometimes absorb tritium concentrations fromground water rather than from air.

Vegetation and Foodstuff Monitoring 11
LLNL Environmental Report for 1999 11-9
Vintage year1980 1982 1984 1986 1988 1990 1992 1994 1996 1998
10–1
101
102
100
Tri
tiu
m c
on
cen
trat
ion
(d
ecay
-co
rrec
ted
) (B
q/L
)
Tri
tiu
m c
on
cen
trat
ion
(d
ecay
-co
rrec
ted
) (p
Ci/L
)
Livermore
California
Europe
2.7 × 100
2.7 × 101
2.7 × 10²
2.7 × 10³
Figure 11-4. Mean tritium concentrations in retail wines decay-corrected from thesampling year to the vintage year.
Table 11-1 shows summary tritium data for vegetation collected at Site 300 during 1999.Historic values for tritium at Site 300 sampling locations are shown in Figure 11-5. Of theseven sampling locations at Site 300, six yielded results in 1999 at or near the detectionlimits. Only EVAP yielded results above detection limits; DSW, normally high (except for1994), had tritium concentrations at detection limits. The extremely low concentrationsfor 1998 and 1999 plotted for locations other than DSW and EVAP are caused by havingto graph the lowest positive result because the median is negative and the scale of thefigure is logarithmic. The apparent difference among 1999, 1998, and preceding years iscaused by a change in how the analytical laboratory reported concentrations lower thandetection limits.
The highest tritium result for a single vegetation sample occurred at location EVAP (seeTable 11-1), which is near a spring where ground water flows near the surface andevaporates. The ground water in this area is contaminated with tritium that comes fromthree sources: Pit 3, Pit 5, and the firing table at Building 850 (see the discussion of wellsNC7-61 and NC7-69 in Chapter 9, Ground Water Monitoring). Evaluation of the 1999data for Site 300 using the Scheffé test yielded no significant differences among thevarious sampling locations; this is a result of the high variability of the data and the lownumber of data points.

11 Vegetation and Foodstuff Monitoring
11-10 LLNL Environmental Report for 1999
100
101
102
10–1
10–2
103
104
105
102
101
100
103
104
105
106
2.7 × 10⁶
2.7 × 10⁻¹
Tri
tiu
m c
on
cen
trati
on
(B
q/L
)
Tri
tiu
m c
on
cen
trati
on
(p
Ci/L
)
DSW
EVAP
All other locations
1971 1975 1979 19871983Sampling year
1991 1995 1999
Figure 11-5. Median tritium concentrations in plant water at Site 300 sampling locations,1971–1999. When the median is negative (e.g., all other locations for1998 and 1999), the lowest positive concentration has been substituted.
Environmental Impact
In 1999, the environmental impacts of LLNL operations on vegetation and wine weresmall and are presented below for the Livermore site and Site 300.

Vegetation and Foodstuff Monitoring 11
LLNL Environmental Report for 1999 11-11
Livermore Site
LLNL impacts on vegetation in the Livermore Valley remained minimal in 1999. Theeffective dose equivalents shown in Table 11-1 were derived using the dose conversionfactors provided by DOE (U.S. Department of Energy 1988) and the dose pathwaymodel from U.S. Nuclear Regulatory Commission (NRC) Regulatory Guide 1.109(1977). Appendix A provides a detailed discussion of dose calculation methods. Thedose from ingested tritium is based on the conservative assumptions that an adult’sdiet (Table A-2, NRC maximum) consists exclusively of leafy vegetables with themeasured tritium concentrations, and meat and milk from livestock fed on grasses withthe same concentrations. In actuality, the vegetables consumed by an adult containtritium at lower levels than those reported because most vegetables are imported fromother areas. Similarly, tritium concentrations in food consumed by local livestock areat or below the concentrations in vegetation measured at the Intermediate and the Farlocations. Nevertheless, based on these extremely conservative assumptions, themaximum potential dose from ingestion of affected vegetation for 1999 for theLivermore Valley is 0.50 µSv (0.050 mrem).
Doses are calculated based on measured tritium in plant water without the contribu-tion of organically bound tritium (OBT). Dose conversion factors of 1.8 × 10⁻¹¹ Sv/Bqfor tritium in the plant or animal water (HTO) and 4.2 × 10⁻¹¹ Sv/Bq for OBT havebeen published by the International Commission on Radiological Protection (1996).These show the relative importance of ingested HTO and OBT to dose. In vegetables,the dose from HTO is greater because the fraction of the plant that is organic matter isquite small (10–25%). For example, about 10% of the ingestion dose from leafyvegetables (about 10% dry matter) is from OBT. OBT becomes increasingly importantwhen the fraction of dry matter increases. Pork, for example, has a dry-matter contentof about 30–50% (Ciba-Geigy Ltd. 1981), and the resulting ingestion dose from pork isabout half from OBT and half from HTO. The OBT in grain, which is 88% dry matter,contributes nearly 90% of the total grain ingestion dose. Given the differences in OBTdose contribution from different foods, the importance of OBT to ingestion dosedepends on what quantities of what kinds of foods are consumed. An extremelyunlikely diet very high in OBT would, at most, give an OBT contribution to dose equalto that of HTO. Thus, conservatively, the maximum total tritium dose from ingestionof vegetables and foodstuffs from the Livermore Valley for 1999 could be 1.0 µSv(0.10 mrem), well below any level of concern.
The dose values for PIN1 shown in Table 11-1 were calculated in a different mannerfrom those for edible vegetation because it is unreasonable to assume that any person isdirectly ingesting pine needles. The pine tree is treated as a diffuse source of tritium tothe atmosphere via the contaminated transpirational stream. LLNL used an estimated

11 Vegetation and Foodstuff Monitoring
11-12 LLNL Environmental Report for 1999
tritium transpiration rate from the tree as input data to the EPA regulatory modelCAP88-PC. LLNL modeled air dispersion of the transpired tritium and calculated aresulting dose from inhalation, skin absorption, and potential ingestion from airconcentrations at the location of the maximally exposed individual. This total dose isbased on the conservative assumptions that 100% of the individual’s time is spent atthis location and that his/her diet consists exclusively of vegetables with the measuredtritium concentration, and meat from livestock fed on grasses with the same concen-tration. The resulting maximum dose for PIN1 of 1.5 × 10⁻⁵ µSv (1.5 × 10⁻⁶ mrem) isconsiderably lower than ingestion doses calculated directly from measured concen-trations in vegetation because the tree is only an indirect source of air/vegetationcontamination.
No health standards exist for radionuclides in wine. However, all the wine tritiumlevels were far below drinking water standards. In fact, even the highest detectedLivermore Valley value (8.3 Bq/L or 224 pCi/L) represents only 1.1% of the Californiadrinking water standard (740 Bq/L or 20,000 pCi/L). Doses from wine consumptioncan be calculated according to methods for water ingestion, as described in Appendix A.
Based on the conservative assumption that wine is consumed at the same rate as water(370 L/year or 1 L/day), the annual dose that corresponds to the highest detected 1999Livermore Valley tritium value in wine is 53 nSv (5.3 µrem). Assuming a more realisticaverage wine consumption (52 L/year or 1 L/week of wine) and the mean tritiumvalues from the three sampling areas, the annual doses from Livermore, European, andCalifornia wines would be 2.2 nSv (0.22 µrem), 1.2 nSv (0.12 µrem), and 0.40 nSv(0.040 µrem), respectively.
The potential ingestion dose from all foodstuffs grown near the Livermore site wasrealistically well below 1.0 µSv (0.10 mrem) for 1999. This is a factor of 3000 lower thanan annual background dose (~3000 µSv or 300 mrem) and a factor of 100 lower thanthe dose from a typical chest x-ray (100 µSv or 10 mrem) (Shleien and Terpilak 1984).Therefore, although tritium levels are elevated slightly near the Livermore site, dosesfrom tritium ingestion are negligible.
Site 300
In general, LLNL impacts on tritium concentrations in vegetation at Site 300 for 1999were insignificant. With the exception of vegetation from previously identified sites ofcontamination, the tritium levels at Site 300 were at or near the limits of detection and

Vegetation and Foodstuff Monitoring 11
LLNL Environmental Report for 1999 11-13
comparable to those observed in previous years. The areas where tritium is known to bepresent in the subsurface soil are well delineated and localized.
The calculated maximum potential annual ingestion dose from vegetation at samplinglocation EVAP, based on the maximum value of 480 Bq/L (13,000 pCi/L), is 2.3 µSv(0.23 mrem). This dose, based on the conservative modeling assumptions describedabove, is theoretical, because vegetation at Site 300 is not ingested either by people or bylivestock. In comparison, the potential annual dose (also theoretical) from vegetation atall other locations at Site 300 could not be calculated because the median concentrationis below the limit of detectability.


12
LLNL Environmental Report for 1999 12-1
Environmental RadiationMonitoring
Nicholas A. Bertoldo
Introduction
In accordance with federal regulations and Department of Energy (DOE) Orders 5400.1and 5400.5, Lawrence Livermore National Laboratory monitors gamma radiation toestablish radiation levels in its vicinity and to determine the direct environmentalradiological impact of its operations. Gamma radiation in the environment primarilyoccurs naturally from terrestrial and cosmic sources. Because environmental radiologicalmonitoring is used as one measure of the potential radiation dose that the public mayreceive as the result of LLNL operations, LLNL has developed an extensive radiologicalmonitoring network for the Livermore site perimeter, Site 300 perimeter, and off-sitelocations. Gamma radiation has been measured at the Livermore site since 1973 and atSite 300 since 1988. The absorbed gamma radiation dose imparted to thermoluminescentdosimeters (TLDs) is the result of TLD exposure to both terrestrial and cosmic radiationsources as well as LLNL sources, if any.
Cosmic Radiation Component
Gamma radiation in air is produced by the interaction of cosmic rays, which containhigh-energy particles and emanate primarily from beyond the solar system, withatmospheric nuclei. The cosmic radiation component accounts for about half theobserved site annual average gamma radiation.
Terrestrial Radiation Component
Terrestrial gamma radiation is primarily caused by naturally occurring isotopes ofthe uranium, thorium, and actinium decay series that are present in soil worldwideand that produce gamma radiation during radioactive decay. The concentration ofnaturally occurring radionuclides in soil is variable and is determined by the ratio ofthorium-232 to uranium-238 (present in these regions at the time of the earth’s forma-tion over four billion years ago), which ranges from 3 to 4 around the world. By

12 Environmental Radiation Monitoring
12-2 LLNL Environmental Report for 1999
characterizing the natural background radiation, LLNL can determine whether or notthere is a contribution to gamma exposure from Laboratory operations.
General Methods
LLNL deploys TLDs in the field to assess the environmental impact of laboratory opera-tions at both the Livermore site and Site 300. This assessment is done by comparing thegamma radiation data acquired from the Livermore perimeter site locations to variouslocations monitored in the Livermore Valley, and gamma-radiation data from Site 300perimeter locations to locations in the City of Tracy and near Site 300.
As previously mentioned, the variability of the naturally occurring radioisotopespresent in the soil due to geological formations is the largest contributor to variationsin measurements. Meteorological conditions contribute to seasonal variability, as doescosmic variation.
LLNL deploys TLDs at the beginning of each quarter of the year and retrieves themfrom the monitoring locations as near to the end of the quarter as possible in order tohave a 90-day exposure period. All data are normalized to a 90-day standard quarterbasis in order to make valid comparisons.
Details of the TLD calculations and reporting of external gamma radiation dose aredescribed in an Operations and Regulatory Affairs Division procedure.
Monitoring Locations
In 1999, external doses from gamma radiation were monitored at 14 Livermore siteperimeter locations (shown in Figure 12-1) and at 23 Livermore Valley locations(Figure 12-2), which are used for background comparison to perimeter location data.Similarly, gamma doses are monitored at eight perimeter monitoring locations atSite 300 (Figure 12-3). Additionally, five off-site locations near Site 300 and twolocations in nearby Tracy are also monitored for comparison with the Site 300 data.Summary dose calculations for all gamma-monitoring locations are presented inTable 12-1.

Environmental Radiation Monitoring 12
LLNL Environmental Report for 1999 12-3
Patterson Pass Road
Gre
envi
lle R
oad
Vas
co R
oad
East Avenue
400
Scale: MetersGamma dosimeter locations
2000
1
54
6
52
42
5611
LLNL perimeter
16
14
6968
47
43
N
Figure 12-1. Gamma dosimeter locations, Livermore site, 1999.

12 Environmental Radiation Monitoring
12-4 LLNL Environmental Report for 1999
N. L
iver
mor
e A
venu
e
Vas
co R
oad
Altamont PassRoad
Flynn Road
Gre
envi
lleR
oad
East Avenue
PattersonPass Road
Lupin Way
580
580
PattersonPass Road
Tesla Road
84
Gamma dosimeterlocations
LLNL perimeter
Scale: Kilometers
0 1
N
70
3735
45
60
57
28
30
27
24
22
18
7477
75
76
61
72
73
19
66
3332
2
Figure 12-2. Gamma dosimeter locations, Livermore Valley, 1999.
Collocated Monitoring Locations
The State of California Department of Health Services, Radiological Health Branch(CDHS-RHB) performs routine, independent gamma monitoring at several sitescollocated with LLNL’s TLD network. CDHS-RHB site locations correspond to severalLivermore site perimeter, valley, Site 300, and off-site locations near Site 300. AlthoughCDHS-RHB has been co-monitoring these locations for several years, CDHS-RHBpersonnel have added other sites to their network and continue to monitor at oneLivermore site perimeter location that LLNL discontinued in its TLD monitoring net-work in 1995. This location, which lies approximately halfway between site 14 and site16 on the Vasco Road perimeter, was formerly designated as a valley site location in1994 although it is actually located just outside the LLNL perimeter at Vasco Road andthe Mesquite Way perimeter entrance. The nine locations monitored by CDHS-RHB areLLNL-15, -19, -28, -47, -75, -78, -91, -96, and -99. CDHS-RHB added location LLNL-47to its network in the third quarter 1999. (See Figures 12-1, 12-2, and 12-3 for thesecorresponding locations.)

Environmental Radiation Monitoring 12
LLNL Environmental Report for 1999 12-5
Alameda County San Joaquin County
Livermore
Corral Hollow Road
Site 300
9986 85
82
121
81
89
88
96
94
0 1
Scale: KilometersPerimeter locations
Off-site locations
N
78
Patterson PassRoad
2
Site 300 perimeter
90
91
120
92 93Tracy
Figure 12-3. Gamma dosimeter locations, Site 300 and vicinity, 1999.
Table 12-1. Summary of dose calculations for gamma-monitoring locations (mSv)(a) at all LLNLsites, 1999.
Location
Quarter Livermore site Livermore Valley Site 300 Tracy Near Site 300 Mean 2 SE(b) Mean 2 SE Mean 2 SE Mean 2 SE Mean 2 SE
First 0.142 ± 0.006 0.140 ± 0.005 0.172 ± 0.009 0.148 ± 0.01 0.187 ± 0.025
Second 0.144 ± 0.006 0.143 ± 0.006 0.175 ± 0.008 0.144 ± 0.024 0.189 ± 0.023
Third 0.144 ± 0.007 0.143 ± 0.007 0.181 ± 0.015 0.147 ± 0.013 0.201 ± 0.027
Fourth 0.146 ± 0.006 0.143 ± 0.006 0.178 ± 0.010 0.152 ± 0.017 0.189 ± 0.036
Annual dose 0.577 ± 0.025 0.571 ± 0.022 0.706 ± 0.040 0.591 ± 0.066 0.770 ± 0.109
a 1 mSv = 100 mrem.b SE = Standard Error (standard deviation of the mean).

12 Environmental Radiation Monitoring
12-6 LLNL Environmental Report for 1999
Results of Gamma Monitoring
Figure 12-4 shows gamma doses for the Livermore site perimeter, Livermore Valley, andSite 300 from 1988 through 1999. Beginning in 1995, all quarterly gamma radiation datapoints were normalized to standard, 90-day quarters, as is the practice of the NuclearRegulatory Commission (NRC) (Struckmeyer 1994). Correcting the data to standardquarters to normalize the data to the same number of days deployed reduces the varia-bility caused by exposure duration.
Mea
n d
ose
(m
Sv)
0.101988 1989 1990 1991 1992 1993 1994 1995 1996 1997 1998 1999 2000
0.12
0.14
0.16
0.18
0.20
0.22
0.24
0.26
Year
Site 300
Livermore site perimeter
Livermore Valley
Figure 12-4. Quarterly gamma dose measurements at the Livermore site perimeter,Livermore Valley, and Site 300, 1988–1999.

Environmental Radiation Monitoring 12
LLNL Environmental Report for 1999 12-7
Livermore Site
Table 12-1 presents a summary of the quarterly and annual TLD gamma radiation doseequivalents for the Livermore site perimeter locations and Livermore Valley off-sitelocations. The mean 1999 dose equivalent from external, direct-radiation exposure at theLivermore site perimeter, 0.577 mSv, is statistically the same as the background externaldose measured in the Livermore Valley, 0.571 mSv. Table 12-2 lists the yearly doses dueto direct gamma radiation at the Livermore site perimeter. All doses fall within the pre-dicted range for background radiation, and no LLNL operational impacts are discernible.
Table 12-2. Annual dose by year at the Livermore site perimeter caused by directgamma radiation.(a)
Year mSv mrem
1988 0.59 59
1989 0.58 58
1990 0.58 58
1991 0.56 56
1992 0.56 56
1993 0.57 57
1994 0.56 56
1995 0.56 56
1996 0.55 55
1997 0.59 59
1998 0.60 60
1999 0.58 58
a Data normalized to standard 90 days per quarter (360 days per year).
Site 300
As seen in Table 12-1, the measured Site 300-perimeter annual average dose in 1999was 0.706 mSv, the measured dose at the off-site locations near Site 300 was 0.770 mSv,and the measured doses in and near Tracy were 0.591 mSv. All doses are withinthe predicted range for background radiation, and no LLNL operational impacts arediscernible.

12 Environmental Radiation Monitoring
12-8 LLNL Environmental Report for 1999
At Site 300, the initial TLD network design limited monitoring to the Site 300 perimeterand two locations in and near the City of Tracy, which were chosen to represent back-ground radiation levels. However, the region around Site 300 has higher levels ofnaturally occurring uranium present in the local geological area called the NerolyFormation. The mean dose measured in the off-site locations of the area around Site 300,which is used to represent the high end of background radiation from this formation,was 0.772 mSv and is greater than the Site-300 perimeter dose of 0.710 mSv. The Tracyarea, with a dose of 0.626 mSv, is underlain by a geological substrate composed ofalluvial deposits of clays, sands, and silts overlying bedrock. The difference in doses canbe directly attributed to the difference in geologic substrates.
The doses at the Livermore-site perimeter and in the Livermore Valley are comparablefrom 1988 to 1999. However, while Site 300 doses are similarly comparable, TLDs therecontinue to record slightly higher direct gamma doses than do the Livermore site andthe Livermore Valley, which is expected, given the differences in geology amongthese sites.
Environmental Impact
Although the contribution of cosmic radiation may vary due to the sun cycle, the sumof the measured terrestrial and cosmic radiation dose has been observed to range from0.6 to 0.7 mSv/y. In addition, variability caused by the local geology and meteorologywill also affect this range slightly. Direct radiation doses measured at the Livermore siteperimeter in 1999 are near these predicted values and are statistically equivalent to theLivermore Valley doses, which are considered natural background levels. Althoughmeasured gamma exposure at Site 300 and the local vicinity are slightly higher thanreported for the Livermore site and Livermore Valley, their range is attributed primarilyto the variation of the geological substrate containing radionuclides of natural origin.The annual gamma radiation measured by the TLD network indicates that the exposurelevel is not elevated above natural background for any of the monitoring sites because ofLLNL operations.

13
LLNL Environmental Report for 1999 13-1
Radiological DoseAssessment
Robert J. Harrach
Introduction
Radiological doses to the public result from both natural and man-made radiation. Thetotal dose received by individuals and populations can be determined by measurementsand calculations. This chapter describes Lawrence Livermore National Laboratory’sradiological dose assessments, which are made to determine the impact of LLNLoperations. It includes a discussion of the analyses performed to demonstrate LLNL’scompliance with the radiological National Emission Standards for Hazardous AirPollutants (NESHAPs; Title 40 Code of Federal Regulations [CFR], Part 61, Subpart H).
Background Information
Because this chapter is written for a diverse readership, from scientists and regulators tointerested citizens with limited scientific training, a description is given of concepts,methods, tools, and other basic material in the first three sections as well as in twosupplements at the end of the chapter. Supplement 13-1, Radiation Basics, covers thedifferent sources and types of radiation and the units used to quantify radiation, and itprovides perspective on the wide range of radiation levels that people commonlyencounter. Supplement 13-2, Radiation Control Measures at LLNL, sketches thestandard operating procedures used to protect employees, the public, and the environ-ment from uncontrolled releases and unsafe levels of radiation. Readers desiring to godirectly to the chapter’s principal results can turn to the Radiological Doses to the Publicfrom LLNL Operations section.
Releases of Radioactivity to Air
Air releases are by far the major source of public radiological exposures from LLNLoperations. In contrast, releases to ground, surface, and sewerable waters are notsources of direct public exposures because these waters are not directly consumed orused by the public. Water releases can cause indirect exposures, which are treated as

13 Radiological Dose Assessment
13-2 LLNL Environmental Report for 1999
special cases; for example, a recent case considered the possible dose to the public frominhalation and ingestion of soil contaminated by sewer effluent containing radioactivity(U.S. Department of Health and Human Services 1999). Apart from such unusualoccurrences, measurements and modeling of air releases determine LLNL’s radiologicaldose to the public.
Data are gathered by three principal means: routine surveillance air monitoring forradioactive particles and gases, both on and off Laboratory property (described inChapter 5); continuous monitoring of stack effluent at selected facilities at the Livermoresite (described in Chapter 4); and usage inventories at all noncontinuously monitoredor unmonitored facilities housing radioactive materials management areas and forradioactive materials used in explosive experiments at Site 300 (usage inventories aredescribed in LLNL’s NESHAPs annual reports [e.g., Gallegos et al. 2000]).
Despite this “air emphasis,” it should be noted that LLNL’s extensive environmentalmonitoring program embraces all media and a wide range of potential contaminants,not limited to radioactive ones. In addition to air monitoring and the three categories ofwater monitoring already mentioned, the Laboratory samples soil, sediment, vegetation,and foodstuff, and measures environmental (gamma) radiation. Monitoring has beendescribed extensively since 1971 in LLNL’s environmental reports (e.g., Larson et al.1999; see also Chapters 4 through 11 in the present report) and in LLNL’s trienniallyupdated Environmental Monitoring Plan (e.g., Tate et al. 1999) and its associatedprocedures and guidance documents.
Air Dispersion and Dose Models
Theoretical/calculational models are needed to describe the transport and dispersion inair of contaminants and the doses received by exposed persons. Various factors dictatethis need for modeling: (1) the amounts of LLNL-generated radioactive material dis-persed into the atmosphere cause doses thousands of times smaller than those caused bynatural background radiation (arising from irradiation by cosmic rays, inhalation ofradon gas, exposure to radioactive materials in soil and rock, and ingestion of naturallyoccurring radionuclides present in our food and water; see Supplement 13-1), so it isdifficult to demonstrate compliance with standards through physical measurementsalone; (2) all potentially significant exposure pathways need to be taken into accountwhen estimating dose impacts; and (3) the U.S. Department of Energy (DOE) and theU.S. Environmental Protection Agency (EPA) sanction the use of specific computercodes that implement their approved dosimetry and dispersion models for evaluatingpotential doses to the public from both routine and unplanned releases. Advantages

Radiological Dose Assessment 13
LLNL Environmental Report for 1999 13-3
of a well-developed modeling capability include its utility in source design andoptimization (e.g., estimating effects of hypothetical and/or dangerous sources) and ininterpreting past events (e.g., in dose reconstruction).
The computer programs used at LLNL to model air releases and their impacts featureidealized, gaussian-shaped plumes and can be run on personal computers. TheCAP88-PC code (Parks 1992), in particular, incorporates dosimetric and health effectsdata and equations that are mandated by EPA to be used in compliance assessments.Furthermore, CAP88-PC accommodates site-specific input data files to characterizemeteorological conditions and population distributions for both individual and collec-tive dose evaluations, and the code is relatively easy to use and understand. For thesereasons, CAP88-PC has been the “workhorse” modeling tool for LLNL’s regulatorycompliance assessments since its availability in March 1992, particularly as applied tochronic releases of radioactivity to air occurring in the course of routine operations.
Radiation Protection Standards
The release of radionuclides from operations at LLNL and the resultant radiologicalimpact to the public are regulated by both DOE and EPA.
DOE environmental radiation protection standards, provided under the authority of theAtomic Energy Act of 1954 and the DOE Organization Act of 1977 (both as amended),are defined in DOE Order 5400.5, Radiation Protection of the Public and the Environment.The standards for controlling exposures to the public from operations at DOE facilitiesthat are incorporated in this order are based on recommendations by the InternationalCommission on Radiological Protection (ICRP). The radiological impact to the publicis assessed in accordance with DOE Order 5400.1, General Environmental Protection.Current indices and links to DOE orders appear on the Department of Energy Directiveswebsite (U.S. Department of Energy 1998c).
The primary DOE radiation standards for protection of the public are 1-millisievert-per-year (1-mSv/y) or 100-millirem-per-year (100-mrem/y) whole-body effective doseequivalent (EDE) for prolonged exposure of a maximally exposed individual in anuncontrolled area and 5-mSv/y (500-mrem/y) EDE for occasional exposure of thisindividual. (EDEs and other technical terms are discussed in Supplement 13-1 anddefined in the glossary of this report.) These limits pertain to the sum of the EDE fromexternal radiation and the committed 50-year EDE from radioactive materials ingestedor inhaled during a particular year that may remain in the body for many years.

13 Radiological Dose Assessment
13-4 LLNL Environmental Report for 1999
Radionuclide emissions to the atmosphere from DOE facilities are further regulatedby the EPA, under the authority of Section 112 of the Clean Air Act. Subpart H ofNESHAPs, under 40 CFR 61, sets standards for public exposure to airborne radioactivematerials (other than radon) released by DOE facilities; radon is regulated by Subparts Qand T. NESHAPs implements the dosimetry system recommended by the ICRP inPublication 26 (International Commission on Radiological Protection 1977).
The EPA’s radiation dose standard, which applies only to air emissions, limits the EDEto members of the public caused by activities/operations at a DOE facility to 0.1 mSv/yor 100 µSv/y (10 mrem/y). EPA regulations specify not only the allowed levels, butalso the approved methods by which airborne emissions and their impacts must beevaluated. With respect to all new and/or modified projects, NESHAPs complianceobligations define the requirements to install continuous air effluent monitoring and toobtain EPA approval for startup of operations. NESHAPs regulations require that anyoperation with the potential to produce an annual-averaged off-site dose greater than orequal to 1 µSv/y (0.1 mrem/y), taking full credit for emission-abatement devices, suchas high-efficiency particulate air (HEPA) filters, must obtain EPA approval prior tostartup of operations. This same calculation, but without taking any credit for emissionabatement devices, determines whether or not continuous monitoring of emissions to airfrom this project is required. These requirements are spelled out in Volume III ofLLNL’s online Environment, Safety, and Health (ES&H) Manual in the chapter, “AirQuality Compliance,” which can be found at the following Internet address:http://www.llnl.gov/es_and_h/ecm/chapter_12/chap12.html
Reporting Requirements
All DOE facilities that conduct significant environmental protection programs arerequired by DOE to prepare an annual environmental report for the site, coveringactivities of the previous calendar year involving releases to all media via all pathways.Because DOE facilities and operations are subject to the regulatory requirements of EPA,in particular 40 CFR 61, Subpart H, DOE facilities are further required to submit anannual report to the EPA, via DOE, showing compliance with NESHAPs (addressingonly releases to air).
Details on reporting requirements and citation of pertinent DOE orders and federalregulations are available in the chapter on radiological dose assessment in earlierenvironmental reports (e.g., Harrach et al. 1997) or LLNL’s radiological dose assessmentguidance document (Harrach 1998).

Radiological Dose Assessment 13
LLNL Environmental Report for 1999 13-5
Evaluation of Sources of Radioactive Emissions
The starting point for an assessment of radiological dose is to identify and properlycharacterize all significant sources of radioactive emissions at a site. LLNL’s sourcesare determined in three principal ways: (1) by monitoring airborne gases and partic-ulate matter at selected field points in and around the Livermore site and Site 300(continuous surveillance air monitoring), (2) by direct measurement of the emission rateat the source (continuous effluent monitoring), and (3) by an inventory process.
Inventoried Sources
Radiological operations areas are any locations where radioactive materials are used orstored, or where activation products occur. Several such areas at the Livermore sitehave effluent monitoring systems in place in their exhaust pathways, allowing a directmeasurement of their emission rates. For unmonitored or noncontinuously monitoredradiological operations areas, source terms for potential releases are inferred fromradionuclide inventories, in accordance with EPA methods.
Experimenters and facility managers provide inventory data, following a protocoldesigned and administered by LLNL’s Environmental Protection Department. A full(100%) inventory is conducted every three years; only the “key” Livermore site facilities,defined as those in a ranked list that collectively accounted for 90% or more of theprevious year’s Livermore site radiological dose to members of the public, are reinven-toried annually. LLNL conducted complete radionuclide inventories for operations in1994 and again in 1997. In addition, all new radiological operations areas (ones thatcommenced operations in the year under evaluation) are inventoried, and data onradionuclides used in all Site 300 explosives experiments are provided each year. Adescription of LLNL’s inventory process, including examples of the inventory form andaccompanying instructions, is given in the guidance document for preparation ofNESHAPs annual reports (Gallegos 1998).
For dose-assessment modeling of unmonitored or noncontinuously monitored sources,the effective emission rate is calculated from radiological usage inventories by applyingEPA-specified fractions for potential release to air of materials in different physicalstates (solid, liquid, powder, or gas) for each radioisotope. The inventory quantity (inbecquerels or curies) is multiplied by a state-dependent release fraction to give thepotential annual release to air, i.e., the “effective” emission rate, in accordance with40 CFR 61, Appendix D. If the material is an unconfined gas, the release fraction is 1.0;for liquids and powders, 1.0 × 10⁻³ is used; and for solids, 1.0 × 10⁻⁶. In the same way, ifthe radioactive material is encapsulated or sealed for the entire year (i.e., it was not used

13 Radiological Dose Assessment
13-6 LLNL Environmental Report for 1999
and release to air was prevented), then its release fraction is considered to be zero. Formaterials that were encapsulated or sealed for part of the year, or that resided in differ-ent facilities over the course of the year, “time weighting factors” are introduced toproperly account for the release potential. Information on inventories and descriptionsof the diffuse sources can be found in the guidance document (Gallegos 1998) and inNESHAPs annual reports.
Monitored Sources
Stack Effluent Monitoring
Actual measurements of radionuclides in effluent flow are the basis for reported emis-sions from continuously monitored sources. At the close of 1999, six buildings at theLivermore site had continuously monitored discharge points: Buildings 175, 177, 251,331, 332, and 491; taken together, these buildings feature 76 continuously operatingmonitors. Two other facilities (Buildings 292 and 490) had effluent monitoring systemsremoved during 1999. The monitoring systems are described in the LLNL NESHAPs1999 Annual Report (Gallegos et al. 2000), as well as in Chapter 4.
The most significant monitored source in terms of public dose impact is the TritiumFacility, Building 331, at the Livermore site. Each of the two 30-m stacks on this facilityhas both a continuous-monitoring ion-chamber alarm system and continuous molecular-sieve samplers (see Chapter 4 in the Data Supplement). The sieve samplers, which candiscriminate between tritiated-water vapor (HTO) and molecular tritium (HT), providethe values used for environmental reporting. The alarmed ion chambers provide real-time tritium concentration release levels (HT plus HTO). Monitoring of these stacksprovides an accurate measure of the total quantity (in becquerels or curies) of tritiumreleased to the environment, time-resolved over the course of the year. Because thestacks have known properties (height, flow rate, and diameter) and the wind fieldproperties (wind speed, direction, and fluctuation characteristics) are continuouslymonitored, these data are optimal inputs to modeling. The quality of data on sourceemission rates, emission conditions (e.g., stack height, diameter, and flow velocity), andwind patterns affects the accuracy of air dispersion and dose assessment modeling morethan any other input factors.
Discharge points at Buildings 175, 177, 251, 332, and 491 are monitored for gross alphaand gross beta radioactivity. Air samples for particulate emissions are extracted down-stream of HEPA filters and prior to the discharge point to the atmosphere. Particles arecollected on membrane filters. Sample results are generally found to be below the

Radiological Dose Assessment 13
LLNL Environmental Report for 1999 13-7
minimum detectable concentration (MDC) of the analysis; for details, consult Chapter 4in this report and the 1999 NESHAPs annual report (Gallegos et al. 2000).
Among the six continuously monitored facilities at the Livermore site, probably onlythe Plutonium Facility (Building 332) and the Tritium Facility (Building 331) requiremonitoring under the EPA’s 0.1-mrem/y standard alluded to in the subsection, RadiationProtection Standards. The other four are continuously monitored for programmatic orother reasons. For example, continuous monitoring is maintained at the Heavy ElementsFacility (Building 251) in lieu of undertaking a modeling and measurement effort thatwould be required to demonstrate that monitoring is not needed.
Dose calculations based on effluent monitoring data are expected to be considerablymore accurate than those relying on usage-inventory data, physical-state release-to-airfractions, emission-abatement factors, and time factors.
Surveillance Air Monitoring
To provide wide-area coverage complementing the stack effluent monitoring, surveil-lance air monitors are placed at selected locations on the Livermore site and Site 300 andin their vicinities to detect radioactive gases and particulate matter in ambient air. Inaddition, dose rates from external penetrating radiation (gamma rays) are measuredusing thermoluminescent dosimeters (TLDs). Siting of the air monitors and TLDs isdone in accordance with the LLNL Environmental Monitoring Plan (Tate et al. 1999).Surveillance air monitors are also placed in the vicinity of known diffuse (extended area)emission sources at the Livermore site, specifically those associated with Buildings 292,331, 514, and 612. Such monitors are also located in and around the Livermore site’ssoutheast quadrant, and at on-site locations that provide wide coverage of Site 300.These special monitors measure the concentrations of radionuclides present in the airnear the sources and allow a direct determination of their environmental impact (seeChapter 5). The surveillance air monitors not only are useful in gauging releases fromroutine operations; they have also proven valuable in quantifying the magnitude ofaccidental releases and their dose impacts.
Determinations of Dose
This section briefly describes the way LLNL estimates doses to the public for compliancepurposes. It touches on the main modeling approaches, identifies the key hypotheticalreceptors that represent the most exposed public individuals, discusses some important

13 Radiological Dose Assessment
13-8 LLNL Environmental Report for 1999
aspects regarding the modeling of tritium, and briefly notes some of the specialmodeling challenges raised by diffuse sources and explosives experiments.
Principal Modeling Approaches
LLNL’s primary calculational tool for estimating dose and risk to the public from routineoperations and most unplanned releases is the computer code CAP88-PC. The user’sguide (Parks 1992) provides useful information on the code, including discussions of thebasic equations and key input and output files. Additional information, for example,about LLNL-site-specific data files and several important caveats on use of the code, hasbeen presented in earlier environmental reports (e.g., Harrach et al. 1998) and more fullyin the LLNL radiological dose assessment guidance document (Harrach 1998).
Other codes such as EPA’s INPUFF code (Peterson and Lavdas 1986) or the HOTSPOTcode (Homann 1994) are used as needed to address unplanned releases or transientreleases from normal operations or accidents. Many other gaussian-plume-typecomputer models are available; see, for example, the annotated lists in AtmosphericDispersion Modeling Resources (Oak Ridge 1995) and Supplement B to the Guideline on AirQuality Models (Revised) (U.S. Environmental Protection Agency 1993).
A complementary approach to deriving effective dose equivalents or EDEs using thebuilt-in dosimetry model in CAP88-PC or other codes is to explicitly calculate themusing mathematical formulas from, e.g., the Nuclear Regulatory Commission’sRegulatory Guide 1.109 (1977), which incorporate dose conversion factors consistentwith those in the International Commission on Radiation Protection’s documentnumber 30 (1980). This approach, outlined in Appendix A of this report, has been usedhistorically at LLNL (preceding the availability of CAP88-PC) and can be used toevaluate annual doses to the public inferred from sampling of local environmentalmedia (air, water, vegetation, and wine).
Identification of Key Receptors
When assessing probable off-site impacts, LLNL pays particular attention to threepotential doses. First is the dose to the “sitewide maximally exposed individualmember of the public” (SW-MEI; defined below). Second is the dose to themaximally exposed individual (MEI) member of the public from a given emissionpoint. Third is the collective or “population dose” received by people residing

Radiological Dose Assessment 13
LLNL Environmental Report for 1999 13-9
within 80 km of either of the two LLNL sites, adding the products of individualdoses received and the number of people receiving them.
The SW-MEI is defined as the hypothetical member of the public at a single, publiclyaccessible location (where members of the public reside or abide) who receives thegreatest LLNL-induced EDE from all sources at a site (e.g., the Livermore site). Thisdose sums the contributions of all emission points for evaluation under the EPA’s100-µSv/y (10-mrem/y) standard. Public facilities that could be the location of theSW-MEI include schools, churches, businesses, and residences. This hypothetical personis assumed to reside at this location 24 hours per day, 365 days per year, continuouslybreathing air having the ground-level radionuclide concentration, and consuming aspecified fraction of food and drinking water that is affected by the releases of radio-activity from the site. Thus, the SW-MEI dose is not received by any actual individualand is used as a health-conservative estimate (i.e., over-estimate) of the highest possibledose to any member of the public. The location of the SW-MEI is sensitive to thefrequency distribution of wind speeds and directions and locations of key sources in agiven year and can change from one year to the next. At the Livermore site, the SW-MEI in 1999 was located at the UNCLE Credit Union, about 10 m outside the controlledeastern perimeter of the site. This location lies 948 m from the principal radionuclidesource, the Tritium Facility (Building 331), in an east-northeast direction (the typicalprevailing wind direction). At Site 300, the 1999 SW-MEI was located in an experi-mental area termed “Bunker 2,” operated by Primex Physics International. Bunker 2 liesabout 300 m outside the east-central boundary of Site 300, 2.38 km east-southeast of theprincipal firing table at Building 801.
The location of the MEI is generally different for each emission point. The MEI dose isused to evaluate whether continuous monitoring of each particular emission point isrequired and whether it is necessity to petition the EPA for permission to start up anactivity (new or modified project), as discussed in the Reporting Requirements section.
Doses to the MEI, with and without allowance for abatement, are a major considerationwhen new projects or changes to existing projects (in which releases of radioactivity tothe environment may occur) are reviewed for joint compliance with NESHAPs and theNational Environmental Policy Act (NEPA). The possible environmental and workersafety issues raised by each proposed activity or project are examined from severaldifferent points of view in a process coordinated by LLNL’s Environmental ProtectionDepartment, including a review and evaluation of potential emissions of radionuclidesand air toxics. Air-quality compliance requirements for projects are described in “AirQuality Compliance” in Volume III of the ES&H Manual at the following Internetaddress: http://www.llnl.gov/es_and_h/ecm/chapter_12/chap12.html

13 Radiological Dose Assessment
13-10 LLNL Environmental Report for 1999
Assessment Assumptions Regarding Tritium
Several aspects of tritium dose estimates based on CAP88-PC should be noted.
Relative Contributions to Dose from HTO and HT Emissions
Tritium (3H) emissions account for the major dose from operations at the Livermore site.These emissions exist in two major chemical forms: tritium oxide or tritiated watervapor (HTO) and tritium gas (HT). The doses received by exposure to these two formsdiffer greatly. HTO enters the body by ingestion, inhalation, and dermal absorption; HTenters by inhalation. Ingested HTO is distributed throughout the entire body andeliminated at the same rate as body water (apart from the small fraction metabolized).Inhaled HTO dissolves in the fluids of the lung and is absorbed. In contrast, very littleof the HT that enters the body via inhalation is retained; most is exhaled. The EDE frominhalation of tritium gas is lower by a factor of about 10,000 than that from tritium oxideinhalation (International Commission on Radiological Protection 1994 and 1996), and,overall, HTO is traditionally considered to be 25,000 times more toxic (Eckerman et al.1988; International Commission on Radiological Protection 1979). HT requires conver-sion to HTO (oxidation) to produce significant dose. Such conversion, predominately insoil and, to a lesser extent, in vegetation following deposition, is a complicated processto model. LLNL is preparing a new tritium model, designed for incorporation intoregulatory compliance codes such as CAP88-PC, to calculate the contribution of HTreleases to dose.
Emissions of HTO are expected to be the major contributor to the tritium dose, particu-larly for nearby individual receptors, such as the MEI and SW-MEI; typically, LLNLenters into CAP88-PC only the curies of HTO released to air, disregarding the HT com-ponent. A more conservative approach would be to treat all HT as HTO in dose calcu-lations. In April 1999, EPA mandated that LLNL do exactly that when calculating doseto the public for NESHAPs compliance purposes. For a discussion of this issue and thedose impacts, see the LLNL NESHAPs annual reports for 1998 and 1999 (Biermann et al.1999; Gallegos et al. 2000). It should be noted that this HT “dual” doses problemconcerns only the Livermore site; at Site 300, tritium makes a negligible contribution tothe public dose.
In 1999, Tritium Facility emissions were divided between 214 curies of HTO and67 curies of HT, and the result of treating HT as HTO for the 1999 assessment was toincrease the Livermore site dose to the SW-MEI by about 21% compared to the valueobtained using the previous procedure. The population dose from Livermore siteoperations, which gives greater weight to the emissions from the tall stacks of theTritium Facility than does the SW-MEI dose, was increased by 28% when treating HTas though it were HTO. This report emphasizes doses excluding contributions from

Radiological Dose Assessment 13
LLNL Environmental Report for 1999 13-11
HT because (1) we believe it is more accurate to do so than to represent HT as fullyconverted to HTO, and (2) to provide continuity with doses reported in the past.
Dose-Rate-Conversion Factor for Tritium
The dose-rate-conversion factor that CAP88-PC uses for inhalation-plus-dermal-absorption of tritium is outdated and more conservative than the values quoted inrecent literature. The ICRP in its publication ICRP 30 (1979) recommended that skinintake should be 50% of lung intake, revising its earlier recommendation stated inICRP 2 (1959) that skin intake equals lung intake. The CAP88-PC dose-rate-conversionfactor for tritium contains the 1959 recommendation, producing an inhalation-plus-dermal-absorption dose that is too large by a factor 4/3 relative to the more recentrecommendation; see Attachment 3 in the NESHAPs 1995 Annual Report (Gallegoset al. 1996). LLNL’s new tritium model, alluded to in the previous section, willincorporate ICRP 30 (1979) values.
Overestimate of Ingestion Dose for Tritium
CAP88-PC overestimates the ingestion dose from tritium in a manner that depends oninput selections, according to a recent article by Barry Parks (Parks 1999). The cause canbe traced to three key assumptions implicit in the software that may not be immediatelyapparent to the user: (1) the contribution of home-grown food, (2) the distances atwhich food is produced, and (3) the number of people consuming locally producedfood. Documentation on how these overestimates can occur is also available on theInternet at the following address:
http://www.er.doe.gov/production/er-80/cap88/tritium.html
These defects will not be addressed in the new LLNL tritium model.
Contribution from Ingestion of Organically Bound Tritium
The dose-rate-conversion factor for ingestion of organically bound tritium (OBT) islarger than that for ingestion of tritium in the free water of plants and animals.However, because the concentration of free-water tritium exceeds the concentrationof tritium in organic matter for most dietary components in LLNL’s ingestion doseassessment, free-water tritium makes the dominant contribution to dose, per unit weightconsumed. LLNL’s standard operating procedure is to disregard the OBT contribution.However, effort is underway to include the contribution of OBT to dose in the assess-ment as part of the capability to be offered in LLNL’s tritium model; see also thediscussion in Appendix A in this report.

13 Radiological Dose Assessment
13-12 LLNL Environmental Report for 1999
Special Modeling Problems
Nonstack releases may require special measurements and calculations to characterize thesource. Both the Livermore site and Site 300 provide important examples in this regard.
Diffuse Sources
Nonstack releases often fall into the classification of “diffuse sources.” One exampleis the leakage of tritium-contaminated water from an underground retention tank atBuilding 292 at the Livermore site, which results in the release of tritium to the atmos-phere via soil moisture evaporation and root-uptake and transpiration by plants—fromone pine tree in particular. A discussion of this source appears in the Livermore SiteDiffuse Sources section in the NESHAPs 1993 Annual Report (Harrach et al. 1994);subsequent NESHAPs annual reports provide updates. Emissions from certain difficult-to-characterize sources sometimes can be inferred from data obtained by LLNL’s routinesurveillance air monitoring program, in which the ambient air at selected locations withinand outside Laboratory boundaries is continuously monitored for tritium gas andradioactive particles. For example, the operations in the Building 612 waste storage yardat the Livermore site are characterized using data from an air monitor in the yard.Another example is the diffuse source caused by resuspension of depleted uranium insoil at Site 300; an air monitor at the location of the SW-MEI measures the annual-averageconcentration of uranium in air. A theoretical model described in the NESHAPs 1995Annual Report (Gallegos et al. 1996) was developed to distinguish between thecontribution made to these Site 300 data by LLNL-operations-contributed uranium,compared to the considerably larger contribution from naturally occurring uranium. Theroutine air surveillance monitoring program also has been particularly useful in register-ing the magnitude of unplanned releases; an example of this type is provided by theaccidental release of curium-244 from Building 513 in 1997, discussed in the ExecutiveSummary, Chapter 2, and Chapter 12 of LLNL’s Environmental Report 1997 (Harrach et al.1998), as well as in the 1997 NESHAPs annual report (Gallegos et al. 1998).
Modeling Dose Impacts from Explosives Experiments at Site 300
Special consideration must be given to modeling releases of radionuclides into the atmos-phere from explosive tests at Site 300, compared to conventional stack or area sources.During experiments, an explosive device containing depleted uranium is placed on anopen-air firing table and detonated. A cloud of explosive decomposition products formspromptly (on a roughly 1-minute time-scale) over the firing table, typically reaching aheight of several hundred meters, and disperses as it is carried downwind. (The depleteduranium does not contribute to the explosive energy, which is entirely of chemical origin.)

Radiological Dose Assessment 13
LLNL Environmental Report for 1999 13-13
In the absence of measurements of the cloud properties, we assume for compliancemodeling purposes that it instantaneously reaches an initial height and size governed byknown empirical scaling laws for detonations, in which the scaling parameter is the TNT-equivalent explosive mass. The specific equations we use for the maximum elevation,Hmax, reached by the plume and the diameter, D, of the cloud of decomposition productshave been described elsewhere (Harrach et al. 1998, Harrach 1998).
Transport and dispersion of the quickly formed cloud are modeled using a gaussian-plume air-dispersion code. A puff-code-based modeling methodology was submitted toEPA for approval in 1992 (Biermann et al. 1993). It would treat these transient explosiveevents as short-duration bursts or puffs, would incorporate some of the effects of thehilly terrain at Site 300, and would use meteorological data appropriate to the cloud-dispersal period. EPA decided that, from the standpoint of regulatory compliance, theuse of CAP88-PC to model these explosives experiments was adequate, despite therecognized difficulties. CAP88-PC simulates each explosive experiment or shot as acontinuous, year-long, stack-type emission (i.e., the total activity released in a timeperiod of order 1 minute in the explosion is treated as though it were released graduallyover the course of an entire year), with meteorological data corresponding to annual-average conditions at Site 300. As inputs to the code, the scaling results for Hmax and Dare used as a fixed plume height and stack diameter.
LLNL uses isotopic ratios for depleted uranium. The masses of the three uraniumisotopes with atomic weights 238, 235, and 234 in depleted uranium occur in the weight-percentages 99.8, 0.2, and 5 × 10⁻⁴, respectively. The inventory for each explosiveexperiment specifies the mass of depleted uranium used: MDU(kg). Multiplying thisquantity by the respective specific activities gives the total number of curies for eachisotope in the cloud. For example, the fraction by weight of uranium-238 in depleteduranium is 0.998, and its specific activity is 3.33 × 10⁻⁴ Ci/kg, giving 3.33 × 10⁻⁴ (Ci/kg)× MDU(kg) as the number of curies of uranium-238 in the cloud. The correspondingvalues for uranium-235 and uranium-234 are 4.29 × 10⁻⁶ (Ci/kg) × MDU(kg) and3.10 × 10–5 (Ci/kg) × MDU(kg), respectively.
In the absence of detailed data about the explosive experiments, several highly con-servative assumptions are made in our calculations. These assumptions are (1) 100% ofthe depleted uranium present in the experiment is completely aerosolized and dispersedas a cloud; (2) the median particle size is the CAP88-PC default value of 1 µm; and (3)the lung clearance class for inhaled material is class Y. (Note: Clearance of inhaledmaterial from the lung to the blood or to the gastrointestinal tract depends on thechemical form [e.g., U3O8] of the radionuclide and is classified as D, W, and Y,respectively, for clearance times of order days, weeks, and years.) These assumptions

13 Radiological Dose Assessment
13-14 LLNL Environmental Report for 1999
may produce a dose that is too high by a factor of 10 or more. We believe a morerealistic release-to-air fraction for the uranium is no greater than 0.2, but we lacksufficient documentation to use a value other than 1.0. Also, the median particle sizemay be much larger than 1 µm, and a sizable fraction of the aerosolized particles mightbe more properly characterized by lung clearance class D, which produces a dose byinhalation of depleted uranium that is smaller by a factor of about 16 compared toclass Y. Even with these assumptions, the MEI and SW-MEI individual doses as well asthe collective or population dose that we calculate annually for the explosive experi-ments are very small compared with natural background levels and regulatorystandards (see, e.g., the Summary and Conclusions section of this chapter).
Radiological Doses to the Public from LLNL Operations
Nearly 200 emission points were reported on in the 1999 modeling runs. These emissionsources were of several types: stacks and other exhaust pathways from buildings,diffuse area sources generally external to buildings, and open-air firing tables at Site 300where explosives experiments were conducted.
The principal diffuse sources at the Livermore site in 1999 were the waste storage anddrum sampling areas at the Building 612 Yard, a waste accumulation area locatedoutside the Tritium Facility (Building 331), and the Building 514 Tank Farm. Theprincipal diffuse sources at Site 300 are evaporation of tritium and resuspension ofdepleted uranium over the total land area of the site.
This section summarizes the main results of LLNL’s calculations for 1999 operations andexhibits the trends in these results over recent years. For further details, especiallyregarding the diffuse sources at the two sites, see the LLNL NESHAPs 1999 AnnualReport (Gallegos et al. 2000).
Dose Breakdown by Facility
Table 13-1 lists all LLNL facilities and diffuse sources having the potential to releaseradioactivity into the environment during 1999. For each facility or building, the tablegives the number of stacks or other exhaust avenues discharging radionuclides; liststhe dose to the SW-MEI caused by the single, most dominant emission point at eachfacility; and identifies the types of operations occurring in the building or facility or thenature of the diffuse source. Corresponding data are included for the Site 300 explosive

Radiological Dose Assessment 13
LLNL Environmental Report for 1999 13-15
experiments. Facilities in which no operations using radionuclides took place in 1999 orin which any radionuclides present were encapsulated or sealed for the entire year areexcluded from Table 13-1.
Table 13-1. Sources of radiation dose from LLNL releases (measured and potential) to air: stacks andother exhaust pathways from buildings containing radiological operations, and diffuse areasources.(a,b)
Bldg FacilityPotentialemission
points
MaximumEDE(c)
(µSv/y)Operations
Livermore site point sources
131 Offices and laboratories,Mechanical & ElectricalEngineering
3 6.5 × 10⁻⁶ Display of parts
132N Offices and laboratories;Chemistry & MaterialsSciences; Nonproliferation,Arms Control & InternationalSecurity (NAI); and others
10 3.3 × 10⁻⁹ Preparation of samples for radiochemical analysis;analysis of aqueous solutions and waste samples
132S See Building 132N 1 2.5 × 10⁻¹⁰ Transfer of uranium
151 Isotope Sciences Chemistry &Materials Science Environ-mental Services Laboratory
30 1.5 × 10⁻⁴ Application of nuclear and isotope sciences to a widerange of research; sample analysis of waste streamsand environmental media for radionuclide content
174 Laser Isotope Separation 1 1.5 × 10⁻¹¹ Pulse laser experimentation
175 Laser Isotope Separation 6 0.0(d) Cleaning and refurbishing uranium parts
177 Laser Isotope Separation 8 1.2 × 10⁻² Sample preparation, cleaning of parts, processinguranium oxide powders, melting uranium in cruciblesunder vacuum, liquid uranium corrosion studies
194 Physics & Space Technology 2 9.4 × 10⁻⁵ High-energy linear accelerator, positron beamgeneration and experiments; materials scienceexperiments
212 Physics & Space Technology 2 6.8 × 10⁻¹¹ Physics experiments, residual contamination fromprevious operation of rotating target neutron source (nolonger operating)
222 Chemistry & Materials Science 8 5.0 × 10⁻⁶ Chemical analyses, cleaning equipment, waste samplepreparation and analysis, decontamination, x-rayfluorescence analysis, sample digestion
231 Chemistry & MaterialsScience; Engineering,Weapons Engineering;Safeguards & Security
18 4.8 × 10⁻⁵ Materials research and testing, metals processing andcharacterization, electron-beam welding, grinding/polishing, casting, microscopy, sample preparation,storage
235 Chemistry & Materials Science 3 3.1 × 10⁻¹¹ Material structure studies, precision cutting, ionimplantation, metallurgical studies, sample preparation

13 Radiological Dose Assessment
13-16 LLNL Environmental Report for 1999
Table 13-1. Sources of radiation dose from LLNL releases (measured and potential) to air: stacks andother exhaust pathways from buildings containing radiological operations, and diffuse areasources(a,b) (continued).
Bldg FacilityPotentialemission
points
MaximumEDE(c)
(µSv/y)Operations
241 Chemistry & Materials Science 8 1.8 × 10⁻⁶ Materials properties research and testing on plutoniumand uranium; hybridization studies with nucleic acidsfrom soil bacteria
251 Heavy Elements Facility,Physics & Space Technology
Storage of transuranic isotopes prior to disposal
Seismically hardened area 4 0.0(d)
Unhardened areas 28 8.8 × 10⁻⁶
253 Hazards Control 6 3.3 × 10⁻⁸ Chemical analysis and counting of radioactive samples
254 Hazards Control 3 1.9 × 10⁻¹² Bioassays; analytical services; urine analyses forradionuclides
255 Hazards Control 2 9.8 × 10⁻⁵ Radiation standards and instrument calibration
281 Chemistry & Materials Science 7 1.6 × 10⁻⁸ Sample preparation, radioactivity migration studies,tracers, Nevada Test Site ground water samples
282 Physics & Space Technology 1 6.2 × 10⁻¹² Residual tritium contamination from past activities
292 Environmental Programs 3 2.3 × 10⁻⁵ Tritium contamination from prior operations
298 Laser Fusion Program 3 3.5 × 10⁻⁵ Laser fusion targets research and development
321 Mechanical Engineering,Materials Fabrication
6 3.1 × 10⁻⁷ Milling, shaping, heat treating, and machining depleteduranium parts
322 Mechanical Engineering 1 4.3 × 10⁻⁹ Cleaning and plating of depleted uranium
327 Mechanical Engineering 1 1.6 × 10⁻⁷ Nondestructive ultrasonic material evaluation
331 Tritium Facility, Defense &Nuclear Technologies
2 6.5 × 10⁻¹(d,e) Tritium research and development, facilitydecontamination and decommissioning operations
332 Plutonium Facility, DefenseSciences Program
8 0.0(d) Plutonium research
361 Biology and BiotechnologyResearch
14 4.6 × 10⁻⁶ DNA labeling, sequencing, hybridization, and enzymeassay; human genome research; P-32 labeling; DNAprotein interaction studies; gel electrophoresis
362 Biology and BiotechnologyResearch
2 9.5 × 10⁻⁸ Characterization of metabolic pathways
363 Biology and BiotechnologyResearch
5 6.4 × 10⁻⁹ Human urine sample project, rotary evaporation,labeling of biological materials, isotopic labeling
364 Biology and BiotechnologyResearch
4 4.9 × 10⁻⁷ DNA labeling, DNA and protein extraction, samplepreparation
365 Biology and BiotechnologyResearch
3 5.3 × 10⁻⁸ Housing research animals, animal research,equipment decontamination
366 Biology and BiotechnologyResearch
1 5.9 × 10⁻⁸ DNA labeling

Radiological Dose Assessment 13
LLNL Environmental Report for 1999 13-17
Table 13-1. Sources of radiation dose from LLNL releases (measured and potential) to air: stacks andother exhaust pathways from buildings containing radiological operations, and diffuse areasources(a,b) (continued).
Bldg FacilityPotentialemission
points
MaximumEDE(c)
(µSv/y)Operations
381 Laser Fusion 1 7.0 × 10⁻⁹ Tritium handling for laser target research anddevelopment
391 Laser Fusion 1 7.4 × 10⁻⁵ Housing of high-energy laser; fusion-target irradiation
490 Laser Isotope Separation 1 0.0(d) U.S. Enrichment Corporation isotope separationoperations, including vaporization of uranium forenrichment
491 Laser Isotope Separation 1 0.0(d) U.S. Enrichment Corporation isotope separationoperations
513 Hazardous WasteManagement
2 1.0 × 10⁻⁵ Sampling, treatment, and storage of hazardous, mixed,and radioactive waste; process optimization andtreatability studies
514 Hazardous WasteManagement
2 1.3 × 10⁻² Vacuum filtration of treated waste water, wasteconsolidation
612 Hazardous WasteManagement
4 2.0 × 10⁻² Waste sampling; waste repackaging for shipment offsite; analysis of waste treatment and treatabilitysamples; decontamination of compactor baler
Site 300 point sources
801 Flash x-ray machine 1 5.2 × 10⁻⁷ Flash x-ray photography of explosives experiments
801 Site 300 firing table atBuilding 801
—(f) 1.2 × 10⁻¹ Detonation of explosives
810A Site 300 firing table support 1 1.2 × 10⁻⁷ Assembly of explosives
851 Site 300 firing table atBuilding 851
—(f) 2.1 × 10⁻¹ Detonation of explosives
851 Linear accelerator 1 9.6 × 10⁻⁶ Research
Livermore site diffuse sources(g)
170 Area of soil contamination 1 8.4 × 10⁻⁵ Remediation activities at soil staging area
223 Contaminated facility 1 1.7 × 10⁻³ Decontamination and decommissioning activities
292 Spill area 1 7.3 × 10⁻⁷ Evaporation and transpiration of tritiated water fromunderground tank leakage
331 Tritium Facility (external) 1 6.1 × 10⁻² Outdoor temporary placement of contaminated parts andequipment awaiting transport and storage
514 Hazardous WasteManagement Tank Farm
1 3.2 × 0–2 Processing of liquid hazardous, mixed, and radioactivewastes in open-topped tanks
612 Hazardous WasteManagement storage yard
2 1.8 × 10⁻¹ Storage of low-level waste; drum sampling and wasteaccumulation areas
— Southeast quadrant ofLivermore site
1 4.2 × 10⁻³ Ground contaminated with Pu-239 from past wastemanagement operations

13 Radiological Dose Assessment
13-18 LLNL Environmental Report for 1999
Table 13-1. Sources of radiation dose from LLNL releases (measured and potential) to air: stacks andother exhaust pathways from buildings containing radiological operations, and diffuse areasources(a,b) (concluded).
Bldg FacilityPotentialemission
points
MaximumEDE(c)(µSv/y)
Operations
Site 300 diffuse sources(g)
— All Site 300 land area 1 6.0 × 10⁻⁴ Evaporation of tritium from contaminated soil and water
— All Site 300 land area 1 1.2 × 10⁻² Resuspension of uranium in contaminated soil
804 Open area 1 6.0 × 0–6 Low-level waste staging area
a LLNL NESHAPs 1999 Annual Report (Gallegos et al. 2000).
b Areas in which no operations using radionuclides took place in 1999 or in which all radionuclides were encapsulated or sealed for theentire year are not included in this table. Table entries refer to routine operations, not unplanned releases.
c The maximum EDE to the SW-MEI member of the public from a single discharge point, among all discharge points modeled for theindicated facility or building. The SW-MEI is defined in the Identification of Key Receptors section. See the Glossary for list ofacronyms.
d The effluents from the facility are monitored. Zeroes refer to monitored values below the minimum detectable concentration, asdiscussed, for example, in the Air-Emission Data section of the LLNL NESHAPs 1999 Annual Report (Gallegos et al. 2000).
e This dose takes into account only HTO emissions from the Tritium Facility stacks. If, instead, the emissions of HTO and HT are combined,and the sum treated as though it were entirely HTO for purposes of evaluating the maximum potential dose to the public, the dose from theprincipal stack was 0.86 µSv/y, rather than 0.65 µSv/y. (See the Assessment Assumptions Regarding Tritium section.)
f Open-air dispersal in 1999.
g Diffuse sources are described briefly in the Special Modeling Problems section and more fully in the LLNL NESHAPs 1999 Annual Report(Gallegos et al. 2000).
The principal feature shown in the table is that LLNL has a large number of very smallradioactive sources and only a few that could be considered significant. As shown moreclearly in subsequent tables, about a half-dozen sources account for nearly all of thedose to members of the public, and the total dose is quite small compared with federalstandards for radiation protection of the public.
Unplanned Releases
There were no unplanned atmospheric releases at the Livermore site or Site 300 in 1999.
Doses to Site-Wide Maximally Exposed Individuals
The 1999 calculated EDE to the SW-MEI from Livermore-site point sources was 0.73 µSv(0.073 mrem). Emissions from the two 30-m stacks at the LLNL Tritium Facility

Radiological Dose Assessment 13
LLNL Environmental Report for 1999 13-19
(Building 331) accounted for most of this: 0.67 µSv (0.067 mrem), or about 92%. For theLivermore site, the SW-MEI dose caused by diffuse emissions in 1999 was 0.28 µSv(0.028 mrem). Combining point and diffuse sources, the total annual dose was 1.0 µSv(0.10 mrem), divided 72% and 28% between point and diffuse source emissions. Thisis about twice last year’s total, principally reflecting a nearly two-fold increase in emis-sions from the stacks of the Tritium Facility (Building 331): 7.9 × 10¹² Bq (214 Ci) ofHTO in 1999, compared to 4.1 × 10¹² Bq (110 Ci) the previous year. Calculating doseas directed by EPA (treating HT as HTO), the total annual dose to the SW-MEI fromLivermore-site operations was 1.2 µSv (0.12 mrem), with 77% attributed to point sourcesand 23% to diffuse sources (see the Assessment Assumptions Regarding Tritiumsection).
The calculated EDE to the SW-MEI at Site 300 in 1999 was 0.35 µSv (0.035 mrem), with0.34 µSv (0.034 mrem) caused by emissions in the course of explosives experiments atthe Building 801 and 851 firing tables. The remaining 0.012 µSv (0.0012 mrem), or a littleover 3% of the total, was attributed to Site 300 diffuse sources; the resuspension ofLLNL-contributed uranium in surface soils throughout Site 300 was responsible fornearly all of this dose from diffuse sources. Table 13-2 summarizes doses to the publicSW-MEI for the Livermore site and Site 300 over the last decade.
Table 13-3 shows the potential public dose values attributed to firing table experimentsfor 1990 through 1999, correlated with the total amounts of depleted uranium and thetotal quantity of high explosives used each year in the experiments. (Only experimentsthat included depleted uranium are considered; most have none.) The 1999 firing tabletotal is typical of values in recent years (see the “point source dose” column for Site 300in Table 13-2). The data show that variations from year to year in these doses mainlycorrespond to differences in the amount of depleted uranium used in the tests.
Table 13-4 lists the facilities that were primarily responsible for the LLNL dose; thecontributions from all emission points at each facility have been summed. Thesefacilities collectively accounted for approximately 93% of the total EDE resultingfrom Livermore site operations and for more than 99% of the total EDE from Site 300operations. The principal radionuclide(s) are indicated for each facility. Tritium was theoverall dominant radionuclide at the Livermore site, accounting for about 90% of theLivermore site dose. At Site 300, practically the entire dose was attributed to theisotopes present in depleted uranium having atomic numbers 238, 235, and 234.

13 Radiological Dose Assessment
13-20 LLNL Environmental Report for 1999
Table 13-2. Doses (µSv) calculated for the SW-MEI for the Livermore site and Site 300,1990 to 1999.
Year Total dose Point source dose Diffuse source dose
Livermore site
1999 1.0(a) 0.73(a) 0.28(a)
1998 0.49 0.25 0.24
1997 0.97 0.78 0.19
1996 0.93 0.48 0.45
1995 0.41 0.19 0.22
1994 0.65 0.42 0.23
1993 0.66 0.40 0.26
1992 0.79 0.69 0.10
1991 2.3 —(b) —(b)
1990 2.4 —(b) —(b)
Site 300
1999 0.35 0.34 0.012
1998 0.24 0.19 0.053
1997 0.20 0.11 0.088
1996 0.33 0.33 0.0045
1995 0.23 0.20 0.03
1994 0.81 0.49 0.32
1993 0.37 0.11 0.26
1992 0.21 0.21 —(c)
1991 0.44 0.44 —(c)
1990 0.57 0.57 —(c)
a Calculating dose by the alternative method as directed by EPA, the total dose for 1999 was 1.2 µSv, and the pointsource dose was 0.94 µSv; see the discussion in the Assessment Assumptions Regarding Tritium section.
b Diffuse source doses were not reported separately from the total dose for the Livermore site for 1990 and 1991.
c No diffuse emissions were reported at Site 300 for years prior to 1993.

Radiological Dose Assessment 13
LLNL Environmental Report for 1999 13-21
Table 13-3. Annual dose to the SW-MEI from explosives experiments on firing tables atSite 300, 1990–1999, related to the total quantity of depleted uranium usedin the experiments and the total quantity of high explosives drivingthe detonations.
Dose to SW-MEI Total depleted U used in Total HE (a) used in depleted
Year (µSv) (mrem) experiments (kg) U experiments (kg)
1999 0.34 0.034 216 1681998 0.19 0.019 230 1921997 0.11 0.011 163 1221996 0.33 0.033 272 1121995 0.20 0.020 165 1991994 0.49 0.049 230 1341993 0.11 0.011 99 741992 0.21 0.021 151 3601991 0.44 0.044 221 3301990 0.57 0.057 340 170
a HE = high explosives.
Table 13-4. Major contributors to LLNL’s radiation dose via airborne emissions, 1999.
Facility or Dominant EDE at SW-MEI(b)
operation(a) radionuclide(s) µSv/y mrem/y
Livermore siteB331/Tritium Facility 3H 0.67(c) 0.067(c)
B612 Yard Area(d) 3H 0.18 0.018B331 External Waste Accumulation Area(d) 3H 0.061 0.0061B514 Tank Farm(d) Various 0.032 0.0032Sum of all other sources Various 0.074 0.0074
Total 1.0 (c,e) 0.10(c,e)
Site 300B851/firing table 238U, 234U, 235U 0.21 0.021B801/firing table 238U, 234U, 235U 0.12 0.012Soil resuspension(d) 238U, 234U, 235U 0.012 0.0012
Total 0.35(e,f) 0.035(e,f)
a The facilities cited here are discussed in the text of this report and in more detail in the LLNL NESHAPs Annual Reports.
b These doses represent the sum of all emission points from a given facility (for example, both stacks on Building 331),in contrast to the dose values in Table 13-1, which represent the dose from the single largest emission point at eachfacility. The SW-MEI member of the public is defined in the Identification of Key Receptors section.
c Calculating dose as directed by EPA yields 0.88 µSv/y for the Tritium Facility, which raises the total dose to 1.2 µSv/y.(See the Assessment Assumptions Regarding Tritium section.)
d Diffuse sources (see text).
e These Livermore site and Site 300 totals represent 1.0% and 0.35%, respectively, of the federal standard.
f Total does not exactly match the sum of entries because of rounding.

13 Radiological Dose Assessment
13-22 LLNL Environmental Report for 1999
The relative significance of inhalation and ingestion is different for tritium and uraniumand depends on the assumptions made about the origin of food consumed by a personreceiving the dose. For the conditions we assumed when assessing individual doses—namely that milk is imported while the remainder of the food is produced locally—ingestion dose is larger than inhalation dose in the case of tritium, approximately inthe ratio 80% to 20%. For uranium, these numbers are nearly reversed: 17% by theingestion pathway versus 83% via inhalation. For both uranium and tritium, externaldoses from air immersion and ground irradiation were negligible.
Temporal Trends in Dose to the SW-MEI
The trends in dose to the SW-MEI from emissions at the Livermore site and Site 300over the last ten years are shown graphically in Figure 13-1 (see also Table 13-2). Thegeneral pattern, particularly over the last eight years, shows year-to-year fluctuationsaround a quite low dose level, staying at about 1% of the federal standard.
1990 1991 1992 1993Year
Livermore site
Site 300
EPA radionuclide-NESHAPs standard
Tota
l do
se (
µSv)
Tota
l do
se (
mre
m)
1994 1995 1996 1997 1998 1999
0.1
0.01
1.0
10
1.0
0.1
10
100
Figure 13-1. Annual dose to the site-wide maximally exposed individual member of thepublic, 1990 to 1999.

Radiological Dose Assessment 13
LLNL Environmental Report for 1999 13-23
The SW-MEI dose estimates reported are intentionally conservative, erring on the side ofpredicting potential doses that are several times higher than would actually be experi-enced by any member of the public. Potential doses from Site 300 firing table operationsare especially so, as explained in the Special Modeling Problems section.
Collective Doses to Exposed Populations
Population doses, or collective EDEs, for both LLNL sites were calculated out to adistance of 80 km in all directions from the site centers using CAP88-PC. For releasesof radionuclides to air, CAP88-PC evaluates the four principal exposure pathways:ingestion through food and water consumption, inhalation, air immersion, andirradiation by contaminated ground surface.
The collective EDE caused by 1999 Livermore site operations was 0.017 person-Sv(1.7 person-rem), which is 2.5 times the 1998 result of 0.068 person-Sv (0.68 person-rem), principally traceable to the nearly twice as large emissions from the TritiumFacility stacks in 1999 compared to 1998. This population dose, when calculated asdirected by EPA, was 0.022 person-Sv (2.2 person-rem), which is about 2.5 times thecorresponding result from last year and 1.3 times the dose obtained when neglectingconversion of HT to HTO. The collective EDE from Site 300 operations in 1999 was0.11 person-Sv (11 person-rem), which is the same as the previous year’s value.These levels of variation in population dose from one year to the next are within theexpected range of operations-driven fluctuations in small radiation quantities.
Table 13-5 compares background and medical-treatment-related doses to the maximumpotential doses caused by LLNL operations. The population doses attributed to LLNLoperations are some 200,000 times smaller than ones from natural background radiation,and the maximum potential individual doses to maximally exposed public individualsfrom Livermore site and Site 300 operations are about 2500 times smaller.
Summary and Conclusion
The annual radiological dose from all emissions at the Livermore site and Site 300 in1999 was found to be well below the applicable standards for radiation protection ofthe public, in particular the NESHAPs standard. This standard limits to 100 µSv/y(10 mrem/y) the EDE to any member of the public, arising as a result of releases ofradionuclides to air from DOE facilities. Using EPA-mandated computer models, actual

13 Radiological Dose Assessment
13-24 LLNL Environmental Report for 1999
LLNL meteorology, and population distributions appropriate to the two sites, the doseto the LLNL site-wide maximally exposed members of the public from 1999 operationswere as follows:
• Livermore site: 1.0 µSv (0.10 mrem)—72% from point-source emissions, 28%from diffuse-source emissions, using LLNL’s standard calculational assump-tions. Calculating dose by the method of treating HT as HTO as directed byEPA, the total annual dose to the SW-MEI from Livermore site operations was1.2 µSv (0.12 mrem), divided 77% and 23% between point and diffuse sources.
• Site 300: 0.35 µSv (0.035 mrem)—96.5% from explosive experiments,classified as point-sources, 3.5% from diffuse-source emissions.
Table 13-5. Comparison of background (natural and man-made) and LLNL radiationdoses, 1999.
Individual dose(a) Population dose(b)
Location/source (µSv) (mrem) (person-Sv) (person-rem)
Livermore site sources
Atmospheric emissions 1.0(c) 0.10(c) 0.017(c) 1.7(c)
Site 300 sources
Atmospheric emissions 0.35 0.035 0.11 11
Other sources(d)
Natural radioactivity(e,f)
Cosmic radiation 300 30 1,900 190,000
Terrestrial radiation 300 30 1,900 190,000
Internal (food consumption) 400 40 2,500 250,000
Radon 2,000 200 12,500 1,250,000
Medical radiation (diagnosticprocedures)(f)
530 53 3,300 330,000
Weapons test fallout (f) 11 1.1 68 6,800
Nuclear fuel cycle 4 0.4 25 2,500
a For LLNL sources, this dose represents that experienced by the SW-MEI member of the public.
b The population dose is the collective (combined) dose for all individuals residing within an 80-km radius of LLNL(approximately 6.3 million people for the Livermore site and 5.4 million for Site 300), calculated with respect todistance and direction from each site.
c Calculating dose by the alternative method as directed by EPA, the individual dose was increased to 1.2 µSv(0.12 mrem), and the population dose to 0.022 person-Sv (2.2 person-rem) for the Livermore site; see the Dosesto Site-Wide Maximally Exposed Individuals, and Collective Doses to Exposed Populations sections.
d From National Council on Radiation Protection and Measurements (1987a and b).
e These values vary with location.
f This dose is an average over the U.S. population.

Radiological Dose Assessment 13
LLNL Environmental Report for 1999 13-25
The major radionuclides accounting for the doses were tritium at the Livermore site andthe three isotopes in depleted uranium (234U, 235U, and 238U) at Site 300.
The collective EDE or population dose attributable to LLNL operations in 1999 was esti-mated to be 0.017 person-Sv (1.7 person-rem) for the Livermore site and 0.11 person-Sv(11 person-rem) for Site 300. Calculating dose as directed by EPA, the Livermore site valuewas 0.022 person-Sv (2.2 person-rem). These doses include exposed populations of6.3 million people for the Livermore site and 5.4 million for Site 300 living within adistance of 80 km from the site centers, based on 1990 census data.
The dose to the maximally exposed member of the public resulting from Livermore-site and Site-300 operations was approximately 2500 times smaller than the dose frombackground radiation, and the population dose from LLNL operations in 1999 wasabout 200,000 times smaller than that caused by natural radioactivity in the environment(see Table 13-5 and Figure 13-2 in Supplement 13-1).
We conclude that the potential radiological doses from LLNL operations were well belowregulatory standards and were very small compared with doses normally received bythese populations from natural background radiation sources, even though highlyconservative assumptions were used in the determinations of LLNL doses. Thesemaximum credible doses indicate that LLNL’s use of radionuclides had no significantimpact on public health during 1999.

13 Radiological Dose Assessment
13-26 LLNL Environmental Report for 1999
Chapter 13 Supplements
Supplement 13-1: Radiation Basics
Natural and Man-Made Radiation
By far, the greatest part of radiation received by the world’s population comes fromnatural sources—primarily cosmic rays that impinge on the earth’s atmosphere fromspace and radionuclides naturally present in our environment, such as radioactivematerials in soil and rocks. Among these terrestrial sources are carbon-14, potassium-40,rubidium-87, uranium-238, thorium-232, and other radioactive elements, such as radon,that arise from decay of uranium and thorium. The source of human exposure to naturalradiation can be external (from substances staying outside the body) or internal (fromsubstances inhaled in air or ingested in food and water). Individual doses vary withlocation. The level of cosmic radiation increases with altitude because less air is overheadto act as a shield. The earth’s poles receive more cosmic radiation than the equatorialregions because the earth’s magnetic field diverts the radiation. The levels of terrestrialradiation differ from place to place around the United States and around the world,mainly because of variations in soil and rock composition.
Adding to this pervasive natural or background radiation is man-made radiation fromradionuclides used in medicine, consumer products, energy production, and nuclearweapons production. Exposure to man-made sources can be controlled more readilythan exposure to most natural sources. However, nuclear explosives tested in theatmosphere in the 1950s and 1960s spread radioactivity across the surface of the globe,and the 1986 nuclear reactor accident at Chernobyl affected a large area. At present,medical treatment is the largest common source of public exposure to man-maderadiation. Individual medical doses vary enormously—someone who has never had anx-ray examination may receive zero medical dose while patients undergoing treatmentfor cancer may receive many thousands of times the annual-average dose they wouldreceive from natural radiation. Another source of public exposure to man-maderadiation is consumer products, including luminous-dial watches, smoke detectors,airport x-ray baggage inspection systems, and tobacco products.
Radioactivity
Generally, naturally occurring isotopes are stable, but notable exceptions includecarbon-14, potassium-40, thorium-232, uranium-235, and uranium-238, which occur

Radiological Dose Assessment 13
LLNL Environmental Report for 1999 13-27
naturally but are radioactive. There are three main categories of nuclear decay: alpha,beta, and gamma. Alpha decay is the spontaneous emission of an alpha particle (abound state of two protons and two neutrons—the nucleus of a helium atom) from anucleus containing a large number of protons (most commonly 82 or more). Beta decayis the spontaneous conversion of a neutron to a proton in the nucleus with the emissionof an electron, and gamma decay is the spontaneous emission of high-energy photons(high-frequency electromagnetic radiation) by nuclei.
Radioisotopes decay at quite different rates; the “half-life,” or length of time for half ofthe atoms to decay, spans a wide range from small fractions of a second to millions ofyears. For example, tritium (the radioactive form of hydrogen) has a 12.3-year half-life,compared to 24,131 years for plutonium-239.
Some radioisotopes decay by forming radioisotopes that, in turn, decay into otherradioisotopes until a stable state is achieved. For example, an atom of uranium-238 canundergo alpha decay, leaving behind a daughter, thorium-234, which is also radioactive.The transformations of the decay chain continue, ending with the formation of lead-206,a stable isotope.
Radioactivity can be hazardous because radiation (alpha particles, beta particles, gammarays, and other subatomic particles such as neutrons) can be released with great energy.This energy is capable of altering the electronic configuration of atoms and molecules,especially by stripping one or more electrons off the atoms of the irradiated material,thereby disrupting the chemical activity in living cells. If the disruption is severeenough to overwhelm the normal restorative powers of the cell, the cell may die orbecome permanently damaged. Cells are exposed to many naturally occurring sourcesof disruption, including naturally toxic chemicals in food, microbes that cause disease,high-energy radiation from outer space (cosmic rays), and heat and light (including thesun’s rays, which can cause sunburn and skin cancer). Consequently, cells and livingorganisms have evolved the capacity to survive limited amounts of damage, includingthat caused by radioactivity.
Three main factors determine the radiation-induced damage that might be caused toliving tissue: the number of radioactive nuclei that are present, the rate at which theygive off energy, and the effectiveness of energy transfer to the host medium, i.e., howthe radiation interacts with the tissue. Alpha radiation can be halted by a piece of paperand can scarcely penetrate the dead outer layers of skin. Radioisotopes that give offalpha radiation are generally not health hazards unless they get inside the body throughan open wound or are ingested or inhaled. In those cases, alpha radiation can beespecially damaging because its disruptive energy can be deposited within a small

13 Radiological Dose Assessment
13-28 LLNL Environmental Report for 1999
distance, resulting in significant energy deposition in a few cells. Beta radiation fromnuclear decay typically penetrates a centimeter or two of living tissue. It, therefore,deposits energy over many cells, decreasing the damage to any single cell. Gammaradiation is extremely penetrating and can pass through most materials, being signifi-cantly attenuated only by thick slabs of dense materials, such as lead.
Measurement of Radioactivity and Dose
The rate at which a nucleus decays is expressed in units of becquerels (abbreviated Bq)where 1 Bq is one decay per second, or alternatively expressed in curies, Ci, where 1 Ciequals 3.7 × 10¹⁰ (37 billion) decays per second, or 3.7 × 10¹⁰ Bq (approximately equal tothe decay rate of 1 gram of pure radium). Becquerels and curies are not measures of theeffect of radiation on living tissue; the effect on living tissue depends on the efficiency ofenergy deposition as the radiation traverses matter.
The amount of energy deposited in living tissue is called the “dose.” The amount ofradiation energy absorbed per gram of tissue is called the “absorbed dose” and isexpressed in units of rads or grays (Gy), where 1 Gy equals 100 rads; 1 Gy equals 1 jouleper kilogram. Because an absorbed dose produced by alpha radiation is more damagingto living tissue than the same dose produced by beta or gamma radiation, the absorbeddose is multiplied by a quality factor to give the dose equivalent. The quality factor foralpha radiation is 20; for beta and gamma, 1. The dose equivalent is measured in unitsof rem or sieverts (Sv) with 1 Sv equal to 100 rem. Also commonly used are millirem(mrem) and millisievert (mSv), which are one-thousandth of a rem and sievert,respectively.
Just as one type of radiation can be more damaging than others, some parts of the bodyare potentially more vulnerable to radiation damage than are others; therefore, thedifferent parts of the body are given weightings. For example, a radiation dose fromiodine-131 is more likely to cause cancer in the thyroid than in the lung. The repro-ductive organs are of particular concern because of the potential risk of genetic damage.Once particular organs are weighted appropriately, the dose equivalent becomes the“effective dose equivalent” (EDE), also expressed in rem or sievert. This allows doseequivalents from nonuniform exposure of the body to be expressed in terms of an EDEthat is numerically equal to the dose from uniform exposure of the whole body thatentails the same risk as the nonuniform exposure.
The EDE describes doses to individuals. When individual EDEs received by a group ofpeople are summed, the result is called the “collective effective dose equivalent,” often

Radiological Dose Assessment 13
LLNL Environmental Report for 1999 13-29
referred to as the “population dose,” and is expressed in person-sievert or person-rem.Finally, to account for the long-term effects of radionuclides as they continue to decayand affect generations of people, we calculate the dose over many years, summing theeffect over time. This is termed the “collective effective dose equivalent commitment.”Most of our discussion in this chapter deals with the EDE and the collective EDE.
Doses from Natural and Man-Made Radioactivity
The pie chart in Figure 13-2 illustrates the distribution of annual average radiation dosesfrom natural and other common sources in the United States, according to the NationalCouncil on Radiation Protection and Measurement (1987b). The average radiationdose from natural sources is 3.0 mSv/y (300 mrem/y). Approximately 0.3 mSv/y(30 mrem/y) of this exposure comes from high-energy radiation from outer space(cosmic rays). Terrestrial sources, mainly radionuclides in rock and soil, also account forapproximately 0.3 mSv/y (30 mrem/y) of the average natural dose. Another significantpart of the dose comes from radionuclides ingested through food and drink, resulting inapproximately 0.4 mSv/y (40 mrem/y). Potassium-40 and carbon-14 are commonradionuclides in food.
The remaining 2.0 mSv/y (200 mrem/y) or 67% of the average dose from naturalsources in the United States comes from radon gas. Radon is one of the major radio-nuclides produced by uranium decay, and inhalation dose is dominated by radon’sshort-lived decay products.
As noted earlier, medical treatment is the largest common source of public exposure toman-made radiation, and most of it is delivered as medical x-rays. These contribute0.39 mSv (39 mrem) to the average whole-body annual dose in the United States.Nuclear medicine contributes 0.14 mSv (14 mrem) to the average dose, and consumerproducts add 0.1 mSv (10 mrem). Thus, for a typical member of the public in the UnitedStates, radiation from medical procedures and consumer products results in a dose ofapproximately 0.63 mSv/y (63 mrem/y). The annual average dose from other man-made sources, including fallout from nuclear testing, is less than 0.03 mSv (3 mrem).As described in this chapter, the contributions from LLNL operations to the dose of eventhe most affected resident are on the order of 1 µSv/y (0.1 mrem/y) and would not bediscernible on the scale shown in Figure 13-2; LLNL’s contributions are listed under“Other” in the figure.
Deviations from the average levels shown in Figure 13-2 can be quite large, dependingon an individual’s place of residency, occupation, eating habits, and other lifestyle

13 Radiological Dose Assessment
13-30 LLNL Environmental Report for 1999
choices, such as frequency of air travel. Radon dose, for example, varies significantlywith geographic location; levels several times higher than the average occur in someregions of the United States. At LLNL and its environs, radon-induced doses as low ashalf the average are typical. Doses from cosmic rays increase with elevation above sealevel, producing several tenths of mSv (tens of mrem) differences between cosmic-raydoses in coastal and mountain communities, and imparting a dose of about 0.05 mSv(5 mrem) to a passenger flying round-trip between Los Angeles and New York City.
Nuclear medicine,0.14 mSv
Other:
Consumer products,0.1 mSv
Internal,0.4 mSv
Natural, 3 mSv
Man-made, 0.66 mSv
Medical x-ray,0.39 mSv
Terrestrial,0.3 mSv
Cosmic, 0.3 mSv
Radon,2 mSv
OccupationFalloutNuclear fuel cycleMiscellaneousLLNL 1999 operations(most exposed public individual) Livermore site Site 300
0.01 mSv0.011 mSv0.004 mSv0.004 mSv
0.0010 mSv0.00035 mSv
0.03 mSv
Figure 13-2. Typical annual radiation doses from natural and man-made sources(National Council on Radiation Protection 1987b).
A useful Internet reference with links to a large quantity of material on effects and risksfrom radiation is the “Radiation Information Network” at the following Internet address:http://www.physics.isu.edu/radinf/

Radiological Dose Assessment 13
LLNL Environmental Report for 1999 13-31
Supplement 13-2: Radiation Control Measures at LLNL
Radioisotopes used at LLNL include uranium, transuranics, biomedical tracers, tritium,and mixed-fission products. Protection of employees and the public from the uncon-trolled release of radioactive materials into the environment is a primary considerationfor LLNL. This effort takes several forms, as summarized here. More detailed infor-mation can be found in LLNL’s online ES&H Manual; see, for example, Volume I,Chapters 1 and 2 at the following Internet addresses:http://www.llnl.gov/es_and_h/hsm/chapter_1/chap1.html http://www.llnl.gov/es_and_h/hsm/chapter_2/chap2.html
When an operation or facility is designed at LLNL, a thorough assessment of potentialradiation hazards is conducted, and radioisotope-handling procedures and workenclosures are determined for each project, depending on the isotope, the quantity beingused, and the type of operations being performed. Radioisotope handling and workingenvironments include glove boxes, exhaust hoods, and laboratory bench tops. Thecontrols might include limiting physical access and using shielding, filters, and remotehandling equipment. Exhaust paths to the atmosphere include HEPA-filtered stacks,stacks without abatement devices, roof vents, and ordinary room air ventilation channels.
Appropriate monitoring, control, training, emergency response, and other requirementsare called out in various facility documents related to each operation. These mayinclude a Discipline Action Plan (DAP), Integration Work Sheet (IWS), Safety AnalysisReport (SAR), Operational Safety Plan (OSP), and/or Facility Safety Plan (FSP), and willinclude a document reviewing the operation under the NEPA compliance guidelines.These documents are reviewed by environmental analysts, industrial hygienists, andhealth physicists to assess the safety of the operation, its compliance with currentoccupational and public health and environmental standards, the adequacy of proposedengineering and administrative controls, and the adequacy of proposed trainingrequirements for personnel. This part of the control program enables LLNL personnelwho work with radiation and radioactivity to recognize and prevent the execution ofunsafe operations.
Another form of LLNL’s radiation control program involves direct monitoring of theworkplace environment. This monitoring includes sampling of the air and surfaces inthe facilities where radioactive materials are handled, as well as the use of personaldosimetry and bioassay programs to monitor potential worker exposure to directradiation and radioactive isotopes. Direct monitoring of the workplace environmenthelps to determine the effectiveness of a facility’s radiation control program as well asproviding information on worker exposures.
13 Radiological Dose Assessment
13-32 LLNL Environmental Report for 1999
The surveillance and effluent monitoring of radiation in air, ground and surface waters,sewerable water, soil and sediment, and vegetation and foodstuff, as discussed inChapters 2 and 4 through 11 of this report, play an important role in LLNL’s program tocontrol radiation releases. These measurements can signal anomalous releases, shouldthey occur, and they directly gauge the degree of success of LLNL’s radionuclidedischarge control program in limiting exposures of the public. LLNL implemented aquality assurance/quality control (QA/QC) process to ensure the accuracy, precision,and reliability of these monitoring data (see Chapter 14, Quality Assurance, and theQuality Control for 1999 Radiological Accounting Update and Modeling section, in theLLNL NESHAPs 1999 Annual Report [Gallegos et al. 2000]).
In addition to routine QA/QC measures carried out each year, LLNL's AssuranceReview Office (ARO) conducted a special self-assessment, during February throughMay in 1999, focused on LLNL's radiological releases to air. The ARO assessmentaddressed the adequacy of effluent monitoring, ambient air sampling, computermodeling, quality assurance, laboratory sample analyses, data reliability, and reporting.All of the five potential noncompliance conditions or practices identified in the AROassessment have been addressed.
Development of the Livermore Valley and the San Joaquin Valley has enlarged thepopulations and decreased the distance between sources of emissions and the residentswho might be exposed. People live and work within several hundred meters of LLNL’sboundaries. It is, therefore, increasingly important that the Laboratory’s assessmentsprovide the best information possible regarding the radiological impact of its operations.

14
LLNL Environmental Report for 1999 14-1
Quality Assurance
Lucinda M. GarciaDonald H. MacQueen
Introduction
Quality assurance (QA) is a system of activities and processes that are put in place toensure that monitoring and measurement data meet user requirements and needs.Quality control (QC) consists of procedures that are used to verify that prescribedstandards of performance in the monitoring and measurement process are met. U.S.Department of Energy (DOE) orders and guidance mandate QA requirements forenvironmental monitoring of DOE facilities. DOE Order 5400.1 identifies QA require-ments for radiological effluent and surveillance monitoring and specifies that a QAprogram consistent with the DOE order addressing quality assurance is established.This order sets forth policy, requirements, and responsibilities for the establishment andmaintenance of plans and actions that assure quality in DOE programs.
Lawrence Livermore National Laboratory conducted QA activities in 1999 at theLivermore site and Site 300 in accordance with the Environmental Protection DepartmentQuality Assurance Management Plan (Revision 3), based on DOE Order 5700.6C, whichprescribes a risk-based, graded approach to QA. This process promotes the selectiveapplication of QA and management controls based on the risk associated with eachactivity in order to maximize effectiveness and efficiency in resource use.
The DOE Environmental Regulatory Guide for Radiological Effluent Monitoring andEnvironmental Surveillance (U.S. Department of Energy 1991) requires that an environ-mental monitoring plan be prepared. LLNL environmental monitoring is conductedaccording to procedures published in Appendix B of the LLNL Environmental MonitoringPlan (Tate et al. 1999). LLNL or commercial laboratories analyze environmentalmonitoring samples using U.S. Environmental Protection Agency (EPA) standardmethods, when available. When EPA standard methods are not available, customanalytical procedures, usually developed at LLNL, are used. The radiochemicalmethods used by LLNL laboratories are described in procedures unique to thelaboratory performing the analyses. LLNL uses only State-of-California-certifiedlaboratories to analyze its environmental monitoring samples. In addition, LLNLrequires all analytical laboratories to maintain adequate QA programs and documen-tation of methods.
14 Quality Assurance
14-2 LLNL Environmental Report for 1999
Quality Assurance Activities
Nonconformance reporting and tracking is an LLNL QA process for ensuring thatEnvironmental Protection Department (EPD) activities meet the department’s QArequirements and that problems are found, identified, resolved, and prevented fromrecurring. LLNL generated 111 Nonconformance Reports (NCRs) related to environ-mental monitoring in 1999 compared to 92 in 1998 and 87 in 1997.
Fifty-nine of the 111 NCRs generated in 1999 were due to problems with analyticallaboratories. Twenty-one were related to minor problems with sewer monitoringequipment, and another 13 were due to minor problems with air-monitoring equipment.Errors in documentation, training, or procedures accounted for another 12 NCRs; theremaining six were related to other monitoring networks.
LLNL addresses analytical laboratory problems with the appropriate laboratory asthey arise. Many of the NCRs that were written in response to problems with thelaboratories concerned minor documentation or paperwork errors, which werecorrected soon after they were identified. Other problems—such as missed holdingtimes, late analytical results, and typographical errors on data reports—accountedfor the remaining NCRs related to the analytical laboratories. The majority of theseproblems were corrected by reanalysis, resampling, reissued reports, or correctedpaperwork, and associated sample results were not affected.
LLNL addresses internal documentation, training, and procedural errors by conductingformal and informal training. These errors generally do not result in lost samples butmay require extra work on the part of sampling and data management personnel toresolve or compensate for the errors.
Analytical Laboratories
LLNL entered into new Blanket Service Agreements (BSAs) with seven analyticallaboratories in March 1999; of these seven, four are continuing service, and three areserving the Laboratory for the first time. LLNL is working closely with its analyticallaboratories to minimize the occurrence of problems in the future.

Quality Assurance 14
LLNL Environmental Report for 1999 14-3
Participation in Laboratory Intercomparison Studies
The LLNL Chemistry and Materials Science Environmental Services (CES) Environ-mental Monitoring Radiation Laboratory (EMRL) and the Hazards Control Depart-ment’s Analytical Laboratory (HCAL) participated in the DOE EnvironmentalMonitoring Laboratory (EML) intercomparison studies program. A review of theEML studies indicates that 55 of 58 results reported by CES and 10 of 10 resultsreported by HCAL fell within the established acceptance control limits.
CES EMRL participated in two DOE Mixed Analyte Performance Evaluation Program(MAPEP) studies in 1999. Sixteen of 16 analytes reported by CES for the first study and23 of 23 analytes reported by CES for the second study fell within acceptable limits.
CES has implemented changes that are intended to address the root causes ofunacceptable intercomparison study results and prevent future results from fallingoutside the acceptance control limits.
Details of the intercomparison study results, including the follow-up explanation andresponse for data that fell outside the acceptance control limits, are presented in theData Supplement. Although contract laboratories are also required to participate inlaboratory intercomparison programs, permission to publish their results forcomparison purposes was not granted for 1999.
LLNL uses the results of intercomparison program data to identify and monitor trendsin performance and to solicit corrective action responses for unacceptable results. Ifa laboratory has unacceptable performance for a particular test in two consecutiveperformance evaluation studies, LLNL may choose to select another laboratory toperform the affected analyses until the original laboratory can demonstrate that theproblem has been corrected. Continued unacceptable performance or failure to prepareand implement acceptable corrective action responses could result in formal notificationof unsatisfactory performance by the LLNL Procurement Department (for off-sitecontract laboratories). If the problem still cannot be corrected, the BSA with the contractlaboratory could be terminated or use of the on-site laboratory could be suspended.
A joint performance evaluation committee composed of members from EPD, CES, andLawrence Berkeley National Laboratory is creating a systematic process for evaluatinglaboratory performance using performance evaluation samples. A method for evalu-ating the results of intercomparison studies will be developed by that committee.

14 Quality Assurance
14-4 LLNL Environmental Report for 1999
Duplicate Analyses
Duplicate or collocated samples are distinct samples of the same matrix collected asclosely to the same point in space and time as possible and are intended to be identicalin all respects. Collocated samples processed and analyzed by the same organizationprovide intralaboratory information about the precision of the entire measurementsystem, including sample acquisition, homogeneity, handling, shipping, storage,preparation, and analysis. Collocated samples processed and analyzed by differentorganizations provide interlaboratory information about the precision of the entiremeasurement system (U.S. Environmental Protection Agency 1987). Collocated samplesmay also be used to identify errors—for example, mislabeled samples or data entryerrors.
Tables 14-1 through 14-3 present statistical data for collocated sample pairs, groupedby sample matrix and analyte. Samples from both the Livermore site and Site 300 areincluded. Tables 14-1 and 14-2 are based on data pairs in which both values aredetections (see Statistical Methods in this chapter). Table 14-3 is based on data pairs inwhich either or both values are nondetections.
Precision is measured by the percent relative standard deviation (%RSD); see the EPA’sData Quality Objectives for Remedial Response Activities: Development Process, Section 4.6(1987). Acceptable values for %RSD vary greatly with matrix, analyte, and analyticalmethod; however, lower values represent better precision. The results for %RSD givenin Table 14-1 are the 75th percentile of the individual precision values.
Regression analysis consists of fitting a straight line to the collocated sample pairs.Good agreement is indicated when the data lie close to a line with slope equal to 1 andintercept equal to 0, as illustrated in Figure 14-1. Allowing for normal analyticalvariation, the slope of the fitted line should be between 0.7 and 1.3, and the absolutevalue of the intercept should be less than the detection limit. The coefficient of deter-mination (r2) should be greater than 0.8. These criteria apply to pairs in which bothresults are above the detection limit.
When there were more than eight data pairs with both results in each pair considereddetections, precision and regression analyses were performed; those results arepresented in Table 14-1. When there were eight or fewer data pairs with both resultsabove the detection limit, the ratios of the individual duplicate sample pairs wereaveraged; the average, minimum, and maximum ratios for selected analytes are givenin Table 14-2. The mean ratio should be between 0.7 and 1.3.

Quality Assurance 14
LLNL Environmental Report for 1999 14-5
Table 14-1. Quality assurance duplicate sampling. Summary statistics for analytes with more thaneight pairs in which both results were above the detection limit.
Medium Analyte N(a) % RSD (b) Slope r2
(c) Intercept
Air Gross alpha 24 24.1 1.03 0.88 4.75 × 10⁻⁶ (Bq/m3)
Gross beta 73 13.5 0.878 0.97 4.94 × 10⁻⁵ (Bq/m3)
Beryllium(d) 15 22.6 0.935 0.60 –0.73 (pg/m3)
Uranium-234+233 12 3.57 0.958 0.91 6.34 × 10⁻¹⁰ (µg/m3)
Uranium-235 by mass 12 3.05 0.789 0.94 5.3 × 10⁻⁷ (µg/m3)
Uranium-238 by mass 12 3.2 0.792 0.97 7.43 × 10⁻⁵ (µg/m3)
Tritium(e) 25 16.5 0.675 0.93 0.0593 (Bq/m3)
Ground water Gross alpha 12 19.2 0.867 0.81 0.0178 (Bq/L)
Gross beta 21 12.4 0.744 0.76 0.0459 (Bq/L)
pH 9 0.262 1.01 0.99 –0.0686 (units)
Arsenic 20 7.01 0.959 0.99 5.36 × 10⁻⁴ (mg/L)
Barium 15 3.78 0.991 1.00 –4.86 × 10⁻⁴ (mg/L)
Chromium 9 6.73 1.01 1.00 3.1 × 10⁻⁶ (mg/L)
Copper(d) 9 30 0.630 0.32 0.00835 (mg/L)
Nitrate (as NO3)(d) 18 18.2 0.848 0.71 12.3 (mg/L)
Potassium 31 3.82 0.961 0.99 0.221 (mg/L)
Trichloroethene 12 4.71 0.935 1.00 0.0624 (µg/L)
Tritium 14 17.5 0.960 1.00 6.31 (Bq/L)
Uranium-234+233 24 7.92 0.917 0.98 0.00231 (Bq/L)
Uranium-235+236(d) 22 25.3 0.552 0.66 0.00369 (Bq/L)
Uranium-238 22 8.87 0.906 0.99 0.00348 (Bq/L)
Vanadium 9 1.21 0.99 0.99 9.60 × 10⁻⁴ (mg/L)
Runoff (from rain) Bicarbonate alkalinity (as CaCO3) 11 18.4 1.04 0.99 –2.98 (mg/L)
Electrical conductivity 10 11.4 1.07 1.00 –41.3 (µmho/cm)
pH 10 1.61 0.98 0.88 0.0665 (units)
Aluminum(e) 14 36.6 1.40 0.53 0.554 (mg/L)
Chloride 12 7.44 1.05 1.00 1.79 (mg/L)
Copper 9 14.4 1.06 0.90 3.27 × 10⁻⁴ (mg/L)
Fluoride 12 12.4 1.04 0.99 –0.0116 (mg/L)
Iron(e) 16 23.4 1.26 0.49 0.73 (mg/L)
Manganese(d) 12 25.4 1.15 0.61 0.0232 (mg/L)
Orthophosphate 11 19.1 0.831 0.96 0.0296 (mg/L)
Sulfate 12 7.27 1.03 1.00 0.019 (mg/L)
Zinc(d) 12 31.3 0.432 0.26 0.0402 (mg/L)

14 Quality Assurance
14-6 LLNL Environmental Report for 1999
Table 14-1. Quality assurance duplicate sampling. Summary statistics for analytes with more thaneight pairs in which both results were above the detection limit (concluded).
Medium Analyte N(a) % RSD(b) Slope r2 (c) Intercept
Sewer Gross alpha(d) 16 29.4 0.854 0.68 4.93 × 10⁻⁵ (Bq/mL)
Gross beta 52 10.8 0.992 0.97 4.34 × 10⁻⁵ (Bq/mL)
Aluminum(d) 11 27.6 0.89 0.41 0.136 (mg/L)
Copper(d) 12 34.5 0.884 0.39 0.0142 (mg/L)
Iron(d) 12 31.3 1.17 0.58 –0.267 (mg/L)
Lead 11 44.7 1.14 0.91 –0.00184 (mg/L)
Zinc(e) 12 17.4 1.02 0.70 –0.032 (mg/L)
a Number of duplicate pairs included in regression analysis.b
75th percentile of percent relative standard deviation (%RSD) where %RSDconcentrations of each routine-duplicate pair.
=
2002
1 2
1 2
−+
x x
x x and x1 and x2 are the reported
cCoefficient of determination.
d Outside acceptable range of slope or r2 because of variability.
e Outside acceptable range of slope or r2 because of outliers.
When one of the results in a pair is a nondetection, then the other result should be lessthan two times the detection limit. Table 14-3 identifies the sample media and analytesfor which at least one pair failed this criterion. Analytes with fewer than four pairs areomitted from the table.
Collocated sample comparisons are more variable when the members of the pair areanalyzed by different methods or with different criteria for analytical precision. Forexample, radiological analyses using different counting times or different laboratoryaliquot sizes will have different amounts of variability.
These analyses show generally good agreement between routine samples and QAduplicates: 90% of the pairs have a precision better than 27%. Data sets not meeting ourprecision criteria fall into one of two categories. The first category, outliers, can occurbecause of data transcription errors, measurement errors, or real but anomalous results.Of 41 data sets reported in Table 14-1, four did not meet the criterion for acceptabilitybecause of outliers. Figure 14-2 illustrates a set of collocated pairs with one outlier.

Quality Assurance 14
LLNL Environmental Report for 1999 14-7
Table 14-2. Quality assurance duplicate sampling. Summary statistics for selectedanalytes with eight or fewer pairs in which both results were above thedetection limit.
Medium Analyte N Meanratio
Minimumratio
Maximumratio
Air Plutonium-239+240 2 1.1 1 1.2
Aqueous Gross alpha 1 0.64 0.64 0.64
Gross beta 2 0.75 0.67 0.84
Uranium-234+233 1 1.3 1.3 1.3
Uranium-238 1 1.2 1.2 1.2
Ground water Radium-226 4 1.1 0.74 1.5
Radium-228 1 1.1 1.1 1.1
Rain Tritium 2 1.00 1 1.1
Runoff (from rain) Gross alpha 1 0.41 0.41 0.41
Gross beta 5 1.8 0.91 3.3
Tritium 2 1.3 0.43 2.2
Uranium-234+233 1 0.99 0.99 0.99
Uranium-235+236 1 1.7 1.7 1.7
Uranium-238 1 0.92 0.92 0.92
Soil Cesium-137 4 0.92 0.84 1
Potassium-40 4 0.97 0.94 1
Plutonium-238 2 1.3 1 1.5
Plutonium-239+240 3 0.89 0.71 0.99
Radium-226 4 1 0.92 1.1
Radium-228 4 0.98 0.94 1
Thorium-228 4 0.96 0.93 1
Uranium-235 4 0.87 0.79 1.1
Uranium-238 2 1.1 0.61 1.5
Sewer Tritium 8 1.1 0.5 1.7
Vegetation Tritium 5 1.1 0.89 1.4

14 Quality Assurance
14-8 LLNL Environmental Report for 1999
Table 14-3. Quality assurance duplicate sampling. Summary statistics for analytes withat least four pairs in which one or both results were below the detectionlimit.
Medium AnalyteNumber of
inconsistentpairs(a)
Numberof
pairs
Percent ofinconsistent
pairs
Air Gross alpha 3 61 4.9
Tritium 2 20 10
Ground water Gross alpha 1 17 5.9
1,2-Dichloroethene (total) 1 20 5
Arsenic 1 8 12
cis-1,2-Dichloroethene 1 23 4.3
Chromium 1 14 7.1
Nickel 1 26 3.8
Nitrate (as NO3) 1 11 9.1
Runoff (from rain) Gross alpha 2 4 50
Carbonate alkalinity (as CaCO3) 1 9 11
Beryllium 1 8 12
Copper 1 7 14
Nitrate (as NO3) 4 6 67
Nitrate (as N) 3 6 50
Sewer Gross alpha 1 36 2.8
Bis(2-ethylhexyl)phthalate 1 4 25
Benzyl alcohol 2 5 40
Chromium 3 9 33
Freon 113 1 7 14
Tritium 1 44 2.3
Mercury 1 5 20
Nickel 1 5 20
a An inconsistent pair is one in which one result is a nondetection and the other result is a detection greater than twotimes the detection limit.

Quality Assurance 14
LLNL Environmental Report for 1999 14-9
0.0 0.05 0.10 0.15 0.20 0.25 0.30 0.35
0.30
0.35
0.25
0.20
0.15
0.10
0.05
0.0
Routine ground water U-234+233 (Bq/L)
Co
lloca
ted
gro
un
d w
ater
U-2
34+2
33 (
Bq
/L)
Figure 14-1. Ground water uranium-234+233 concentrations from collocated samples.These data lie close to a line with slope equal to 1 and intercept equal to 0.
The other results that do not meet the criterion for acceptability consist of data setswhere there is a lot of scatter. This tends to be typical of nondetections and measure-ments at extremely low concentrations, as illustrated in Figure 14-3. Low concentrationsof radionuclides on particulates in air highlight this effect even more because one or tworadionuclide-containing particles on an air filter can significantly affect results. Othercauses of high variability are sampling and analytical methodology. Analyses of totalorganic carbon and total organic halides in water are particularly difficult to control. Ofthe 41 data sets in Table 14-1, 11 show sufficient variability in results to make them falloutside the acceptable range.

14 Quality Assurance
14-10 LLNL Environmental Report for 1999
Statistical Methods
Statistical methods used in this report have been implemented in accordance with theEnvironmental Monitoring Plan (Tate et al. 1999). These methods reduce the largevolumes of monitoring data to summary estimates suitable for temporal and spatialcomparisons. Attention is given to estimating accuracy, bias, and precision of all data.
Radiation Units
Data for 1999 have been reported in Système Internationale (SI) units to conformwith standard scientific practices and federal law. Values in the text are reported inbecquerels (Bq) and millisieverts (mSv); equivalent values in picocuries (pCi) andmillirems (mrem) are given in parentheses.
Sampling Completeness
Planned samples and actual samples collected and analyzed in 1999 are summarizedin Table 14-4.
Data review and analysis are conducted in accordance with the EnvironmentalMonitoring Plan (Tate et al. 1999) and the data analysis procedure developed by EPD’sOperations and Regulatory Affairs Division. These documents contain detailedinformation regarding the acceptability of data and the procedures that are followedfor the identification, notification, and correction of suspect data.
Radiological Data
The precision of radiological analytical results is displayed in the Data Supplementtables as the 2σ counting uncertainty. The counting uncertainties are not used insummary statistic calculations. Any radiological result exhibiting a 2σ countinguncertainty greater than or equal to 100% is considered to be a nondetection. Thereported concentration is derived from the number of sample counts minus the numberof background counts. A sample with a low concentration may, therefore, have anegative value; such results are reported in the tables and used in the calculation ofsummary statistics and statistical comparisons.

Quality Assurance 14
LLNL Environmental Report for 1999 14-11
Some Data Supplement tables provide radioactivity sensitivity values instead of, or inaddition to, a reported value when the radiological result is below the detectioncriterion. Such results are displayed in the tables with a less-than symbol. These values
Routine air tritium (Bq/m3)
Co
lloca
ted
air
tri
tiu
m (
Bq
/m3 )
0.01 0.10 1.00 10.00
0.01
0.10
1.00
10.00
Figure 14-2. Air tritium concentrations from collocated samples showing an outlier.

14 Quality Assurance
14-12 LLNL Environmental Report for 1999
Routine sewer gross alpha (mBq/mL)
Co
lloca
ted
sew
er g
ross
alp
ha
(mB
q/m
L)
0.05 0.10 0.15 0.20 0.25 0.30 0.35 0.40
0.40
0.35
0.30
0.25
0.20
0.15
0.10
0.05
Figure 14-3. Sewer gross alpha concentrations from collocated samples showing a lotof scatter.
can be described as the smallest concentration of radioactive material that can bedetected (distinguished from background) with a large degree of confidence. Theseradioactivity sensitivity values are referred to as minimum detectable concentrations(MDC) in Chapters 4 and 5, limits of sensitivity (LOS) in Chapter 6, and detection limits(DL) in Chapters 7 and 9. The Chemistry and Materials Science Environmental Services(CES) Laboratory calculates these three values (MDC, LOS, and DL) in the same mannerand reports them in the same units as measurements that are considered detections.

Quality Assurance 14
LLNL Environmental Report for 1999 14-13
Table 14-4. Sampling completeness in 1999, Livermore site and Site 300.
Environmental mediumNumber ofanalysesplanned
Number ofanalyses
completed
Completeness(%)
Reason(s) forlost samples
Air particulate (Livermore site)
Radiological parameters 1274 1269 99.6 Access to area denied (1);power failure (2); equipmentproblem (1); sampler error (1)
Beryllium 96 96 100
Air particulate (Site 300)
Radiological parameters 668 655 98 Access to area denied (4);power failure (2); lab error (2);power outage because ofelectrical work in area (5)
Beryllium 72 71 99 Power outage because ofelectrical work in area (1)
Air tritium
Livermore site 494 471 95 Unacceptable flow rate (14);insufficient total flow (1); powerfailure (3); broken flask (1);equipment problems (1); flasknot attached properly (1); noexplanation (2)
Site 300 26 25 96 Flask not attached properly (1)
Soil
Livermore 42 42 100
Site 300 32 32 100
Arroyo sediment (Livermore site only) 36 32 89 Location inundated and couldnot be sampled (4)
Vegetation
Livermore site and vicinity 68 68 100
Site 300 32 32 100
Wine 25 25 100
Rain
Livermore site 90 63 70 Insufficient rainfall (26); samplingbucket stolen (1)
Site 300 7 4 57 Insufficient rainfall during sampleperiod (3)
Storm water runoff
Livermore site 590 578 98 No evidence of flow in area (12)
Site 300 149 119 80 No evidence of flow in area (29);sampler error (1)

14 Quality Assurance
14-14 LLNL Environmental Report for 1999
Table 14-4. Sampling completeness in 1999, Livermore site and Site 300 (concluded).
Environmental mediumNumber ofanalysesplanned
Number ofanalyses
completed
Completeness(%)
Reason(s) forlost samples
Drainage Retention Basin
Field measurements 884 884 100
Samples 115 115 100
Releases 56 56 100
Other surface water (Livermore only) 58 58 100
Ground water
Livermore site 504 494 98 Overlooked; sampled insubsequent quarter (10)
Site 300 2505 2346 94 Well dry or insufficient sample(121), well pump inoperable (28),well inaccessible because ofconstruction (7), sampler error (3)
Livermore Valley wells 27 22 81 Samples not provided (5)
Sewage
B196 912 910 99.8 Sampler error (2)
C196 358 357 99.7 Laboratory results invalid (1)
LWRP(a) effluent 130 128 98.5 LWRP did not supply sample (2)
Digester sludge 80 72 90 LWRP did not supply sample(6); digester offline (2)
WDR-96-248
Surface impoundment wastewater 54 54 100
Surface impoundment ground water 147 147 100
Sewage ponds wastewater 54 53 98 Missed duplicate (1)
Sewage ponds ground water 110 107 97 Missed duplicate (2); missedanalysis (1)
Thermoluminescent dosimeters (TLDs)
Livermore site 156 155 99 TLD missing (1)
Livermore Valley 104 99 95 TLD missing (5)
Site 300 76 75 99 TLD missing (1)
Cooling towers (Site 300 only) 24 18 75 Sampler error (6)
a LWRP = Livermore Water Reclamation Plant.

Quality Assurance 14
LLNL Environmental Report for 1999 14-15
Nonradiological Data
Nonradiological data that are reported as being below the reporting limit also aredisplayed in the tables with a less-than symbol. The reporting limit values are used inthe calculation of summary statistics as explained below.
Statistical Comparisons
Standard comparison techniques (such as regression, t-tests, and analysis of variance)have been used where appropriate to determine the statistical significance of trends ordifferences between means. All such tests of significance have been performed at the0.05 level. When such a comparison is made, it is explicitly stated in the text as being“statistically significant” or “not statistically significant.” Other uses of the word“significant” in the text do not imply that statistical tests have been performed. Instead,these uses relate to the concept of practical significance and are based on professionaljudgment.
Summary Statistics
Determinations of measures of central tendency and associated measures of dispersionare calculated according to the Environmental Monitoring Plan (Tate et al. 1999). Fordata sets that do not contain values below the detection criterion, the measures of centraltendency and dispersion are the median and interquartile range (IQR). The IQR is therange that encompasses the middle 50% of the data set. The IQR is calculated bysubtracting the 25th percentile of the data set from the 75th percentile of the data set.When necessary, the percentiles are interpolated from the data. Software vendors mayuse slightly different formulas for calculating percentiles. Radiological data sets thatinclude values less than zero may have an IQR greater than the median.
For data sets with one or more, but fewer than one-half, of the values below the detec-tion criterion, the measure of central tendency is the median. If the values of thedetection limits and the number of values below the detection limit permit (determinedon a case-by-case basis), dispersion is reported as the IQR. Otherwise, no measure ofdispersion is reported. Statistics are calculated using the reported detection limit valuefor nonradiological data or the reported value for radiological data.
For data sets with one-half or more of the values below the detection criterion, thecentral tendency is reported as less than the median value. Dispersion is not reported.

14 Quality Assurance
14-16 LLNL Environmental Report for 1999
Quality Assurance Process for the Environmental Report
Unlike the preceding discussion, which focused on standards of accuracy and precisionin data acquisition and reporting, a discussion of QA/QC procedures for a technicalpublication per se must deal with how to retain content accuracy through the publica-tion process. Because publication of a large, data-rich document like this site annualenvironmental report involves many operations and many people, the chances ofintroducing errors are great. At the same time, ensuring quality is more difficultbecause a publication is less amenable to the statistical processes used in standardquality assurance methods.
The QA procedure we used concentrated on the tables and figures in the report andenlisted 53 authors, contributors, and technicians to check the accuracy of sectionsother than those they had authored or contributed to. In 1999, the 85 illustrations and68 tables in the main volume and the 121 tables in the Data Supplement were checked.Checkers were assigned illustrations and tables and given a copy of each item theywere to check along with a quality control form to fill out as they checked the item.Items to be checked included figure captions and table titles for clarity and accuracy,data accuracy and completeness, figure labels and table headings, units, significantdigits, and consistency with text. When checking numerical data, checkers randomlyselected 10% of the data and compared it to values in the master database. If all 10%agreed with the database, further checking was considered unnecessary. If there wasdisagreement in the data, the checker compared another 10% of the data with thedatabase values. If more errors were found, the checker had then to verify every pieceof data in the table or illustration.
A coordinator guided the process to ensure that forms were tracked and the properapprovals were obtained. Completed quality control forms and the corrected illustra-tions or tables were returned to the report editors, who were responsible for ensuringthat changes, with the agreement of the original contributor, were made. This QA checkresulted in the correction of data errors and omissions on 9% of the illustrations, 12% ofthe tables in the main volume, and 7% of the tables in the Data Supplement. Othercorrections were made to footnotes, headings, titles in tables, graph axes, callouts, andcaptions in figures.

LLNL Environmental Report for 1999 A-1
Appendix A.Methods of Dose Calculations
S. Ring Peterson
Introduction
Lawrence Livermore National Laboratory calculates doses to the public for radiationprotection purposes using the U.S. Environmental Protection Agency’s (EPA’s) model,CAP88-PC (Parks 1992), and discusses them in detail in Chapter 13 (Radiological DoseAssessment). Emission rates of radionuclides from stacks and diffuse sources are usedas input to CAP88-PC. In addition, doses may be calculated from concentrations in air,vegetation, and water measured during routine monitoring to estimate the potentialimpact of LLNL operations on surrounding populations. A different model thanCAP88-PC is required for these calculations. Because CAP88-PC is expected to over-estimate doses to the public, doses calculated from environmental measurements shouldbe lower, even when assumptions about intake rates are conservative. In Chapters 5, 7,9, and 11, LLNL has calculated doses from inhalation and ingestion of water and locallyproduced foodstuffs based on measured concentrations in the various media and con-servative assumptions about intake rates. In this appendix, LLNL calculates doses usingdifferent models, compares assumptions, and presents the bulk transfer parametersused to calculate the doses in the chapters.
The data on radionuclide concentrations in air, vegetation, water (i.e., potential drinkingwater such as rain water), and wine are necessary inputs to the dose-rate equationsdescribed here. Although other radionuclides are released to the environment in smallquantities by LLNL activities, tritium is the only radionuclide that can be measured inthe local food chain and is responsible for the dose received by the public. Thus,although the equations presented in this chapter can be applied to any radionuclide,only the dose from tritium will be calculated and discussed here. In the followingequations, doses from inhalation and ingestion of vegetables and water or wine arecalculated directly from measured tritium concentrations. Doses from ingesting milkand meat are calculated from measured concentrations in vegetation.

Appendix A. Methods of Dose Calculations
A-2 LLNL Environmental Report for 1999
Dose Calculation Methods
The dose calculation methods given here for the ingestion and inhalation/skinabsorption pathways for tritiated water (HTO) are based on the Nuclear RegulatoryCommission (NRC) Regulatory Guide 1.109, Calculation of Annual Doses to Man fromRoutine Releases of Reactor Effluent (U.S. Nuclear Regulatory Commission 1977). Thedose coefficients used in these calculations were obtained from the committed doseequivalent tables for DOE dose calculations (U.S. Department of Energy 1988) and areconsistent with those specified in ICRP 30, Limits for Intakes of Radionuclides by Workers(International Commission on Radiological Protection [ICRP] 1979). The dose calcu-lation for inhalation of tritiated hydrogen (HT) gas uses a dose-rate conversion factorfrom ICRP 68, Dose Coefficients for Intakes of Radionuclides by Workers (ICRP 1994). Acomparison of dose coefficients is shown in Table A-1.
Table A-1. Comparison of dose coefficients for tritium; units are µSv Bq–1.
DOE CAP88-PC(a) ICRP
HTO (inhalation and skin absorption) 1.5(b) × 1.73 × 10⁻⁵ 3.41 × 10⁻⁵ 1.5(b) × 1.8 × 10⁻⁵
HT (inhalation) 3.31 × 10⁻¹³(c) 1.8 × 10⁻⁹
HTO (ingestion) 1.73 × 10⁻⁵ 2.43 × 10⁻⁵ 1.8 × 10⁻⁵
OBT (d) (ingestion) 4.2 × 10⁻⁵
a Computer code required by the EPA for modeling air emissions of radionuclides.
b 1.5 accounts for dose from HTO absorbed through the skin from air.
c Units are µSv/Bq × s/m–3 because dose is considered external from air submersion.
d Organically bound tritium.
Although the analytical laboratories report concentrations in pCi and the DOE’s dose-rate conversion factors have units of mrem/pCi, LLNL uses Système Internationale (SI)units of becquerel (Bq) for concentration and millisievert (mSv) or microsievert (µSv) fordose in compliance with Presidential Executive Order 12770, Metric Usage in FederalGovernment Programs (July 25, 1991). The conversion factors are as follows:
1 Bq = 27 pCi1 mSv = 100 mrem; 1 µSv = 0.1 mrem
All units have been converted to SI units in the following dose calculations.
The annual whole-body dose rate from ingestion of a particular food or drink isexpressible as a product of three factors: the rate at which the food or drink is consumed(e.g., kg/y), the radionuclide concentration (e.g., Bq/kg) in the food or drink, and thedose rate conversion factor (e.g., µSv/Bq) for the radionuclide. In the following sub-sections, equations of this type are used to estimate the annual dose from tritium

Appendix A. Methods of Dose Calculations
LLNL Environmental Report for 1999 A-3
ingested from water (or wine) and food (e.g., leafy vegetables, produce, milk, and meat).Similar formulas are given for the inhalation/skin absorption dose for HTO andinhalation dose for HT.
Different models recommend different consumption rates. In Appendix E of the NRCRegulatory Guide 1.109, two annual diets are recommended, one for maximum intakeand one for average intake (see Table A-2). Two diets from CAP88-PC are also shownin Table A-2. One diet is recommended for all radionuclides except tritium and 14C.The diet shown for tritium has been estimated from the CAP88-PC assumption thatdaily diet consists of 1638 g of water obtained from food. This assumption accounts fora complete diet with more food than an average person would eat. Values for freshweight, protein, carbohydrate, and fat fractions, used to estimate the total water contentof various foodstuffs, come from Ciba-Geigy (1981). Assumptions about the fractions offruit, grain, root crops, and fruit vegetables that make up “produce” come from NRCRegulatory Guide 1.109.
Table A-2. Examples of annual inhalation and ingestion rates.
NRCmaximum
NRCaverage
CAP88-PCtritium
CAP88-PCother nuclides
Leafy vegetables (kg) 64 23 (est) 28 18
Produce (kg) 520 190 274 176
Milk (L) 310 110 185 112
Meat (kg) 110 95 111 85
Drinking water (L) 730 370 0 0
Inhalation (m3) 8000 8000 8038 8038
It is clear from Table A-2 that the NRC maximum consumption rates are much higherthan the other consumption rates, with the exception of meat. CAP88-PC’s (tritium)estimated rates are high but are still relatively low except for meat, and it is known thattritium doses estimated with CAP88-PC are conservative. LLNL has calculated the dosefrom maximum dietary intake (less produce) since these dose rate formulas were firstused in the site environmental annual report (Silver et al. 1980). The NRC’s maximumdietary intake is still used to estimate doses from water, food (less produce), and wine inChapters 5, 7, 9, and 11 so that estimated doses can be compared year after year. In thisappendix, however, we will use the average NRC intake plus produce concentrations,assuming (conservatively) that concentrations in produce equal concentrations in grassmeasured in LLNL’s environmental monitoring program. This approach should yieldmore realistic doses that are nevertheless conservative. After the following equations,the numbers needed to estimate doses for both sets of assumptions will be presented.

Appendix A. Methods of Dose Calculations
A-4 LLNL Environmental Report for 1999
Annual Dose from Potable Water
The effective dose equivalent for tritium in drinking water (Dwater) in µSv/y iscalculated using the following equation:
Dwater (µSv/y) = Cw × Uw × DCHTO (A-1)
whereCw = concentration of tritium measured in drinking water (Bq/L)Uw = water consumption rate (L/y)
DCHTO = dose coefficient (µSv/Bq) for HTO
The tritium dose from ingestion of potable water, assuming average intake of water, isthen
Dwater (µSv/y) 730 (L/y) × 1.73 × 10⁻⁵ (µSv/Bq) × Cw (Bq/L)
Dwater (µSv/y) 6.4 × 10⁻³ × Cw (Bq/L)
In Chapter 7, we have used this equation to estimate doses from drinking water; thedose is calculated by multiplying the water concentration by 1.24 × 10⁻² (based onannual water intake of 730 L). This equation can also be used to calculate the effectivedose equivalent from wine (see Chapter 11).
Annual Dose from Food Ingestion
The effective dose equivalent from ingestion of food (Dfood) is calculated by summingthe contributions from leafy vegetables, produce, milk, and meat to the diet. Theconcentrations in these foodstuffs are based on measured tritium concentrations inannual grasses (see Chapter 11), and we assume that concentrations in leafy vegetablesand produce are similar. Concentrations in milk and meat are calculated from measuredconcentrations in vegetation using the equations from NRC Regulatory Guide 1.109.
Therefore
Dfood (µSv/y) = Dveg_and_prod + Dmeat + Dmilk (A-2)

Appendix A. Methods of Dose Calculations
LLNL Environmental Report for 1999 A-5
whereDveg_and_prod = µSv/y dose from ingestion of leafy vegetables and produce (for
calculations in Chapter 11, only leafy vegetables are considered)Dmeat = µSv/y dose from ingestion of meatDmilk = µSv/y dose from ingestion of milk
Leafy Vegetation and Produce
For dose calculations, we make the conservative assumption that the leafy vegetationand produce are 100% water; therefore, Bq/L = Bq/kg. Note that the calculations inChapter 11 are only for leafy vegetables.
Dveg_and_prod (µSv/y) = Uveg_ and _prod × Cveg × DCHTO (A-3)
whereUveg_and_prod = intake rate (kg/y) of leafy vegetation and produce
Cveg = concentration measured (Bq/L) in annual grasses and weedsDCHTO = dose coefficient (µSv/Bq) for HTO
The tritium dose from ingestion of leafy vegetables and produce is then
Dveg_and_prod (µSv/y) = [23 (leafy) + 190 (produce) (kg/y)] × 1.73 × 10⁻⁵ (µSv/Bq)× Cveg (Bq/kg)
Dveg_and_prod (µSv/y) = 3.7 × 10⁻³ × Cveg (Bq/L)
For the calculations in Chapter 11, Cveg is multiplied by 1.1 × 10⁻³ (based on 64 kg
annual intake of leafy vegetables).
Note: In this and some of the following equations, the dimensions associated with amultiplicative factor are not shown explicitly; the dimensions of the dependent variableand measured quantity are shown explicitly. For example, the above factor 3.7 × 10⁻³
carries units of (L . µSv) ÷ (y . Bq).

Appendix A. Methods of Dose Calculations
A-6 LLNL Environmental Report for 1999
Meat (Beef)
The dose from ingestion of meat is calculated:
Dmeat (µSv/y) = U meat × Cmeat × D CHTO ( A - 4 )
whereUmeat = intake rate (kg/y)Cmeat = predicted concentration in meat at time of consumption from the
contribution of vegetation (Cmeat_veg) and drinking water(Cmeat_w)
DCHTO = dose coefficient (µSv/Bq) for HTO
and
Cmeat_veg = Ff (d/kg) × Qf (kg/d) × Cveg (Bq/kg) × exp(–λits)
Cmeat_w = Ff (d/kg) × Qw (kg/d) × Cw (Bq/kg) × exp(–λits)
where
Ff = average fraction of an animal’s daily intake of radionuclideappearing in each kilogram of animal flesh [(Bq/kg) in meat per(Bq/d) ingested by the animal] (d/kg): 1.2 × 10⁻² d/kg
Qf = amount of feed consumed (kg/d): 50 kg/dQw = amount of water consumed (kg/d): 50 L/d (1 L = 1 kg)
Cveg = concentration measured in vegetation (Bq/L)Cw = concentration measured in drinking water (Bq/L)
λi = radiological decay constant (d–1): 1.5 × 1 0 – 4 d–1
ts = time from slaughter to consumption (d): 20 d
Therefore
Cmeat_veg = 1 . 2 × 10– 2 ( d/ k g ) × 5 0 ( k g /d ) × Cveg ( Bq / k g)
× exp[(–1.5 × 10–4) × 20]
= 0.6 × Cveg (Bq/L)
Cmeat_w = 1 . 2 × 10– 2 ( d/ k g ) × 5 0 ( L / d) × Cw (Bq/L) × exp[(–1.5 × 1 0 – 4 ) × 20]
= 0.6 × Cw (Bq/L)

Appendix A. Methods of Dose Calculations
LLNL Environmental Report for 1999 A-7
The tritium dose rate from meat consumption is then
Dmeat (µSv/y) = 95 (kg/y) × {[0.6 × Cveg (Bq/kg)] + [0.6 × Cw (Bq/L)]} × 1.73 × 10⁻⁵ (µSv/Bq)
= [9.9 × 10⁻⁴ × Cveg (Bq/L)] + [9.9 × 10⁻⁴ × Cw (Bq/L)]
The dose calculation for meat in Chapter 11 multiplies 1.1 × 10⁻³ times Cveg (based onmeat intake of 110 kg/y). In Chapter 11, only the contribution from vegetation ingestedby the meat animal is calculated.
Cow Milk
The dose from consumption of milk is calculated:
Dmilk (µSv/y) = Umilk × Cmilk × DCHTO (A-5)
where
Umilk = intake rate (L/y)
Cmilk = predicted concentration in milk at time of consumption from thecontribution of vegetation (Cmilk_veg) and drinking water (Cmilk_w)
DCHTO = dose coefficient (µSv/Bq) for HTO
and
Cmilk_veg = Fm (d/L) × Qf (kg/d) × Cveg (Bq/kg) × exp(–λitf)
Cmilk_w = Fm (d/L) × Qwm (L/d) × Cw (Bq/L) × exp(–λitf)
where
Fm = average fraction of an animal’s daily intake of radionuclideappearing in each kilogram of milk [(Bq/L) in milk per (Bq/d)ingested by the animal] (d/L): 1.0 × 10⁻² d/L
Qf = amount of feed consumed by the milk cow (kg/d): 50 kg/dQwm = amount of water consumed by the milk cow (kg/d): 60 L/d
(1 L = 1 kg)Cveg = concentration measured in vegetation (Bq/kg)
Cw = concentration measured in drinking water (Bq/L)λi = radiological decay constant (d–1): 1.5 × 1 0 – 4 d–1

Appendix A. Methods of Dose Calculations
A-8 LLNL Environmental Report for 1999
tf = time from milking to milk consumption (d): 2 d
Therefore
Cmilk_veg = 1.0 × 10⁻² (d/L) × 50 (kg/d) × Cveg (Bq/kg)
× exp[(–1.5 × 10–4) × 2]
= 0.5 × Cveg (Bq/L)
Cmilk_w = 1 . 0 × 10– 2 ( d/ L ) × 6 0 ( L / d) × Cw (Bq/L) × exp[(–1.5 × 1 0 – 4 ) × 2]
= 0.6 × Cw (Bq/L)
The tritium dose rate from directly consumed milk is then
Dmilk (µSv/y) = 110 (L/y) × {[0.5 × Cveg (Bq/kg)] + [0.6 × Cw (Bq/L)]}× 1.73 × 10⁻⁵ (µSv/Bq)
= 9.5 × 10⁻⁴ × Cveg (Bq/L) + 1.1 × 10⁻³ × Cw (Bq/L)
The dose calculation for milk in Chapter 11 multiplies 2.7 × 10⁻³ times Cveg (based onmilk intake of 310 L/y). In Chapter 11 only the contribution from vegetation ingestedby the cow is calculated.
Whole Body
Dfood (µSv/y) = [3.7 × 10⁻³ × Cveg (Bq/L)] (dose from leafy (A-6)vegetables and produce)
+ [9.9 × 10⁻⁴ × Cveg (Bq/L)]+ [9.9 × 10⁻⁴ × Cw (Bq/L)]
} (dose from meat)
+ [9.5 × 10⁻⁴ × Cveg (Bq/L)]
+ [1.1 × 10⁻³ × Cw (Bq/L)] } (dose from milk)

Appendix A. Methods of Dose Calculations
LLNL Environmental Report for 1999 A-9
Summing the above, the total annual dose rate from the food ingestion pathway fortritium (measured tritium in vegetation and drinking water) is then
Dfood (µSv/y) = [5.6 × 10⁻³ × Cveg (Bq/L) + 2.1 × 10⁻³ × Cw (Bq/L)]
In previous years, this equation has had more than double the input from drinkingwater (5.4 × 10⁻³ × Cw) and about 84% of the input from food (4.8 × 10⁻³ × Cveg). InChapter 11, based on maximum food intakes and no intake of water, Cveg is multipliedby 4.8 × 10⁻³.
Inhalation and Skin Absorption Doses
Doses caused by inhalation of radionuclide-contaminated air can be estimated in away analogous to the preceding treatment of ingestion doses. The starting point is toevaluate the radionuclide concentration in air, χ (Bq/m3), at the location of interest.Measurements of tritium in air are found in the chapter on air monitoring (Chapter 5).
The dose from HTO arises from the processes of inhalation and skin absorption. Forinhalation/skin absorption dose, the known concentration of tritium in air is multipliedby the inhalation rate of a human to obtain the number of becquerels of tritium inhaled.Dose coefficients provided by the DOE (U.S. Department of Energy 1988) are used torelate the intake of radioactive material into the body to dose commitment. The dosecoefficient for inhalation is the same as for ingestion. However, to account for skinabsorption, the inhalation factor is multiplied by 1.5. These dose factors provide esti-mates of the 50-year dose from a one-year intake of radioactivity.
The inhalation/skin absorption dose is expressible as
Dinh/sa (µSv/y) = 1.5 × Uair × Cair × DCHTO_inh (A-7)
where
1.5 = the factor that accounts for skin absorption
Uair = air intake rate (m3/y)
Cair = HTO concentration measured in air at the receptor (Bq/m3)
DCHTO_inh = dose coefficient (µSv/Bq) for inhalation

Appendix A. Methods of Dose Calculations
A-10 LLNL Environmental Report for 1999
The whole-body inhalation dose rate from HTO is then
Dinh/sa (µSv/y) = 1.5 × 8000 m3/y × Cair × 1.73 × 10⁻⁵ µSv/Bq
= 0.21 × Cair (Bq/m3)
Doses in Chapter 5 are calculated as shown here. The breathing rate of 8000 m3/y hasbeen corrected from 8400 m3/y used in previous years to conform to NRC 1.109.
In the recent past, HT doses were treated as immersion doses (Eckermann and Ryman1993), because HT has a low-energy β particle and behaves similarly to 41Ar. However,the dose from HT is dominated by the small fraction that is metabolized. HT is thereforetreated as a soluble gas, and an inhalation dose is calculated.
For tritium gas (HT), an inhalation dose is expressible as
Dinh_HT (µSv/y) = Cair_HT × Uair × DCHT (A-8)
where
Cair_HT = concentration of HT in air at location X; estimated by dispersionmodeling (Bq/m3)
Uair = air intake rate (m3/y)
DCHT = effective dose per unit intake (µSv/Bq)
The whole-body inhalation dose rate from HT is then
Dinh_HT (µSv/y) = 8000 m3/y × Cair_HT × 1.8 × 10⁻⁹ µSv/Bq
= 1.4 × 10⁻⁵ × Cair_HT (Bq/m3)
Comparison of Model Predictions
The use of different models and different assumptions will result in very different dosepredictions. Because the protection of the public is paramount, it should be shown bymore than one model and more than one set of assumptions that the dose to the public isacceptably low. In CAP88-PC, doses are based on air concentrations calculated fromdispersion of annual releases to the atmosphere. The transfer of tritium from air concen-tration to dose is based on assumptions within the code that cannot be altered by theuser (e.g., absolute humidity, fractions of vegetables, milk, and meat that are ingested).Of course, as with NRC Regulatory Guide 1.109, the fractions of each food type that are

Appendix A. Methods of Dose Calculations
LLNL Environmental Report for 1999 A-11
contaminated may be selected. In this appendix, equations have been shown thatcalculate dose from measured air (or predicted air, for HT) and plant water concentra-tions using a set of assumptions different from those used in CAP88-PC. The total dosefrom HTO releases from the Livermore site predicted using CAP88-PC is a factor of1.8 times higher than the dose predicted using the equations shown here.
Assumptions about the transfer of tritium through the environment and the amount ofcontaminated food consumed annually can vary considerably among models (seeTables A-2 and A-3). Use of different assumptions can result in estimated doses beingvery different and is the reason for most of the uncertainty associated with dosespredicted by simulation models. Because the health of people is at stake, the models erron the side of overestimating doses. One way to reduce the uncertainty and increase theaccuracy of model predictions is to use environmental monitoring data wheneverpossible. Because of LLNL’s comprehensive monitoring program, reliable concentrationdata for air, vegetation, and water can be used in models to improve dose predictions.
Table A-3. Comparison of hypothetical annual doses from HTO at the Visitor’s Center.
Doses in µSv/yCAP88-PC(a)
(from predicted airconcentrations)
NRC Regulatory Guide 1.109(from observed air
concentrations)
Inhalation 0.14 0.019
Leafy vegetables and produce 0.44 0.063
Milk [0.27] 0.055
Meat 0.16 0.051
Drinking water Not calculated 0.22
Total ingestion dose (food and water) 0.60 [0.87] 0.39
Total dose from HTO 0.74 [1.0] 0.41
a Numbers in brackets (i.e., dose from milk) are not calculated for reported LLNL doses. See LLNL NESHAPs 1998Annual Report (Biermann et al. 1999), Guidance for Radiological Dose Assessment (Harrach 1998), and Chapter 13.
Concentrations of tritium in air (Chapter 5) are monitored at 11 on-site locations,including the Visitor’s Center (VIS), which is a convenient location for comparing dosesfrom different modeling approaches. The measured median air concentration (HTO)at VIS for 1999 was 0.0899 Bq/m3, which is only 18% of the HTO concentrationestimated by CAP88-PC at VIS (0.502 Bq/m3) from all Livermore site releases. Alsomeasured at VIS are vegetation (median value 17 Bq/L) (Table 11-1, Data Supplement)and rainwater (median value 34.6 Bq/L) (Table 7-12, Data Supplement). Measuredconcentrations in vegetation can be used, as shown, to estimate tritium intake fromvegetables by people and from pasture vegetation by animals. A conservativeassumption can be made that rainwater is consumed as drinking water, which will

Appendix A. Methods of Dose Calculations
A-12 LLNL Environmental Report for 1999
result in a much higher estimated dose than could ever be achieved by drinking localtap water. Wine from the Livermore Valley is also measured and, for 1999, had amedian concentration of 1.7 Bq/L (Table 11-2).
The assumptions behind both CAP88-PC and NRC Regulatory Guide 1.109 are con-servative and different from each other. They were chosen so that a predicted dose willbe far in excess of what is likely to be received. In our example, both models assume theperson lives at VIS 100% of the time. For LLNL calculations, CAP88-PC assumes that100% of the vegetables and meat in the diet are grown at the location at which the doseis calculated (i.e., at VIS, in our example). This assumption is highly conservative, ofcourse, and represents the possibility that all vegetables and meat for ingestion can begrown locally. Milk has not been included because there are no milk cows in theLivermore Valley. For our comparison, the NRC Regulatory Guide 1.109 assumes thatessentially the entire diet [leafy vegetables, produce, milk, and meat (beef)] is grownthere. CAP88-PC, being a model for atmospheric releases only, does not calculateconcentrations in water, so the drinking water pathway is ignored in both models forthis comparison. Drinking water is included in Regulatory Guide 1.109, for bothanimals and people (Table A-3).
Doses calculated by CAP88-PC for predicted (0.502 Bq/m3) air concentrations arecompared in Table A-3 with doses calculated using the NRC equations and observed(0.0899 Bq/m3) air concentrations. Differences in results are caused by differentassumptions (Tables A-1 and A-2), different models, and the lower observed airconcentrations compared with predicted air concentrations. Given the relatively highconcentration of tritium in rainwater in 1999, resulting from slightly elevated emissionsfrom the Tritium Facility during January, February, and March, the 1999 dose frompotential drinking water is half the total tritium dose. Rainwater drunk by cows triplesthe ingestion dose from milk or meat over that which would be received if drinkingwater were not contaminated. It would be much more realistic, and yet still conser-vative, to calculate doses from drinking water using the highest observed values ofdrinking and surface waters (Table 7-21, Data Supplement) for animals and people,respectively. If this is done, drinking water would be 0.356 Bq/L from location ORCH,surface water would be 1.2 Bq/L from location SHAD, and the total dose from tritiumwould be reduced from 0.41 µSv/y to 0.12 µSv/y.
All dose estimates for HTO shown in Table A-3 are high because of highly conservativeassumptions. Dose estimates made with NRC Regulatory Guide 1.109 are also highbecause of the unusually high concentration in rainfall that contributes 50% directly to thetotal tritium dose. However, although these doses are high compared with doses thatwould result using less conservative assumptions, they are nevertheless a small fraction

Appendix A. Methods of Dose Calculations
LLNL Environmental Report for 1999 A-13
of the EPA’s radiation dose standard to a member of the public of 100 µSv/y from anatmospheric release. More realistic assumptions would reduce the dose at VIS signifi-cantly. For example, the Visitor’s Center is not a subsistence farm nor does anyone livethere. Realistically, the assumptions used in these calculations can be applied only tosomeone living at a location where the majority of that person’s diet is grown andconsumed.
Tritium Doses Not Calculated by CAP88-PC or NRC Regulatory Guide 1.109
A small contribution to dose arises from air concentrations of tritiated hydrogen (HT)gas. The concentration of HT in air is not measured at VIS, but using release rates fromthe Tritium Facility and the dispersion model in CAP88-PC, we calculate a concentrationof 0.13 Bq/m3. From this an insignificant inhalation dose from HT of 1.9 × 10⁻⁶ µSv/y iscalculated. The measured HTO concentrations in air and vegetation account for thedose from any HT that has been converted to HTO in the environment.
Dose from ingestion of organically bound tritium (OBT) is known to be higher than thatfrom ingestion of an equal amount of tritium in the free water of plants and animals.The higher dose coefficient for OBT reflects this fact (Table A-1). The concentration oftritium in organic matter can be estimated by knowing the dry matter content and waterequivalent factor (the fraction of dry matter that combusts to water; L kg–1) of foodstuffs(Ciba-Geigy Ltd. 1981). Using the assumptions of the NRC model and estimated con-centrations of HTO and OBT in Bq/kg fresh weight, doses for total tritium (HTO andOBT) from vegetables, milk, and meat are 0.072, 0.063, and 0.073 µSv/y, respectively,based on the 17 Bq/L in plant water measured at VIS. By including OBT, the dosesare increased by 15, 15, and 43%, respectively. The greater effect on dose from beef iscaused by the relatively high dry matter content of beef. The overall food ingestion doseis increased from 0.17 to 0.21 µSv/y, but this is still 35% of the potential food ingestiondose (0.60 µSv/y—milk not included) predicted at VIS by CAP88-PC.
Immersion in water is another pathway to dose from tritium because tritium can beabsorbed through the skin. The LLNL pool had a median concentration for 1999 of5 Bq/L (Table 7-21, Data Supplement). The intake of water by skin diffusion is 0.4 mLper minute (Osborne 1968). If it is assumed that a swimmer spends 250 hours a year inthe pool, the resulting dose will be 0.54 nSv.

Appendix A. Methods of Dose Calculations
A-14 LLNL Environmental Report for 1999
Dose Implications
In this appendix, LLNL has compared doses predicted with two models—CAP88-PCand NRC 1.109—and different assumptions for a hypothetical individual living at theVisitor’s Center. Furthermore, doses from inhalation of HT, ingestion of organicallybound tritium, and swimming have been estimated. Based on measurements of HTO inair, vegetation, and waters and on the following assumptions, the dose to a hypotheticalindividual living at the Visitor’s Center is presented on Table A-4.
Table A-4. Individual living at Visitor’s Center.
Assumption Annual dose
Breathes air with the highest tritium concentrations of anyperimeter location except POOL
Inhalation dose: 0.019 µSvHTO + 1.9 × 10⁻⁶ µSv HT = 0.019 µSv
Raises and eats all his own vegetables, milk, and beef(and the animals eat pasture and grain grown for them atthe Visitor’s Center)
Ingestion dose from food, including OBT:0.21 µSv
Drinks rainwater collected in the winter and stored for therest of the year
Drinking water dose, 0.22 µSv
Drinks three bottles of Livermore Valley wine each week Dose from drinking wine, 3.6 × 10⁻³ µSv
Swims in the LLNL pool 250 hours per year Immersion dose, 5.4 × 10⁻⁴ µSv
The total annual dose resulting from these assumptions is 0.45 µSv (compare this toTable A-3), which is 0.45% of the EPA’s radiation dose limit to the member of the publicfrom an atmospheric release. It is 4.5% of an annual effective dose equivalent of 10 µSv,which corresponds to the National Council on Radiation Protection and Measurements’(1987a) concept of Negligible Individual Risk Level. Thus, even though artificially high,this dose is still small.

LLNL Environmental Report for 1999 B-1
Appendix B.Reports for RegulatoryAgencies
Title Agency Frequency
AB2588 Emissions Report Bay Area Air Quality Management District
San Joaquin Valley Unified Air Pollution ControlDistrict
Every 2 years
Air Emission Permit Renewals and EmissionsReport
Bay Area Air Quality Management District
San Joaquin Valley Unified Air Pollution ControlDistrict
Yearly
Recycling Unit Contingency/Business Plans Department of Toxic Substances Control As required
Conditional Exemption Unit Contingency Plans Department of Toxic Substances Control As required
PCB Annual Report Environmental Protection Agency Yearly
Medical Waste Permit Alameda County Emergency Health Services andDepartment of Public Health Services, San JoaquinCounty
As required
Explosive Waste Treatment Facility—Site 300Permit
Department of Toxic Substances Control Every 10 years
Main Site Part A&B Hazardous Waste Permit(includes contingency plans and closure plans)
Department of Toxic Substances Control Every 10 years
Site 300 Container Storage Area (B883) andExplosive Waste Storage Facility Permit
Department of Toxic Substances Control Every 10 years
Cultural Resource Management Plan Department of Energy
California State Historic Preservation Officer
As required
RCRA Section 3016 Report, Inventory of FederalAgency Hazardous Waste Facilities
Department of Energy
Environmental Protection Agency
As required
Less-than-90-Day Waste Accumulation AreaContingency Plans
Department of Toxic Substances Control As required
SB14 Documentation Plan Department of Toxic Substance Control Every 4 years
Ozone Depleting Chemicals Phase Out Report Department of Energy
Environmental Protection Agency
Yearly
DOE Annual Waste Minimization Report Department of Energy Yearly

Appendix B. Reports for Regulatory Agencies
B-2 LLNL Environmental Report for 1999
Title Agency Frequency
Waste Minimization Certification for Site 300 Department of Toxic Substances Control Yearly
Monthly NEPA Report Department of Energy under NEPA Monthly
NEPA Reviews, Proposed LLNL/Department ofEnergy Projects
Department of Energy As required
CEQA Review for Department of Energy/UCContract Renewal
University of California Every 5 yearsbefore contract
renewal
CEQA Reviews, Proposed LLNL/UC Projects University of California As required
Spill Prevention Control and CountermeasuresPlans (Livermore Site and Site 300) Plan
Environmental Protection Agency
San Francisco Bay Regional Water Quality ControlBoard
Central Valley Regional Water Quality ControlBoard
Alameda County Environmental Health Services orDepartment of Public Health Services, San JoaquinCounty
Every 3 yearsor when thereare significant
changes
Closure Plans for any hazardous waste/productunderground storage tanks (UST) removed fromservice
Alameda County Environmental Health Services orDepartment of Public Health Services, San JoaquinCounty
As required
Closure Report for any hazardous waste/productUST removed from service
Alameda County Environmental Health Services orDepartment of Public Health Services, San JoaquinCounty
As required
Monitoring Program and Emergency ResponsePlan for any hazardous waste/ product
Alameda County Environmental Health Services orDepartment of Public Health Services, San JoaquinCounty
As required
Closure Reports for greater than 90-day hazardouswaste aboveground storage tank (AST) operatedunder Interim Status and removed from service
Department of Toxic Substances Control As required
Engineering Assessments for RCRA hazardouswaste tanks
Alameda County Environmental Health Services orDepartment of Public Health Services, San JoaquinCounty
As required
Installation Plans for new hazardous waste/productUST
Alameda County Environmental Health Services orDepartment of Public Health Services, San JoaquinCounty
As required
Hazardous Waste/Product UST Operating Permit Alameda County Environmental Health Services orDepartment of Public Health Services, San JoaquinCounty
Every 3 years;annual fee
Less-than-90-Day Hazardous Waste TankContingency Plans (for Permitted UndergroundTank Systems at Livermore Site)
Department of Toxic Substances Control As required
Tank Monitoring Program for Hazardous WasteAST
Alameda County Environmental Health Services orDepartment of Public Health Services, San JoaquinCounty
Prior to newtank use

Appendix B. Reports for Regulatory Agencies
LLNL Environmental Report for 1999 B-3
Title Agency Frequency
Tank Modification/Approval Plan for hazardouswaste/product UST
Alameda County Environmental Health Services orDepartment of Public Health Services, San JoaquinCounty
As required
Monthly Sewer Monitoring Report Livermore Water Reclamation Plant Monthly
Site 300 Pits 1 and 7 Compliance MonitoringReports
Central Valley Regional Water Quality ControlBoard
Environmental Protection Agency
Department of Toxic Substances Control
Quarterly andyearly
Site 300 Quarterly Cooling Tower DischargeReport
Central Valley Regional Water Quality ControlBoard
Quarterly
Wastewater Point-Source Monitoring Semi-AnnualReport
Livermore Water Reclamation Plant Twice a year
Storm Water Pollution Prevention Plans (LivermoreSite and Site 300)
San Francisco Bay Regional Water Quality ControlBoard
Central Valley Regional Water Quality ControlBoard
As required
Storm Water Pollution Prevention Plans forConstruction (Livermore Site and Site 300)
San Francisco Bay Regional Water Quality ControlBoard
Central Valley Regional Water Quality ControlBoard
As required
Ground Water Protection Management Program Department of Energy Every 3 yearsor as required
Storm Water Monitoring Programs (Livermore Siteand Site 300)
San Francisco Bay Regional Water Quality ControlBoard
Central Valley Regional Water Quality ControlBoard
As required
Industrial Storm Water Discharge Annual Reports(Livermore Site and Site 300) andSite 300 Cooling Tower Annual Report
San Francisco Bay Regional Water Quality ControlBoard
Central Valley Regional Water Quality ControlBoard
Yearly
Storm Water Pollution Prevention AnnualCertifications for Construction Projects(Livermore Site and Site 300)
San Francisco Bay Regional Water Quality ControlBoard
Central Valley Regional Water Quality ControlBoard
Yearly
Quarterly and Annual Compliance Reports forExplosive Process Area Surface Impoundments,Sewage Evaporation and Percolation Ponds, andPercolation Pits
Central Valley Regional Water Quality ControlBoard
Quarterly andyearly
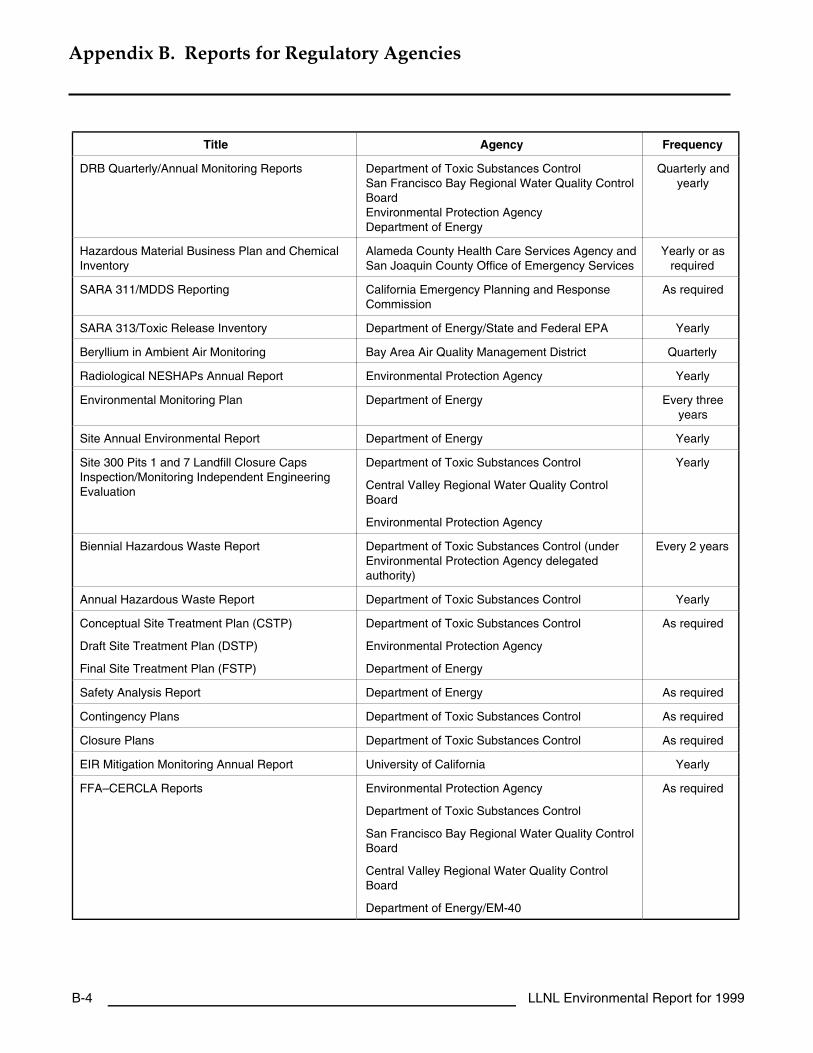
Appendix B. Reports for Regulatory Agencies
B-4 LLNL Environmental Report for 1999
Title Agency Frequency
DRB Quarterly/Annual Monitoring Reports Department of Toxic Substances ControlSan Francisco Bay Regional Water Quality ControlBoardEnvironmental Protection AgencyDepartment of Energy
Quarterly andyearly
Hazardous Material Business Plan and ChemicalInventory
Alameda County Health Care Services Agency andSan Joaquin County Office of Emergency Services
Yearly or asrequired
SARA 311/MDDS Reporting California Emergency Planning and ResponseCommission
As required
SARA 313/Toxic Release Inventory Department of Energy/State and Federal EPA Yearly
Beryllium in Ambient Air Monitoring Bay Area Air Quality Management District Quarterly
Radiological NESHAPs Annual Report Environmental Protection Agency Yearly
Environmental Monitoring Plan Department of Energy Every threeyears
Site Annual Environmental Report Department of Energy Yearly
Site 300 Pits 1 and 7 Landfill Closure CapsInspection/Monitoring Independent EngineeringEvaluation
Department of Toxic Substances Control
Central Valley Regional Water Quality ControlBoard
Environmental Protection Agency
Yearly
Biennial Hazardous Waste Report Department of Toxic Substances Control (underEnvironmental Protection Agency delegatedauthority)
Every 2 years
Annual Hazardous Waste Report Department of Toxic Substances Control Yearly
Conceptual Site Treatment Plan (CSTP)
Draft Site Treatment Plan (DSTP)
Final Site Treatment Plan (FSTP)
Department of Toxic Substances Control
Environmental Protection Agency
Department of Energy
As required
Safety Analysis Report Department of Energy As required
Contingency Plans Department of Toxic Substances Control As required
Closure Plans Department of Toxic Substances Control As required
EIR Mitigation Monitoring Annual Report University of California Yearly
FFA–CERCLA Reports Environmental Protection Agency
Department of Toxic Substances Control
San Francisco Bay Regional Water Quality ControlBoard
Central Valley Regional Water Quality ControlBoard
Department of Energy/EM-40
As required

Appendix B. Reports for Regulatory Agencies
LLNL Environmental Report for 1999 B-5
Title Agency Frequency
Wastewater Discharge/Chemical Storage PermitApplication
Livermore Water Reclamation Plant Yearly
Ground Water Discharges to Sanitary SewerAnnual Self-Monitoring Report
Livermore Water Reclamation Plant Yearly
Above Ground Petroleum Tank Storage Statement State Water Resources Control Board Every 2 years
Arroyo Maintenance Monitoring Report San Francisco Bay Regional Water Quality ControlBoard
Annually whenthere is an
exceedance ofa receivingwater limit
Blue Elderberry Bush Cuttings Report pursuant toBiological Assessment for Fire Trail Grading atSite 300
San Francisco Bay Regional Water Quality ControlBoard
As required ifcutting isneeded
WDR 99-086 for Arroyo Las Positas Maintenance;Provision 20: Maintenance Impact Study Results
San Francisco Bay Regional Water Quality ControlBoard
January 16,2006


LLNL Environmental Report for 1999 C-1
Appendix C.Errata to 1997 and 1998Environmental Reports
Robert J. HarrachKaren S. Rath
Protocol for Handling Errata in LLNL Environmental Reports
The advent of readily accessible, electronic documents on the Internet has made theLLNL site annual environmental report (SAER) a truly dual publication with its bound,hard-copy and its Internet electronic forms. These two versions must be fully equivalentand, in fact, the content must be precisely the same, both in their original versions asfirst presented to the public, and as they are changed (noted as published errata)subsequent to publication.
Revisions to the hard-copy version of LLNL’s SAERs up to now have been dealt with bydistributing copies of errata information (generally consisting of a list of well-definedcorrections) to all identified holders of the original report. Beginning with the presentreport, hard-copy errata notification is provided in the SAER, rather than by separatemailings.
In October 1998, LLNL developed a protocol for making post-publication revisions tothe Internet versions of SAERs. The main criteria are that (1) the SAER home page mustsimply and clearly convey what revisions, if any, have been made to a particular report,and directly link to an errata information section; (2) credibility that the Internet versionaccurately represents each SAER must be maintained; (3) each SAER accessible on theInternet at any time shall be the most current version of the report, incorporating allrevisions; and (4) the content of the electronic and hard copy versions of each SAERmust be the same, in the sense that the hard copy version plus its errata, if any, mustprovide the same information as the current (revised) Internet version.
Presently SAERs covering calendar years 1994 through 1998 can be accessed on theInternet at the address of the LLNL SAER homepage: http://www.llnl.gov/saer . Boththe main volume and data supplement volume of each individual report can be viewedin its fully corrected, most up-to-date form. A link to an errata section provides acomplete record of post-publication changes that have been made.

Appendix C. Errata to 1997 and 1998 Environmental Reports
C-2 LLNL Environmental Report for 1999
Record of Changes to SAERs for 1997 and 1998
The following subsections provide a complete record of changes that have been made asof April 2000 in hard-copy (printed, bound) editions of environmental reports coveringactivities in 1997 and 1998. The information in this section is available on the SAERhome page cited above.
Errata for LLNL Environmental Report 1998
In Chapter 2 of LLNL’s Environmental Report 1998, in Table 2-9 on page 2-27, in the rowdescribing the second off-normal event of February 2, change the quantities “(28 mg/L)”and “(25 mg/L)” to read “(0.28 mg/L)” and “(0.25 mg/L).”
In Chapter 11, in Figure 11-3 on page 11-7, the three data points representing samplinglocation PIN1 (upper right side of the figure) are mis-plotted. The correct values for1996, 1997, and 1998, respectively, are 96 Bq/L (2592 pCi/L), 172 Bq/L (4644 pCi/L),and 37.1 Bq/L (1001 pCi/L).
In Chapter 5 of the Data Supplement at the bottom of the 22Na column in Table 5-4 onpage 5-10, correct the value to be “<6.88 × 10⁻⁹” instead of “<6.88 × 10⁻⁶.”
Errata for LLNL Environmental Report 1997
In the Executive Summary of LLNL's Environmental Report 1997, in the paragraph at thetop of page EX-3, add the term “volatile organics” and replace the word “dioxide” with“monoxide” in the parenthetical phrase occurring in the sixth and seventh lines from thetop of the page. The phrase should read “(nitrogen oxides, sulfur oxides, volatileorganics, particulate matter, carbon monoxide, and lead).”
Raise the order by one of the headings and subheadings in the Geology andHydrogeology sections in Chapter 1, on pages 1-4, 1-8, and 1-9.
In Chapter 3, correct the caption of Table 3-2 on page 3-10 to say “1993 to 1997 “instead of “1990 to 1997.”
Similarly, in Chapter 4 on page 4-8, add the term “volatile organics” to the fourth line upfrom the bottom of the page, so that the parenthetical phrase reads “(nitrogen oxides,sulfur oxides, volatile organics, particulate matter [PM-10], carbon monoxide, andlead).”

Appendix C. Errata to 1997 and 1998 Environmental Reports
LLNL Environmental Report for 1999 C-3
In Chapter 12, on page 12-12, correct the phrase starting with the word “annually” in thesecond line from the top of the page to read “total annual precipitation and annual-average values of the temperature and height of the atmospheric inversion layer.”
On page 12-23 of Chapter 12, in the 11th line from the top of the page, add the omittedprefix “n” so that the quantity reads “190 nCi”.
On page 13-5 of Chapter 13, in footnote b, fifth line up from the bottom of the page,correct the subscripts factor so that it reads x1 – x2.
On page R-11 of the References section, second line up from the bottom of the page,correct the date to say “1992” instead of “1991.”
In Chapter 8 of the Data Supplement on the left-most column of the first row in Table 8-55on page 8-76, Table 8-57 on page 8-77, and Table 8-58 on page 8-78, correct the phrase“Element (mg/L)” to read “Element (µg/L).”


LLNL Environmental Report for 1999 R-1
References
Aarons, J., M. Dresen, L. Berg, F. Hoffman, G. Howard, R. Bainer, E. Folsom, R. Blake, Z. Demir,V. Dibley, K. Folks, B. Heffner, J. Karachewski, M. Maley, W. McConachie, W.W. McNabb,G. Metzger, C. Noyes, T. Pico, M. Ridley and S. Shukla, eds. (2000), LLNL Ground WaterProject 1999 Annual Report, Lawrence Livermore National Laboratory, Livermore, CA(UCRL-AR-126020-99).
Agency for Toxic Substances Disease Registry (2000), Health Consultation, Lawrence LivermoreNational Laboratory, Big Trees Park 1998 Sampling, Livermore, California, Federal FacilitiesAssessment Branch, Division of Health Assessment and Consultation, Agency for ToxicSubstances and Disease Registry (CERCLIS No. CA2890012584).
Althouse, P. E. (1998), Radiological Background Levels Found in Glass Fiber Filters Used for Low-LevelEnvironmental Surveillance Air Sampling, Lawrence Livermore National Laboratory,Livermore, CA (UCRL-JC-131844).
Bainer, R. W., and L. L. Berg, eds. (1998), Action Memorandum for an Emergency RemovalAction at the National Ignition Facility Construction Site, Lawrence Livermore NationalLaboratory, Livermore Site, Lawrence Livermore National Laboratory, Livermore, CA(UCRL-AR-128728).
Bainer, R. W., and H. Joma (1999a), Letter Report: LLNL Livermore Site Third QuarterSelf-Monitoring Report, Lawrence Livermore National Laboratory, Livermore, CA,dated November 30, 1999.
Bainer, R. W., and H. Joma (2000a), Letter Report: LLNL Livermore Site December 3, 1999,Remedial Program Managers’ Meeting Summary, Lawrence Livermore NationalLaboratory, Livermore, CA, dated February 2000.
Bainer, R. W., and H. Joma (2000b), Letter Report: LLNL Livermore Site Fourth Quarter 1999Self-Monitoring Report, Lawrence Livermore National Laboratory, Livermore, CA, datedFebruary 28, 2000.
Bainer, R. W., and J. Littlejohn (1999a), Letter Report: LLNL Livermore Site First QuarterSelf-Monitoring Report, Lawrence Livermore National Laboratory, Livermore, CA,dated May 31, 1999.
Bainer, R. W., and J. Littlejohn (1999b), Letter Report: LLNL Livermore Site Second QuarterSelf-Monitoring Report, Lawrence Livermore National Laboratory, Livermore, CA,dated August 31, 1999.
Berg, L. L. (1999), Draft Explanation of Significant Differences for the Trailer 5475 Ground WaterRemediation, Lawrence Livermore National Laboratory, Livermore Site, Lawrence LivermoreNational Laboratory, Livermore, CA (UCRL-AR-136189 DR).
Berg, L. L., and R. W. Bainer (2000), Draft Action Memorandum for a Time-Critical RemovalAction at the East Traffic Circle, Lawrence Livermore National Laboratory, Livermore Site,Lawrence Livermore National Laboratory, Livermore, CA (UCRL-AR-136832 DR).

References
R-2 LLNL Environmental Report for 1999
Berg, L. L., E. N. Folsom, M. D. Dresen, R. W. Bainer, and A. L. Lamarre, eds. (1997a), Explanationof Significant Differences for Metals Discharge Limits at the Lawrence Livermore NationalLaboratory Livermore Site, Lawrence Livermore National Laboratory, Livermore, CA(UCRL-AR-125927).
Berg, L. L., E. N. Folsom, M. D. Dresen, R. W. Bainer, and A. L. Lamarre, eds. (1997b), Explanationof Significant Differences for Treatment Facilities A and B, Lawrence Livermore NationalLaboratory, Livermore Site, Lawrence Livermore National Laboratory, Livermore, CA(UCRL-AR-125555).
Berg, L. L., M. D. Dresen, R. W. Bainer, E. N. Folsom, and A. L. Lamarre, eds. (1998), RemedialDesign Report No. 4 for the Trailer 5475 Treatment Facilities, Lawrence Livermore NationalLaboratory, Livermore Site, Lawrence Livermore National Laboratory, Livermore, CA(UCRL-AR-126014).
Biermann, A. H., G. M. Gallegos, R. J. Harrach, N. A. Bertoldo, L. C. Hall, R. L. Berger, andK A. Surano (1999), LLNL NESHAPs 1998 Annual Report, Lawrence Livermore NationalLaboratory, Livermore, CA (UCRL-ID-113867-99).
Biermann, A. H., R. J. Harrach, R. L. Berger, and K. A. Surano (1993), LLNL NESHAPs ProjectQuarterly Progress Report, First Quarter 1993, Lawrence Livermore National Laboratory,Livermore, CA (UCRL-AR-108419-93-1).
Blake, R. G., C. M. Noyes, and M. P. Maley (1995), Hydrostratigraphic Analysis—The Key toCos-Effective Ground Water Cleanup at Lawrence Livermore National Laboratory, LawrenceLivermore National Laboratory, Livermore, CA (UCRL-JC-120614).
Brandstetter, E. R. (1998), Livermore Site Annual Storm Water Monitoring Report for WDR 95-174,Lawrence Livermore National Laboratory, Livermore, CA (UCRL-AR-126783-98).
Brandstetter, E. (1999), Livermore Site Annual Storm Water Monitoring Report for Waste DischargeRequirements 95-174, 1998-1999, Lawrence Livermore National Laboratory, Livermore, CA(UCRL-AR-126783-99).
Brown, R., S. Mathews, and R. Ward (1999a), LLNL Experimental Test Site 300 Compliance MonitoringReport for Waste Discharge Requirements 96-248, First Quarter 1999, Lawrence LivermoreNational Laboratory, Livermore, CA (UCRL-AR-125915-99-1).
Brown, R., R. Ward, and S. Mathews (1999b), LLNL Experimental Test Site 300 Compliance MonitoringReport for Waste Discharge Requirements 96-248, Second Quarter 1999, Lawrence LivermoreNational Laboratory, Livermore, CA (UCRL-AR-125915-99-2).
Brown, R., R. Ward, and S. Mathews (1999c), LLNL Experimental Test Site 300 Compliance MonitoringReport for Waste Discharge Requirements 96-248, Third Quarter 1999, Lawrence LivermoreNational Laboratory, Livermore, CA (UCRL-AR-125915-99-3).
Brown, R., S. Mathews, and R. Ward (2000), LLNL Experimental Test Site 300 Compliance MonitoringReport for Waste Discharge Requirements 96-248, Annual/Fourth Quarter Report 1999, LawrenceLivermore National Laboratory, Livermore, CA (UCRL-AR-125915-99-4).
Campbell, B. (1995), Spill Prevention Control and Countermeasure (SPCC) Plan, Livermore Site,Lawrence Livermore National Laboratory, Livermore, CA (UCRL-MA-105699 Rev 1).

References
LLNL Environmental Report for 1999 R-3
Cantwell, B. and J. Celeste (1998), National Ignition Facility Pollution Prevention and WasteMinimization Plan, Lawrence Livermore National Laboratory, Livermore, CA(UCRL-AR-131194).
Cantwell E., K. Gabor, J. Celeste, and S. Cerruti (1998), Design for Environment for theNational Ignition Facility, Lawrence Livermore National Laboratory, Livermore, CA(UCRL-JC-129940).
Carlsen, T. M. (1991a), LLNL Site 300 Environmental Investigations Quarterly, January–March 1991,Lawrence Livermore National Laboratory, Livermore, CA (UCAR-10194-91-1).
Carlsen, T. M. (1991b), LLNL Site 300 Environmental Investigations Quarterly, April–June 1991,Lawrence Livermore National Laboratory, Livermore, CA (UCAR-10194-91-2).
Carlsen, T. M., E. Espeland, and B. Pavlik (1999), Restoration of the Large-flowered Fiddleneck(Amsinckia grandiflora) at Lawrence Livermore National Laboratory Site 300 Project ProgressReport Fiscal Year 1999 October 1998–September 1999, Lawrence Livermore NationalLaboratory, Livermore, CA (UCRL-AR-135516).
Carpenter, D. W., J. J. Sweeney, P. W. Kasameyer, N. R. Burkhard, K. G. Knauss, andR. J. Shelmon (1984), Geology of the Lawrence Livermore National Laboratory Site and AdjacentAreas, Lawrence Livermore National Laboratory, Livermore, CA (UCRL-53316).
Celeste, J. (1997), FY97 Pollution Prevention Plan: A Strategy for the Future, Lawrence LivermoreNational Laboratory, Livermore, CA (UCRL-AR-127073).
Celeste, J., S. Coleman, B. Nisbet, and B. Campbell (1998), A Comprehensive Opportunity Assessmentfor Pollution Prevention at Lawrence Livermore National Laboratory, Lawrence LivermoreNational Laboratory, Livermore, CA (UCRL-AR-127890).
Central Valley Regional Water Quality Control Board (1993), Order No. 93-100, Waste DischargeRequirements for University of California Lawrence Livermore National Laboratory Site 300 andU.S. Department of Energy, Landfill Pits 1 and 7, San Joaquin County (June 25, 1993).
Central Valley Regional Water Quality Control Board (1994), Waste Discharge Requirements forUniversity of California Lawrence Livermore National Laboratory Experimental Test Site andU.S. Department of Energy, Alameda and San Joaquin Counties, Order No. 94-131 (NPDESNo. CA0081396).
Central Valley Regional Water Quality Control Board (1998), Revised Monitoring and ReportingPrograms No. 93-100 and 96-248, Lawrence Livermore National Laboratory Site 300 and U.S.Department of Energy, Landfill Pits 1 and 7, San Joaquin County (June 25, 1993).
Christofferson, E., and D. H. MacQueen (1999a), LLNL Experimental Test Site 300 ComplianceMonitoring Program for RCRA-Closed Landfill Pits 1 and 7, First Quarter Report, January–March1999, Lawrence Livermore National Laboratory, Livermore, CA (UCAR-10191-99-1).
Christofferson, E., and D. H. MacQueen (1999b), LLNL Experimental Test Site 300 ComplianceMonitoring Program for RCRA-Closed Landfill Pits 1 and 7, Second Quarter Report, April–June1999, Lawrence Livermore National Laboratory, Livermore, CA (UCAR-10191-99-2).
Christofferson, E., and D. H. MacQueen (1999c), LLNL Experimental Test Site 300 ComplianceMonitoring Program for RCRA-Closed Landfill Pits 1 and 7, Third Quarter Report, July–September1999, Lawrence Livermore National Laboratory, Livermore, CA (UCAR-10191-99-3).
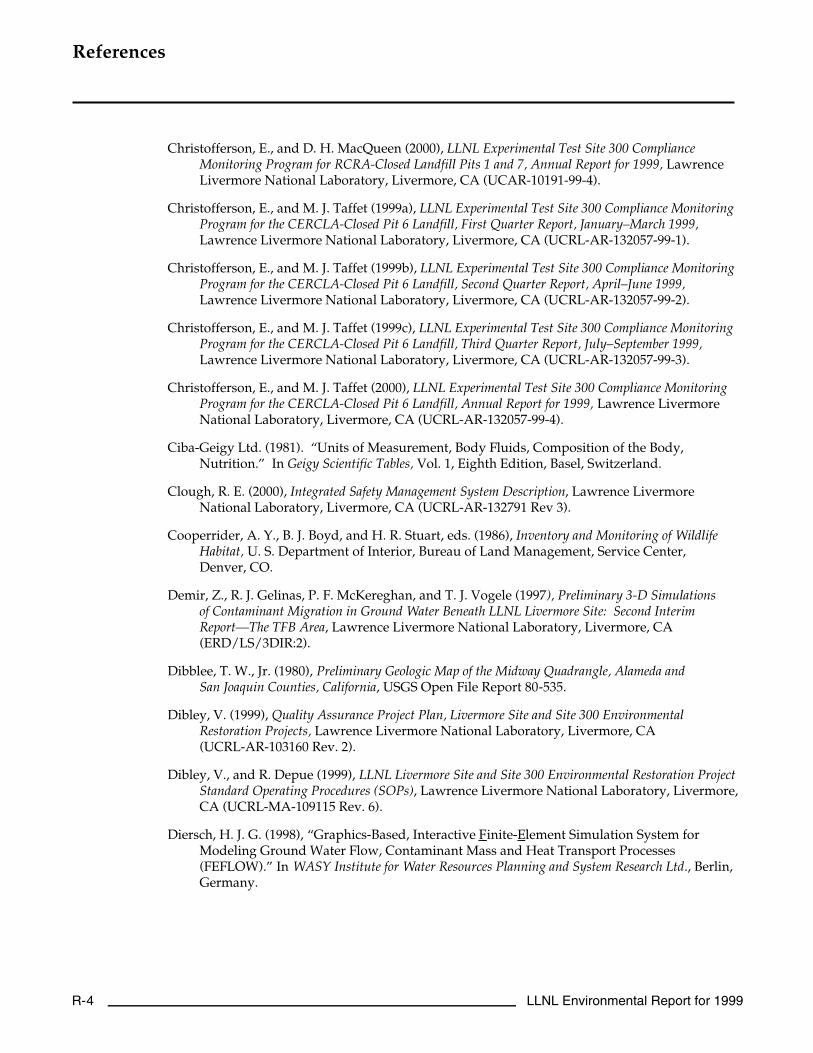
References
R-4 LLNL Environmental Report for 1999
Christofferson, E., and D. H. MacQueen (2000), LLNL Experimental Test Site 300 ComplianceMonitoring Program for RCRA-Closed Landfill Pits 1 and 7, Annual Report for 1999, LawrenceLivermore National Laboratory, Livermore, CA (UCAR-10191-99-4).
Christofferson, E., and M. J. Taffet (1999a), LLNL Experimental Test Site 300 Compliance MonitoringProgram for the CERCLA-Closed Pit 6 Landfill, First Quarter Report, January–March 1999,Lawrence Livermore National Laboratory, Livermore, CA (UCRL-AR-132057-99-1).
Christofferson, E., and M. J. Taffet (1999b), LLNL Experimental Test Site 300 Compliance MonitoringProgram for the CERCLA-Closed Pit 6 Landfill, Second Quarter Report, April–June 1999,Lawrence Livermore National Laboratory, Livermore, CA (UCRL-AR-132057-99-2).
Christofferson, E., and M. J. Taffet (1999c), LLNL Experimental Test Site 300 Compliance MonitoringProgram for the CERCLA-Closed Pit 6 Landfill, Third Quarter Report, July–September 1999,Lawrence Livermore National Laboratory, Livermore, CA (UCRL-AR-132057-99-3).
Christofferson, E., and M. J. Taffet (2000), LLNL Experimental Test Site 300 Compliance MonitoringProgram for the CERCLA-Closed Pit 6 Landfill, Annual Report for 1999, Lawrence LivermoreNational Laboratory, Livermore, CA (UCRL-AR-132057-99-4).
Ciba-Geigy Ltd. (1981). “Units of Measurement, Body Fluids, Composition of the Body,Nutrition.” In Geigy Scientific Tables, Vol. 1, Eighth Edition, Basel, Switzerland.
Clough, R. E. (2000), Integrated Safety Management System Description, Lawrence LivermoreNational Laboratory, Livermore, CA (UCRL-AR-132791 Rev 3).
Cooperrider, A. Y., B. J. Boyd, and H. R. Stuart, eds. (1986), Inventory and Monitoring of WildlifeHabitat, U. S. Department of Interior, Bureau of Land Management, Service Center,Denver, CO.
Demir, Z., R. J. Gelinas, P. F. McKereghan, and T. J. Vogele (1997), Preliminary 3-D Simulationsof Contaminant Migration in Ground Water Beneath LLNL Livermore Site: Second InterimReport—The TFB Area, Lawrence Livermore National Laboratory, Livermore, CA(ERD/LS/3DIR:2).
Dibblee, T. W., Jr. (1980), Preliminary Geologic Map of the Midway Quadrangle, Alameda andSan Joaquin Counties, California, USGS Open File Report 80-535.
Dibley, V. (1999), Quality Assurance Project Plan, Livermore Site and Site 300 EnvironmentalRestoration Projects, Lawrence Livermore National Laboratory, Livermore, CA(UCRL-AR-103160 Rev. 2).
Dibley, V., and R. Depue (1999), LLNL Livermore Site and Site 300 Environmental Restoration ProjectStandard Operating Procedures (SOPs), Lawrence Livermore National Laboratory, Livermore,CA (UCRL-MA-109115 Rev. 6).
Diersch, H. J. G. (1998), “Graphics-Based, Interactive F inite- E lement Simulation System forModeling Ground Water Flow, Contaminant Mass and Heat Transport Processes(FEFLOW).” In WASY Institute for Water Resources Planning and System Research Ltd., Berlin,Germany.

References
LLNL Environmental Report for 1999 R-5
Dresen, M. D., J. P. Ziagos, A. J. Boegel, E. M. Nichols, K. Anderson, R. O. Devany, E. N. Folsom,J. L. Iovenitti, J. K. McDonald, P. F. McKereghan, and C. N. Noyes (1993), Remedial ActionImplementation Plan for the LLNL Livermore Site, Lawrence Livermore National Laboratory,Livermore, CA (UCRL-AR-110532) (page 43 revised September 2, 1993; Table 5 revisedJune 1998).
Dresen, M. D., L. Ferry, R. Ferry, and W. Isherwood (2000), Draft Final Proposed Plan forEnvironmental Cleanup at Lawrence Livermore National Laboratory Site 300, LawrenceLivermore National Laboratory, Livermore, CA (UCRL-AR-136376).
Eadie, G. G. and D. E. Bernhardt (1976), Sampling and Data Reporting Considerations for AirborneParticulate Radioactivity, U.S. Environmental Protection Agency, Office of RadiationPrograms, Las Vegas, Nevada (ORP/LV-76-9).
Eccher, B., K. Folks, R. Goluba, M. Gonzalez, D. Hieb, W. Isherwood, M. Kelly, S. Mathews,V. Mode, B. Schumacher, T. Schmiegel, and S. Thomson (1994a), Storm Water PollutionPrevention Plan (SWPPP) Livermore Site, Lawrence Livermore National Laboratory,Livermore, CA (UCRL-AR-110573-94).
Eccher, B., K. Folks, R. Goluba, M. Gonzalez, D. Hieb, W. Isherwood, M. Kelly, S. Mathews,V. Mode, B. Schumacher, T. Schmiegel, and S. Thomson (1994b), Storm Water PollutionPrevention Plan (SWPPP), Experimental Test Site (Site 300), Lawrence Livermore NationalLaboratory, Livermore, CA (UCRL-AR-110572-94).
Eckerman, K. F., A. B. Wolbarst, and A. C. B. Richardson (1988), Limiting Values of RadionuclideIntake and Air Concentration and Dose Conversion Factors for Inhalation, Submersion, andIngestion, U.S. Environmental Protection Agency, Washington, DC (Federal GuidanceReport No. 11, EPA-520/1-88-020).
Eckerman, K. F., and J. C. Ryman (1993), External Exposure to Radionuclides in Air, Water and Soil,U.S. Environmental Protection Agency, Washington, DC (Federal Guidance Report No. 12,EPA 402-R-93-081).
Environmental Laboratory (1987), U.S. Army Corps of Engineers Wetlands Delineation Manual,U.S. Army Engineer Waterways Experiment Station, Vicksburg, Mississippi (TechnicalReport Y-87-1).
Ferry, L., T. Berry, and D. MacQueen (1998), Post-Closure Plan for the Pit 6 Landfill Operable UnitLawrence Livermore National Laboratory Site 300, Lawrence Livermore National Laboratory,Livermore, CA (UCRL-AR-128638).
Ferry, L., R. Ferry, W. Isherwood, R. Woodward, T. Carlsen, Z. Demir, R. Qadir, and M. Dresen(1999a), Draft Site-Wide Feasibility Study for Lawrence Livermore National Laboratory Site 300,Lawrence Livermore National Laboratory, Livermore, CA (UCRL-AR-132609 DR).
Ferry, L., R. Ferry, W. Isherwood, R. Woodward, T. Carlsen, Z. Demir, R. Qadir, and M. Dresen(1999b), Draft Final Site-Wide Feasibility Study for Lawrence Livermore National LaboratorySite 300, Lawrence Livermore National Laboratory, Livermore, CA (UCRL-AR-132609 DR).
Ferry, L., R. Ferry, W. Isherwood, R. Woodward, T. Carlsen, Z. Demir, R. Qadir, and M. Dresen(1999c), Final Site-Wide Feasibility Study for Lawrence Livermore National Laboratory Site 300,Lawrence Livermore National Laboratory, Livermore, CA (UCRL-AR-132609).

References
R-6 LLNL Environmental Report for 1999
Fisher, D. K., to S. Timm (1993), Letter re: Supplemental Information for the Lawrence LivermoreNational Laboratory (LLNL) Site 300 Cooling Tower NPDES Permit Renewal (WDR OrderNo. 82-105, NPDES No. CA0091396), Lawrence Livermore National Laboratory, Livermore,CA (EMS93-427, November 30, 1993).
Folks, K. (1997), LLNL Report of Waste Discharge for Beneficial Reuse of Soil at the Livermore Site,Lawrence Livermore National Laboratory, Livermore, CA (UCRL-AR-126943).
Folks, K., to K. Gaffney (1999), Letter re: Comments on Early Draft Language Provided onJanuary 22, Lawrence Livermore National Laboratory, Livermore, CA (WGMG99-37,March 16, 1999).
Gallegos, G. M. (1991), Assessment of Sediment Monitoring at LLNL, Lawrence Livermore NationalLaboratory, Livermore, CA (UCRL-ID-121236).
Gallegos, G. M. (1993), “Surveillance Monitoring of Soils for Radioactivity: Lawrence LivermoreNational Laboratory 1976 to 1992,” Health Physics 69(4), 487–493.
Gallegos, G. M. (1998), NESHAPs Annual Report Guidance Document, Lawrence Livermore NationalLaboratory, Operations and Regulatory Affairs Division, Livermore, CA (EMP-NS-S).
Gallegos, G. M., and A. H. Biermann (1997), LLNL NESHAPs 1996 Annual Report, LawrenceLivermore National Laboratory, Livermore, CA (UCRL-ID-113867-97).
Gallegos, G. M., A. H. Biermann, R. J. Harrach, N. A. Bertoldo, L. C. Hall, R. L. Berger, andK. A. Surano (1998), LLNL NESHAPs 1997 Annual Report, Lawrence Livermore NationalLaboratory, Livermore, CA (UCRL-ID-113867-98).
Gallegos, G. M., A. H. Biermann, R. J. Harrach, N. A. Bertoldo, R. L. Berger, and Kris A. Surano(2000), LLNL NESHAPs 1999 Annual Report, Lawrence Livermore National Laboratory,Livermore, CA (UCRL-ID-113867-00).
Gallegos, G. M., B. K. Balke, K. A. Surano, W. G. Hoppes, P. J. Tate, J. C. Steenhoven, B. C. Fields,L. M. Garcia, K. C. Lamson (1992), Environmental Report 1991, Lawrence Livermore NationalLaboratory, Livermore, CA (UCRL-50027-91).
Gallegos, G. M., R. J. Harrach, A. H. Biermann, F. J. Gouveia, P. J. Tate, B. C. Fields, and K. Surano(1996), LLNL NESHAPs 1995 Annual Report, Lawrence Livermore National Laboratory,Livermore, CA (UCRL-ID-113867-96).
Gallegos, G. M., D. MacQueen, K. Surano (1999), Livermore Big Trees Park: 1998 Summary Results,Lawrence Livermore National Laboratory, Livermore, CA (UCRL-ID-134581).
Gallegos, G. M., P. J. Tate, B. K. Balke, E. Christofferson, R. J. Harrach, W. G. Hoppes, R. A. Failor,S. Wander, B. C. Fields, L. M. Garcia, and A. R. Grayson (1994), Environmental Report for1993, Lawrence Livermore National Laboratory, Livermore, CA (UCRL-50027-93).
Galles, H. L., to S. Timm (1997b), Letter re: Statistically Significant Evidence for a Release ofBarium at Pit 7 Under Waste Discharge Requirements (WDR) Order 93-100, LawrenceLivermore National Laboratory, Livermore, CA (WGMG97-249, July 10, 1997).
Galles, H. L., to J. Cho (1997a), Letter re: Lawrence Livermore National Laboratory DrainageRetention Basin Monitoring Plan Amendment (WGMG97-439, December 9, 1997).
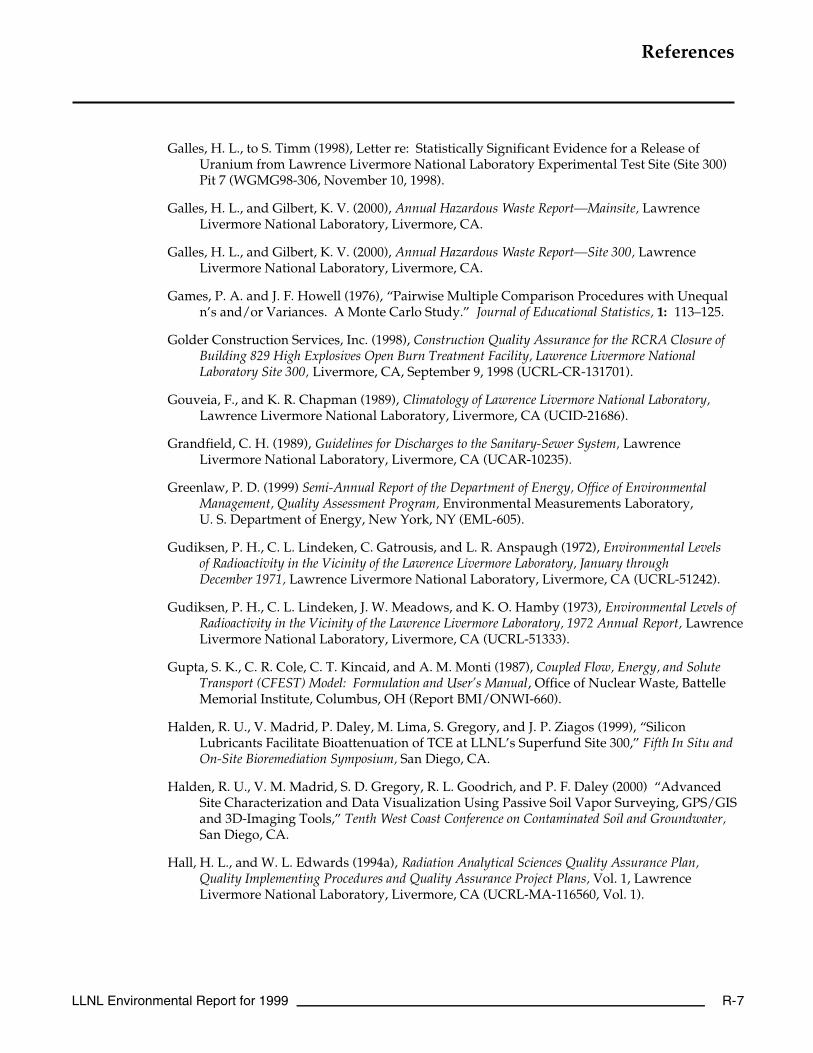
References
LLNL Environmental Report for 1999 R-7
Galles, H. L., to S. Timm (1998), Letter re: Statistically Significant Evidence for a Release ofUranium from Lawrence Livermore National Laboratory Experimental Test Site (Site 300)Pit 7 (WGMG98-306, November 10, 1998).
Galles, H. L., and Gilbert, K. V. (2000), Annual Hazardous Waste Report—Mainsite, LawrenceLivermore National Laboratory, Livermore, CA.
Galles, H. L., and Gilbert, K. V. (2000), Annual Hazardous Waste Report—Site 300, LawrenceLivermore National Laboratory, Livermore, CA.
Games, P. A. and J. F. Howell (1976), “Pairwise Multiple Comparison Procedures with Unequaln’s and/or Variances. A Monte Carlo Study.” Journal of Educational Statistics, 1: 113–125.
Golder Construction Services, Inc. (1998), Construction Quality Assurance for the RCRA Closure ofBuilding 829 High Explosives Open Burn Treatment Facility, Lawrence Livermore NationalLaboratory Site 300, Livermore, CA, September 9, 1998 (UCRL-CR-131701).
Gouveia, F., and K. R. Chapman (1989), Climatology of Lawrence Livermore National Laboratory,Lawrence Livermore National Laboratory, Livermore, CA (UCID-21686).
Grandfield, C. H. (1989), Guidelines for Discharges to the Sanitary-Sewer System, LawrenceLivermore National Laboratory, Livermore, CA (UCAR-10235).
Greenlaw, P. D. (1999) Semi-Annual Report of the Department of Energy, Office of EnvironmentalManagement, Quality Assessment Program, Environmental Measurements Laboratory,U. S. Department of Energy, New York, NY (EML-605).
Gudiksen, P. H., C. L. Lindeken, C. Gatrousis, and L. R. Anspaugh (1972), Environmental Levelsof Radioactivity in the Vicinity of the Lawrence Livermore Laboratory, January throughDecember 1971, Lawrence Livermore National Laboratory, Livermore, CA (UCRL-51242).
Gudiksen, P. H., C. L. Lindeken, J. W. Meadows, and K. O. Hamby (1973), Environmental Levels ofRadioactivity in the Vicinity of the Lawrence Livermore Laboratory, 1972 Annual Report, LawrenceLivermore National Laboratory, Livermore, CA (UCRL-51333).
Gupta, S. K., C. R. Cole, C. T. Kincaid, and A. M. Monti (1987), Coupled Flow, Energy, and SoluteTransport (CFEST) Model: Formulation and User’s Manual, Office of Nuclear Waste, BattelleMemorial Institute, Columbus, OH (Report BMI/ONWI-660).
Halden, R. U., V. Madrid, P. Daley, M. Lima, S. Gregory, and J. P. Ziagos (1999), “SiliconLubricants Facilitate Bioattenuation of TCE at LLNL’s Superfund Site 300,” Fifth In Situ andOn-Site Bioremediation Symposium, San Diego, CA.
Halden, R. U., V. M. Madrid, S. D. Gregory, R. L. Goodrich, and P. F. Daley (2000) “AdvancedSite Characterization and Data Visualization Using Passive Soil Vapor Surveying, GPS/GISand 3D-Imaging Tools,” Tenth West Coast Conference on Contaminated Soil and Groundwater,San Diego, CA.
Hall, H. L., and W. L. Edwards (1994a), Radiation Analytical Sciences Quality Assurance Plan,Quality Implementing Procedures and Quality Assurance Project Plans, Vol. 1, LawrenceLivermore National Laboratory, Livermore, CA (UCRL-MA-116560, Vol. 1).

References
R-8 LLNL Environmental Report for 1999
Hall, H. L., and W. L. Edwards (1994b), Radiation Analytical Sciences Integrated SoftwareDocumentation, Vol 3, Lawrence Livermore National Laboratory, Livermore, CA(UCRL-MA-116560, Vol. 3).
Hall, H. L., and W. L. Edwards (1994c), Radiation Analytical Sciences Technical ImplementingProcedures, Vol. 2A, Lawrence Livermore National Laboratory, Livermore, CA(UCRL-MA-116560, Vols. 2A and 2B).
Harrach, R. J. (1998), Guidance for Radiological Dose Assessment, Operations and Regulatory AffairsDivision, Lawrence Livermore National Laboratory, Livermore, CA (EMP-R-DA).
Harrach, R. J., K. A. Surano, A. H. Biermann, F. J. Gouveia, B. C. Fields, and P. J. Tate, (1994),LLNL NESHAPs 1993 Annual Report, Lawrence Livermore National Laboratory, Livermore,CA (UCRL-ID-113867-94).
Harrach, R. J., G. M. Gallegos, R. A. Failor, E. Christofferson, P. J. Tate, E. R. Brandstetter,J. M. Larson, J. McIntyre, B. C. Fields,, R. A. Brown, L. M. Garcia, and A. R. Grayson (1995),Environmental Report 1994, Lawrence Livermore National Laboratory, Livermore, CA(UCRL-50027-94), http://www.llnl.gov/saer/.
Harrach, R. J., R. A. Failor, G. M. Gallegos, P. J. Tate, E. Christofferson, E. R. Brandstetter,J. M. Larson, A. H. Biermann, R. A. Brown, B. C. Fields, L. M. Garcia, and A. R. Grayson(1996), Environmental Report 1995, Lawrence Livermore National Laboratory, Livermore, CA(UCRL-50027-95), http://www.llnl.gov/saer/.
Harrach, R. J., G. M. Gallegos, P. J. Tate, E. Christofferson, E. R. Brandstetter, J. M. Larson,A. H. Biermann, B. C. Fields, L. M. Garcia, and K. A Surano (1997), Environmental Report1996, Lawrence Livermore National Laboratory, Livermore, CA (UCRL-50027-96),http://www.llnl.gov/saer/.
Harrach, R. J., J. M. Larson, G. M. Gallegos, E. Christofferson, E. R. Brandstetter, P. J. Tate,A. H. Biermann, B. C. Fields, L. M. Garcia, and P. Althouse (1998), Environmental Report1997, Lawrence Livermore National Laboratory, Livermore, CA (UCRL-50027-97),http://www.llnl.gov/saer/.
Heffner, B. (1998), Third Site 300 Environmental Restoration Fact Sheet, Lawrence LivermoreNational Laboratory, Livermore, CA.
Heffner, H.F. (1999), Lawrence Livermore National Laboratory Environmental Community Letter,November 1999, Lawrence Livermore National Laboratory, Livermore, CA (UCRL-AR-1112812-99-2).
Hoffman, F., and D. Bishop (1998), Letter Report: LLNL Report of Preliminary Results toDavid Lunn of Alameda County Flood Control and Water Conservation District, Zone 7,February 27, 1998, presenting an evaluation of hydrogeology of the Mocho I and Springsub-basins, based on LLNL hydrogeological investigations.
Hoffman, J., M. Maley, B. Qualheim, R. Bainer, E. Folsom, and M. Dresen (1998), LLNL GroundWater Project 1997 Annual Report, Lawrence Livermore National Laboratory, Livermore, CA(UCRL-AR-126020-97).
Homann, S. G. (1994), HOTSPOT Health Physics Codes for the PC, Lawrence Livermore NationalLaboratory, Livermore, CA (UCRL-MA-10615).
References
LLNL Environmental Report for 1999 R-9
Huey, A. S. (1948), “Geology of the Tesla Quadrangle, California,” California Division of Mines andGeology, Bulletin 140.
International Commission on Radiological Protection (ICRP) (1959), Recommendations of theInternational Commission on Radiological Protection, Report of Committee 2 on Permissible Doseof Internal Radiation, Publication 2, Pergamon Press, New York, NY.
International Commission on Radiological Protection (ICRP) (1977), Recommendations of theInternational Commission on Radiological Protection, Publication 26 (Pergamon Press, NewYork, NY).
International Commission on Radiological Protection (ICRP) (1979 et seq.), Limits for Intakes ofRadionuclides by Workers, Publication 30, Pergamon Press, New York, NY.
International Commission on Radiological Protection (ICRP) (1994). Dose Coefficients for Intakes ofRadionuclides by Workers. Publication 68, Vol. 24, No. 4, Pergamon Press, Oxford.
International Commission on Radiological Protection ICRP (1996). “Compilation of Ingestionand Inhalation Dose Coefficients.” In Age-dependent Doses to Members of the Public from Intakeof Radionuclides: Part 5. Annals of the ICRP Vol. 26 No. 1. ICRP No. 72 ISSN 0146-6453,Pergamon Press, Oxford.
Isherwood, W. F., C. H. Hall, M. D. Dresen, and A. J. Boegel (1991), CERCLA Feasibility StudyReport for the LLNL Livermore Site, Lawrence Livermore National Laboratory, Livermore, CA(UCRL-AR-104040).
Lamarre, A. L., and M. J. Taffet (1989), Firing Table Gravel Cleanup at Lawrence Livermore NationalLaboratory Site 300, Lawrence Livermore National Laboratory, Livermore, CA (UCAR-10282).
Lamarre, A. L., ed. (1989a), LLNL Site 300 Environmental Investigations Quarterly, July–September1989, Lawrence Livermore National Laboratory, Livermore, CA (UCAR-10194-89-3).
Lamarre, A. L., ed. (1989b), LLNL Site 300 Environmental Investigations Quarterly, October−December1989, Lawrence Livermore National Laboratory, Livermore, CA (UCAR-10194-89-4).
Lamarre, A. L. (1989c), Lawrence Livermore National Laboratory Site 300 Environmental RestorationWork Plan, Lawrence Livermore National Laboratory, Livermore, CA (UCAR-10247 Rev. 1).
Lamarre, A. L. (1999a), Quarterly Compliance Report for the Eastern and Central General Services AreaSoil Vapor and Ground Water Treatment Systems, 4th Quarter 1998, Lawrence LivermoreNational Laboratory Site 300, Livermore, California, January 30, 1999.
Lamarre, A. L. (1999b), Quarterly Compliance Report for the Eastern and Central General Services AreaSoil Vapor and Ground Water Treatment Systems, 1st Quarter 1999, Lawrence LivermoreNational Laboratory Site 300, Livermore, California, April 30, 1999.
Lamarre, A. L. (1999c), Quarterly Compliance Report for the Eastern and Central General Services AreaSoil Vapor and Ground Water Treatment Systems, 2nd Quarter 1999, Lawrence LivermoreNational Laboratory Site 300, Livermore, California, July 30, 1999.
Lamarre, A. L. (1999d), Quarterly Compliance Report for the Eastern and Central General Services AreaSoil Vapor and Ground Water Treatment Systems, 3rd Quarter 1999, Lawrence LivermoreNational Laboratory Site 300, Livermore, California, October 30, 1999.

References
R-10 LLNL Environmental Report for 1999
Lamarre, A. L. (1999e), Quarterly Compliance Report for the Building 834 Ground Water TreatmentSystem, 4th Quarter 1998, Lawrence Livermore National Laboratory Site 300, Livermore,California, March 30, 1999.
Lamarre, A. L. (1999f), Quarterly Compliance Report for the Building 834 Ground Water TreatmentSystem, 1st Quarter 1999, Lawrence Livermore National Laboratory Site 300, Livermore,California, June 30, 1999.
Lamarre, A. L. (1999g), Quarterly Compliance Report for the Building 834 Ground Water TreatmentSystem, 2nd Quarter 1999, Lawrence Livermore National Laboratory Site 300, Livermore,California, September 30, 1999.
Lamarre, A. L. (1999h), Quarterly Compliance Report for the Building 834 Ground Water TreatmentSystem, 3rd Quarter 1999, Lawrence Livermore National Laboratory Site 300, Livermore,California, December 30, 1999.
Lamarre, A. L., and M. J. Taffet (1989), Firing Table Gravel Cleanup at Lawrence Livermore NationalLaboratory Site 300, Lawrence Livermore National Laboratory, Livermore, CA(UCAR-10282).
Larson, J. M., R. J. Harrach, P. E. Althouse, N. A. Bertoldo, A. H. Biermann, R. G. Blake,E. R. Brandstetter, S. L. Brigdon, R. A. Brown, E. Christofferson, K. J. Folks, G. M. Gallegos,L. M. Garcia, T. A. Giesing, A. R. Grayson, L. C. Hall, D. H. MacQueen, S. Mathews,S. R. Peterson, M. J. Taffet, P. J. Tate, R. J. Vellinger, R. J. Ward (1999), Environmental Report1998, Lawrence Livermore National Laboratory, Livermore, CA, http://www.llnl.gov/saer(UCRL-50027-98).
Lawrence Livermore National Laboratory (1996a), The Environmental, Safety, and Health Programat Lawrence Livermore National Laboratory, Lawrence Livermore National Laboratory,Livermore, CA. Accessible from LLNL home page at http://www.llnl.gov/ (UCRL-AR-119618 Rev 1).
Lawrence Livermore National Laboratory (1996b), Environmental Compliance Manual, LawrenceLivermore National Laboratory, Livermore, CA (UCRL-MA-118090 Rev 2).
Lawrence Livermore National Laboratory (2000) Integrated Safety Management System Description,February 14, 2000. Cited in Chapter 3, page 2.
Lewis, P. A., Klemm, D. J., Lazorchak, J. M., Norberg-King, T. J., Peltier, W. H., (1994) Short-TermMethods for Estimating the Chronic Toxicity of Effluents and Receiving Water to FreshwaterOrganisms. Environmental Monitoring Systems Laboratory, Cincinnati, OH. (ReportNo. EPA/600/4-91-002, third edition).
Limnion Corporation, The (1991), The Drainage Retention Basin Management Plan, LawrenceLivermore National Laboratory, Livermore, CA.
Lindeken, C. L., R. O. Morgin, and K. F. Petrock (1963), “Collection Efficiency of Whatman-41Filter Paper for Submicron Aerosols,” Health Physics 9, 305–308.
Lindeken, C. L., P. H. Gudiksen, J. W. Meadows, K. O. Hamby, and L. R. Anspaugh (1973),Environmental Levels of Radioactivity in Livermore Valley Soils, Lawrence Livermore NationalLaboratory, Livermore, CA (UCRL-74424).

References
LLNL Environmental Report for 1999 R-11
Longley, K. E., H. V. Johns, and H. Abraham (1994), The Water Quality Control Plan (Basin Plan)fo the California Regional Water Quality Control Board, Central Valley Region, Sacramento andSan Joaquin River Basins, Central Valley Regional Water Control Board, Sacramento, CA.
Lowder, W. M., and H. L. Beck (1966), “Cosmic Ray Ionization in the Lower Atmosphere,”J. Geophys. Res. 71, 4661–4668.
MacQueen, D. H. (1995), Livermore Big Trees Park January 1995 Soil Survey Results, LawrenceLivermore National Laboratory, Livermore, CA (UCRL-ID-121045).
Marshack, J. B. (1991), The Designated Level Methodology for Waste Classification and Cleanup LevelDetermination, a summary of the Staff Report of the Central Valley RWQCB.
Marshack, J. B. (1998), A Compilation of Water Quality Goals, Central Valley Regional Water QualityControl Board, Sacramento, CA.
Marshall, M. and D. C. Stevens (1980), “The Purposes, Methods and Accuracy of Sampling forAirborne Particulate Radioactive Materials,” Health Physics 39, September 1980, PergamonPress Ltd., pp. 409-423.
Mathews, S., and R. A. Brown (1998), LLNL Experimental Test Site 300 Compliance MonitoringReport for Waste Discharge Requirements 96-248, First Quarter 1998, Lawrence LivermoreNational Laboratory, Livermore, CA (UCRL-AR-125915-98-1).
Mathews, S., and M. Taffet (1997), Final Closure Plan for the High-Explosives Open Burn Facilityat Lawrence Livermore National Laboratory Experimental Test Site 300, Lawrence LivermoreNational Laboratory, Livermore, CA (UCRL-ID-111753 Rev 1).
McNab, W. W. JR., D. Rice, J. Bear, R. Ragaini, C. Tuckfield, and C. Oldenburg (1999), HistoricalCast Analysis of Chlorinated Volatile Organic Compound Plumes, Lawrence Livermore NationalLaboratory, Livermore, CA (UCRL-AR-133361).
McNab, W. W. (1999), Evaluating the Application of Electroosmosis to the Cleanup of Fine-GrainedSediments in Contaminant Source Areas at Lawrence Livermore National Laboratory, LawrenceLivermore National Laboratory, Livermore, CA (UCRL-AR-136098).
National Council on Radiation Protection and Measurements (NCRP) (1987a), Recommendationson Limits of Exposure to Ionizing Radiation, Report No. 91, National Council on RadiationProtection and Measurements, Washington, DC.
National Council on Radiation Protection and Measurements (NCRP) (1987b), Ionizing RadiationExposure of the Population of the United States, Report No. 93, National Council on RadiationProtection and Measurements, Washington, DC.
Oak Ridge Institute for Science and Education (1995), Atmospheric Dispersion Modeling Resources,Second Edition.
Osborne, R. V. (1968) “Intake of tritium when skin is splashed with tritiated water.” In HealthPhysics, Vol. 15, pp. 155–156.
Parks, B. F. (1999), “Tritium dose overestimates by CAP88-PC.” In Operational Radiation Safety,Supplement to Health Physics 76, No. 2, February 1999.
Parks, B. S. (1992), User’s Guide for CAP88-PC, Version 1.0, U.S. Environmental Protection Agency,Office of Radiation Programs, Las Vegas, NV (EPA 402-B-92-001).

References
R-12 LLNL Environmental Report for 1999
Pendleton, B., A. Giron, B. A. Millsap, K. W. Cline, D. M. Bird, eds. (1987), Raptor ManagementTechniques Manual, National Wildlife Federation, Washington, DC.
Peterson, W. B. and L. G. Lavdas (1986), “INPUFF 2.0—A Multiple Source Gaussian PuffDispersion Algorithm,” In User’s Guide, U.S. Environmental Protection Agency, ResearchTriangle, NC.
Raber, E., and D. W. Carpenter, eds. (1983), An Evaluation of the Hydrogeology and GroundwaterChemistry Associated with Landfills at LLNL's Site 300, Lawrence Livermore NationalLaboratory, Livermore, CA (UCRL-53416).
Rice, Jr., D. W., and G. J. Cannon, eds. (1999), Health and Environmental Assessment of the Use ofEthanol as a Fuel Oxygenate, Lawrence Livermore National Laboratory, Livermore, CA(UCRL-AR-135949), http://www-erd.llnl.gov/ethanol/
Rogers/Pacific Corporation (1990), Lawrence Livermore National Laboratory Site 300 ResourceConservation and Recovery Act Closure and Post-Closure Plans—Landfill Pits 1 and 7, Vols. Iand II, Van Nuys, CA (California EPA No. CA2890090002).
Rueth, L. S., R. A. Ferry, L. K. Green-Horner, and T. H. DeLorenzo (1998), Remedial DesignDocument for the General Services Area Operable Unit Treatment Facilities Lawrence LivermoreNational Laboratory, Site 300, Lawrence Livermore National Laboratory, Livermore, CA(UCRL-AR-127465).
San Francisco Bay Regional Water Quality Control Board (1982a), Water Quality Control Plan,San Francisco Bay Basin, State of California, Oakland, CA.
San Francisco Bay Regional Water Quality Control Board (1982b), Waste Discharge Requirementsand National Pollutant Discharge Elimination System (NPDES) Storm Water Permit for: U.S. Department of Energy and Lawrence Livermore National Laboratory, State of California,Oakland, CA (Order No. 95-174, NPDES No. CA030023).
San Francisco Bay Regional Water Quality Control Board (1995), Water Quality Control Plan,San Francisco Bay Basin, State of California, Oakland, CA.
San Francisco Bay Regional Water Quality Control Board (1996), Letter from Loretta Barsamianand Richard McMurtry, RWQCB Executive Officer and Ground Water Protection and WasteContainment Division Chief, respectively, to Paul Ko, DOE Project Manager, stating that nofurther remedial action related to the fuel hydrocarbons is required, dated October 30, 1996.
Scheffé, H. (1953), “A Method for Judging All Contrasts in the Analysis of Variance,” Biometrica,40: 87-104.
Schemnitz, S. D., ed. (1980), Wildlife Management Techniques Manual, The Wildlife Society,Washington, DC.
Shleien, B., and M. S. Terpilak (1984), The Health Physics and Radiological Health Handbook, NucleonLectern Associates, Inc., Olney, MD.
Silver, W. J., C. L. Lindeken, J. W. Meadows, W. H. Hutchin, and D. R. McIntyre (1974),Environmental Levels of Radioactivity in the Vicinity of the Lawrence Livermore Laboratory, 1973Annual Report, Lawrence Livermore National Laboratory, Livermore, CA (UCRL-51547).

References
LLNL Environmental Report for 1999 R-13
Silver, W. J., C. L. Lindeken, J. W. Meadows, W. H. Hutchin, and D. R. McIntyre (1975),Environmental Levels of Radioactivity in the Vicinity of the Lawrence Livermore Laboratory, 1974Annual Report, Lawrence Livermore National Laboratory, Livermore, CA (UCRL-50027-74).
Silver, W. J., C. L. Lindeken, K. M. Wong, E. H. Willes, and J. H. White (1978), EnvironmentalMonitoring at the Lawrence Livermore Laboratory, 1977 Annual Report, Lawrence LivermoreNational Laboratory, Livermore, CA (UCRL-50027-77).
Silver, W. J., C. L. Lindeken, J. H. White, and R. W. Buddemeir (1980), Environmental Modelingof Lawrence Livermore Laboratory: 1979 Annual Report, Lawrence Livermore NationalLaboratory, Livermore, CA (UCRL-50027-79).
State Water Resources Control Board (1992), Waste Discharge Requirements for Discharges of StormWater Runoff Associated with Construction Activity, NPDES General Permit No. CAS000002(Order No. 92-08-DWQ).
State Water Resources Control Board (1999), Waste Discharge Requirements for Discharges of StormWater Runoff Associated with Construction Activity. NPDES General Permit No. CAS000002(Order No. 99-08-DWQ).
Stone, R., and M. R. Ruggieri (1983), Ground-Water Quality and Movement at Lawrence LivermoreNational Laboratory, Lawrence Livermore National Laboratory, Livermore, CA(UCRL-53474).
Struckmeyer, R. (1994), NRC TLD Direct Radiation Monitoring Network, Progress Report,July−September, 1994, Nuclear Regulatory Commission, Washington, DC (NUREG-0837,Vol. 14, No. 3).
Surano, K. A., G. B. Hudson, R. A. Failor, J. M. Sims, R. C. Holland, S. C. MacLean, andJ. C. Garrison (1991), “Helium-3 Mass Spectrometry for Low-Level Tritium Analysis ofEnvironmental Samples,” J. Radioanal. Nucl. Chem 6, 443–453.
Surano, K. A., A. H. Biermann, R. J. Harrach, F. J. Gouveia, R. L. Berger, B. C. Fields,G. M. Gallegos, and P. J. Tate (1995), LLNL NESHAPs 1994 Annual Report, LawrenceLivermore National Laboratory, Livermore, CA (UCRL-ID-113867-95).
Taffet, M. J., A. L. Lamarre, and W. A. McIlvride (1989a), LLNL Site 300 EnvironmentalInvestigations Quarterly, January–March 1989, Lawrence Livermore National Laboratory,Livermore, CA (UCAR-10194-89-1).
Taffet, M. J., J. A. Oberdorfer, and W. A. McIlvride (1989b), Remedial Investigation and FeasibilityStudy for the Lawrence Livermore National Laboratory Site 300 Pit 7 Complex, LawrenceLivermore National Laboratory, Livermore, CA (UCID-21685).
Taffet, M. J., J. R. Copland, and R. A. Ferry (1991), Draft Feasibility Study for Landfill Pit 6, LawrenceLivermore National Laboratory Site 300, Lawrence Livermore National Laboratory, Livermore,CA (UCRL-AR-106307DR).
Taffet, M. J., L. Green-Horner, L. C. Hall, T. M. Carlsen, and J. A. Orberdorfer (1996), Addendum toSite-Wide Remedial Investigation Report, Building 850/Pit 7 Complex Operable Unit, LawrenceLivermore National Laboratory Site 300, Lawrence Livermore National Laboratory, Livermore,CA (UCRL-AR-108131, Add. 1).

References
R-14 LLNL Environmental Report for 1999
Tate, P., S. Mathews, G. Gallegos, L. M Garcia, J. M. Larson, A. H. Biermann, E. R. Brandstetter,E. Christofferson, R. J. Harrach, D. Rueppel, F. Gouveia, P. Althouse, B. C. Fields,D. MacQueen, R. A. Brown, R. Vellinger, K. A. Surano, K. J. Folks, S. L. Brigdon,A. L. Grayson, W. G. Hoppes, R. L. Welsh, N. A. Bertoldo, G. J. Cannon, R. L. Berger,R. G. Blake, M. J. Taffet, R. A. Failor, C. Choate (1999), Environmental Monitoring Plan,Lawrence Livermore National Laboratory, Livermore, CA (UCRL-ID-106132 Rev 2).
Thorpe, R. K., W. F. Isherwood, M. D. Dresen, and C. P. Webster-Scholten (1990), CERCLARemedial Investigation Report for the LLNL Livermore Site, Vols. 1–5, Lawrence LivermoreNational Laboratory, Livermore, CA (UCAR-10299).
Tompson, A. F. B., P. F. McKereghan, and E. M. Nichols, eds. (1995), Preliminary Simulation ofContaminant Migration in Ground Water at the Lawrence Livermore National Laboratory,Lawrence Livermore National Laboratory, Livermore, CA (UCRL-ID-115991).
Toy, A. J., C. L. Lindeken, K. S. Griggs, and R. W. Buddemeier (1981), Environmental Monitoringat the Lawrence Livermore National Laboratory, 1980 Annual Report, Lawrence LivermoreNational Laboratory, Livermore, CA (UCRL-50027-80).
U.S. Department of Energy (1988), External Dose-Rate Conversion Factors for Calculation of Doseto the Public, U.S. Department of Energy, Washington, DC (DOE/EH-0070).
U.S. Department of Energy (1991), Environmental Regulatory Guide for Radiological EffluentMonitoring and Environmental Surveillance, U.S. Department of Energy, Washington, DC(DOE/EH-0173T).
U.S. Department of Energy (1993), Record of Decision for the Lawrence Livermore National LaboratoryLivermore Site, U.S. Department of Energy, Washington, DC (UCRL-AR-109105).
U.S. Department of Energy (1994), Annual Report of Waste Generation and Pollution PreventionProgress 1993, Washington, DC.
U.S. Department of Energy (1996a), Annual Report of Waste Generation and Pollution PreventionProgress 1994, Washington, DC (Report No. DOE/EM-0310).
U.S. Department of Energy Office of the Secretary (1996b), Pollution Prevention Program Plan, 1996,U.S. Department of Energy, Washington, DC (DOE/S-0118).
U.S. Department of Energy, Assistant Secretary for Environmental Management (1997), AnnualReport of Waste Generation and Pollution Prevention Progress 1995, Washington, DC (ReportNo. DOE/EM-0323).
U.S. Department of Energy (1998a), Agreement to Revise Schedules Contained in the LawrenceLivermore National Laboratory Site 300 Federal Facility Agreement, Appendix A,U.S. Department of Energy, October 1998.
U.S. Department of Energy (1998b), “Department of Energy Directives Web Site,”http://www.explorer.doe.gov:1776/htmls/directives.html.
U.S. Department of Energy (1998c), Annual Report of Waste Generation and Pollution PreventionProgress 1997, Washington, DC (Report No. DOE/EM-0365).
U.S. Department of Energy (1998d), Proposed Regulatory Pathway for the Building 854 Operable Unit,Lawrence Livermore National Laboratory Site 300, Livermore, CA, May 28, 1998.

References
LLNL Environmental Report for 1999 R-15
U.S. Department of Energy (1999a), Annual Report of Waste Generation and Pollution PreventionProgress 1998, Washington, DC.
U.S. Department of Energy (1999b), Supplement Analysis for Continued Operation of LawrenceLivermore National Laboratory and Sandia National Laboratories, Livermore, Volumes I and II,Oakland Operations Office, Oakland, California (DOE/EIS-0157-SA-01).
U.S. Department of Energy (1999c), Source Reduction Evaluation and Plan, Hazardous WasteManagement Performance Report, Summary Progress Report, prepared by the OaklandOperations Office.
U.S. Department of Energy and Lawrence Livermore National Laboratory (LLNL) (1998),Livermore Big Trees Park 1998 Soil Sampling Plan, Lawrence Livermore National Laboratory,Livermore, CA (UCRL-ID-130551).
U.S. Department of Energy and University of California (1992a), Final Environmental ImpactStatement and Environmental Impact Report for Continued Operation of Lawrence LivermoreNational Laboratory and Sandia National Laboratories, Livermore, Lawrence Livermore NationalLaboratory, Livermore, CA (DOE/EIS-0157, SCH90030847).
U.S. Department of Energy and University of California (1992b), Final Environmental ImpactStatement and Environmental Impact Report Executive Summary, Lawrence Livermore NationalLaboratory, Livermore, CA (DOE/EIS-0157).
U.S. Department of Health and Human Services (1999), Health Consultation: “PlutoniumContamination in Big Trees Park,” Lawrence Livermore National Laboratory, PublicService, Agency for Toxic Substances and Disease Registry, CERCLIS No. CA28900125584,pp. 7–8.
U.S. Environmental Protection Agency (1987), Data Quality Objectives for Remedial ResponseActivities: Development Process, U.S. Environmental Protection Agency, Office of Emergencyand Remedial Response, Washington, DC (EPA 540/G-87/003, OSWER Directive 9355-0).
U.S. Environmental Protection Agency (1991), Risk Assessment Guidance for Superfund: Volume I—Human Health Evaluation Manual (Part B, Development of Risk-based Preliminary RemediationGoals), U.S. Environmental Protection Agency, Office of Emergency and RemedialResponse, Washington, DC.
U.S. Environmental Protection Agency (1993), Supplement B to the Guideline on Air Quality Models(Revised), EPA Report No. EPA-450/2-78-027R (Supplement B).
U.S. Environmental Protection Agency (1995), “Notice: Final National Pollutant DischardElimination System Storm Water Multi-Sector General Permit for Industrial Activities,Environmental Protection Agency,” Federal Register, Volume 60, No. 189 (September 29, 1995).
U.S. Nuclear Regulatory Commission (1977), Calculation of Annual Doses to Man from RoutineReleases of Reactor Effluent for the Purpose of Evaluation Compliance with 10 Code of FederalRegulations, Part 50, Appendix 1, Washington, DC (Regulatory Guide 1.109).
Van Warmerdam, C., and D. J. Finley, (1997), Transition Plan, Transfer of Existing Waste TreatmentUnits to the Decontamination and Waste Treatment Facility, Lawrence Livermore NationalLaboratory, Livermore, CA (UCRL-AR-126352).

References
R-16 LLNL Environmental Report for 1999
Vogele, T. J., P. F. McKereghan, R. Gelinas, and A. F. B. Tompson (1996), Technical Note: Preliminary 3D Simulations of Contaminant Migration in and Removal from Ground Waterat the LLNL’s Livermore Site, Summary of First Interim Results, TFA Area, LawrenceLivermore National Laboratory, Livermore, CA (MI-ERD/LS/3DIR:1).
Webster-Scholten, C. P., and C. H. Hall (1988), Work Plan, Lawrence Livermore National Laboratory,Livermore Site: CERCLA/SARA Remedial Investigations/ Feasibility Studies, LawrenceLivermore National Laboratory, Livermore, CA (UCAR-10225).
Webster-Scholten, C. P., ed. (1994), Final Site-Wide Remedial Investigation Report, Lawrence LivermoreNational Laboratory Site 300, Lawrence Livermore National Laboratory, Livermore, CA(UCRL-AR-108131).
Wilson, K. L. (1999), Assessing the Nonhazardous Solid Waste Stream at Lawrence Livermore NationalLaboratory, Lawrence Livermore National Laboratory, Livermore, CA (UCRL-AR-134220).
Wood, J., R. Michalik, and K. Doiron (1999), Radioactive Waste Storage Facility and Tank SystemDesign Criteria Standards, Lawrence Livermore National Laboratory, Livermore, CA(UCRL-AR-133355 Rev 1).
Ziagos, J., and E. Reber-Cox (1998a), Building 815 Removal Action Design Workplan for the HighExplosives Process Area Operable Unit at Lawrence Livermore National Laboratory Site 300,Livermore California, November 17, 1998.
Ziagos, J., and E. Reber-Cox (1998b), Ground Water Tritium Plume Characterization Summary Reportfor the Building 850/Pits 3 and 5 Operable Unit, Lawrence Livermore National Laboratory Site 300,Livermore California, October 30, 1998.
Ziagos, J., and E. Reber-Cox (1998c), Characterization Summary Report for the Building 854 OperableUnit, Lawrence Livermore National Laboratory, Livermore California.
Ziagos, J., and B. Jakub, (1998), Action Memorandum for the Building 815 Operable UnitRemoval Action at Lawrence Livermore National Laboratory Site 300, (UCRL-AR-130229),August 1998.
Ziagos, J., R. Halden, P. W. Krauter, and W. D. Daily (1999), The Proposed Application of “Green”Technology to Achieve Cleanup Goals, 11th National Technology Information ExchangeWorkshop, Las Vegas, NV.
LLNL Environmental Report for 1999 G-1
GlossaryAcronyms and Abbreviations
%RSD Percent relative standard deviation.
A ACDEH Alameda County Department of Environmental Health.
ACEHS Alameda County Environmental Health Services.
ACL ambient concentration limit.
ACOE Army Corps of Engineers.
ALARA As low as reasonably achievable.
ANOVA Analysis of variance (see Technical Terms).
ANSI American National Standards Institute.
ARB (California) Air Resources Board.
ATSDR Agency for Toxic Substances and Disease Registry.
AVLIS Advanced Laser Isotope Separation.
AWQC Ambient water quality criteria.
B BAAQMD Bay Area Air Quality Management District. The local agency responsible forregulating stationary air emission sources (including the LLNL Livermore site) inthe San Francisco Bay Area.
BETX (or BTEX) Benzene, ethyl benzene, toluene, and xylene.
BMP Best management practice.
BOD Biochemical oxygen demand.
Bq Becquerel (see Technical Terms).
BSA Blanket Service Agreement.
C Cal/EPA California Environmental Protection Agency.
CAM Continuous air monitor.
CAMP Corrective Action Monitoring Program.
CAP88-PC Computer code required by the EPA for modeling air emissions of radionuclides.
CARB California Air Resources Board.
CAREs (Tri-Valley) Communities Against a Radioactive Environment.
CCR California Code of Regulations. Codification of regulations promulgated by theState of California.
CDFG California Department of Fish and Game.
CDHS California Department of Health Services.
CDHS-RHB California Department of Human Services, Radiological Health Branch.
CEI Compliance Evaluation Inspection.
CEPRC Chemical Emergency Planning and Response Commission.

Glossary
G-2 LLNL Environmental Report for 1999
CEQA California Environmental Quality Act of 1970. CEQA requires that all Californiastate, local, and regional agencies document, consider, and disclose to the publicthe environmental implications of their actions.
CERCLA Comprehensive Environmental Response, Compensation and Liability Act of 1980. Administered by EPA, this program, also known as Superfund, requires privateparties to notify the EPA after the release of hazardous substances and undertakeshort-term removal and long-term remediation. If conditions exist that couldcreate the threat of hazardous substances being released, the Act also requires theremediation of those conditions.
CERCLA/SARA In 1986, the Superfund Amendments and Reauthorization Act (SARA) wasenacted, which amended and reauthorized CERCLA for five years at a totalfunding level of $8.5 billion.
CES Chemistry and Materials Science Environmental Services. An LLNL laboratorythat analyzes environmental samples.
CFC Chlorofluorocarbon (see Technical Terms).
CFEST Coupled Flow Energy and Solute Transport (computer code).
CFF Contained Firing Facility.
CFR Code of Federal Regulations. A codification of all regulations promulgated byfederal government agencies.
CHP California Highway Patrol.
Ci Curie (see Technical Terms).
COC Constituent of concern.
CRD Catalytic reductive dehalogenation.
CRMP Cultural Resource Management Plan.
CRWQCB California Regional Water Quality Control Board.
CVRWQCB Central Valley Regional Water Quality Control Board.
CWG Community Work Group.
D DAP Discipline Action Plan.
DC Direct current.
DCG Derived Concentration Guide (see Technical Terms).
DHS Department of Health Services.
DL Detection limits.
DLM Designated level methodology.
DMP Detection Monitoring Program.
DO Dissolved oxygen.
DoD U.S. Department of Defense.
DOE U.S. Department of Energy. The federal agency that is responsible for conductingenergy research and regulating nuclear materials used for weapons production.
DOE/OAK DOE Oakland Operations Office.
DOI U.S. Department of the Interior.
DOT U.S. Department of Transportation.

Glossary
LLNL Environmental Report for 1999 G-3
DRB Drainage Retention Basin. Man-made, lined pond used to capture storm waterrunoff and treated water at the LLNL Livermore site.
DTSC California Environmental Protection Agency, Department of Toxic SubstancesControl.
DWTF Decontamination and Waste Treatment Facility.
E EA Environmental Assessment.
EDE Effective dose equivalent (see Technical Terms).
EDO Environmental Duty Officer.
EIR Environmental Impact Report. A detailed report prepared pursuant to CEQA onthe environmental impacts from any action carried out, approved, or funded by aCalifornia state, regional, or local agency.
EIS Environmental Impact Statement. A detailed report, required by the NationalEnvironmental Policy Act, on the environmental impacts from a federallyapproved or funded project. An EIS must be prepared by a federal agency when a“major” federal action that will have “significant” environmental impacts isplanned.
EMRL Environmental Monitoring Radiation Laboratory.
EOG Environmental Operations Group.
EPA U.S. Environmental Protection Agency. The federal agency responsible forenforcing federal environmental laws. Although some of this responsibility may bedelegated to state and local regulatory agencies, EPA retains oversight authority toensure protection of human health and the environment.
EPCRA Emergency Planning and Community Right-to-Know Act of 1986. EPCRA requiresfacilities that produce, use, or store hazardous substances to report releases ofreportable quantities or hazardous substances to the environment.
EPD Environmental Protection Department (LLNL).
EPL Effluent pollutant limit.
ERD Environmental Restoration Division of the Environmental Protection Departmentat LLNL.
ES&H Environment, Safety, and Health.
EST Environmental support team.
EWSF Explosives Waste Storage Facility.
EWTF Explosives Waste Treatment Facility.
F FFA Federal facility agreement. A negotiated agreement that specifies required actionsat a federal facility as agreed upon by various agencies (e.g., EPA, RWQCB, andDOE).
FONSI Finding of no significant impact.
Freon 113 1,1,2-trichloro-1,2,2-trifluoroethane.
FSP Facility safety plan.
FTF Field tracking forms.
G g Gram (see Technical Terms).
GAC Granulated activated carbon.

Glossary
G-4 LLNL Environmental Report for 1999
GBq Gigabecquerel. 1 × 10⁹ Becquerel.
GENMIN General mineral site of analyses performed on ground water samples.
GFI Ground fault interrupt.
GSA General Services Area (LLNL Site 300).
GTU GAC treatment unit.
GWP Ground Water Project.
GWPMP Ground Water Project Management Program.
GWTF Ground Water Treatment Facility.
GWTS Ground Water Treatment System.
Gy Gray (see Technical Terms).
H HCAL Hazards Control Department’s Analytical Laboratory.
HCD Hazards Control Department.
HE High explosives. Materials that release large amounts of chemical energy whendetonated.
HEPA High-efficiency particulate air (filter). (See also Technical Terms.)
HMX Cyclotetramethyltetramine, a high-explosive compound. Also referred to asoctahydro-1,3,5,7-tetranitro-1,3,5,7-tetrazocine.
HPGe High-purity germanium.
HSD (Tukey-Kramer) honestly significant difference (test).
HSU Hydrostratigraphic unit.
HT Tritiated hydrogen gas. (See also tritium in Technical Terms.)
HTO Tritiated water and water vapor (See also tritium in Technical Terms.)
HWCA (California) Hazardous Waste Control Act. This legislation specifies requirementsfor the management of hazardous wastes in California.
HWM Hazardous Waste Management Division of the Environmental ProtectionDepartment at LLNL.
I ICRP International Commission on Radiological Protection. An internationalorganization that studies radiation, including its measurement and effects.
IMS Instrumented membrane system.
IQR Interquartile range (see Technical Terms).
ISD Interim status document.
ISMS Integrated safety management system.
ITRC Environmental Council of States Interstate Technology and RegulatoryCooperation.
IWS Integration work sheet.
J JON Judgement of Need.
L LEPC Local Emergency Planning Committee.
LLNL Lawrence Livermore National Laboratory.
LOEC Lowest observed effect concentration.
LOS Limits of sensitivity.

Glossary
LLNL Environmental Report for 1999 G-5
LSM Liter of soil moisture.
LUFT Leaking underground fuel tank.
LWRP Livermore Water Reclamation Plant. The City of Livermore’s municipal waste-water treatment plant, which accepts discharges from the LLNL Livermore site.
M MAPEP Mixed Analyte Performance Evaluation Program.
MCL Maximum contaminant level in drinking water established by EPA or DTSC.
MDC Minimum detectable concentration.
MDL Minimum detection limit.
MEI Maximally exposed individual member of the public.
ML Megaliter. 106 liters.
mL Milliliter. 10–3 liter = 1 cm3.
MOLE Miniature Optical Lair Explorer.
MPN Most probable number.
mR Milliroentgen. 10–3 roentgen.
mrem Millirem. 10–3 rem.
MRP Monitoring and Reporting Program.
MSDS Material safety data sheet.
mSv Millisievert. 10–3 sievert.
MTBE Methyl tertiary-butyl ether.
N NCR Nonconformance Report.
NCRP National Council on Radiation Protection.
NEPA National Environmental Policy Act. This federal legislation, enacted in 1969,requires all federal agencies to document and consider environmental impacts fromfederally funded or approved projects. DOE is responsible for NEPA complianceat LLNL.
NESHAPs National Emission Standards for Hazardous Air Pollutants. These standards arefound in the Clean Air Act and set limits for hazardous air pollutants.
NHPA National Historical Preservation Act.
NIF National Ignition Facility.
NIST National Institute for Standards and Technology. The federal agency, formerlyknown as the National Bureau of Standards, responsible for reference materialsagainst which laboratory materials are calibrated.
NOEC No observed effect concentration.
NOV Notice of Violation.
NPDES National Pollutant Discharge Elimination System. This federal regulation, underthe Clean Water Act, requires permits for discharges into surface waterways.
NPDESMETALS Suite of metal analysis performed on ground water samples required underNPDES.
NPL National Priorities List.

Glossary
G-6 LLNL Environmental Report for 1999
NRC Nuclear Regulatory Commission. The federal agency charged with oversight ofnuclear power and nuclear machinery and applications not regulated by DOE orthe Department of Defense.
O OBT Organically bound tritium.
OEHHA Office of Environmental Health Hazard Assessment.
OJT On-the-job training.
ORAD Operations and Regulatory Affairs Division of the Environmental ProtectionDepartment at LLNL.
OSHA Occupational Safety and Health Administration.
OSP Operational safety plan.
OU Operable unit.
P P2 Pollution Prevention.
PA Programatic agreement.
PCB Polychlorinated biphenyl.
PCE Perchloroethylene (or perchloroethene). Also called tetrachloroethylene (ortetrachloroethene).
pCi Picocurie. 1 × 10–12 Ci.
PeerRP Peer Review Panel.
PEIS Programmatic Environmental Impact Statement.
PHA Public Health Assessment.
pHMS pH Monitoring Station.
PM Performance measure.
PMCL Primary maximum contaminant level.
POTW Publicly owned treatment works.
ppb Parts per billion. A unit of measure for the concentration of a substance in itssurrounding medium. For example, one billion grams of water containing onegram of salt has a salt concentration of one part per billion.
ppm Parts per million. A unit of measure for the concentration of a substance in itssurrounding medium. For example, one million grams of water containing onegram of salt has a salt concentration of one part per million.
ppmv Parts per million by volume.
PPOA Pollution Prevention Opportunity Assessment.
PRG Preliminary remediation goal.
PTU Portable treatment unit.
Q QA Quality assurance (see Technical Terms).
QC Quality control (see Technical Terms).
R R Roentgen (see Technical Terms).
RAIP Remedial Action Implementation Plan.
RCRA Resource Conservation and Recovery Act of 1976. RCRA is a program of federallaws and regulations that govern the management of hazardous wastes. RCRA isapplicable to all entities that manage hazardous wastes.

Glossary
LLNL Environmental Report for 1999 G-7
RDX Hexahydro-1,3,5-trinitro-1,3,5-triazine. A high-explosive compound.
RFG Reformulated gasoline.
RHB Radiological Health Branch.
RL Reporting limit.
RML Radiological Measurements Laboratory.
RMMA Radioactive Materials Management Area.
ROD Record of Decision.
ROI Return on investment.
RPM Remedial Project Manager.
RWQCB Regional Water Quality Control Board. The California regional agency responsiblefor water quality standards and the enforcement of state water quality laws withinits jurisdiction. California is divided into a number of RWQCBs; the Livermore siteis regulated by the San Francisco Bay Region, and Site 300 is regulated by theCentral Valley Region.
S SAA Streambed Alteration Agreement.
Sandia/California Sandia National Laboratories, California.
SAR Safety analysis report.
SARA Superfund Amendment and Reauthorization Act of 1986 (see CERCLA/SARA).
Scfm Standard cubic feet per minute.
SDF Sewer Diversion Facility.
SE Standard error.
SERC State Emergency Response Commission.
SFBRWQCB San Francisco Bay Regional Water Quality Control Board. The local agencyresponsible for regulating stationary air emission sources (including the Livermoresite) in the San Francisco Bay Area.
SHPO (California) State Historic Preservation Office.
SI Système International d’Unités. An international system of physical units. Units ofmeasure in this system include meter (length), kilogram (mass), kelvin(temperature), becquerel (radioactivity), gray (radioactive dose), and sievert (doseequivalent).
Site 300 LLNL’s Experimental Test Site, located approximately 24 km east of the Livermoresite.
SJCHD San Joaquin County Health District. The local agency that enforces underground-tank regulations in San Joaquin County, including Site 300.
SJVUAPCD San Joaquin Valley Unified Air Pollution Control District. The local agencyresponsible for regulating stationary air emission sources (including Site 300) inSan Joaquin County.
SL Statistical limit.
SMCL Secondary maximum contaminant level.
SME Subject matter expert.
SMS Sewer Monitoring Station.

Glossary
G-8 LLNL Environmental Report for 1999
SOV Summary of violations.
SPCC Spill Prevention Control and Countermeasure.
STAR Sample tracking and receiving (computer system).
STP Site Treatment Plan.
STU Solar tracking unit.
Sv Sievert. (See Technical Terms.)
SVE Soil vapor extraction.
SVOC Semivolatile organic compound.
SVRA State Vehicular Recreation Area.
SWAT Solar-powered water activated-carbon treatment.
SWDA State Water Drinking Act.
SW-MEI Sitewide maximally exposed individual member of the public (see TechnicalTerms).
SWPPP Storm Water Pollution Prevention Plan.
SWRCB (California) State Water Resources Control Board.
SWRI (LLNL) Site-wide Remedial Investigation (Report).
T TBOS Tetrabutyl orthosilicate.
TBq Terabecquerel. 1 × 10¹² Becquerel.
TCE Trichloroethene (or trichloroethylene).
TDI Technology Deployment Initiative.
TDS Total dissolved solids. The portion of solid material in a waste stream that isdissolved and passed through a filter.
TLD Thermoluminescent dosimeter. A device used to measure external beta or gammaradiation levels. TLDs contain a material that after exposure to beta or gammaradiation emits light when processed and heated.
TNT Trinitrotoluene.
TOC Total organic carbon. The sum of the organic material present in a sample.
TOX Total organic halides. The sum of the organic halides present in a sample.
TRU Transuranic waste.
TSCA Toxic Substances Control Act.
TSS Total suspended solids.
TWMS Total Waste Management System.
U UC University of California.
USEC U.S. Enrichment Corporation.
USFWS U.S. Fish and Wildlife Service.
UST Underground storage tank.
UV Ultraviolet light.
V VOC Volatile organic compound. Liquid or solid organic compounds that have a highvapor pressure at normal pressures and temperatures and thus tend tospontaneously pass into the vapor state.

Glossary
LLNL Environmental Report for 1999 G-9
VPP Voluntary Protection Program.
VTF Vapor treatment facilities.
W WAA Waste accumulation area. An officially designated area that meets currentenvironmental standards and guidelines for temporary (less than 90 days) storageof hazardous waste before pickup by the Hazardous Waste Management Divisionfor off-site disposal.
WDR Waste Discharge Requirements. Issued by the California Regional Water QualityControl Board.
WGMG Water Guidance and Monitoring Group.
WQO Water quality objective.
WSS Work Smart Standards.
WTF Working task force.
Z Zone 7 Alameda County Flood Control and Conservation District, Zone 7.
Technical TermsA Absorbed dose The amount of energy imparted to matter by ionizing radiation per unit mass of
irradiated material. The absorbed dose is expressed in units of rad or gray (l rad= 0.01 gray).
Accuracy The closeness of the result of a measurement to the true value of the quantitymeasured.
Action level Defined by regulatory agencies, it is the level of pollutants which, if exceeded,requires regulatory action.
Aerosol A gaseous suspension of very small particles of liquid or solid.
Alluvium Sediment deposited by flowing water.
Alpha particle A positively charged particle emitted from the nucleus of an atom, having massand charge equal to those of a helium nucleus (two protons and two neutrons).
Ambient air The surrounding atmosphere, usually the outside air, as it exists around people,plants, and structures. It is not considered to include the air immediatelyadjacent to emission sources.
Analyte The specific component that is being measured in a chemical analysis.
Anion A negatively charged ion, for example Cl–.
ANOVA Analysis of variance. A test of whether two or more sample means arestatistically different.
Aquifer A saturated layer of rock or soil below the ground surface that can supply usablequantities of ground water to wells and springs. Aquifers can be a source ofwater for domestic, agricultural, and industrial uses.
Aquitard Low-permeability geologic formation that bounds an aquifer.
Atom The smallest particle of an element capable of entering into a chemical reaction.
Atomic absorption(AA) spectroscopy
A method used to determine the elemental composition of a sample. In thismethod, the sample is vaporized and its light absorbance measured.
B Barcad Device that samples water in a well. Water, collected in a discrete water-bearingzone, is forced to the surface by pressurized nitrogen.

Glossary
G-10 LLNL Environmental Report for 1999
Becquerel (Bq) The SI unit of activity of a radionuclide, equal to the activity of a radionuclidehaving one spontaneous nuclear transition per second.
Beta particle A negatively charged particle emitted from the nucleus of an atom, havingcharge, mass, and other properties of an electron.
Biochemical(biological) oxygendemand
A measure of the amount of dissolved oxygen that microorganisms need tobreak down organic matter in water. It is used as an indicator of water quality.
C Categoricaldischarge
Discharge from a process regulated by EPA rules for specific industrialcategories.
Chlorofluorocarbon(CFC)
A compound that has fluorine and chlorine atoms on a carbon backbone. Freons are common CFCs.
Chain-of-custody A method for documenting the history and possession of a sample from the timeof its collection, through its analysis and data reporting, to its final disposition.
Chlorocarbon A compound of carbon and chlorine, or carbon, hydrogen, and chlorine, such ascarbon tetrachloride, chloroform, and tetrachloroethene.
Collective doseequivalent andcollective effectivedose equivalent
The sums of the dose equivalents or effective dose equivalents to all individualsin an exposed population within 80 km (50 miles) of the radiation source. Theseare evaluated by multiplying the dose received by an individual at each locationby the number of individuals receiving that dose, and summing over all suchproducts for locations within 80 km of the source. They are expressed in units ofperson-rem or person-sievert. The collective EDE is also referred to as the“population dose.”
Committed doseequivalent
The predicted total dose equivalent to a tissue or organ over a 50-year periodafter an intake of a radionuclide into the body. It does not include contributionsfrom external dose. Committed dose equivalent is expressed in units of rem (orsievert; 100 rem equals one sievert).
Committed effectivedose equivalent
The sum of the committed dose equivalents to various tissues in the body, eachmultiplied by an appropriate weighting factor representing the relativevulnerability of different parts of the body to radiation. Committed effectivedose equivalent is expressed in units of rem or sievert.
Cosmic radiation Radiation with very high energies, originating outside the earth’s atmosphere. Cosmic radiation is one source contributing to natural background radiation.
Curie (Ci) A unit of measurement of radioactivity, defined as the amount of radioactivematerial in which the decay rate is 3.7 × 10¹⁰ disintegrations per second or2.22 × 1012 disintegrations per minute; one Ci is approximately equal to thedecay rate of one gram of pure radium.
D Daughter nuclide A nuclide formed by the radioactive decay of another nuclide, which is calledthe parent.
Depleted uranium Uranium having a lower proportion of the isotope 235U than is found innaturally occurring uranium. The masses of the three uranium isotopes withatomic weights 238, 235, and 234 occur in depleted uranium in the weight-percentages 99.8, 0.2. and 5 × 10⁻⁴, respectively. Depleted uranium is sometimesreferred to as D-38.
DerivedConcentration Guide(DCG)
Concentrations of radionuclides in water and air that could be continuouslyconsumed or inhaled for one year and not exceed the DOE primary radiationstandard to the public (100 mrem/y EDE).

Glossary
LLNL Environmental Report for 1999 G-11
De minimis Shortened form of “de minimis non curat lex,” which means, “The law does notcare for, or take notice of, very small or trifling matters.” A “de minimis level”would be a level that is so inconsequential that, by definition, it cannot be causefor concern.
Dose The energy imparted to matter by ionizing radiation; the unit of absorbed dose isthe rad, equal to 0.01 joules per kilogram for irradiated material in any medium.
Dose commitment The dose that an organ or tissue would receive during a specified period of time(e.g., 50 or 70 years) as a result of one year’s intake of one or more radionuclides.
Dose equivalent The product of absorbed dose in rad (or gray) in tissue and a quality factorrepresenting the relative damage caused to living tissue by different kinds ofradiation, and perhaps other modifying factors representing the distribution ofradiation, etc. Dose equivalent is expressed in units of rem or sievert (l rem =0.01 sievert).
Dosimeter A portable detection device for measuring the total accumulated exposure toionizing radiation.
Dosimetry The theory and application of the principles and techniques of measuring andrecording radiation doses.
Downgradient In the direction of ground water flow from a designated area; analogous todownstream.
E Effective doseequivalent (EDE)
An estimate of the total risk of potential effects from radiation exposure. It is thesummation of the products of the dose equivalent and weighting factor for eachtissue. The weighting factor is the decimal fraction of the risk arising fromirradiation of a selected tissue to the total risk when the whole body is irradiateduniformly to the same dose equivalent. These factors permit dose equivalentsfrom nonuniform exposure of the body to be expressed in terms of an effectivedose equivalent that is numerically equal to the dose from a uniform exposure ofthe whole body that entails the same risk as the internal exposure (ICRP 1980). The effective dose equivalent includes the committed effective dose equivalentfrom internal deposition of radionuclides and the effective dose equivalentcaused by penetrating radiation from sources external to the body, and isexpressed in units of rem (or sievert).
Effluent A liquid or gaseous waste discharged to the environment.
Evapotranspiration A process by which water is transferred from the soil to the air by plants thattake the water up through their roots and release it through their leaves andother aboveground tissue.
F Federal facility A facility that is owned or operated by the federal government. Federal facilitiesare subject to the same requirements as other responsible parties once placed onthe Superfund National Priorities List.
Federal Register A document published daily by the federal government containing notificationof government agency actions. The Federal Register contains notification of EPAand DOE actions, including notification of EPA and DOE decisions concerningpermit applications and rule-making.
G Gamma ray High-energy, short-wavelength, electromagnetic radiation emitted from thenucleus of an atom. Gamma radiation frequently accompanies the emission ofalpha or beta particles.
Gram The standard metric measure of weight approximately equal to 0.035 ounce.

Glossary
G-12 LLNL Environmental Report for 1999
Gray The SI unit of measure for absorbed dose; the quantity of energy imparted byionizing radiation to a unit mass of matter, such as tissue. One gray equals 100rads, or 1 joule per kilogram.
Ground water All subsurface water.
H Half-life(radiological)
The time required for one-half the radioactive atoms in a given amount ofmaterial to decay. After one half-life, half of the atoms will have decayed; aftertwo half-lives, three-fourths; after three half-lives, seven-eighths; and so on,exponentially.
Hazardous waste Wastes exhibiting any of the following characteristics: ignitability, corrosivity,reactivity, or EP-toxicity (yielding toxic constituents in a leaching test). Inaddition, EPA has listed as hazardous other wastes that do not necessarilyexhibit these characteristics. Although the legal definition of hazardous waste iscomplex, the term more generally refers to any waste that EPA believes couldpose a threat to human health and the environment if managed improperly.
HEPA filter A high-efficiency particulate air filter used to capture particulates in an air stream. A HEPA filter is a throwaway, extended-media, dry type filter with a rigid casingenclosing the full depths of the pleats. HEPA filter collection efficiencies are atleast 99.97% for 0.3 micrometer diameter particles.
Hydraulicgradient
In an aquifer, the rate of change of total head (water-level elevation) per unitdistance of flow at a given point and in a given direction.
Hydrology The science dealing with the properties, distribution, and circulation of naturalwater systems.
I Inorganiccompounds
Compounds that either do not contain carbon or do not contain hydrogen alongwith carbon. Inorganic compounds include metals, salts, and various carbonoxides (e.g., carbon monoxide and carbon dioxide).
In situ A term that can be used to refer to the treatment of contaminated areas in place,i.e., without excavation or removal, as in the in situ treatment of soils throughbiodegradation of contaminants on site.
Interim status A legal classification that applies to hazardous waste incinerators or otherhazardous waste management facilities that were under construction or inoperation by November 19, 1980, and can meet other interim statusrequirements. Interim status facilities may operate while EPA considers theirpermit application.
Interquartile range(IQR)
The distance between the top of the lower quartile and the bottom of the upperquartile. The IQR provides a measure of the spread of data.
Isotopes Forms of an element having the same number of protons in their nuclei, butdiffering numbers of neutrons.
L Liter The SI measure of capacity approximately equal to 1.057 quart.
Less than detectionlimits
A phrase indicating that a chemical constituent was either not identified or notquantified at the lowest level of sensitivity of the analytical method beingemployed by the laboratory. Therefore, the chemical constituent either is notpresent in the sample, or it is present in such a small concentration that it cannotbe measured by the analytical procedure.
Low-level waste Waste defined by DOE Order 5820.2A. Low-level waste contains transuranicnuclide concentrations less than 100 nCi/g.

Glossary
LLNL Environmental Report for 1999 G-13
Lower limit ofdetection
The smallest concentration or amount of analyte that can be detected in a sampleat a 95% confidence level.
Lysimeter An instrument for measuring the water percolating through soils anddetermining the dissolved materials.
M Maximallyexposedindividual
The maximally exposed individual is a hypothetical member of the public at afixed location who, over an entire year, receives the maximum effective doseequivalent (summed over all pathways) from a given source of radionuclidereleases to air. Generally, the MEI is different for each source at a site.
Multiplecompletion
A borehole with water surveillance monitoring devices (Barcads) placed atvarious levels and separated by impermeable layers of material such as grout. Usually the uppermost “completion” is accessible from the surface, makingphysical sample-taking possible (as opposed to Barcads), and is referred to as awell.
Mixed waste Waste that has the properties of both hazardous and radioactive waste.
N Nonpoint source Any nonconfined area from which pollutants are discharged into a body ofwater (e.g., agricultural runoff, construction runoff, and parking lot drainage), orinto air (e.g., a pile of uranium tailings).
Nuclide A species of atom characterized by the constitution of its nucleus. The nuclearconstitution is specified by the number of protons, number of neutrons, andenergy content; or, alternatively, by the atomic number, mass number, andatomic mass. To be regarded as a distinct nuclide, the atom must be capable ofexisting for a measurable length of time.
O Off-site Outside the boundaries of the LLNL Livermore site and Site 300 properties.
On-site Within the boundaries of the LLNL Livermore site or Site 300 properties.
P Part B permit The second, narrative section submitted by generators in the RCRA permittingprocess. It covers in detail the procedures followed at a facility to protect humanhealth and the environment.
Perched aquifer Aquifer that is separated from another water-bearing stratum by animpermeable layer.
Performancestandards(incinerators)
Specific regulatory requirements established by EPA limiting the concentrationsof designated organic compounds, particulate matter, and hydrogen chloride inincinerator emissions.
pH A measure of hydrogen ion concentration in an aqueous solution. Acidicsolutions have a pH from 0 to 6; basic solutions have a pH greater than 7; andneutral solutions have a pH of 7.
Piezometer Instrument for measuring fluid pressure. Generally used to measure theelevation of the water table in a small, nonpumping well.
Pliocene Geological epoch of the Tertiary period, starting about 12 millionyears ago.
PM-10 Fine particulate matter with an aerodynamic diameter equal to or less than10 microns.
Point source Any confined and discrete conveyance (e.g., pipe, ditch, well, or stack).
Pretreatment Any process used to reduce a pollutant load before it enters the sewer system.

Glossary
G-14 LLNL Environmental Report for 1999
Pretreatmentregulations
National wastewater pretreatment regulations, adopted by EPA in compliancewith the 1977 amendments to the Clean Water Act, which required that EPAestablish pretreatment standards for existing and new industrial sources.
Priority pollutants A set of organic and inorganic chemicals identified by EPA as indicators ofenvironmental contamination.
Q Quality assurance (QA)
A system of activities whose purpose is to provide the assurance that standardsof quality are attained with a stated level of confidence.
Quality control (QC) Procedures used to verify that prescribed standards of performance are attained.
Quality factor The factor by which the absorbed dose (rad) is multiplied to obtain a quantitythat expresses (on a common scale for all ionizing radiation) the biologicaldamage to exposed persons. Quality factor is used because some types ofradiation, such as alpha particles, are biologically more damaging than others. Quality factors for alpha, beta, and gamma radiation are in the ratio 20:1:1.
Quaternary The geologic era encompassing the last 2–3 million years.
R Rad The unit of absorbed dose. It is the quantity of energy imparted by ionizingradiation to a unit mass of matter such as tissue. One rad equals 0.01 joule perkilogram, or 0.01 gray.
Radioactive decay The spontaneous transformation of one radionuclide into a different nuclide(which may or may not be radioactive), or de-excitation to a lower energy stateof the nucleus by emission of nuclear radiation, primarily alpha or beta particles,or gamma rays (photons).
Radioactivity The spontaneous emission of nuclear radiation, generally alpha or beta particles,or gamma rays, from the nucleus of an unstable isotope.
Radionuclide An unstable nuclide. See nuclide and radioactivity.
Rem A unit of radiation dose equivalent and effective dose equivalent describing theeffectiveness of a type of radiation to produce biological effects; coined from thephrase “roentgen equivalent man.” It is the product of the absorbed dose (rad),a quality factor (Q), a distribution factor, and other necessary modifying factors. One rem equals 0.01 sievert.
Risk assessment The use of established methods to measure the risks posed by an activity orexposure. In the present context, risk assessments evaluate: (1) the relationshipbetween exposure to radioactive substances and the subsequent occurrence ofhealth effects; and (2) the likelihood for that exposure to occur.
Roentgen A unit of measurement used to express radiation exposure in terms of theamount of ionization produced in a volume of air.
S Sampling andAnalysis Plan
A detailed document describing the procedures used to collect, handle, andanalyze ground water samples. The plan details quality control measures thatare implemented to ensure that sample-collection, analysis, and data-presentation activities meet the prescribed requirements.
Sanitary waste Most simply, waste generated by routine operations that is not regulated ashazardous or radioactive by state or federal agencies.
Saturated zone A subsurface zone below which all rock pore-space is filled with water; alsocalled the phreatic zone.

Glossary
LLNL Environmental Report for 1999 G-15
Sensitivity The capability of methodology or instrumentation to discriminate betweensamples having differing concentrations or containing varying amounts ofanalyte.
Sewerage The system of sewers.
Sievert (Sv) The SI unit of radiation dose equivalent and effective dose equivalent. This isthe product of the absorbed dose (gray), quality factor (Q), distribution factor,and other necessary modifying factors. One sievert equals 100 rem.
Sitewide MaximallyExposed Individual(SW-MEI):
The sitewide maximally exposed individual member of the public is defined asthe hypothetical person who receives, at the location of a given publiclyaccessible facility (such as a church, school, business, or residence), the greatestLLNL-induced effective dose equivalent (summed over all pathways) from allsources of radionuclide releases to air at a site. Doses at this receptor locationcaused by each emission source are summed, and yield a larger value than forthe location of any other similar public facility. This individual is assumed tocontinuously reside at this location 24 hours per day, 365 days per year.
Specific conductance Measure of the ability of a material to conduct electricity. Also calledconductivity.
Superfund The common name used for the Comprehensive Environmental Response,Compensation and Liability Act of 1980 (CERCLA). California has alsoestablished a “State Superfund” under provisions of the California HazardousWaste Control Act.
Surfaceimpoundment
A facility or part of a facility that is a natural topographic depression, man-madeexcavation, or diked area formed primarily of earthen materials, although it maybe lined with man-made materials. The impoundment is designed to hold anaccumulation of liquid wastes, or wastes containing free liquids, and is not aninjection well. Examples of surface impoundments are holding, storage, settlingand aeration pits, ponds, and lagoons.
T Tritium The radioactive isotope of hydrogen, containing one proton and two neutrons inits nucleus. It decays at a half-life of 12.3 years by emitting a low-energy betaparticle.
Transuranic waste Material contaminated with alpha-emitting transuranium nuclides, which havean atomic number greater than 92 (e.g. 239Pu), half-lives longer than 20 years,and are present in concentrations greater than 100 nCi/g of waste.
Tukey-Kramer HSDtest
The Tukey-Kramer honestly significant difference test, a statistical technique fortesting differences among group means.
U Unsaturated zone That portion of the subsurface in which the pores are only partially filled withwater. The direction of water flow is vertical in this zone; which is also referredto as the vadose zone.
V Vadose zone The partially saturated or unsaturated region above the water table that does notyield water to wells.
W Wastewatertreatment system
A collection of treatment processes and facilities designed and built to reducethe amount of suspended solids, bacteria, oxygen-demanding materials, andchemical constituents in wastewater.
Water table The water-level surface below the ground at which the unsaturated zone endsand the saturated zone begins. It is the level to which a well that is screened inthe unconfined aquifer would fill with water.

Glossary
G-16 LLNL Environmental Report for 1999
Weighting factor A value used to calculate dose equivalents. It is tissue-specific and representsthe fraction of the total health risk resulting from uniform, whole-bodyirradiation that could be contributed to that particular tissue. The weightingfactors used in this report are recommended by the International Commission onRadiological Protection (ICRP 1980).
Wind rose A diagram that shows the frequency and intensity of wind from differentdirections at a specific location.
Z Zone 7 The common name for the Alameda County Flood Control and WaterConservation District. Zone 7 is the water management agency for theLivermore-Amador Valley with responsibility for water treatment anddistribution. Zone 7 is also responsible for management of agricultural andsurface water and the ground water basin.

Reader Survey and Data Supplement Order Form
Our goal in providing this report is to give you a clear accounting of the range of environmental activitieswe undertake, the methods we employ, and the degree of accuracy of our results. It is important that theinformation we provide is easily understood, is of interest, and communicates LLNL’s efforts to protecthuman health and the environment and to comply with environmental regulations. We would like to knowfrom you whether we are successful in these goals. Your comments are welcome.
1. Is the technical level ❏ too high? ❏ too low? ❏ uneven? ❏ just right?
2. Is the writing ❏ too concise? ❏ too verbose? ❏ uneven? ❏ just right?
Yes No
3. Do the illustrations help you understand the text better? ❏ ❏Are there enough? ❏ ❏Too few? ❏ ❏
Too many? ❏ ❏
4. Is the background information sufficient? ❏ ❏
5. Are the methodologies being described understandable? ❏ ❏Interesting? ❏ ❏
6. Are the glossaries and appendices useful? ❏ ❏7. Are the data tables of interest? ❏ ❏
Would you prefer short summaries of data trends instead? ❏ ❏Other comments:
OPTIONAL: If you complete this reader survey but do not wish to order a Data Supplement, providing thefollowing information here would be helpful:
Name: Occupation:
Address:
Data Supplement Order Form ❏ Please send me a copy of the LLNL Site Annual Environmental Report 1999 Data
Supplement. My name and address are:
________________________________________________________________________
________________________________________________________________________
________________________________________________________________________
________________________________________________________________________
________________________________________________________________________
To return this reader survey and data supplement order form to the Laboratory, please detach it, fold itwith this side in, tape it closed, and mail it. Laboratory staff may simply send their survey forms throughLab mail to Jennifer Larson, L-627.

NO POSTAGE NECESSARY
IF MAILED IN THE
UNITED STATES
BUSINESS REPLY MAILFIRST-CLASS MAIL PERMIT NO. 16 LIVERMORE, CA
POSTAGE WILL BE PAID BY THE LLNL
University of CaliforniaLawrence Livermore National Laboratory Attn: Jennifer LarsonL-627P.O. Box 808Livermore, California 94551-9989
Please fold on dotted line and seal before mailing.


Enviro
nm
ental P
rotectio
n D
epartm
ent • L
awren
ce Liverm
ore N
ation
al Lab
orato
ryU
niversity o
f Califo
rnia • P.O
.Box 808 • L
ivermo
re,Califo
rnia 94551