Embed Size (px)
Citation preview

UC Davis Chilled Water, Thermal Storage, and Building Integrated Optimization Project
Joshua Morejohn, UC Davis Facilities ManagementDavid Trombly, UC Davis Facilities Management
Joseph Yonkoski, UC Davis Facilities ManagementJohn Rundell, Smith Engineering
February 12, 2020

UC Davis Campus
• Nearly 100 buildings on district cooling
• Two chiller plants• Daily population 50,000

Chiller Plants
• 10,000 tons• 4 centrifugal chillers• Primary/Secondary CHW
pumps• 5 cooling tower cells
Central Heating & Cooling Plant (CHCP)
Thermal Energy Storage Plant (TES)
Building Loads
• 8,000 tons• 4 centrifugal chillers• Primary/Secondary CHW
pumps• 12 cooling tower cells• 5 Mgal TES tank (40k to
50k ton-hr)
40 million ton-hr/yr12°F average ∆T
0.70 kW/ton (plant)$0.07/kWh (average)
$2M annual cost

Pre-project Status
• Chiller plants• Operator shift-based TES dispatch• Fixed condenser water supply temperature• Fixed chilled water supply temperature• Insufficient chiller performance monitoring
• Buildings• Inconsistent design and use of bypass and bridge valves• Contribute to low system ∆T• Nonoptimal/nonexistent air side P and T resets
None of these issues require a large capital expense to fix!

Project Goals
• System-wide approach• Improve the buildings (pilot and deploy)• Improve the plant
• Fast implementation• Steam-to-HW will cause changes• Get most savings with minimal effort
• Capital-free (or low capital)• Collaborative partner
• Implement and teach• Leverage in-house knowledge
• Fee limited by savingsceed.ucdavis.edu/chcp/

Project Organization
UC Davis Facilities Management
Energy Conservation Office Utilities
Smith Engineering
Grad Students
Smith Engineering Staff Staff
Buildings Plant
• Identify 2-3 problem buildings• Implement building control sequence changes• Deploy to remaining buildings• M&V
• Implement plant control sequence changes• Develop and implement optimal TES dispatch• M&V

Opportunity: Rate
• Historical method of operation:• Night: Complete charging the tank• Day: Ride it out, use the tank• Swing: Turn on chillers, begin charging tank
Wet
Bul
b, D
ry B
ulb
(°F)
De
man
d (t
ons)
El
ec. R
ate
($/M
Wh)
Chillers Running
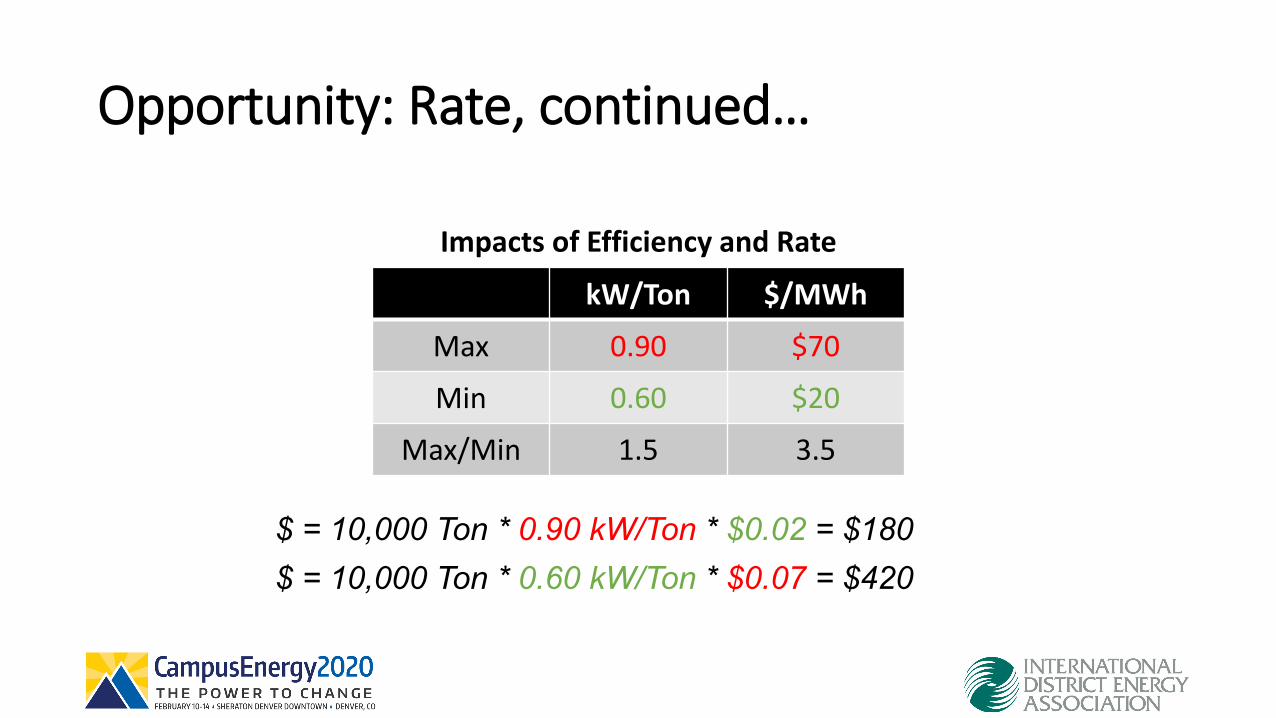
Opportunity: Rate, continued…
kW/Ton $/MWh
Max 0.90 $70
Min 0.60 $20
Max/Min 1.5 3.5
$ = 10,000 Ton * 0.90 kW/Ton * $0.02 = $180$ = 10,000 Ton * 0.60 kW/Ton * $0.07 = $420
Impacts of Efficiency and Rate

Opportunity: ∆T

Plant Optimization: Training
• Learn from operators• Builds Trust• Reduces Fear• Opens Lines of communication• Operators become part of the team

Fan Affinity LawFan Power varies with x^3 of flow
50 HP at ½ speed = 6.25 HP
Plant Optimization: Tower Staging

14 16 18 20 22 24 26 28 30 32 34 36 38 40 42 44 46 48 50 52 54 56 58 60 62 64 66 68 70 72 74 76 78 80 82 84 86 88 90 92 94 96 98 100 102 104 106 108 110 112 114 116 118 12092 0.55 0.53 0.4790 0.48 0.51 0.51 0.4988 0.47 0.47 0.46 0.64 0.49 0.44 0.51 0.51 0.5 0.5 0.49 0.49 0.48 0.48 0.46 0.4486 0.58 0.55 0.58 0.58 0.55 0.53 0.55 0.55 0.55 0.5 0.54 0.51 0.51 0.52 0.51 0.51 0.51 0.5 0.49 0.48 0.49 0.49 0.44 0.4584 0.66 0.57 0.55 0.54 0.53 0.58 0.56 0.55 0.53 0.52 0.53 0.49 0.49 0.52 0.51 0.53 0.52 0.53 0.54 0.52 0.52 0.52 0.5 0.5 0.5 0.49 0.47 0.48 0.47 0.47 0.46 0.46 0.44 0.44 0.42 0.42 0.42 0.41 0.4182 0.57 0.57 0.53 0.54 0.52 0.56 0.54 0.53 0.6 0.58 0.5 0.57 0.53 0.5 0.49 0.53 0.47 0.5 0.51 0.51 0.53 0.54 0.53 0.53 0.52 0.51 0.49 0.48 0.47 0.47 0.46 0.46 0.45 0.46 0.44 0.44 0.44 0.43 0.42 0.41 0.41 0.42 0.480 0.85 0.63 0.58 0.56 0.56 0.53 0.52 0.53 0.58 0.55 0.59 0.53 0.55 0.5 0.47 0.51 0.5 0.48 0.48 0.47 0.49 0.47 0.47 0.49 0.49 0.49 0.5 0.49 0.5 0.49 0.48 0.46 0.45 0.45 0.44 0.44 0.44 0.43 0.43 0.42 0.42 0.41 0.41 0.41 0.4 0.3978 0.56 0.55 0.55 0.53 0.5 0.51 0.55 0.54 0.55 0.53 0.52 0.52 0.49 0.49 0.47 0.44 0.43 0.43 0.45 0.45 0.45 0.44 0.45 0.46 0.47 0.46 0.45 0.46 0.44 0.45 0.44 0.44 0.43 0.44 0.43 0.43 0.42 0.42 0.42 0.41 0.41 0.41 0.4 0.4 0.476 0.88 0.75 0.73 0.64 0.67 0.65 0.63 0.58 0.62 0.57 0.55 0.53 0.52 0.52 0.53 0.53 0.52 0.49 0.48 0.47 0.46 0.45 0.43 0.42 0.41 0.41 0.41 0.41 0.42 0.41 0.42 0.42 0.42 0.42 0.42 0.42 0.42 0.42 0.41 0.41 0.41 0.41 0.41 0.41 0.41 0.41 0.39 0.4 0.4 0.4 0.36 0.38 0.3774 0.84 0.85 0.69 0.71 0.67 0.58 0.66 0.64 0.63 0.59 0.56 0.52 0.5 0.49 0.49 0.57 0.48 0.48 0.48 0.46 0.45 0.43 0.42 0.41 0.4 0.4 0.4 0.4 0.38 0.39 0.4 0.4 0.39 0.4 0.39 0.38 0.38 0.4 0.39 0.39 0.39 0.41 0.4 0.4 0.39 0.41 0.4 0.39 0.38 0.41 0.3772 1.16 0.69 0.67 0.68 0.67 0.66 0.61 0.61 0.6 0.57 0.53 0.51 0.51 0.52 0.51 0.48 0.48 0.48 0.46 0.45 0.42 0.42 0.4 0.4 0.4 0.39 0.39 0.39 0.39 0.39 0.39 0.38 0.38 0.39 0.39 0.39 0.39 0.4 0.39 0.42 0.41 0.41 0.41 0.4 0.39 0.4170 0.79 0.76 0.63 0.58 0.66 0.61 0.49 0.5 0.48 0.48 0.48 0.45 0.44 0.42 0.4 0.4 0.39 0.38 0.38 0.39 0.39 0.4 0.37 0.37 0.41 0.4 0.38 0.4 0.39 0.3968 0.8 0.82 0.82 0.76 0.6 0.6 0.67 0.48 0.54 0.51 0.46 0.45 0.49 0.49 0.46 0.46 0.48 0.46 0.45 0.43 0.41 0.41 0.4 0.38 0.4 0.38 0.37 0.37 0.37 0.38 0.38 0.3966 0.47 0.45 0.43 0.41 0.43 0.4 0.42 0.4 0.39 0.37 0.3764 0.5 0.51 0.5 0.45 0.48 0.45 0.47 0.44 0.41 0.41 0.45 0.3962 0.53 0.54 0.44 0.46 0.46 0.3760 0.55 0.56 0.49 0.47 0.48 0.47 0.4858 0.52 0.57 0.4556 0.53 0.72 0.49 0.56 0.52 0.495452
Chiller Percent Load (Load/Design Load)
CDHF Efficiency Map (kW/Ton)
EC
WT
(F
)
Plant Optimization: CWST

Plant Optimization: Rate-Driven TES Dispatch

Plant Optimization: Rate-Driven TES DispatchPrior to training
Post Training

• 4.8M Gallons• 40,000 ton-hr • 39/51 °F CHWS/R• 12 °F ∆T
• 4.8M Gallons• 80,000 ton-hr • 38/60 °F CHWS/R• 24 °F ∆T
51F
39F
12F DT
62F
38F
24F DT
Plant Optimization: Increase the TES Battery

Building Optimization: New ≠ Good

CP-1
CP-2
CP-3
CP-4
Static Pressure and SAT Reset

Building Optimization: Static Pressure Reset

Lab Control – Code Optimization
Does not allow for a heating/cooling space temp deadband
Allows for a heating/cooling space temp deadband
Minimum does not compensate for hood airflow, over-ventilates in heating mode (7.2 ACH)
Displays and controls down to min ACH setpoint (6 ACH, 18% Reduction)
Less ReheatLess EA/SA CFM
Before After
6ACH

“Live M&V” Using Machine Learned ModelCHW $/hrElectric $/hrSteam $/hr

Extrapolated Annual Savings
Static Pressure Reset and DAT Reset(7% Building Energy Reduction)
Lab ACH Control Optimization
(5% Building Energy Reduction)
Combined 12% Annual Building Energy Reduction
Baseline Elec Model ($/hr)Actual Elec ($/hr)
Baseline Steam Model ($/hr)Actual Steam ($/hr)

Joshua Morejohn, [email protected]
David Trombly, [email protected]
Joseph Yonkoski, [email protected]
John Rundell,[email protected]