Embed Size (px)
Citation preview

Open AccessResearch Article
Saini and Murthy, Pharm Anal Acta 2016, 7:6DOI: 10.4172/2153-2435.1000493
Volume 7 • Issue 6 • 1000493Pharm Anal ActaISSN: 2153-2435 PAA, an open access journal
Keywords: Dielectric relaxation spectroscopy; Glass transition;Differential scanning calorimetry; Phase behaviour; Heterogeneity
IntroductionPropylene glycol (PG) is commonly used as inactive ingredient in
oral and injectable pharmaceutical formulations for water-insoluble (or poorly water soluble drugs). PG is also used as a stabilizer for vitamin supplements and also as a moisturizer in cosmetic products [1-6]. As a pharmaceutical additive, PG is generally regarded as safe, but can be toxic in high doses [4,5]. According to the World Health Organization (WHO) [1], the acceptable dietary intake of PG is 25 mg for every kilogram (kg) of body weight when used as a food additive [3]. The acceptable quantity of PG in a drug is not clearly defined, and the exact amount of PG present is seldom reported. In a few formulations, the maximum amount of PG is reported to be up to 55% by weight in oral solutions and nearly 80% in injectable formulation [2,6]. Common medicines used as drug solution with PG are acetaminophen, methocarbamol, guaifenesin, amprenavir, oxytetracycline, pentobarbital sodium, etomidate, lormetazepam, lorazepam, cotrimoxazole, amoxicillin, omeprazole, temazepam, etc., where PG is treated as excipient [2,6-9]. For orally administered drugs solubility is the most important parameter. As discussed in a number of publications [10-16] improvement in the water solubility of pharmaceuticals improves drug absorption and hence bioavailability of the drugs. Therefore, solubility behavior of drugs in PG is useful for pharmaceutical dose design. There are many methods in use to study the solubility [5,7-9,17] but these methods do not explain the exact phase behavior of the mixtures. For these reasons, it is important to determine the complete information about physicochemical data of pharmaceutical systems. Dielectric spectroscopy (in combination with differential scanning calorimetry) is a powerful technique to investigate the molecular dynamics of binary liquids [18-20] particularly if the measurements are performed in the supercooled liquid state. On supercooling a single component liquid or homogeneous liquid mixture, the molecular mobility gets arrested kinetically at the glass transition temperature (Tg) [21]. This transition is reflected as a step-like change in the specific heat (Cp) versus temperature curve and corresponds to the kinetic freezing of the liquid relaxation (also usually referred as primary (α-) relaxation process) that is non- Arrhenius in temperature dependence. In a heterogeneous binary liquid mixture, one can expect two primary non-Arrhenius (α-) processes arising from the phase separated liquid regions [22].
In this work we study the glass formation ability, molecular mobility and phase behaviour in the supercooled state of binary mixtures of PG with four pharmaceuticals namely acetaminophen, methocarbamol, guaifenesin, and mephenesin (whose pharmaceutical formulations are used by world health experts with varying concentration of PG), using calorimetric and dielectric relaxation techniques. Where results of dielectric relaxation technique indicate that these liquid mixtures are not perfectly homogeneous, and clearly two well separated liquid regions are found, despite calorimetric results were almost misleading these binaries as a homogeneous mixture.
Experimental sectionMaterial characterization
PG (CH3-CH(OH)-CH2(OH)) used in this study was obtained from Merck Specialities Pvt. Ltd. (molecular weight (MW)=76.10 g/mol and purity ≥ 99%). The details of other samples studied in this publication are as follows: (i) acetaminophen (ACT) (MW=151.16 g/mol and purity ≥ 99%) (ii) methocarbamol (ML) (MW=241.24 g/mol and purity ≥ 98%) (iii) guaifenesin (GFN) (MW=198.22 g/mol and purity ≥ 99.9%) (iv) mephenesin (MP) (MW=182.22 g/mol and purity ≥ 98%). All drug samples were obtained from Sigma-Aldrich co., (made in China), and were used after desiccation. Details of the molecular structure of the drugs used in the present study are given in supplementary file SI attached to this article.
Experimental techniques
Differential Scanning Calorimeter (DSC): Perkin-Elmer sapphire differential scanning calorimeter (DSC) with quench-cooling accessory
*Corresponding author: Murthy SSN, School of Physical Sciences, JawaharlalNehru University, New Delhi 110067, India, Tel: (+91)-11-26738770, 26741333;E-mail: [email protected]; [email protected]
Received May 18, 2016; Accepted June 25, 2016; Published June 28, 2016
Citation: Saini MK, Murthy SSN (2016) Acetaminophen, Methocarbamol, Guai-fenesin and Mephenesin in Propylene Glycol: Solubility and Phase Behaviour for Use in Medical Industry. Pharm Anal Acta 7: 493. doi:10.4172/2153-2435.1000493
Copyright: © 2016 Saini MK, et al. This is an open-access article distributed under the terms of the Creative Commons Attribution License, which permits unrestricted use, distribution, and reproduction in any medium, provided the original author and source are credited.
Acetaminophen, Methocarbamol, Guaifenesin and Mephenesin in Propylene Glycol: Solubility and Phase Behaviour for Use in Medical IndustrySaini MK and Murthy SSN*School of Physical Sciences, Jawaharlal Nehru University, New Delhi 110067, India
AbstractPropylene glycol is generally used as inactive solvent for water-insoluble drugs in liquid form for administration orally and
intravenously. The phase behaviour of these binary liquid mixtures is not known very well and this knowledge is desirable in the search for better drug design. In order to know the phase behavior, dielectric relaxation (10-3 Hz – 2 MHz) and differential scanning calorimetry (DSC) measurements have been performed on binary liquid mixtures of propylene glycol with four drugs namely acetaminophen, methocarbamol, guaifenesin, and mephenesin. The glass transition temperature region is examined critically for a step like change in DSC scan at the heating rate of 10 K/min. The DSC scans are found to be unusually broad in the glass transition region, especially for intermediate concentrations. This together with the dielectric spectroscopic results, which revealed two liquid like processes, each following Vogel-Fulcher-Tammanns temperature dependence at all concentrations, point to microheterogeneity in these mixtures. The two processes are attributed to the separated liquid phases rich in pharmaceutical and propylene glycol respectively.
Phar
mac
eutica Analytica Acta
ISSN: 2153-2435Pharmaceutica Analytica Acta
Page 2 of 14
Volume 7 • Issue 6 • 1000493Pharm Anal ActaISSN: 2153-2435 PAA, an open access journal
Citation: Saini MK, Murthy SSN (2016) Acetaminophen, Methocarbamol, Guaifenesin and Mephenesin in Propylene Glycol: Solubility and Phase Behaviour for Use in Medical Industry. Pharm Anal Acta 7: 493. doi:10.4172/2153-2435.1000493
was used for the calorimetric measurements. The DSC cell was calibrated for temperature using indium (melting transition=429.75 K), and mercury (melting transition=234.3 K) as standards. The liquid sample taken in DSC pan is cooled rapidly in nitrogen atmosphere at a rate of 10-50 K/min to 103 K, and then DSC scan is taken for a heating rate of 10 K/min.
Dielectric Relaxation Spectroscopy: Frequency domain dielectric measurements were carried out in the frequency range of 20 Hz – 2 MHz using Agilent E4980A LCR Meter. For the ultra-low-frequency range from 10-0.5 Hz to 10-3 Hz, a DC step response technique [23-26] was used. The design of the dielectric cell is similar to the one used before [16], with the empty cell capacitance (C0) of about 35 pF.
The binary liquids were prepared by melting the individual components and then by mixing well them using a magnetic stirrer for apparent homogenization. The dielectric cell was then filled with the liquid mixture without entrapping air bubbles, and data were taken during cooling and heating cycles in the argon atmosphere. For further details of the experimental setup, the reader may consult the earlier publications from this laboratory [15,16]. Prior to each dielectric run, the dielectric cell was calibrated with benzene at room temperature.
Data analysis
Dielectric analysis: The imaginary part (ε”) of the complex dielectric constant (ε*(f)=ε’(f) – ε”(f),) is analysed using Havriliak-Negami (HN) shape function [27] given by
( )*
0
1
0
1HNHNf
ff
iβα
ε εε ε
−
∞
∞
− = +
−−
(1)
Where f0 is the average relaxation frequency; ε0 and ε∞ are the limiting dielectric constants for the process under consideration, and αHN and βHN are the semi-empirical spectral shape parameters. The parameter αHN is a measure of the distribution of relaxation times in the sample, and the parameter (1–βHN) is a measure of cooperativity among the molecules. The peak loss frequency fm is determined with the help of the estimated values of αHN, βHN and f0 [28] as,
( ) ( )
( )1 1'
0 cos 2 sin 2 . '
HN
mHN HN
kf fk
α
α π α π
−
= −
where R=
( )1 2( )ta
1n HN
HN
α πβ
= +
− (2)
Before the data analysis, contribution of dc conductivity to the imaginary part (ε”) of the complex permittivity has been deducted [29].
Relaxation rates: The temperature dependence of the primary relaxation process has been analysed using the Vogel-Fulcher-Tammanns [15,16,21] equation (VFT) given below,
0, 0,
BT T
m a af f e − − =
(3)
Where T0 is the limiting glass transition temperature, fo,α is a constant and B corresponds to the activation energy.
The secondary relaxation process in these binary mixtures has been
found to follow the Arrhenius equation [30] (obtained from the above equation with T0=0 and B=E/R) given as,
( )0
ERT
mf f e−
= (4)
Where E corresponds to the apparent activation energy, R and fo are constants.
Results and DiscussionThe DSC and dielectric spectroscopy measurements taken for
the neat samples of ACT, ML, GFN and MP were reported in detail in our previous publications [15,16]. For the sake of convenience of discussion, the results of binary liquid mixtures study are described in details in the following sections.
Thermal study by DSC
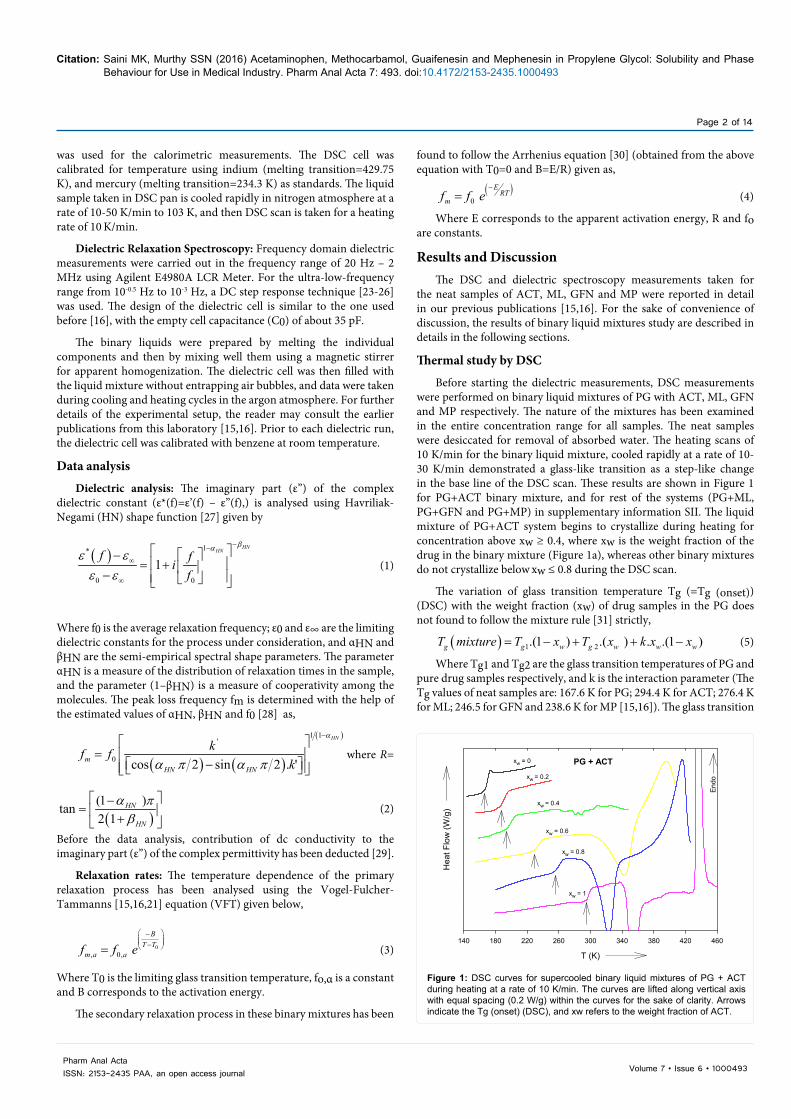
Before starting the dielectric measurements, DSC measurements were performed on binary liquid mixtures of PG with ACT, ML, GFN and MP respectively. The nature of the mixtures has been examined in the entire concentration range for all samples. The neat samples were desiccated for removal of absorbed water. The heating scans of 10 K/min for the binary liquid mixture, cooled rapidly at a rate of 10-30 K/min demonstrated a glass-like transition as a step-like change in the base line of the DSC scan. These results are shown in Figure 1 for PG+ACT binary mixture, and for rest of the systems (PG+ML, PG+GFN and PG+MP) in supplementary information SII. The liquid mixture of PG+ACT system begins to crystallize during heating for concentration above xw ≥ 0.4, where xw is the weight fraction of the drug in the binary mixture (Figure 1a), whereas other binary mixtures do not crystallize below xw ≤ 0.8 during the DSC scan.
The variation of glass transition temperature Tg (=Tg (onset)) (DSC) with the weight fraction (xw) of drug samples in the PG does not found to follow the mixture rule [31] strictly,
( ) 1 2 . 1 .( ) ( ) . . 1( )g g w g w w wT mixture T x T x k x x= − + + − (5)
Where Tg1 and Tg2 are the glass transition temperatures of PG and pure drug samples respectively, and k is the interaction parameter (The Tg values of neat samples are: 167.6 K for PG; 294.4 K for ACT; 276.4 K for ML; 246.5 for GFN and 238.6 K for MP [15,16]). The glass transition
xw = 1
T (K)
140 180 220 260 300 340 380 420 460
Hea
t Flo
w (W
/g)
PG + ACTxw = 0
xw = 0.2
xw = 0.4
xw = 0.6
xw = 0.8
Endo
xw = 1
Figure 1: DSC curves for supercooled binary liquid mixtures of PG + ACT during heating at a rate of 10 K/min. The curves are lifted along vertical axis with equal spacing (0.2 W/g) within the curves for the sake of clarity. Arrows indicate the Tg (onset) (DSC), and xw refers to the weight fraction of ACT.

Page 3 of 14
Volume 7 • Issue 6 • 1000493Pharm Anal ActaISSN: 2153-2435 PAA, an open access journal
Citation: Saini MK, Murthy SSN (2016) Acetaminophen, Methocarbamol, Guaifenesin and Mephenesin in Propylene Glycol: Solubility and Phase Behaviour for Use in Medical Industry. Pharm Anal Acta 7: 493. doi:10.4172/2153-2435.1000493
event occurred in these binary mixtures is found to be unusually broad in temperature for intermediate concentrations in comparison to the pure samples. Therefore, we looked at the onset (Tg (onset)]) and end point (Tg (end)) of this glass transition events critically, using the software supplied with the DSC instrument. The variation of ΔTg=[Tg (end)–Tg (onset)] with weight fraction (xw) is presented in Figure 2, which reveals a broad maximum for intermediate concentrations. This difference (ΔTg) is higher for PG+ML system as compared to the other binary liquid mixtures.
Dielectric Study
Spectral Shape: We have examined the dielectric relaxation spectra of the supercooled liquids in the concentration range of xw=0.1–0.9, for all samples. However, in PG+ACT system we were able to obtain data till xw = 0.3 only, because of the intervention of crystallization during the course of measurements. The dielectric measurement performed on binary liquid mixtures shows various relaxation processes. To give an idea to the reader about the occurrence of various relaxation processes the variation of dielectric loss (ε”) at 1 kHz test frequency is shown in Figure 3 against temperature normalized to Tg, for different concentrations. The data reveals two major or primary (α– and α’–) processes above glass transition temperature, in addition to a weak secondary (β–) relaxation process. The corresponding variation of dielectric permittivity (ε’) at 1 kHz test frequency, with temperature, is given in supplementary information SIII.
The spectral dependence (ε” vs. f ) of the α– and α’– processes at different temperatures is shown in Figure 4a-4d, for a particular
concentration of xw=0.3 (30% by weight of the drug in the solution), of all binary systems. The dashed and dotted lines represent the individual fits (Equation 1) corresponding to α– and α’– process respectively. The α– process corresponds to the drug-rich region and α’– process corresponds to the PG-rich region. The corresponding details of fitting parameters are given in Table 1. Also included in the table is the peak loss frequency (fm) calculated from Equation (2). The dielectric loss (ε”) of all mixtures can be explained satisfactorily throughout the frequency range as a superposition of two primary processes (α– and α’– processes) each following Equation 1. Similar spectral behaviour (not shown here) is observed in the rest of the concentration range in all binary systems. The details of the parameters of Equation 1 are given in Table 2. In PG+ML (xw=0.9) system the other primary (α’-) process could not be resolved.
A weak secondary (β-) relaxation is observed on lower temperature side in all binary mixtures. The dielectric spectra of β- process in all binary liquid mixtures can reasonably be described by Equation (1) with βHN=1. The dielectric strength of the secondary process increases with drug concentration (Table 2), and approaches the value of that of the pure samples studied earlier [15,16].
Permittivity: Variation of the static value of dielectric constant (ε0) with temperature (T) of binary liquid mixtures is presented in Figure 5, where the experimental points more or less follow the reciprocal dependence of temperature (dotted line corresponds to T-1
variation). Inverse temperature dependence of large dielectric strength (Δε=ε0 - ε∞) can be expected as nearly similar variation for ε0 if ε∞ is smaller. On pharmaceutical-rich side, the binary liquid mixture begins
Xw
0.0 0.2 0.4 0.6 0.8 1.0
∆
T g [T g
(end
) - T
g (o
nset
)] (K
)
4
8
12
16
20
24
28
32
PG + ACTPG + MLPG + GFNPG + MP
T (K)
Hea
t Flo
w
Tg (onset)
Tg (end)
Endo
Figure 2: Depicted is the variation of ΔTg = [Tg (end) – Tg (onset)] with xw. Shown in the inset is schematic DSC curve for the purpose of clarification of Tg (onset) and Tg (end) used.

Page 4 of 14
Volume 7 • Issue 6 • 1000493Pharm Anal ActaISSN: 2153-2435 PAA, an open access journal
Citation: Saini MK, Murthy SSN (2016) Acetaminophen, Methocarbamol, Guaifenesin and Mephenesin in Propylene Glycol: Solubility and Phase Behaviour for Use in Medical Industry. Pharm Anal Acta 7: 493. doi:10.4172/2153-2435.1000493
(a) PG + ACT
log
"
-3
-2
-1
0
1xw = 0.1xw = 0.3xw = 1
1 kHz
'
α
(b) PG + ML
log"
-3
-2
-1
0
1xw = 0.1xw = 0.3xw = 0.5xw = 0.7xw = 0.9xw = 1
(c) PG + GFN
log
"
-3
-2
-1
0
1
xw = 0.1xw = 0.3xw = 0.5xw = 0.7xw = 1
(d) PG + MP
T/Tg
0.4 0.6 0.8 1.0 1.2 1.4
log
"
-3
-2
-1
0
1xw = 0.1xw = 0.3xw = 0.5xw = 0.8xw = 1
1 kHz
1 kHz
1 kHz
β
β
α
α
'
α'
α'
α
β
ω
ω
ω
ω
α
αβ
Figure 3: Variation of the imaginary (ε”) part of the complex permittivity at 1 kHz frequency for binary mixtures of various concentrations with temperature normalized to Tg, where Tg = Tg (onset) (DSC).

Page 5 of 14
Volume 7 • Issue 6 • 1000493Pharm Anal ActaISSN: 2153-2435 PAA, an open access journal
Citation: Saini MK, Murthy SSN (2016) Acetaminophen, Methocarbamol, Guaifenesin and Mephenesin in Propylene Glycol: Solubility and Phase Behaviour for Use in Medical Industry. Pharm Anal Acta 7: 493. doi:10.4172/2153-2435.1000493
logε"
0
1
227.5 K 231.8 K 239.6 K 243.6 K
(a) PG + ACT (xw = 0.3)
α
log f (Hz)
2 3 4 5 6
logε
"
0
1229.7 K 234.1 K 238.4 K 241.9 K
(b) PG + ML (xw = 0.3)
a
α'
α'
logε"
0
1234.2 K 240.1 K 246.6 K 251.5 K
(c) PG + GFN (xw = 0.3)
α
log f (Hz)
3 4 5 6
logε"
-1
0
1
236.2K237.9 K240.2 K242.4 K
(d) PG + MP (xw = 0.3)
α
α'
α'
Figure 4: Plots of dielectric loss (ε”) vs. frequency (f) at different temperatures in binary mixture of (a) PG + ACT, (b) PG + ML, (c) PG + GFN and (d) PG + MP for a particular concentration xw = 0.3 (xw corresponds to the weight fraction of the drug component). The dashed and dotted lines represent the individual HN-function Equation fit corresponds to α- and α’- processes respectively. Details of fitting parameters are given in Table 1.
to crystallize during heating. The data shown in Figure 5 is a result of cooling and heating cycles. In Figure 5a, the narrow concentration range of PG+ACT mixture is due to the unavoidable crystallization at higher concentrations of ACT. The behaviour of ε0 with xw in binary mixture at different temperatures is shown in Figure 6, where, the data follow the dotted line corresponds to the Equation 6.
1 2 . 1 . ( ) ( ) )1(. .o o w o w w wx x k x xε ε ε= − + + − (6)
Where εo1 and εo2 are the dielectric constants (at given temperature) of PG and pure drug samples respectively, and k is the interaction parameter. Interestingly, Equation 6 is similar to the liquid mixture rule as given in Equation 5, where ε∞ value is much smaller than ε0 values. From the validity of ε0 with xw shown in Figure 6 and Equation (6), we are not able to see any observable deviation from mixture rule Equation (5), leaving a false impression that the mixture is homogeneous.
Relaxation rates: The relaxation rates of these binary mixtures are discussed in the following sections.
Primary relaxations: Two primary relaxation processes are observed in the binary liquid mixtures, designated as α– and α’– processes. These processes are found to follow the VFT (Equation 3). Figure 7a is the relaxation map of PG+ACT binary mixture up to xw=0.3. Also included in Figure 7a are the data of pure components PG (xw=0) and ACT (xw=1). In this figure, curves 1, 2 and 3 correspond to the α– process arising from drug rich region in the liquid and curves 2’, 3’ and 4’ correspond to the α’– process arising from PG-rich region in the liquid. The existence of two non-Arrhenius processes namely α– and α’– indicates that the binary mixture is a two-phase liquid. This can be noticed from Figure 7b that dielectric strength (Δε) of α– process increases with xw and that of α’– process decreases. Thus, it is tempting to attribute α– and α’– processes to the liquid regimes rich in ACT and PG respectively.
Relaxation map of PG+ML binary mixture is shown in Figure 8a, where curves 1- 6 corresponds to α–process and curves 3’- 7’ correspond to α’– process. As shown in Figure 8b, the dielectric strength of the α–process is comparable in magnitude to that of α’–process, for intermediate concentrations. The strength of α–process increases towards drug-rich side.
Similarly observations are made in binary mixture of PG+GFN (Figure 9) for α– process (curves 1 - 5) and α’– process (curves 2’- 6’); and in PG+MP (Figure 10a) (α– process (curves 1-5) and α’– process (curves 2’- 6’)). And, the variation of dielectric strength (Δε) of α– and α’– processes with xw is presented in Figure 9b for PG+GFN and in Figure 10b for PG+MP.
Secondary relaxation: Understanding of secondary relaxation process is important to explain the phenomenon of glass transition and molecular behavior in the glassy state, and also to find out the probability of crystallization below glass transition temperature during the storage of the drugs at low temperatures. In the glassy state, the relaxation time for the secondary process follows linear temperature dependence of log fm versus 1/T (Equation 4) as expected for the relaxation processes related to localize molecular mobility. Secondary (β-) process observed in binary mixtures is clearly resolvable on the drug-rich region in comparison to PG-rich region, indicating that secondary process is an intrinsic feature of drug samples only [15,16]. The activation energy of the β- process observed for xw=0.3, is given in Table 3, and for rest of the concentrations, the details are given in supplementary file SIV. The Eβ –value found in this study is much

Page 6 of 14
Volume 7 • Issue 6 • 1000493Pharm Anal ActaISSN: 2153-2435 PAA, an open access journal
Citation: Saini MK, Murthy SSN (2016) Acetaminophen, Methocarbamol, Guaifenesin and Mephenesin in Propylene Glycol: Solubility and Phase Behaviour for Use in Medical Industry. Pharm Anal Acta 7: 493. doi:10.4172/2153-2435.1000493
Proc
ess
(a) PG+ACT (xw=0.3)
Proc
ess
(b) PG+ML (xw=0.3)
T (K) αHN βHN f0 (Hz) fm (Hz) ∆εa T (K) αHN βHN f0 (Hz) fm (Hz) ∆εa
α - 227.5 0.12 1 4.77×10² 4.77×10² 20.8 α - 229.7 0.26 1 7.40×10² 7.40×10² 8.1
231.8 0.12 1 1.38×10³ 1.38×10³ 20.8 234.1 0.26 1 2.08×10³ 2.08×10³ 8.2
239.6 0.12 1 3.07×10³ 3.07×10³ 20.8 238.4 0.26 1 6.27×10³ 6.27×10³ 8.4
243.6 0.12 1 1.05×10⁴ 1.05×10⁴ 20.8 241.9 0.26 1 1.50×10⁴ 1.50×10⁴ 8.6
α'- 227.5 0.22 0.76 1.05×10⁴ 1.42×10⁴ 24.5 α'- 229.7 0.21 0.78 3.68×10⁴ 4.83×10⁴ 21.8
231.8 0.22 0.78 2.86×10⁴ 3.78×10⁴ 23.0 234.1 0.20 0.80 8.38×10⁴ 1.07×10⁵ 21.0
239.6 0.21 0.80 6.60×10⁴ 8.44×10⁴ 22.0 238.4 0.20 0.83 1.98×10⁵ 2.42×10⁵ 20.0
243.6 0.21 0.80 1.98×10⁵ 2.53×10⁵ 20.6 241.9 0.13 0.84 3.84×10⁵ 4.54×10⁵ 19.0
(c) PG+GFN (xw=0.3) (d) PG+MP (xw=0.3)
α - 234.2 0 1 1.29×10³ 1.29×10³ 2.3 α - 236.2 0 1 1.66×10⁴ 1.66×10⁴ 4.0
240.1 0 1 3.99×10³ 3.99×10³ 2.3 237.9 0 1 2.44×10⁴ 2.44×10⁴ 4.0
246.6 0 1 1.33×10⁴ 1.33×10⁴ 2.4 240.2 0 1 4.11×10⁴ 4.11×10⁴ 4.0
251.5 0 1 3.98×10⁴ 3.98×10⁴ 2.5 242.4 0 1 6.22×10⁴ 6.22×10⁴ 4.0
α'- 234.2 0.16 0.79 4.69×10⁴ 5.96×10⁴ 26.6 α'- 236.2 0.12 0.79 2.03×10⁵ 2.54×10⁵ 23.4
240.1 0.15 0.81 1.35×10⁵ 1.66×10⁵ 25.4 237.9 0.12 0.79 2.90×10⁵ 3.63×10⁵ 22.9
246.6 0.13 0.84 4.17×10⁵ 4.93×10⁵ 24.1 240.2 0.10 0.80 4.69×10⁵ 5.77×10⁵ 22.4
251.5 0.13 0.84 6.12×10⁵ 7.24×10⁵ 24.1 242.4 0.06 0.80 7.40×10⁵ 8.98×10⁵ 21.8
aΔε=ε0 - ε∞Table 1: Details of the fitting parameters of HN - Equation 1 for α - and α’- processes in binary mixtures of PG shown in Figure 4.
Sample xw T (K) α - process α' – process
T (K) β - process
αHN βHN Δε αHN βHN Δε αHN βHN Δε
0.1 219.7 0 1 12.2 0 0.67 31.9 167.9 0.43 1 1 0.10
PG+ACT 0.3 231.8 0.12 1 21.8 0.22 0.78 23 171.4 1 1 0.19
0.1 235.5 0 1 3.6 0.14 0.9 30.2 162.7 0.75 1 1 0.20
0.3 238.4 0.26 1 8.4 0.2 0.83 20 172.1 0.7 1 1 0.26
PG+ML 0.5 244.6 0.37 1 11 0.35 0.86 10 182.1 0.67 1 1 0.31
0.7 267.1 0.1 1 5.8 0.29 0.72 8.6 206 0.56 1 1 0.38
0.9 276.5 -- 0.21 0.47 12.3 240.8 0.7 1 1 0.49
0.1 242.3 0 1 1.6 0 0.82 23.8 161.1 0.77 1 1 0.30
0.3 244.3 0 1 2.6 0.16 0.8 21.6 169.7 0.71 1 1 0.31
PG+GFN 0.5 261.2 0 1 2.8 0.16 1 16.4 181.8 0.65 1 1 0.35
0.7 261.3 0 1 2.8 20 1 9 185.4 0.61 1 1 0.40
0.1 234.4 0 1 3 0 0.8 29.7 174.3 0.76 1 1 0.30
0.3 240.2 0 1 4 0.1 0.8 22.4 172.6 0.76 1 1 0.36
PG+MP 0.5 248.7 0 1 4 0.2 0.8 16.3 186.6 0.71 1 1 0.39
0.8 261.4 0.18 1 6.5 0.26 0.84 7.8 210.2 0.7 1 1 0.50
*Δε values have an error of (±)5% due to the uncertainty in resolution.Table 2: Details of HN- parameters of the various processes in binary mixture of PG for various concentrations.*

Page 7 of 14
Volume 7 • Issue 6 • 1000493Pharm Anal ActaISSN: 2153-2435 PAA, an open access journal
Citation: Saini MK, Murthy SSN (2016) Acetaminophen, Methocarbamol, Guaifenesin and Mephenesin in Propylene Glycol: Solubility and Phase Behaviour for Use in Medical Industry. Pharm Anal Acta 7: 493. doi:10.4172/2153-2435.1000493
160 200 240 280 320 360 400 440
ε 0
10
25
40
55
70 xw = 0 xw = 0.1xw = 0.3 xw = 1
(a) PG + ACT
160 200 240 280 320 360 400
ε 0
5
20
35
50
65 xw = 0xw = 0.1xw = 0.3xw = 0.5xw = 0.7xw = 0.9xw = 1
ε 0
5
20
35
50
65 xw = 0xw = 0.1xw = 0.3xw = 0.5xw = 0.7xw = 1
T (K)
160 200 240 280 320 360
ε 0
5
20
35
50
65xw = 0xw = 0.1 xw = 0.3xw = 0.5xw = 0.8 xw = 1
(b) PG + ML
(c) PG + GFN
(d) PG + MP
Figure 5: Variation of static value of dielectric constant (ε0) of the liquids with temperature (T) in,
(a) PG + ACT, (b) PG + ML, (c) PG + GFN and (d) PG + MP respectively. The dotted line corresponds to the T
-1 variation. The data correspond to the xw = 0
(pure PG sample) are taken from ref. [32].
25
35
45
55
65
240 K 260 K 280 K 300 K
(a) PG + ACT
10
16
22
28
34280 K 300 K 320 K 340 K
8
16
24
32
40
48 220 K 240 K 260 K 280 K 300 K
xw
0.0 0.2 0.4 0.6 0.8 1.0
ε 0
8
16
24
32
40
48 220 K 240 K 260 K 280 K
(b) PG + ML
(c) PG + GFN
(d) PG + MP
ε 0ε 0
ε 0
Figure 6: Depicted is the variation of ε0 with xw in binary mixture of (a) PG + ACT, (b) PG + ML,
(c) PG + GFN and (d) PG + MP respectively. The dotted line corresponds to the Eq. (5). In (a), ε0 values of ACT rich side could not be obtained due to the intervention of crystallization during the experiment.

Page 8 of 14
Volume 7 • Issue 6 • 1000493Pharm Anal ActaISSN: 2153-2435 PAA, an open access journal
Citation: Saini MK, Murthy SSN (2016) Acetaminophen, Methocarbamol, Guaifenesin and Mephenesin in Propylene Glycol: Solubility and Phase Behaviour for Use in Medical Industry. Pharm Anal Acta 7: 493. doi:10.4172/2153-2435.1000493
1000/T (K)
2.8 3.8 4.8 5.8 6.8 7.8
log
f m (H
z)
-4
-2
0
2
4
6
8
10
xw = 1, curve 1xw = 0.3, curves 2, 2'xw = 0.1, curves 3, 3'xw = 0, curve 4'
xw
0.0 0.2 0.4 0.6 0.8 1.0
∆ε
0
10
20
30
40
50
60
T = 240 K
1
2
2'
3
3' 4'
β
4'
3'2'
3
2
1
(a) PG + ACT
(b) PG + ACT
α
α'
Figure 7: PG + ACT binary mixture (a) Arrhenius diagram depicting the α- (curves 1, 2, 3), α’- (curves 2’, 3’, 4’) and β- processes, where xw = 0 corresponds to neat PG [33] and xw = 1 corresponds to neat ACT [15]. The thick line along the α- and α’- processes corresponds to Eq. (3) (for fm < 106 Hz), and that along the β- process corresponds to Eq. (4), for the parameters given in Table 3.(b) Variation of dielectric strength (Δε) of α- and α’- processes with xw, at the temperature shown in the figure. The dotted line corresponds to extrapolation to neat ACT, for the purpose of clarity.

Page 9 of 14
Volume 7 • Issue 6 • 1000493Pharm Anal ActaISSN: 2153-2435 PAA, an open access journal
Citation: Saini MK, Murthy SSN (2016) Acetaminophen, Methocarbamol, Guaifenesin and Mephenesin in Propylene Glycol: Solubility and Phase Behaviour for Use in Medical Industry. Pharm Anal Acta 7: 493. doi:10.4172/2153-2435.1000493
1000/T (K)
3.1 3.6 4.1 4.6 5.1 5.6 6.1 6.6 7.1
log
f m (H
z)
-4
-2
0
2
4
6
8
10xw = 1, curve 1xw = 0.9, curve 2xw = 0.7, curves 3, 3'xw = 0.5, curves 4, 4'xw = 0.3, curves 5. 5'xw = 0.1, curves 6, 6'xw = 0, curve 7'
β
1 2 3
4
4'
5
5'
6
6'7'
xw
0.0 0.2 0.4 0.6 0.8 1.00
10
20
30
40 7'
6'
6
5'
5
4'
4
21
T = 240 K
3'
3'
3
(a) PG + ML
(b) PG + ML
α
α'
∆ε
Figure: 8 PG + ML binary mixture (a) Arrhenius diagram depicting the α- (curves 1- 6), α’- (curves 3’- 7’) and β- processes, where xw = 0 corresponds to neat PG [33] and xw = 1 corresponds to neat ML [15]. The thick line along the α- and α’- processes correspond to Equation 3 (for fm < 10
6 Hz), and that along the
β- process corresponds to Eq. (4), for the parameters given in Table 3. (b) Variation of dielectric strength (Δε) of α- and α’- processes with xw, at the temperature shown in the figure.

Page 10 of 14
Volume 7 • Issue 6 • 1000493Pharm Anal ActaISSN: 2153-2435 PAA, an open access journal
Citation: Saini MK, Murthy SSN (2016) Acetaminophen, Methocarbamol, Guaifenesin and Mephenesin in Propylene Glycol: Solubility and Phase Behaviour for Use in Medical Industry. Pharm Anal Acta 7: 493. doi:10.4172/2153-2435.1000493
1000/ T (K)
3.2 3.6 4.0 4.4 4.8 5.2 5.6 6.0 6.4 6.8
log
f m (H
z)
-4
-2
0
2
4
6
8
10xw = 1, curve 1 xw = 0.7, curves 2, 2'xw = 0.5, curves 3, 3'xw = 0.3, curves 4, 4'xw = 0.1, curves 5, 5'xw = 0, curve 6'
1 2
34
2'
3' 4' 5' 6'
β5
xw
0.0 0.2 0.4 0.6 0.8 1.00
10
20
30
40
T = 240 K
6'
5'
4'
3'
2'
1
2345
(a) PG + GFN
(b) PG + GFN
α'
α
∆ε
Figure 9: PG + GFN binary mixture (a) Arrhenius diagram depicting the α- (curves 1 - 5), α’- (curves 2’ - 6’) and β- processes, where xw = 0 corresponds to neat PG [33] and xw = 1 corresponds to neat GFN [16]. The thick line along the α- and α’- processes corresponds to Eq. (3) (for fm < 10
6 Hz), and that along the β- process
corresponds to Eq. (4), for the parametersgiven in Table 3. (b) Variation of dielectric strength (Δε) of α- and α’- processes with xw, at the temperature shown in the figure.

Page 11 of 14
Volume 7 • Issue 6 • 1000493Pharm Anal ActaISSN: 2153-2435 PAA, an open access journal
Citation: Saini MK, Murthy SSN (2016) Acetaminophen, Methocarbamol, Guaifenesin and Mephenesin in Propylene Glycol: Solubility and Phase Behaviour for Use in Medical Industry. Pharm Anal Acta 7: 493. doi:10.4172/2153-2435.1000493
1000/T (K)
3.2 3.6 4.0 4.4 4.8 5.2 5.6 6.0 6.4
log
f m (H
z)
-4
-2
0
2
4
6
8
10xw = 1, curve 1xw = 0.8, curves 2, 2'xw = 0.5, curves 3, 3'xw = 0.3, curves 4, 4'xw = 0.1, curves 5, 5'xw = 0, curve 6'
β
1 2
2'3
3'
4
4'
5
5'6'
xw
0.0 0.2 0.4 0.6 0.8 1.00
10
20
30
40 T = 240 K
1
6'
5'
4'
3'
2'
2345
α'
α
(a) PG + MP
(b) PG + MP
∆ε
Figure 10: PG + MP binary mixture; (a) Arrhenius diagram depicting the α- (curves 1- 5), α’- (curves 2’ - 6’) and β- processes, where xw = 0 corresponds to neat PG [33] and xw = 1 corresponds to neat MP [15]. The thick line along the α- and α’- processes corresponds to Eq. (3) (for fm < 106 Hz), and that along the β- processes corresponds to Eq. (5), for the parameters given in Table 3. (b) Variation of dielectric strength (Δε) of α- and α’- processes with xw, at the temperature shown in the figure.

Page 12 of 14
Volume 7 • Issue 6 • 1000493Pharm Anal ActaISSN: 2153-2435 PAA, an open access journal
Citation: Saini MK, Murthy SSN (2016) Acetaminophen, Methocarbamol, Guaifenesin and Mephenesin in Propylene Glycol: Solubility and Phase Behaviour for Use in Medical Industry. Pharm Anal Acta 7: 493. doi:10.4172/2153-2435.1000493
T (K
)
160
200
240
280Tg(d), -
- process
Tg(d), ' process
T (K
)
160
200
240
280
Tg(d), - process
Tg(d), ' - process
T (K
)
160
200
240 Tg(d), - process
Tg(d), ' - process
xw
0.0 0.2 0.4 0.6 0.8 1.0
T (K
)
160
200
240
Tg(d), - process
Tg(d), ' - process
(a) PG + ACT
(b) PG + ML
(c) PG + GFN
(d) PG + MP
Tg (end) (DSC)
Tg (end) (DSC)
Tg (end) (DSC)
Tg (end) (DSC)
Tg (onset) (DSC)
Tg (onset) (DSC)
Tg (onset) (DSC)
Tg (onset) (DSC)
αα
αα
αα
αα
Figure 11: The variation of Tg (d) of α- and α’- processes, with weight fraction (xw) of drug samples, is shown, where, Tg (d) is the temperature at which fm = 10-3 Hz. The dotted lines correspond to Tg (onset) (DSC) and Tg (end) (DSC) for supercooled binary liquid mixtures.

Page 13 of 14
Volume 7 • Issue 6 • 1000493Pharm Anal ActaISSN: 2153-2435 PAA, an open access journal
Citation: Saini MK, Murthy SSN (2016) Acetaminophen, Methocarbamol, Guaifenesin and Mephenesin in Propylene Glycol: Solubility and Phase Behaviour for Use in Medical Industry. Pharm Anal Acta 7: 493. doi:10.4172/2153-2435.1000493
higher than that of a small group reorientation such as pure –OH rotation in alcohols [23,32-37]. This gives an indication that sub– Tg process occurred in binary mixtures are due to some internal degree of freedom involving larger group than the size of –OH, and may not be Johari – Goldstein (JG) type, as discussed in detail in our earlier publications [15,16] dealing with pure drug samples.
ConclusionThe concentration dependence of Tg (onset) measured from
DSC scans of supercooled binary liquids studied here, tempts one to think that these liquids are homogenous as the Tg (onset) appears to follow mixture rule (Equation 5), but on closer examination the DSC scans are found to be broader for intermediate concentrations. Dielectric spectroscopy of these mixtures reveals two well-separated relaxation processes, designated as α– and α’– processes, indicating the microheterogeneity in these mixtures. Shown in Figure 11 is the variation of dielectric glass transition temperature (Tg(D)) of α– and α’– processes (defined as the temperature which corresponds to an fm value of 10-3 Hz) with concentration, along with the values of Tg (onset) (DSC) and Tg (end) (DSC). This figure clearly reveals that the temperature broadening of DSC curves in the glass transition region is due to a superposition of two glass transition events realized as α– and α’– processes in the dielectric measurements. The two primary processes namely α– and α’– processes can be attributed to phase separated liquid regions rich in pharmaceutical and PG respectively.
Heterogeneity in these hydrogen bonded liquids may not be very surprising because the molecular weight of PG (76.10 g/mol), and hence the size of the molecule of PG is very much different from that of the drug samples (experimental section 2.1). In this context, it is interesting to note that ΔTg at intermediate concentration shown in Figure 2 is greater for PG+ML system, where the difference in molecular weights between the components of the binary liquid is maximum among the four systems studied. Some knowledge of the dipole moment (μ0) of these samples is necessary to understand the dielectric strength variation shown in Figure 7b-10b. Unfortunately, experimental values of μ0 are not available for neat drugs and the values estimated using density functional theory (DFT) are found to be very unreliable for the purpose of calculations, as discussed in our previous publication [15]. However, it is interesting to note that the discomfort experienced by patients, administrated with the liquid drugs intravenously where PG is treated as excipient [2,6-9], may be due to the above-observed
Sample (xw=0.3) Process
Primary Process Secondary Process
VFT parameters (Equation (3) Arrhenius parameters (Equation (4)
log f0,α(Hz) B (K) T0 (K)* log f0 (Hz) E (kJ/mol)
PG+ACTα – 12.9 2065 139.9 - -α'– 17.1 3493 118.5 - -β – - - - 14.4 38.2
PG+MLα – 13.4 2158 140 - -α'– 13.3 1926 132.8 - -β – - - - 14.6 39.4
PG+GFNα – 18.8 5736 76.2 - -α'– 21.9 6793 63 - -β – - - - 14.1 40
PG+MPα – 21.5 6462 74 - -α'– 24.3 7513 64 β – 11.3 32.9
*T0 values have an error of (±) 5% due to the short range of data points.Table 3: Details of various processes in the binary mixture of propylene glycol for a particular concentration xw=0.3, revealed in Figure 4.
heterogeneity.
Acknowledgement
The authors like to thank Department of Science and Technology (DSC) & University Grants Commission (UGC), Govt. of India for the financial support.
References
1. Satcher D (1997) Toxicological profile for ethylene glycol and propylene glycol, U.S. Department of health and human services.
2. Doenicke A, Nebauer AE, Hoernecke R, Roizen MF, Mayer M (1992) Osmolalities of Propylene Glycol-Containing Drug Formulations for Parenteral Use. Should Propylene Glycol Be Used as a Solvent? Anesth Analg 75: 431-435.
3. Zar T, Graeber C, Perazella MA (2007) Recognition, Treatment and Prevention of Propylene Glycol Toxicity. Semin Dial 20: 217-219.
4. Wilson KC, Reardon C, Theodore A C, Harrison W (2005) Propylene Glycol Toxicity: A Severe Iatrogenic Illness in ICU Patients Receiving IV Benzodiazepines: A Case Series and Prospective, Observational Pilot Study. Chest 128: 1674-1681.
5. Soltanpour S, Jouyban A (2010) Solubility of acetaminophen and ibuprofen in polyethylene glycol 600, propylene glycol and water mixtures at 25°C. J Mol Liq 155: 80-84.
6. Strickley RG (2004) Solubilizing Excipients in Oral and Injectable Formulations. Pharm Res 21: 201-230.
7. Jiménez J, Martínez F (2006) Temperature Dependence of the Solubility of Acetaminophen in Propylene Glycol + Ethanol Mixtures. J Sol Chem 35: 335-352.
8. Mercado KC, Rodriguez GA, Delgada DR, Martinez F (2012) Solution thermodynamics of methocarbamol in some ethanol + water mixtures. Quim Nova 35: 1967-1972.
9. Mani N, Jun HW, Beach JW, Nerurkar J (2003) Solubility of guaifenesin in the presence of common pharmaceutical additives. Pharm Dev Technol 8: 385-396.
10. Rodrigues AC, Viciosa MT, Dane F, Correia NT (2014) Molecular Mobility of Amorphous S-Flurbiprofen: A Dielectric Relaxation Spectroscopy Approach. Mol Pharm 11: 112-130.
11. Craig DQM, Royall PG, Kett VL, Hopton ML (1999) The relevance of the amorphous state to pharmaceutical dosage forms: glassy drugs and freeze-dried systems. Int J Pharm 179: 179-207.
12. Shamblin SL, Tang X, Chang L, Hancock BC, Pikal MJ (1999) Characterization of the Time Scales of Molecular Motion in Pharmaceutically Important Glasses. J Phys Chem B 103: 4113-4121.
13. Kaushal AM, Gupta P, Bansal AK (2004) Amorphous Drug Delivery Systems: Molecular Aspects, Design, and Performance. Crit Rev Ther Drug Carrier Syst 21: 133-193.

Page 14 of 14
Volume 7 • Issue 6 • 1000493Pharm Anal ActaISSN: 2153-2435 PAA, an open access journal
Citation: Saini MK, Murthy SSN (2016) Acetaminophen, Methocarbamol, Guaifenesin and Mephenesin in Propylene Glycol: Solubility and Phase Behaviour for Use in Medical Industry. Pharm Anal Acta 7: 493. doi:10.4172/2153-2435.1000493
14. Hancock BC, Shamblin SL, Zografi G (1995) Molecular mobility of amorphous pharmaceutical solids below their glass transition temperatures. Pharm Res12: 799-806.
15. Saini MK, Murthy SSN (2014) Study of glass transition phenomena in thesupercooled liquid phase of methocarbamol , acetaminophen and mephenesin. Thermochim Acta 575: 195-205.
16. Saini MK, Murthy SSN (2015) Glass Formation in Binary Solutions ofAcetaminophen with Guaifenesin and Mephenesin. J Sol Chem 44: 1723-1748.
17. Etzweiler F, Senn E, Schmidt WH (1995) Method for measuring aqueoussolubilities of organic compounds. Anal Chem 67: 655-658.
18. Murthy SSN, Tyagi M (2002) Experimental study of the high-frequencyrelaxation process in monohydroxy alcohols. J Chem Phys 117: 3837-3847.
19. Preuß M, Gainaru C, Heckscher T, Bauer S, Dyre JC, et al. (2012) Experimental studies of Debye-like process and structural relaxation in mixtures of 2-ethyl-1-hexanol and 2-ethyl-1-hexyl bromide. J Chem Phys 137: 144502-144510.
20. Goresy ElT, Bohmer R (2008) Diluting the hydrogen bonds in viscous solutions of n-butanol with n-bromobutane: A dielectric study. J Chem Phys 128: 154520-154528.
21. Murthy SSN (1992) Molecular Dynamics in Supercooled Liquids: A study of the relaxation in binary solutions. Journal of Molecular Liquids 51: 197-217.
22. Wang J, Angell CA (1976) Glass Structure: by Spectroscopy, Marcel Dekker,Ed. New York.
23. McCrum NG, Read DE, Williams G (1967) Inelastic and dielectric effects inpolymeric solids. New York: John Wiley and Sons.
24. Jonscher AK (1983) Dielectric relaxation in solids, London, Chelsea.
25. Hamon BV (1952) An approximation method for deducing dielectric loss factorfrom direct-current measurements. Inst Monogr 27: 151-155.
26. Kita Y, Koizumi N (1975) Remarks on the hamon approximation. Adv Mol Relax Process 7: 13-20
27. Havriliak S, Negami S (1966) A Complex Plane Analysis of α- Dispersions in Some Polymer Systems. J Pol Sci Part C 117: 99-117.
28. Murthy SSN (1997) Phase Behavior of the Supercooled Aqueous Solutionsof Dimethyl Sulfoxide, Ethylene Glycol, and Methanol As Seen by DielectricSpectroscopy. J Phys Chem 101: 6043-6049.
29. Kao KC (2004) Dielectric phenomena in solids, Electric polarization andrelaxation. San Diego. California: Elsevier Acadmic Press.
30. Hill NE, Vaughan WE, Price AH, Davies M (1969) Dielectric Properties andMolecular Behaviour. London: Van Nostrand Reinhold.
31. Murthy SSN, Kumar D (1993) Glass Formation in Organic Binary LiquidsStudied using Differential Scanning Calorimetry. J Chem Soc Faraday Trans89: 2423-2427.
32. Usacheva TM, Lifanova NV, Zhuravlev VI, Matveev VK (2010) A DielectricStudy of the Structure of Propylene Glycol. Russ J Phys Chem A 84: 1194-1201.
33. Murthy SSN (2000) Experimental Study of the Dynamics of Water and thePhase behavior of the Supercooled Aqueous Solutions of Propylene Glycol,Glycerol, Poly(ethylene glycol)s, and Poly(vinylpyrrolidone). J Phys Chem B104: 6955-6962.
34. Reid CJ, Evans MW (1982) Dielectric and far infrared study of solutions in theglassy state from 100 Hz to 10 THz: Discovery and characterization of theuniversal γ process. J Chem Phys 76: 2576 -2584.
35. Gangasharan, Murthy SSN (1993) Study of α, β, and γ relaxation processes in some supercooled liquids and supercooled plastic crystals. J Chem Phys 99:9865-9873.
36. Shahin Md, Murthy SSN (2005) Sub-Tg relaxations due to dipolar solutes innonpolar glass-forming solvents. J Chem Phys 122: 14507-14522.
37. Wu L, Nagel SR (1992) Secondary relaxation in o-terphenyl glass. Phys RevB 46: 198-200.
![Pharmaceutica httpd.doi.or.. e Analytica Acta · PDF file(2006) [24] reviewed the phytochemical profile of Ganoderma and considered it to be a therapeutic fungal biofactory [24]. Wang](https://img.dokumen.tips/doc/110x75/5a8a0d687f8b9a085a8badc6/pharmaceutica-httpddoior-e-analytica-acta-2006-24-reviewed-the-phytochemical.jpg)