Embed Size (px)
Citation preview

Type 1 Diabetes Mellitus
Gregory E. Peterson, DO, FACP
The Diabetes Center
Diagnostic & Critical Care Medicine, PC

Objectives for Iowa School Nurses Type 1 Diabetes Mellitus
Ketonuria
Incretin therapy in diabetes management
Types of insulin: Analog insulin in basal and bolus therapy
Strategies to optimize blood glucose levels
Hypoglycemia and Hyperglycemia
Explore tools to management: insulin pens, insulin pump, blood glucose meters, blood glucose sensors

Type 1 Diabetes Mellitus
Autoimmune destruction of the insulin-producing ß-cells in the islets of Langerhans
In the new classification of diabetes, immune mediated type 1 diabetes is called type 1A
Some rarer cases in which an autoimmune etiology cannot be determined (type 1B); said to be idiopathic.

Diabetes Mellitus in children
The clinical diagnosis of diabetes in a previously healthy child requires a high index of suspicion. The earliest symptoms are related to hyperglycemia.
Older children and adolescents typically present with polyuria (due to the glucose osmotic diuresis), polydipsia (due to the increased urinary losses), and fatigue. Other findings include weight loss, nocturia (with or without secondary enuresis), daytime enuresis, and vaginal or cutaneous moniliasis

Diabetes Mellitus in children Children with weight loss, anorexia,
vomiting, and abdominal pain, which at times can mimic appendicitis or gastroenteritis should be considered
DKA
Type 1 Diabetes Mellitus
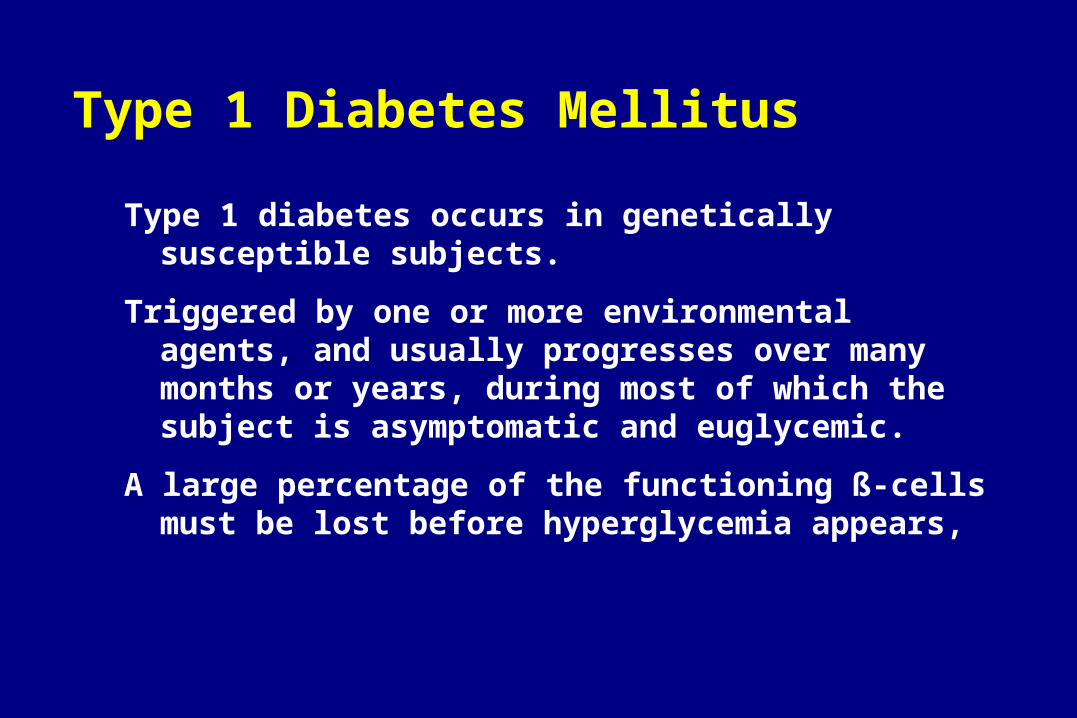
Type 1 diabetes occurs in genetically susceptible subjects.
Triggered by one or more environmental agents, and usually progresses over many months or years, during most of which the subject is asymptomatic and euglycemic.
A large percentage of the functioning ß-cells must be lost before hyperglycemia appears,

Type 1 Diabetes Mellitus
Research tools, not for clinical practice:
1. Genetic Markers
2. Immunologic Markers
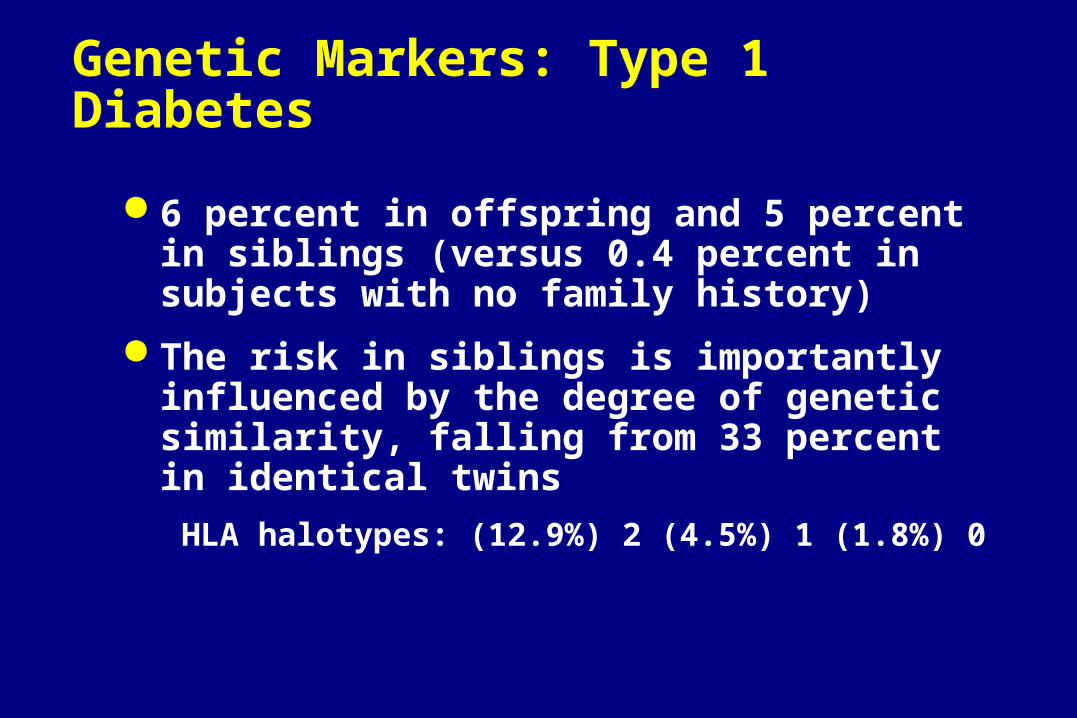
Genetic Markers: Type 1 Diabetes
6 percent in offspring and 5 percent in siblings (versus 0.4 percent in subjects with no family history)
The risk in siblings is importantly influenced by the degree of genetic similarity, falling from 33 percent in identical twins
HLA halotypes: (12.9%) 2 (4.5%) 1 (1.8%) 0

Immunologic Markers
islet-cell antibodies (ICA)
insulin autoantibodies (IAA)
antibodies to glutamic acid decarboxylase (GAD)

Immunologic Marker for Type 1 DM
40% within five years versus 3% with single auto-antibodies).
Progression to multiple islet auto-antibodies was fastest in children who developed their first autoantibody by age two years.
Children with the earliest evidence of autoimmunity are at greatest risk for and progress more quickly to the development of type 1 diabetes.
Periodic testing for islet auto-antibodies appears to help assess the risk of diabetes in children of parents with type 1 diabetes.
Prevention Recommendations (Research)
Test individuals at risk for type 1 diabetes progression for GAD65 and IA-2 autoantibodies
If they are present and confirmed in a subsequent sample, tests for insulin and islet cell antibodies can be done.
The occurrence of multiple antibodies against islet autoantigens serves as a surrogate marker of disease in primary or secondary intervention strategies aimed at halting the disease process.
Genetic typing for susceptibility or protective HLA alleles can also be performed. This information can be used to ascertain if a high-risk subject is eligible to be entered into an ongoing prevention trial.

Ketonuria
Always check for ketones in urine with blood glucose over 250mg/dL
Presence reflects abnormal metabolism
Key feature of DKA: Hyperventilation
Life threatening event

Ketonuria1. Children with diabetes will develop ketosis if they omit
insulin injections. Untreated ketosis results in nausea, vomiting, abdominal pain, rapid deep breathing, dehydration, lethargy, and ultimately, ketoacidosis.
2. Ketones should be tested if the child has signs of a systemic illness, such as fever and, especially, vomiting, even if the blood glucose is normal.
3. The presence of moderate or large ketones will require extra dosing of insulin to reverse ketosis.
4. Contact parents/medical team.
5. If the child is not vomiting, liberal fluid intake will help prevent dehydration and increase urinary excretion of ketones.
1
3
5
7
9
11
13
15
6 7 8 9 10 11 12
Retinop
Neph
Neurop
Microalb
RE
LA
TIV
E R
ISK
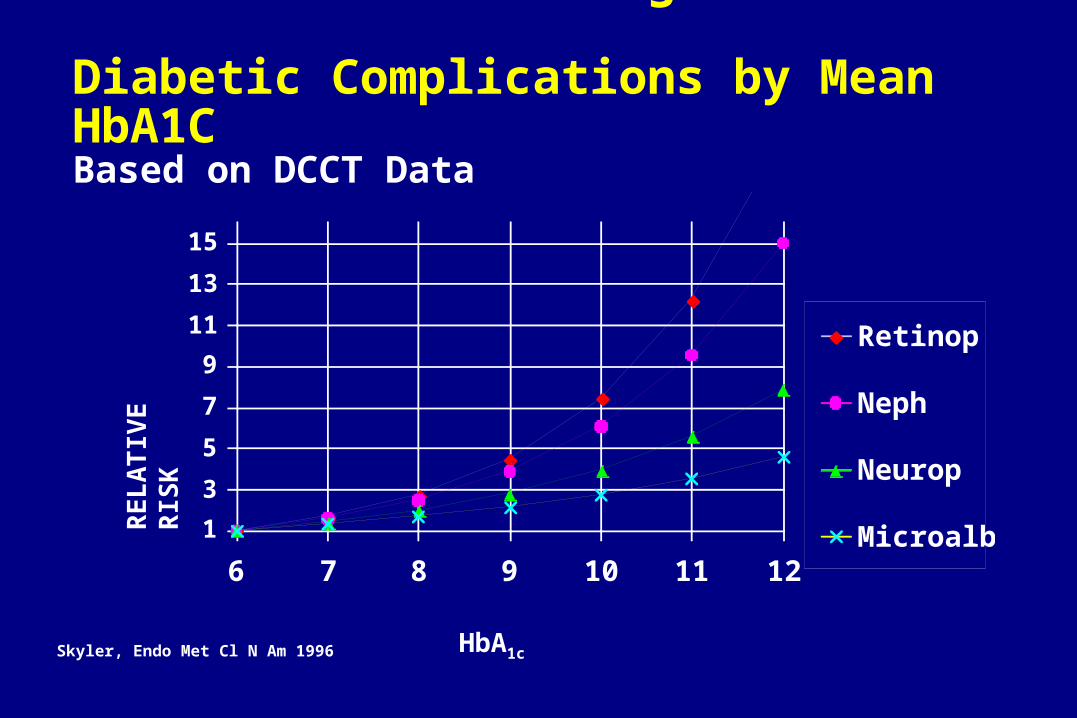
HbA1cSkyler, Endo Met Cl N Am 1996
Relative Risk of Progression of Diabetic Complications by Mean HbA1CBased on DCCT Data

HbA1c and Plasma Glucose
26,056 data points (A1c and 7-point glucose profiles) from the DCCT
Mean plasma glucose = (A1c x 35.6) – 77.3
Post-lunch, pre-dinner, post-dinner, and bedtime correlated better with A1c than fasting, post-breakfast, or pre-lunch
Rohlfing et al, Diabetes Care 25 (2) Feb 2002

ADA / AACE Targets for Glycemic Control
HbA1c < 6.5 %
Fasting/preprandial glucose < 110 mg/dL
Postprandial glucose < 140 mg/dL

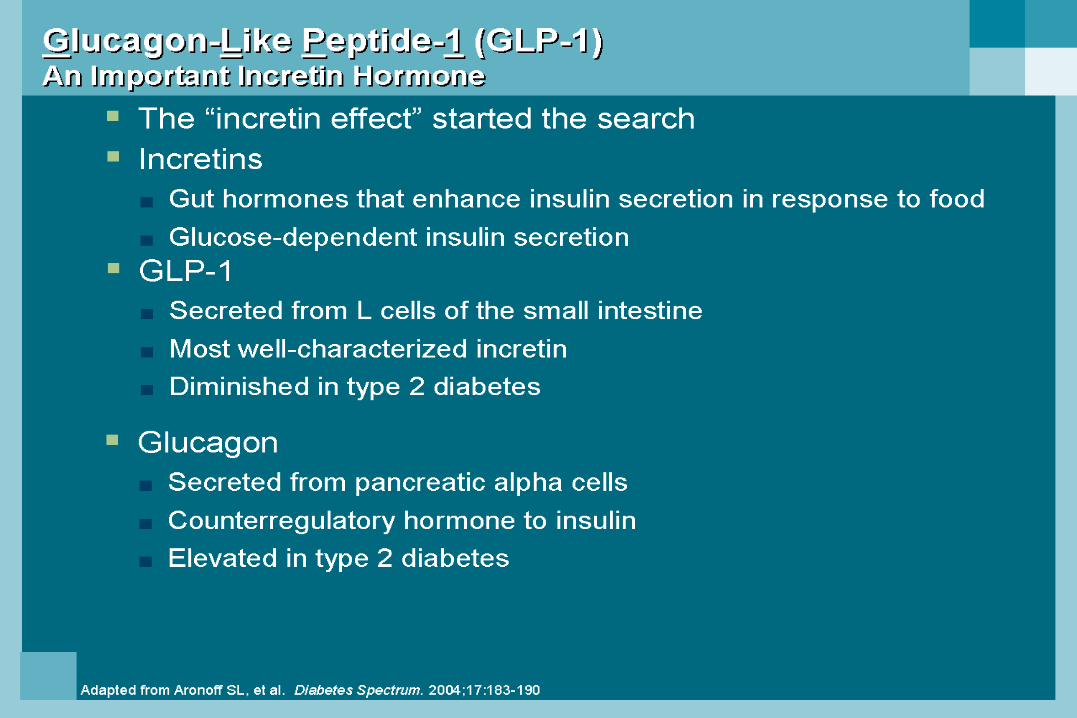
Incretins
Amylin: Pramlinitide
GLP-1
- Exenatide
- Liraglitide

Pramlintide Adjunctive Therapy Offers Long-Term Glycemic Control

EuglycemiaEuglycemia
Healthy Subjects (n = 14)
Beta-CellWorkload
Beta-CellWorkload
Beta-CellResponse
Beta-CellResponse
Beta-CellWorkload
Beta-CellWorkload
Mean (SE)
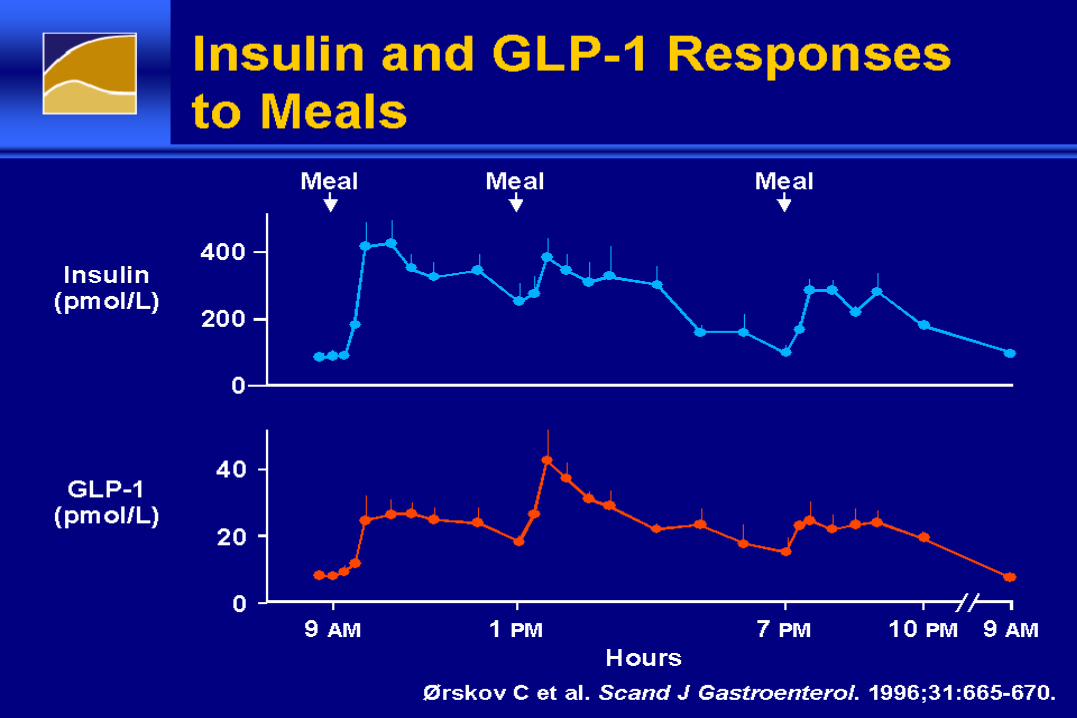
Insulin and GLP-1 Responses to MealsInsulin and GLP-1 Responses to Meals
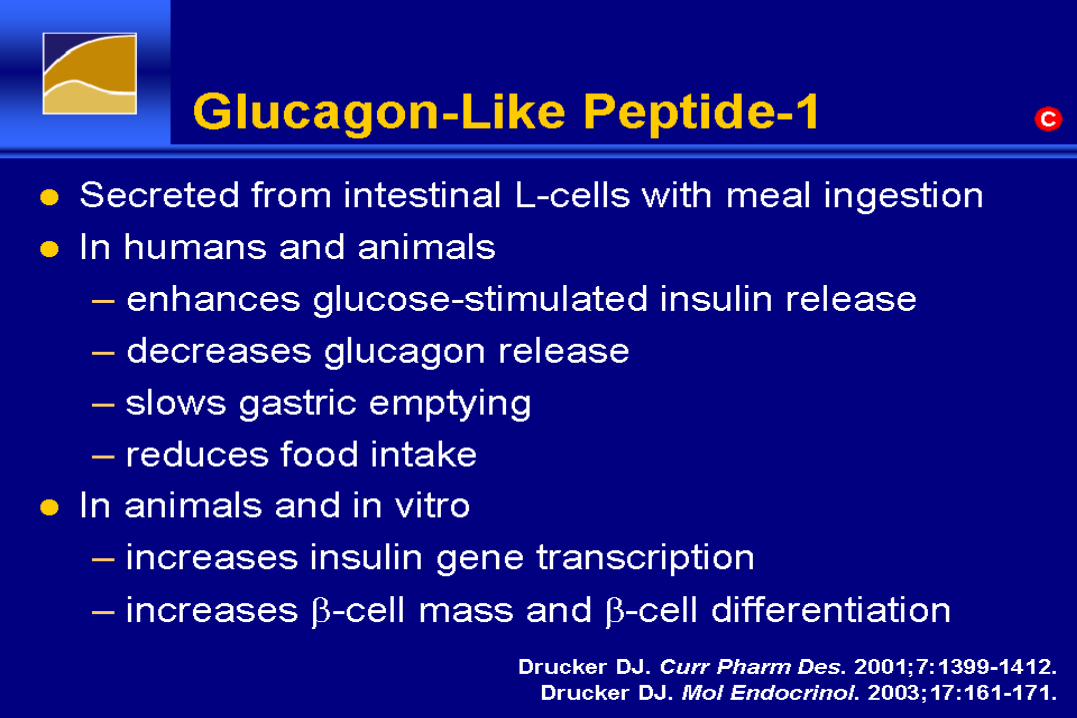
Glucagon-Like Peptide-1Glucagon-Like Peptide-1
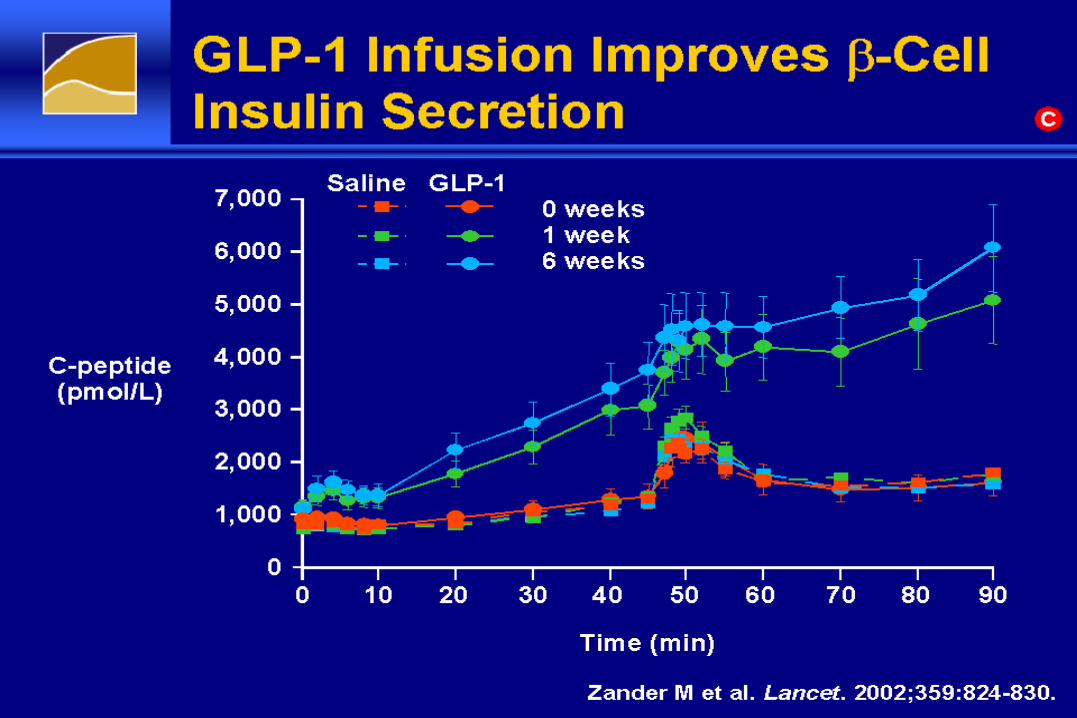
GLP-1 Infusion Improves -Cell Insulin SecretionGLP-1 Infusion Improves -Cell Insulin Secretion

GLP-1 and First-Phase Insulin SecretionGLP-1 and First-Phase Insulin Secretion

Exenatide: Proportion of Patients Achieving A1C ≤7%Exenatide: Proportion of Patients Achieving A1C ≤7%

Exenatide: Effect on the -CellExenatide: Effect on the -Cell
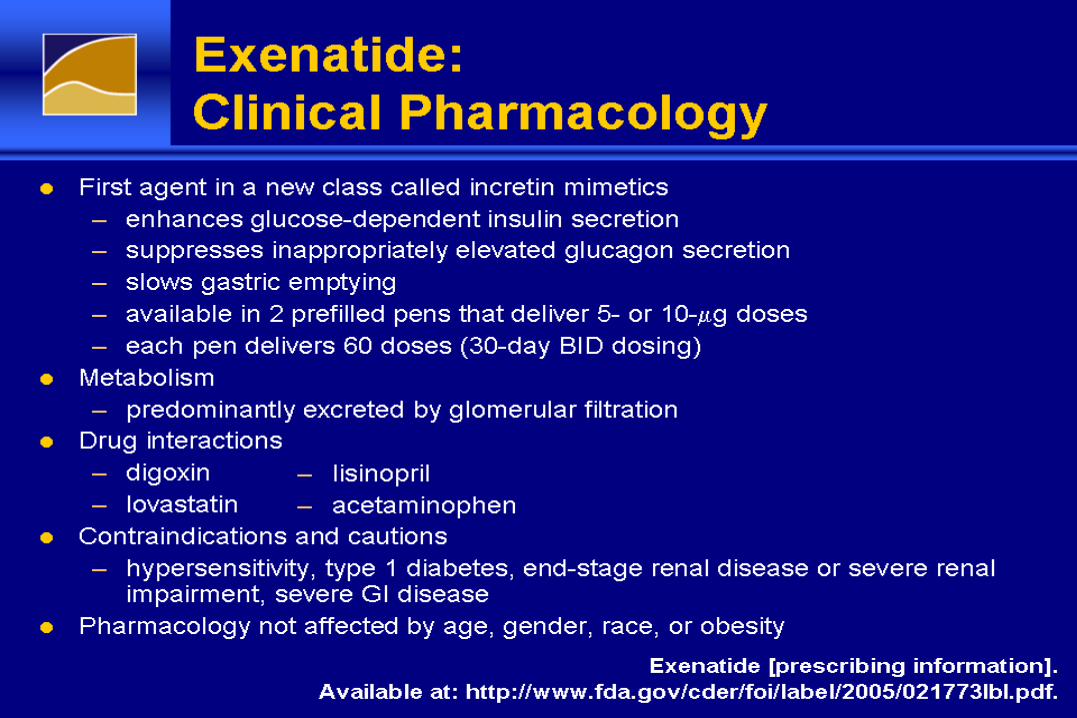
Exenatide: Clinical PharmacologyExenatide: Clinical Pharmacology

ADA/EASD: Glucose-Lowering Interventions as Monotherapy—Step 2 (cont)ADA/EASD: Glucose-Lowering Interventions as Monotherapy—Step 2 (cont)

ADA/EASD: Glucose-Lowering Interventions as Monotherapy—Step 2 (cont)ADA/EASD: Glucose-Lowering Interventions as Monotherapy—Step 2 (cont)

EuglycemiaEuglycemiaEuglycemiaEuglycemia
Healthy Subjects (n = 14)
Beta-CellWorkload
Beta-CellWorkload
Beta-CellResponse
Beta-CellResponse
Beta-CellWorkload
Beta-CellWorkload
HyperglycemiaHyperglycemia
Type 2 Diabetes (n = 12)
Beta-CellWorkload
Beta-CellWorkload
Beta-CellResponse
Beta-CellResponse
Beta-CellWorkload
Beta-CellWorkload
Mean (SE)
The Pathogenesis of DiabetesThe Pathogenesis of DiabetesBeta-Cell Workload Outpaces Beta-Cell ResponseBeta-Cell Workload Outpaces Beta-Cell ResponseThe Pathogenesis of DiabetesThe Pathogenesis of DiabetesBeta-Cell Workload Outpaces Beta-Cell ResponseBeta-Cell Workload Outpaces Beta-Cell Response

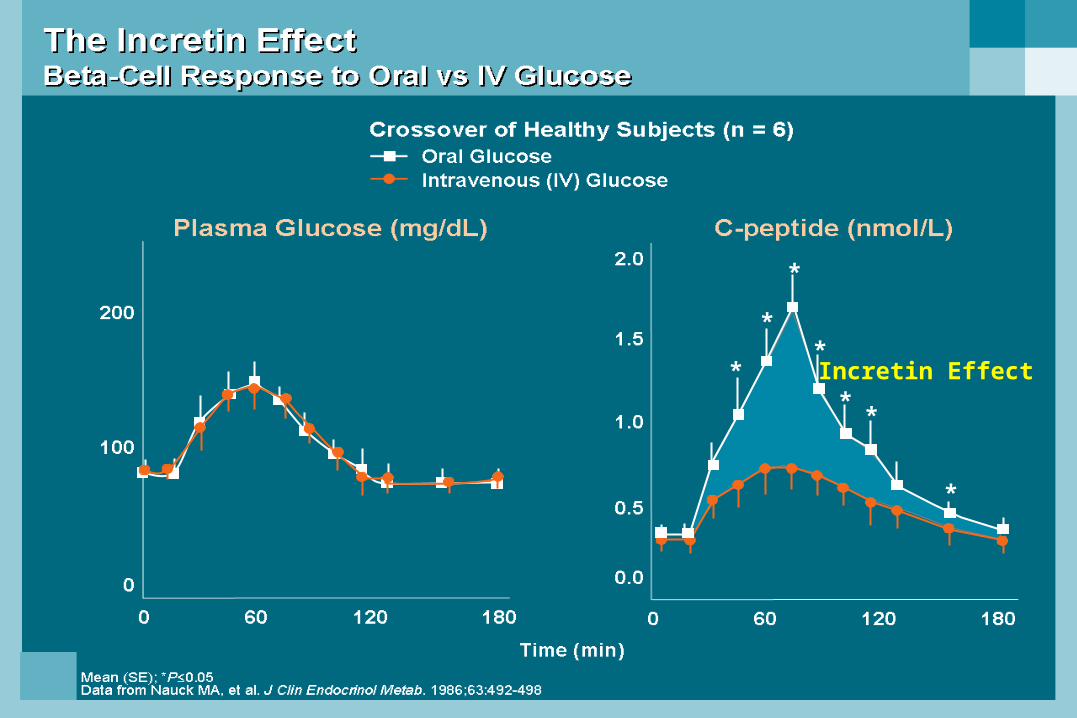
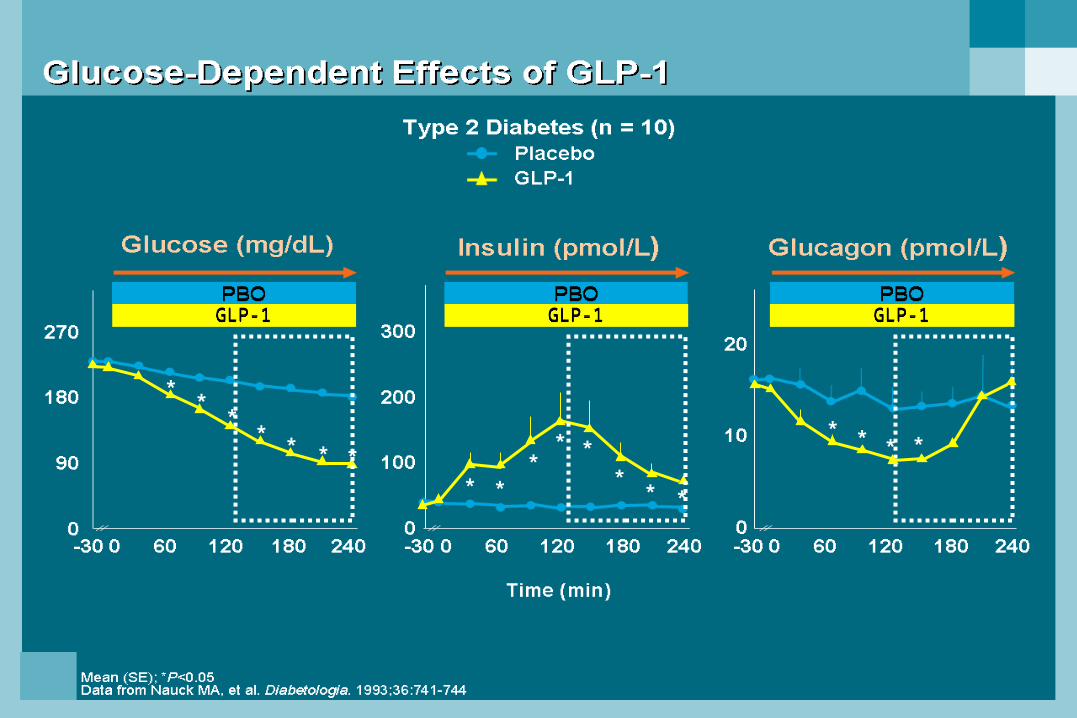
Incretin Effect*
*
*
*
**
*

GLP-1 secreted upon the ingestion of food
*
*
*
*
* * *
*** *
** *
*
** * *
GLP-1GLP-1 GLP-1GLP-1GLP-1GLP-1

GEPeterson,DO,FACP
Exanetide reduced post prandial glucose and glucagon
Exanetide
Exanetide and placebo Exanetide and placeboExanetide and placebo

ADA: Clinical Practice Recommendations. 2008.
Goals of Intensive Diabetes Management
Near-normal glycemia– HbA1c less than 6.5 to 7.0%
Avoid short-term crisis– Hypoglycemia– Hyperglycemia– DKA
Minimize long-term complications
Improve QOL

Comparison of Human Insulins / Analogues
Insulin Onset of Duration ofpreparations action Peak action
Regular 30–60 min 2–4 h 6–10 h
Aspart-Glulisine-Lispro 5–15 min 1–2 h 4–6 h
NPH 1–2 h 4–8 h 10–20 h
Glargine 1–2 h Flat ~24 h
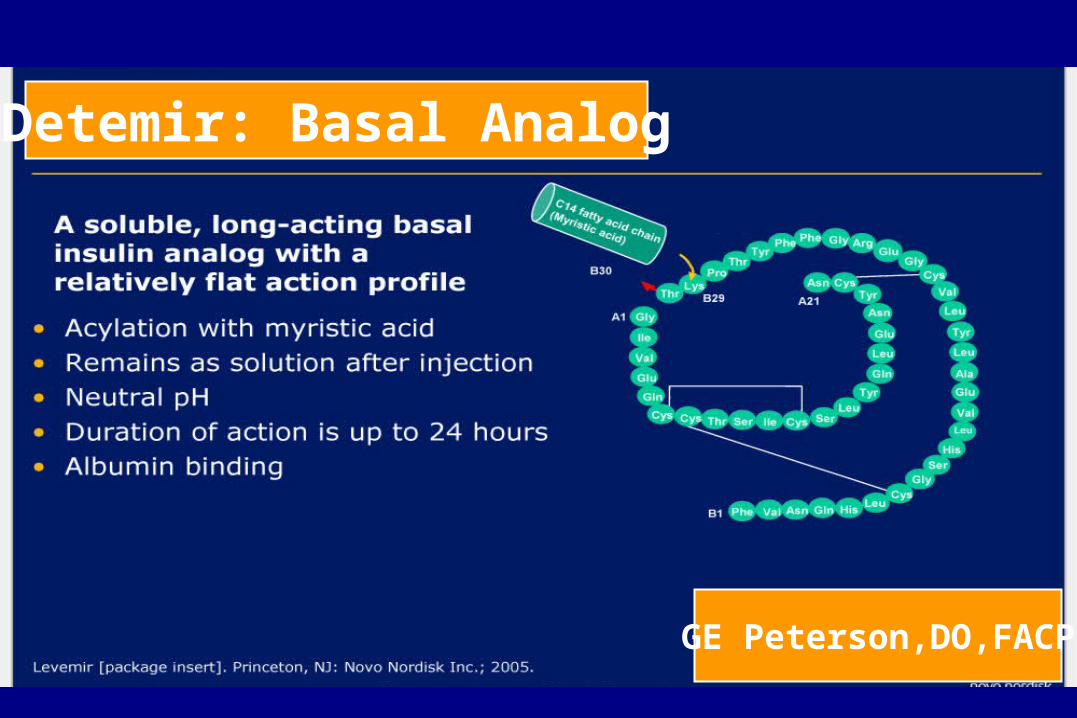
Detemir 30 min Flat 24h
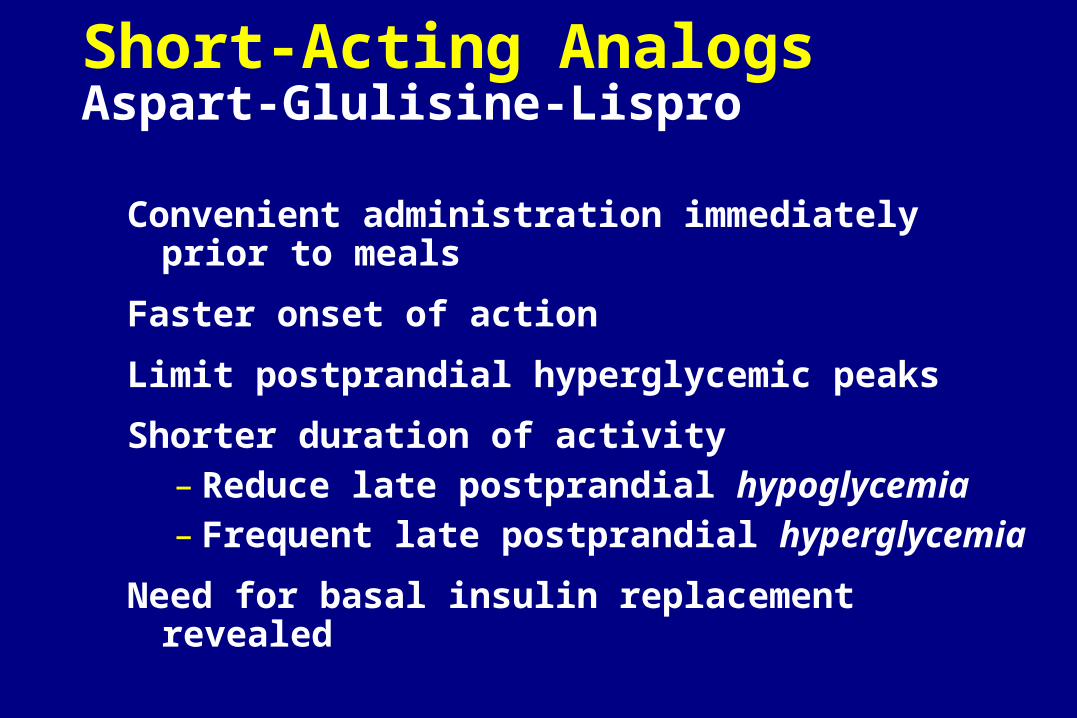
Short-Acting Analogs Aspart-Glulisine-Lispro
Convenient administration immediately prior to meals
Faster onset of action
Limit postprandial hyperglycemic peaks
Shorter duration of activity– Reduce late postprandial hypoglycemia– Frequent late postprandial hyperglycemia
Need for basal insulin replacement revealed

400
350
300
250
200
150
100
MealSC injection
50
00 30 60
Time (min)90 120 180 210150 240
Regular Lispro
500450400350300250
150
50
200
100
00 50 100
Time (min)150 200 300250
Pla
sm
a i
ns
uli
n (
pm
ol/
L)
Pla
sm
a i
ns
uli
n (
pm
ol/
L)
MealSC injection
Heinemann, et al. Diabet Med. 1996;13:625–629; Mudaliar, et al. Diabetes Care. 1999;22:1501–1506.
Short-Acting Insulin Analogs
Regular Aspart
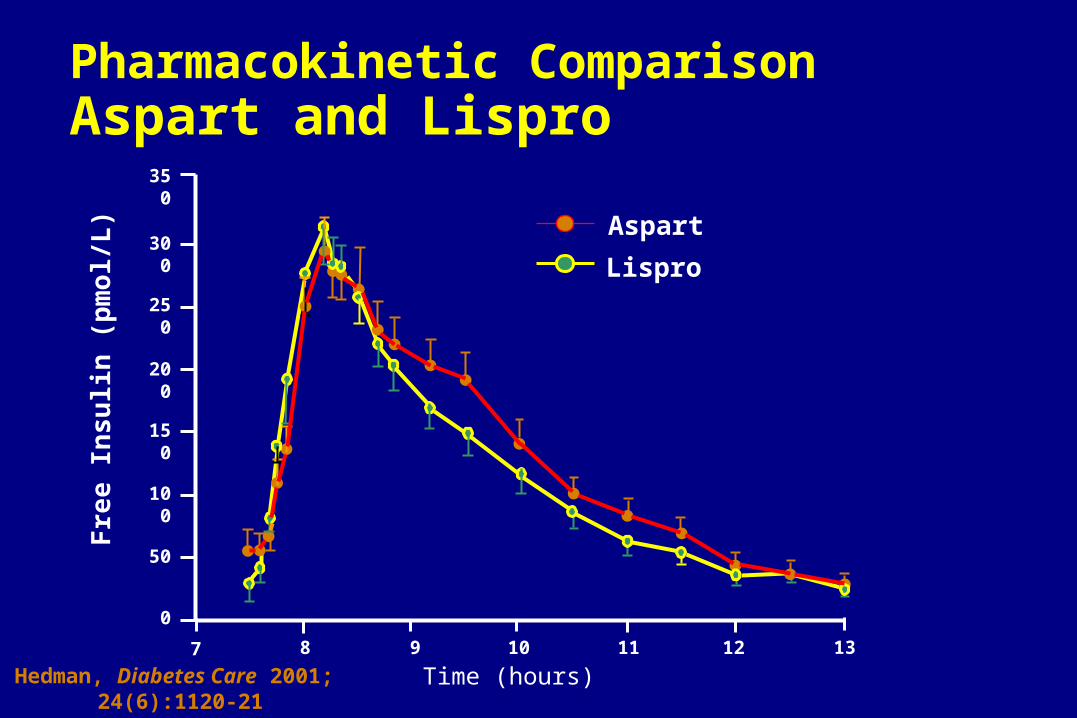
Pharmacokinetic Comparison Aspart and Lispro
300
350
250
200
150
100
50
0
7 8 9 10 11 12 13
Aspart
Lispro
Fre
e In
sulin
(p
mo
l/L)
Time (hours)Hedman, Diabetes Care 2001; 24(6):1120-21

1 5 10 15 20 25 30
1 5 10 15 20Asp
Gly
ArgExtension
Substitution
Arg
Insulin GlargineA New Long-Acting Insulin Analog
Modifications to human insulin chain
– Substitution of glycine at position A21
– Addition of 2 arginines at position B30
Gradual release from injection site
Peakless, long-lasting insulin profile

Lepore, et al. Diabetes. 1999;48(suppl 1):A97.
6
5
4
3
2
1
00 10
Time (h) after SC injection
End of observation period
20 30
GlargineNPH
Glu
cose
uti
lizat
ion
rat
e(m
g/k
g/h
)
Glargine vs NPH Insulin in Type 1 DiabetesAction Profiles by Glucose Clamp

Glucose Infusion Raten = 20 T1DMMean ± SEM
SC insulin
4.0
3.0
2.0
1.0
0
24
20
16
12
8
4
0
0 4 8 12 16 20 24Time (hours)
mg
/kg
/min
µm
ol/k
g/m
in
Lepore M, et al. Diabetes. 2000;49:2142–2148.
NPH
Ultralente
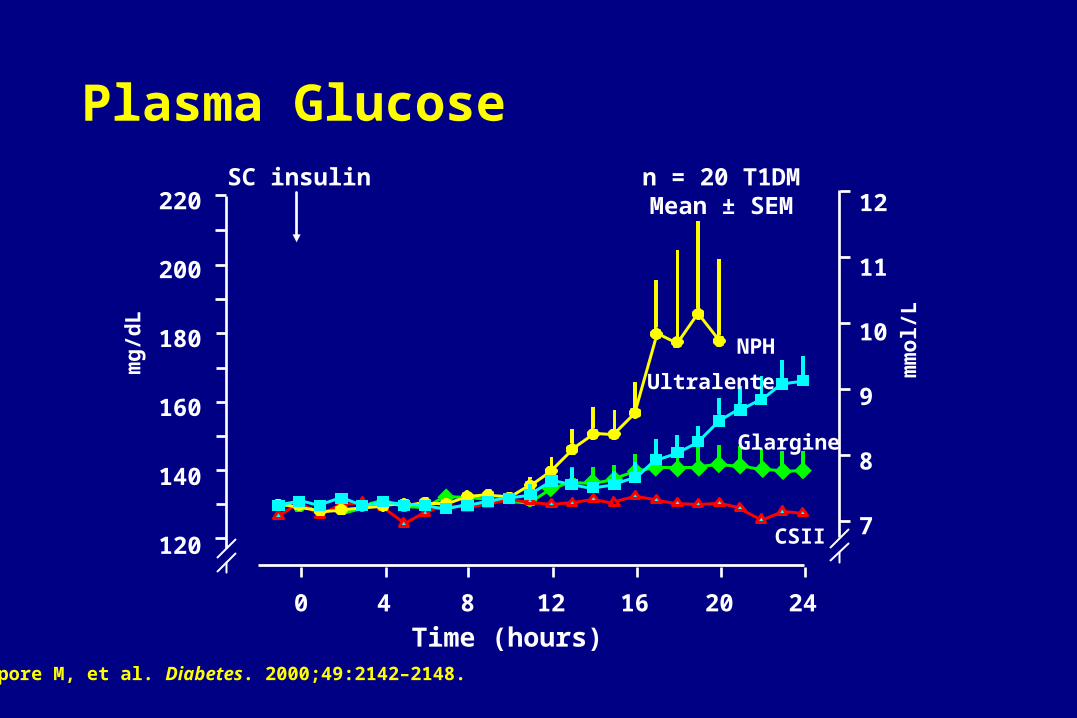
CSII
Glargine
Glargine
Plasma Glucose
Time (hours)
220
200
180
160
140
120
12
11
10
9
8
7
0 4 8 12 16 20 24
mg
/dL
mm
ol/L
Lepore M, et al. Diabetes. 2000;49:2142–2148.
n = 20 T1DMMean ± SEM
SC insulin
NPH
Ultralente
CSII
GE Peterson,DO,FACP
Detemir: Basal Analog

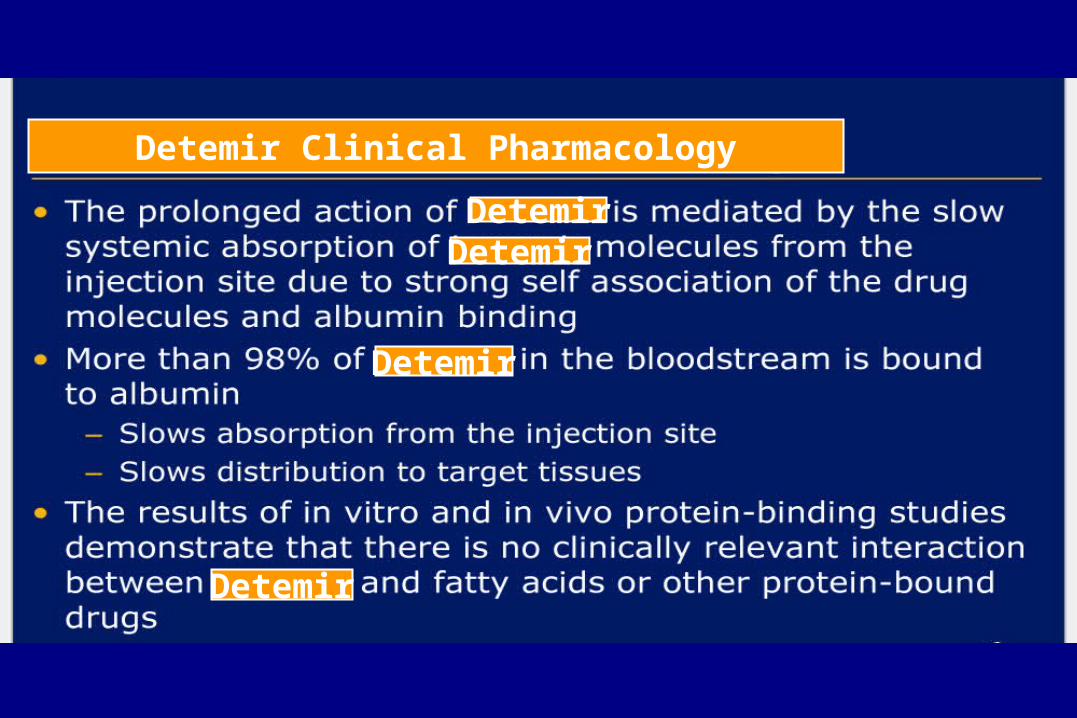
Detemir Clinical Pharmacology
DetemirDetemir
Detemir
Detemir

GE Peterson, DO, FACP
Detemir
Insulin Detemir
GEPeterson,DO,FACP
Detemir
Detemir
GEPeterson,DO,FACP
Insulin Detemir Insulin DetemirInsulin Detemir
Insulin Detemir

GEPeterson,DO,FACP
Insulin Detemir

GEPeterson,DO,FACP
Treatment with basal insulin detemir is associated
Detemir

Overall Summary: Basal Insulin Analogs
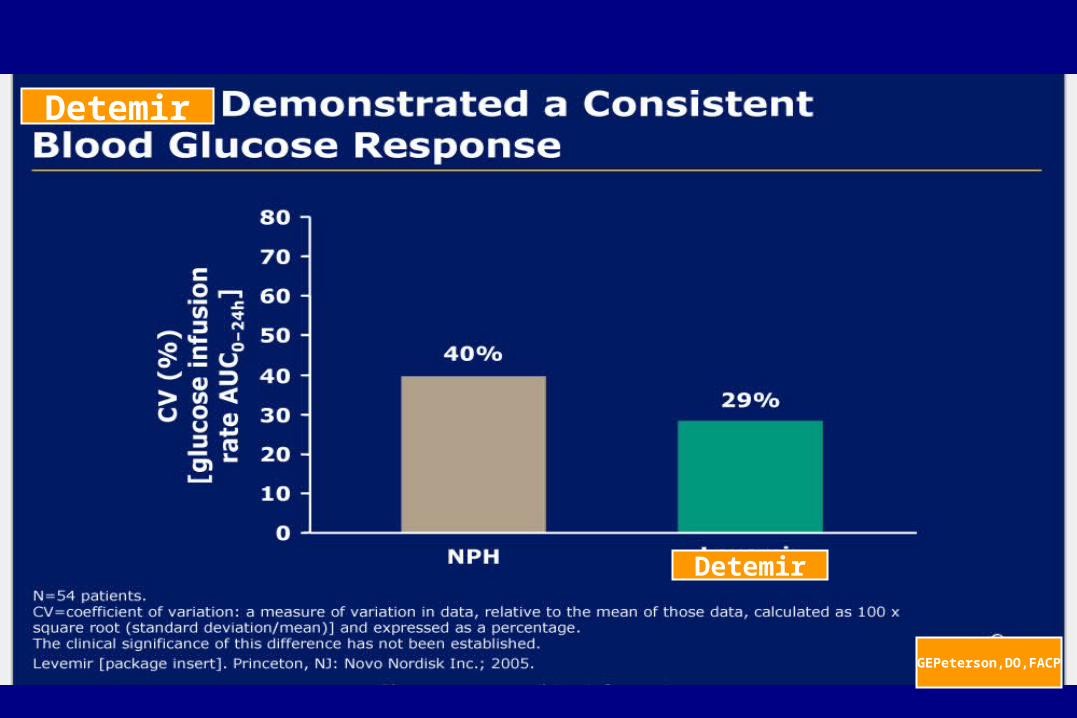
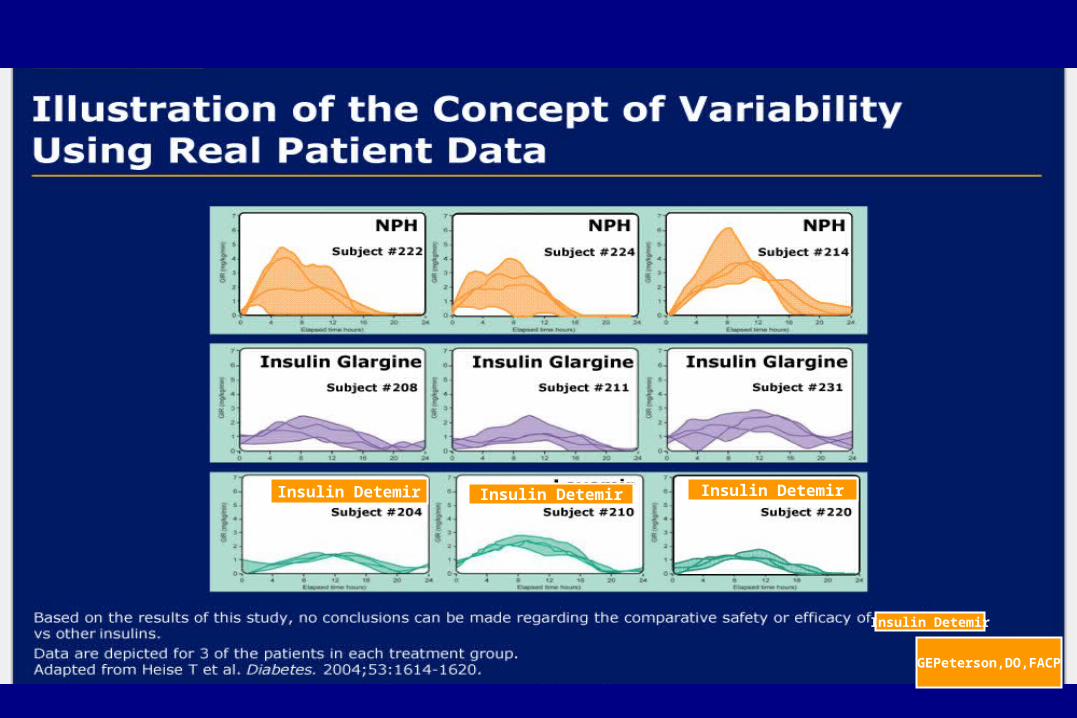
Both insulin detemir and glargine appear to be effective
once daily duration.
Insulin detemir has less variability
Both have comparable glycemic control (FBG)
Insulin detemir appears to have lower risk of nocturnal
hypoglycemic events
Insulin detemir may be associated with less weight gain.
Safety profile similar to that of human insulin

The Basal/Bolus Insulin Concept
Basal insulin– Suppresses glucose production between
meals and overnight– 40% to 50% of daily needs
Bolus insulin (mealtime)– Limits hyperglycemia after meals– Immediate rise and sharp peak at 1 hour – 10% to 20% of total daily insulin requirement
at each meal
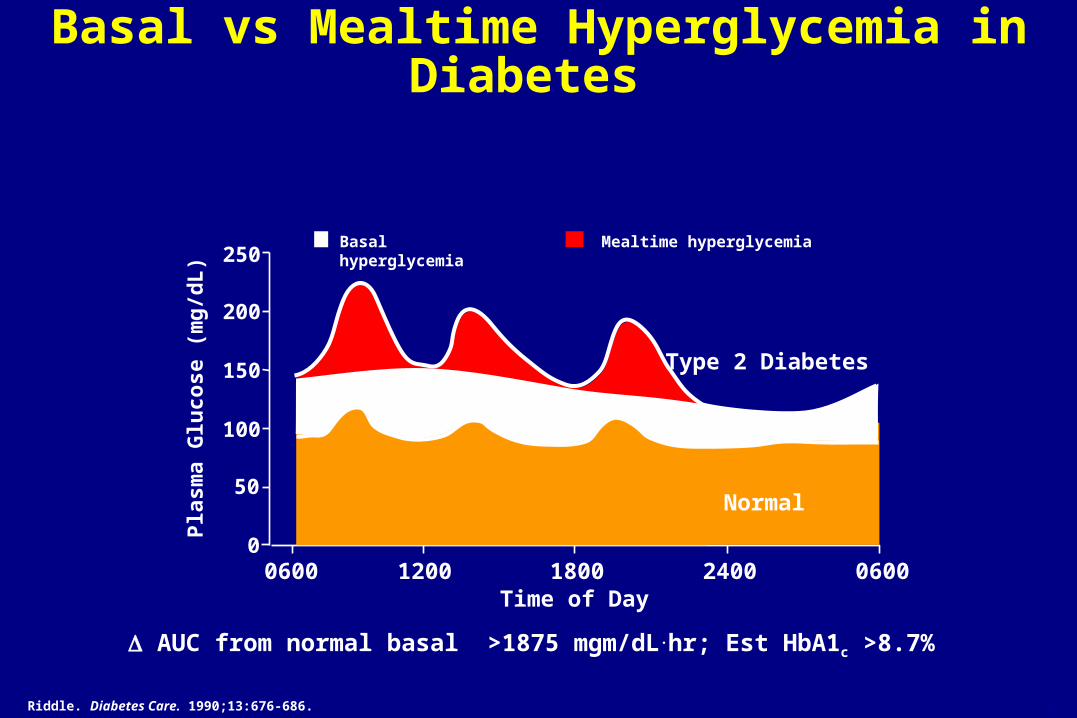
Basal vs Mealtime Hyperglycemia in Diabetes
Riddle. Diabetes Care. 1990;13:676-686.
Pla
sma
Glu
cose
(m
g/d
L)
200
100
00600 1200
Time of Day1800 2400
Type 2 Diabetes
0600
150
250
50
Basal hyperglycemia Mealtime hyperglycemia
6-18
Normal
AUC from normal basal >1875 mgm/dL.hr; Est HbA1c >8.7%

When Basal Corrected
Pla
sma
Glu
cose
(m
g/d
L)
200
100
00600 1200
Time of Day1800 2400 0600
150
250
50
Basal hyperglycemia Mealtime hyperglycemia
6-18
Normal
Basal vs Mealtime Hyperglycemia in Diabetes
AUC from normal basal 900 mgm/dL.hr; Est HbA1c 7.2%

When Mealtime Hyperglycemia Corrected
Pla
sma
Glu
cose
(m
g/d
L)
200
100
00600 1200
Time of Day1800 2400 0600
150
250
50
Basal hyperglycemia Mealtime hyperglycemia
6-18
Normal
Basal vs Mealtime Hyperglycemia in Diabetes
AUC from normal basal 1425 mgm/dL.hr; Est HbA1c 7.9

When Both Basal & Mealtime Hyperglycemia Corrected
Pla
sma
Glu
cose
(m
g/d
L)
200
100
00600 1200
Time of Day1800 2400 0600
150
250
50
Basal hyperglycemia Mealtime hyperglycemia
6-18
Normal
Basal vs Mealtime Hyperglycemia in Diabetes
AUC from normal basal 25 mg/dL.hr; Est HbA1c 6.4%

Glucose Correction Factor
1700 Rule says:
John Smith’s Total Insulin Dose
60 units insulin/day
1700/40= 42
So, 1 unit Short Acting Analog will
lower BG about 40 mg/dl
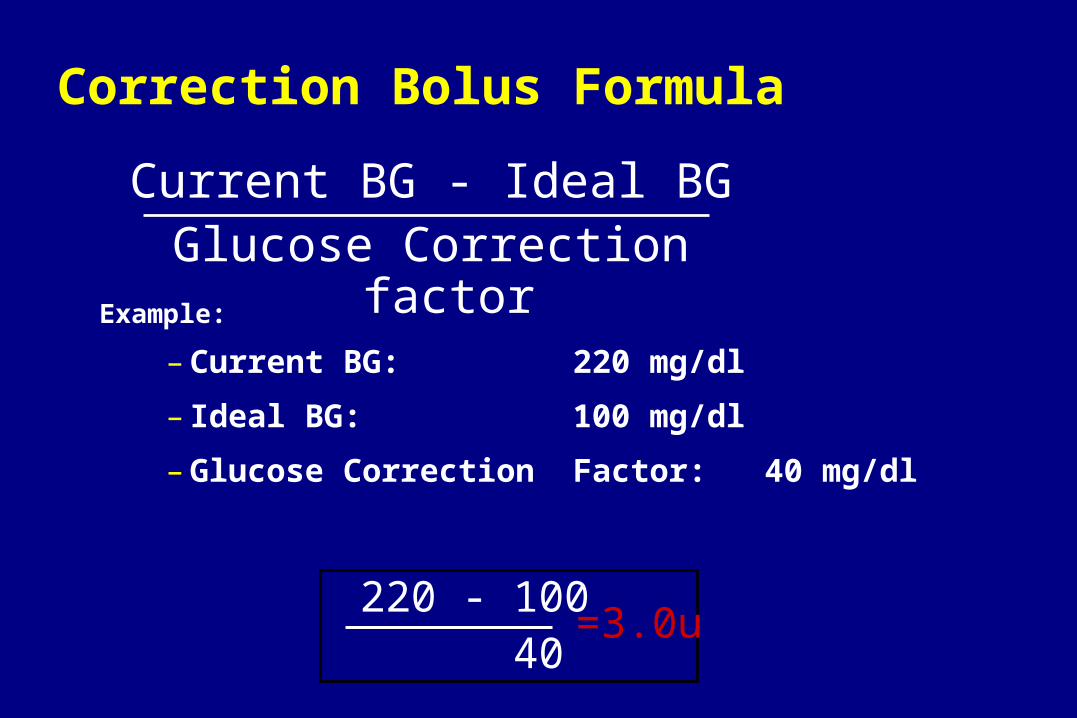
Correction Bolus Formula
Example:
– Current BG: 220 mg/dl
– Ideal BG: 100 mg/dl
– Glucose Correction Factor: 40 mg/dl
Current BG - Ideal BGGlucose Correction factor
220 - 100 40
=3.0u

Intensive Therapy for Type 1 Diabetes
Careful balance of food, activity, and insulin
Daily self-monitoring BG
Patient trained to vary insulin and food
Define target BG levels (individualized)
Frequent contact of patient and diabetes team
Monitoring HbA1c
Basal / Bolus insulin regimen
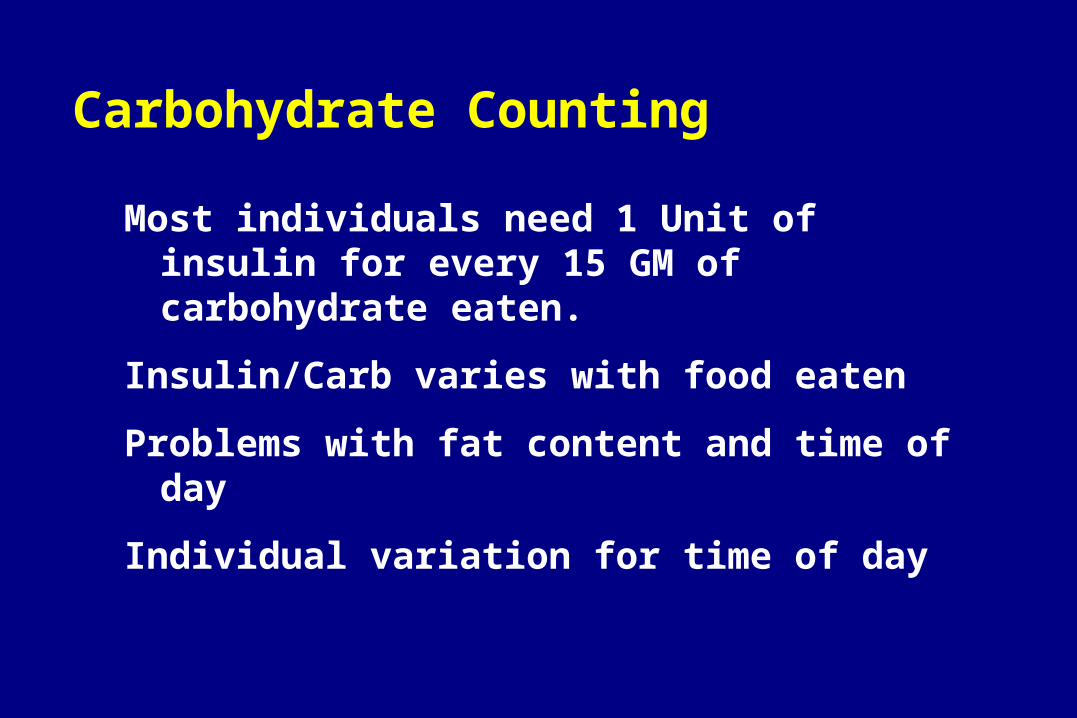
Carbohydrate Counting
Most individuals need 1 Unit of insulin for every 15 GM of carbohydrate eaten.
Insulin/Carb varies with food eaten
Problems with fat content and time of day
Individual variation for time of day

Options in Insulin Therapy
Current
– Multiple injections
– Insulin pump (CSII)
Future
– Implant (artificial pancreas)
– Transplant (pancreas; islet cells)

1.0
0.8
0.6
0
Insulin
Time
Multiple Injection TherapyIntermediate & Short-Acting Insulin Pre-Meal

Injections1.0
0.8
0.6
0
Insulin
Time
Multiple Injection TherapyIntermediate & Short-Acting Insulin Pre-Meal

Injections1.0
0.8
0.6
0
Insulin
Time
Multiple Injection Therapy Intermediate & Short-Acting Insulin Pre-Meal

Case #1: DM 1 on MDI46 year old white male power line supervisor
DM 1 age 40
On MDI: 10 u lispro pre-meal, 20 u NPH HS
HbA1c 7.4%
SMBG avg 124 mg/dL based on 1.9 tests/day (fasting 171 mg/dL, noon 105 mg/dL, pm 125 mg/dL, HS 75 mg/dL)

Case #2: DM 1 on MDILantus (glargine) 20 u HS added in place of NPH
No change in behavior (diet, SMBG frequency)
Seen three months later (8-16-01)
HbA1c 6.3%
SMBG average 104 mg/dL (fasting BG 91 mg/dL, noon 126 mg/dL, pm 116 mg/dL, HS 126 mg/dL
NO HYPOGLYCEMIA
HAPPY
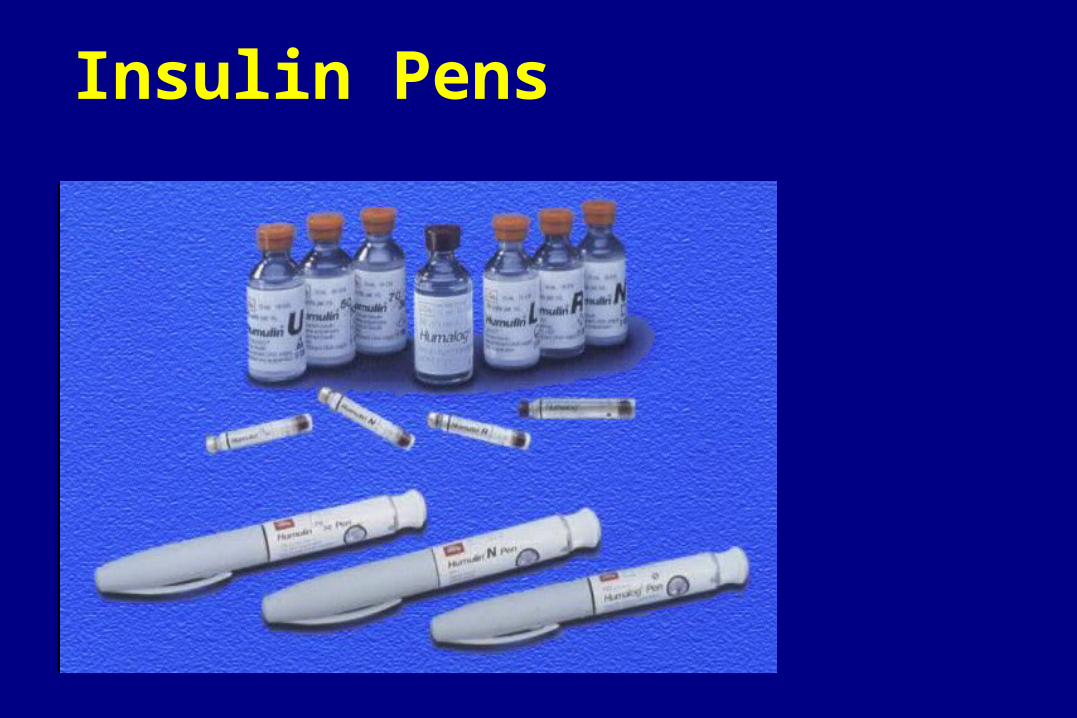
Insulin Pens

Lauritzen. Diabetologia. 1983;24:326–329.
Fast (n = 12)
Semilente (n = 9)
Intermediate (n = 36)
Fra
ctio
n a
t in
j. si
te
1.00
0.75
0.50
0.25
06 12 18 24 36 42 4830
Hours after single SC injectionsFemoral region
Variability of Insulin Absorption
CSII <2.8%
SubcutaneousInjectable10% to 52%
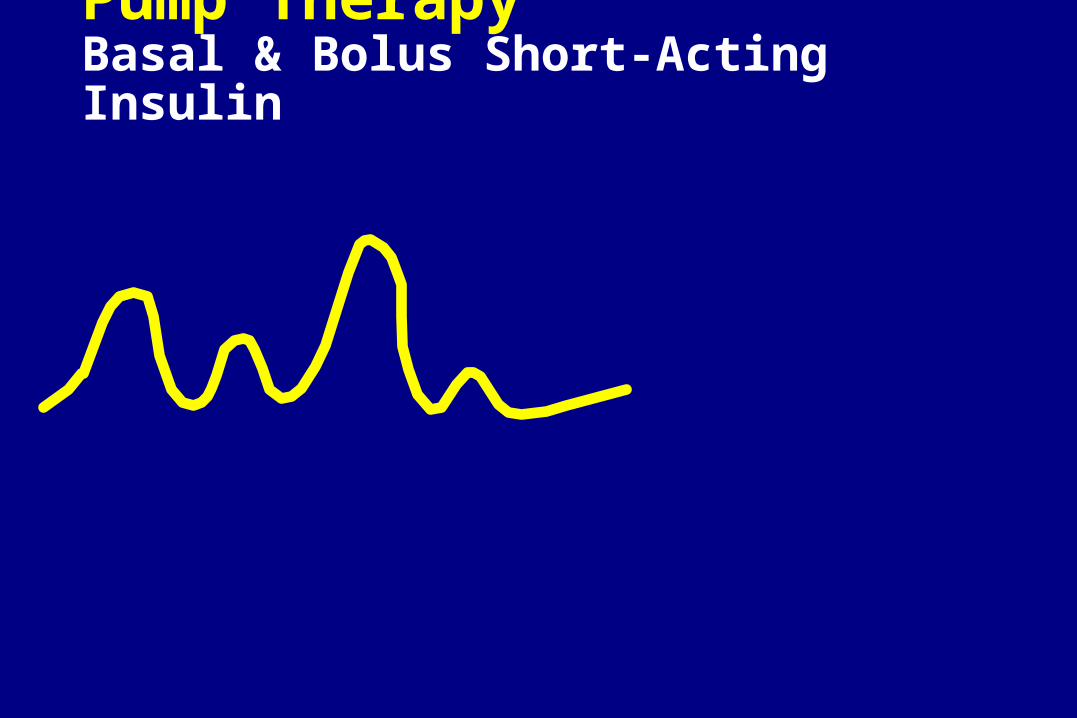
Pump TherapyBasal & Bolus Short-Acting Insulin

Pump TherapyBasal & Bolus Short-Acting Insulin

Pump TherapyBasal & Bolus Short-Acting Insulin
Combined with SMBG, physiologic insulin requirements can be achieved more closely
Flexibility in lifestyle

History of Pumps

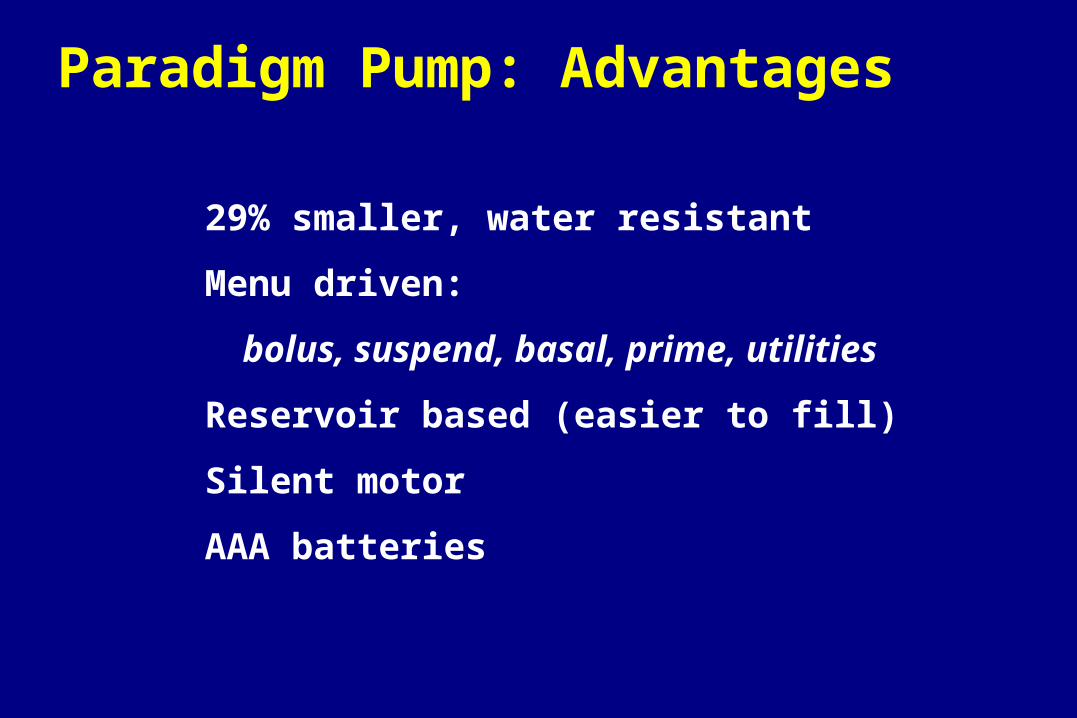
Paradigm Pump: Advantages
29% smaller, water resistant
Menu driven:
bolus, suspend, basal, prime, utilities
Reservoir based (easier to fill)
Silent motor
AAA batteries

Paradigm Pump: Advantages
Various bolus options
normal, square, dual, and “easy bolus”
Enhanced memory
Enhanced safety features
(low reservoir alarm, auto off, etc.)

Pump Infusion Sets
Softset QR Silhouette

Lauritzen. Diabetologia. 1983;24:326–329.
Pharmacokinetic Advantages CSII vs MDI
Uses only regular or very rapid insulin– More predictable absorption than modified
insulins (variation 3% vs 52%)
Uses 1 injection site– Reduces variations in absorption due
to site rotation
Eliminates most of the subcutaneous insulin depot
Programmable delivery simulates normal pancreatic function

Metabolic Advantages with CSII
Improved glycemic control
Better pharmacokinetic delivery of insulin
– Less hypoglycemia
– Less insulin required
Improved quality of life
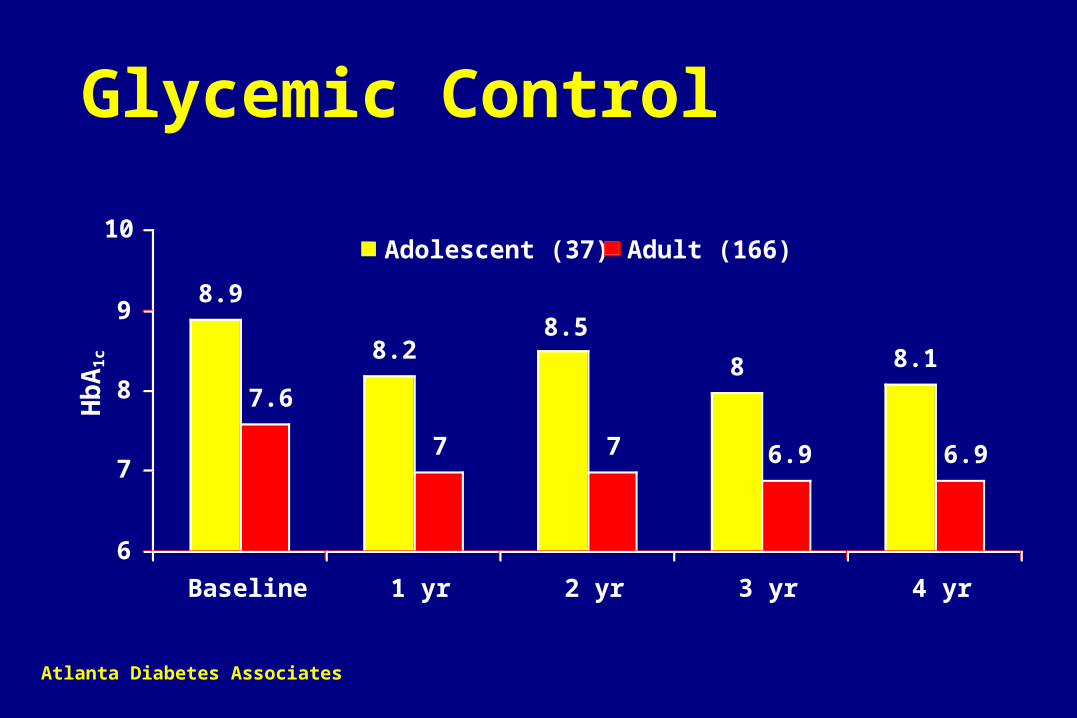
8.18
8.58.2
8.9
6.96.977
7.6
6
7
8
9
10
Baseline 1 yr 2 yr 3 yr 4 yr
Adolescent (37) Adult (166)
Glycemic ControlH
bA
1c
Atlanta Diabetes Associates
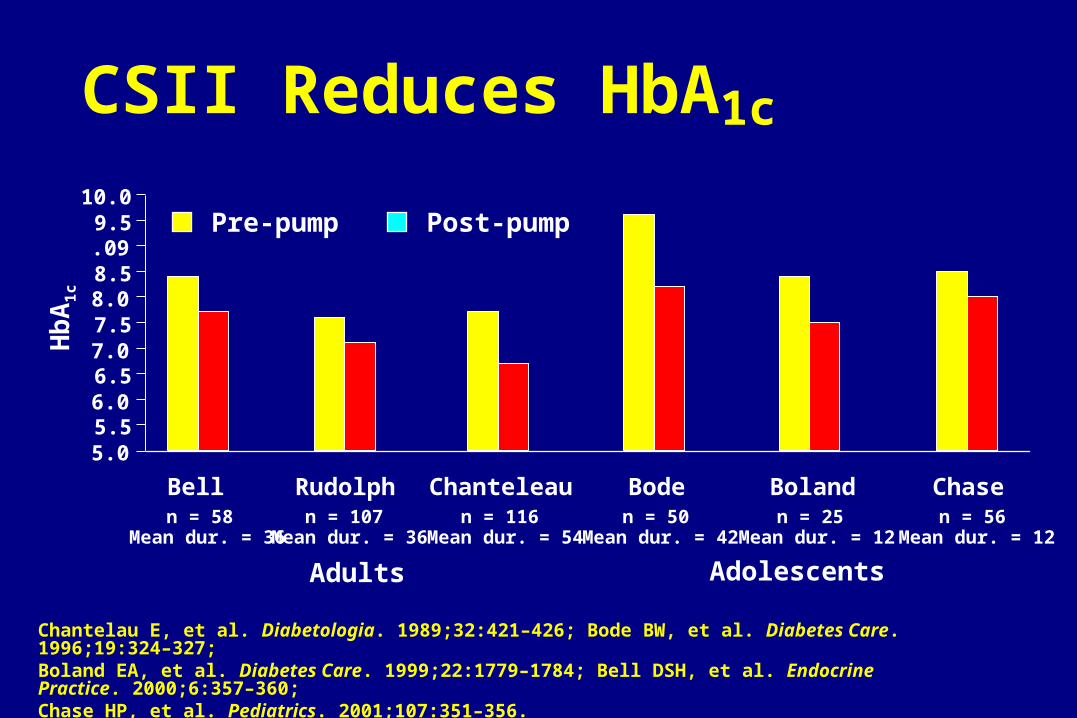
CSII Reduces HbA1c
5.05.56.06.57.07.58.08.5.099.5
10.0
n = 58 n = 107 n = 116 n = 50 n = 25 n = 56Mean dur. = 36
Adolescents Adults
Mean dur. = 36 Mean dur. = 54 Mean dur. = 42 Mean dur. = 12 Mean dur. = 12
Chantelau E, et al. Diabetologia. 1989;32:421–426; Bode BW, et al. Diabetes Care. 1996;19:324–327;Boland EA, et al. Diabetes Care. 1999;22:1779–1784; Bell DSH, et al. Endocrine Practice. 2000;6:357–360;Chase HP, et al. Pediatrics. 2001;107:351–356.
Bell Rudolph Chanteleau Bode Boland Chase
Pre-pump Post-pump
Hb
A1
c
Ep
iso
des
/mo
nth
/pat
ien
t
0
2
4
6
8
10
12
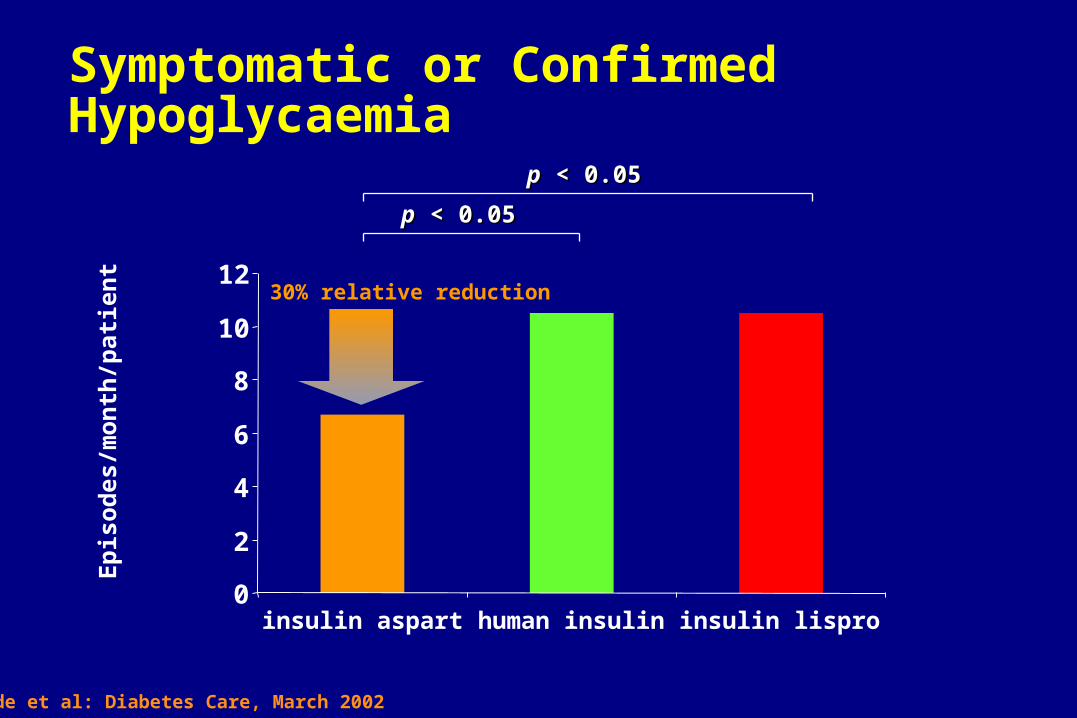
insulin aspart human insulin insulin lispro
pp < 0.05 < 0.05
pp < 0.05 < 0.05
Symptomatic or Confirmed Hypoglycaemia
30% relative reduction
Bode et al: Diabetes Care, March 2002

7.197.57
9.2
5.00
6.00
7.00
8.00
9.00
10.00
Baseline 6 months 18 months
P = 0.026 P = 0.040
N = 11
CSII Usage in Type 2 PatientsThe Diabetes Center
Mean HbA1c (%)

Glycemic Control in Type 2 DM: CSII vs MDI in 127 patients
A1C
7.0
7.2
7.4
7.6
7.8
8.0
8.2
8.4
CSII MDI
Baseline
End of Study (24 wks)
Raskin, Diabetes 2001; 50(S2):A106
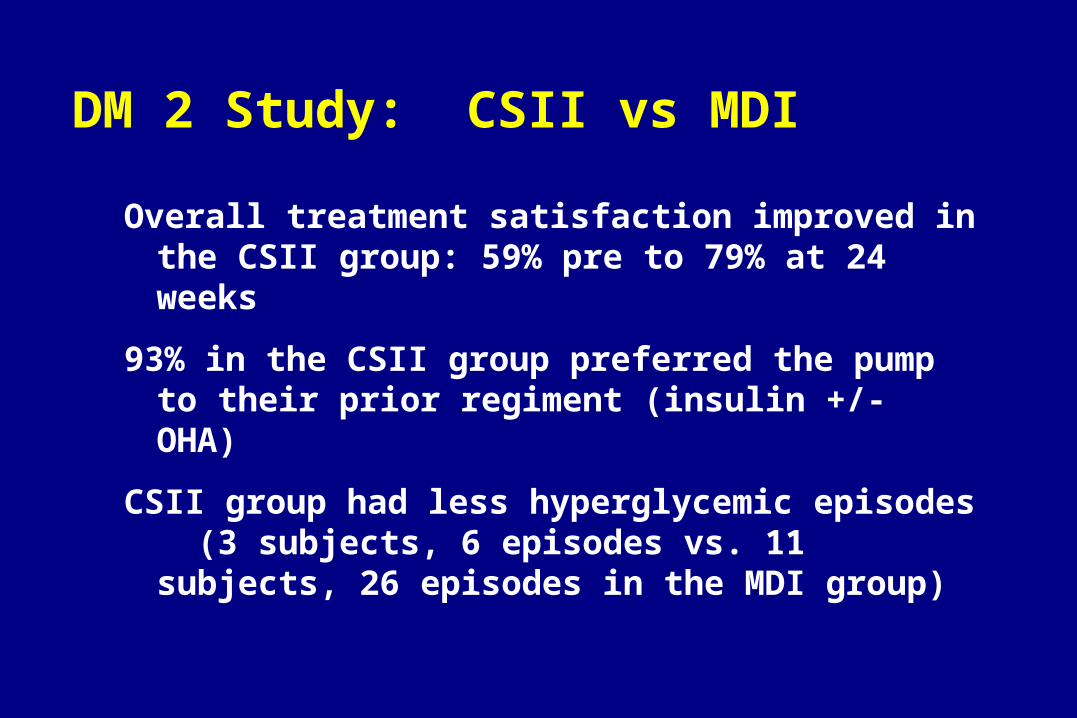
DM 2 Study: CSII vs MDI
Overall treatment satisfaction improved in the CSII group: 59% pre to 79% at 24 weeks
93% in the CSII group preferred the pump to their prior regiment (insulin +/- OHA)
CSII group had less hyperglycemic episodes (3 subjects, 6 episodes vs. 11 subjects, 26 episodes in the MDI group)

CSII Reduces Hypoglycemia
0
20
40
60
80
100
120
140
160
n = 55Mean age 42
n = 107Mean age 36
n = 116Mean age 29
n = 25Mean age 14
n = 56Mean age 17
Eve
nts
per
hu
nd
red
p
atie
nt
y ea r
s
Chantelau E, et al. Diabetologia. 1989;32:421–426; Bode BW, et al. Diabetes Care. 1996;19:324–327;Boland EA, et al. Diabetes Care. 1999;22:1779–1784; Chase HP, et al. Pediatrics. 2001;107:351–356.
Bode Rudolph Chanteleau Boland Chase
Pre-pump Post-pump

48.1
34.539.3 40.1 39.8
0
10
20
30
40
50
60
Baseline(MDI)
15 days 6 mos 18 mos 36 mos
-28% -18% -16% -17%
* P <0.001
** * *
n = 389 n = 389 n = 298 n = 246 n = 187
Insulin Reduction Following CSII
Normalization of Lifestyle
Liberalization of diet — timing & amount
Increased control with exercise
Able to work shifts & through lunch
Less hassle with travel — time zones
Weight control
Less anxiety in trying to keep on schedule

N = 165Average Duration = 3.6 yearsAverage Discontinuation <1%/yr
Continued 97%
Discontinued 3%
Current Continuation RateContinuous Subcutaneous Insulin Infusion (CSII)
Bode BW, et al. Diabetes. 1998;47(suppl 1):392.

Pump Therapy Indications
HbA1c >7.0%
Frequent hypoglycemia
Dawn phenomenon
Exercise
Pediatrics
Pregnancy
Gastroparesis
Hectic lifestyle
Shift work
Type 2
Marcus. Postgrad Med. 1995.
Poor Candidates for CSII
Unwilling to comply with medical follow-up
Unwilling to perform self blood glucose monitoring 4 times daily
Unwilling to quantitate food intake
Current Candidate Selection
Patient Requirements
– Willing to monitor and record BG
– Motivated to take insulin
– Willing to quantify food intake
– Willing to follow-up
– Interested in extending life

What Type of Bolus Should You Give?
9 DM 1 patients on CSII ate pizza and coke on four consecutive Saturdays
Dual wave bolus (70% at meal, 30% as 2-h square):
9 mg/dl glucose rise
Single bolus: 33 mg/dl rise
Double bolus at -10 and 90 min: 66 mg/dl rise
Square wave bolus over 2 hours: 80 mg/dl rise
Chase et al, Diabetes June 2001 #365

Treatment of Hypoglycemia
Education
–Glucose tablets
–Glucagon
Call healthcare team
–Any hypoglycemic events requiring assistance

Treatment of Hyperglycemia
If blood glucose is above 250 mg/dl
– Take a correction bolus by pump– Check BG again in 1 hr
If still above 250 mg/dl
– Take correction bolus by syringe– Change infusion set and reservoir– Check BG again in 1 hr
If BG has not decreased
– Increase correction bolus by syringe– CALL PHYSICIAN

If HbA1c is Not to Goal
SMBG frequency and recording
Diet practiced
– Do they know what they are eating?
– Do they bolus for all food and snacks?
Infusion site areas– Are they in areas of
lipohypertrophy?
Other factors:– Fear of low BG– Overtreatment of low BG
Must look at:

Evolution of Diabetes Management Technologies
Insulin Injections
Urine Test Strips
Glucose Sensor
ArtificialPancreas
1999197819221900s 1977
Urine Tasting
1776
BG Meters
Insulin Pump Therapy

Continuous Glucose Monitoring System CGMS
Pilot Study: CGMS in Young Children with Type 1 Diabetes
• Evaluate the functionality of the MiniMed CGMS in children less than 7 years of age
• Evaluate hypoglycemic patterns in young children using the MiniMed CGMS
• Adjust insulin/dietary regimens based on sensor patterns to prevent hypoglycemia and hyperglycemia
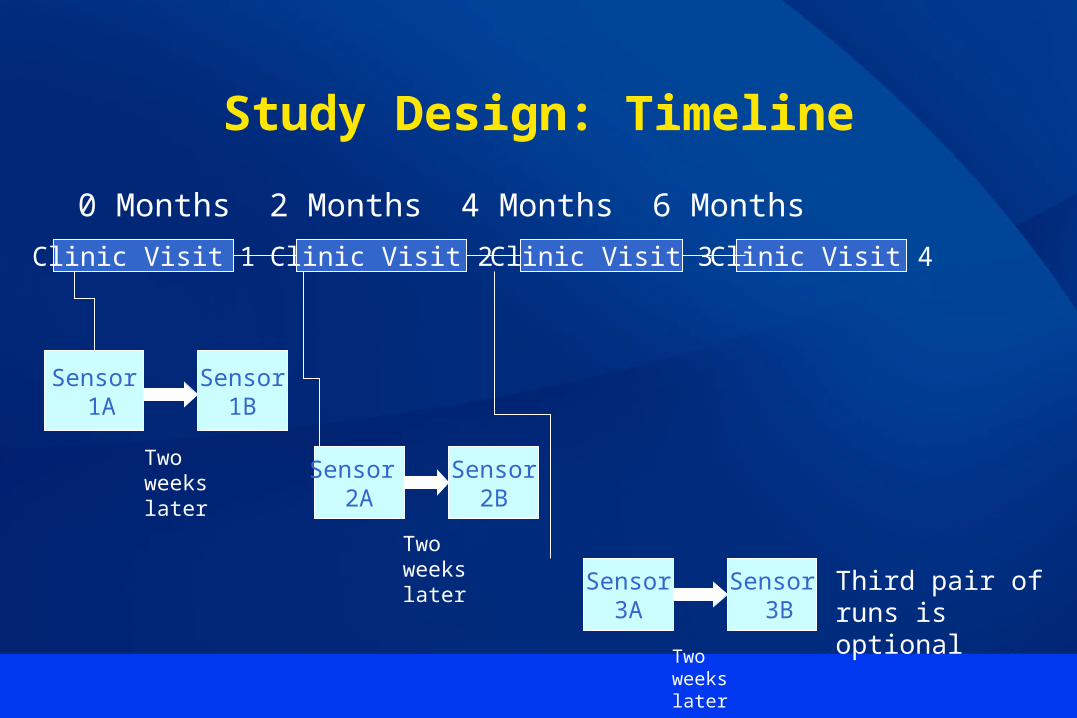
Study Design: Timeline
Clinic Visit 1 Clinic Visit 2 Clinic Visit 3 Clinic Visit 4
0 Months 2 Months 4 Months 6 Months
Sensor 1A
Sensor1B
Two weekslater
Sensor 2A
Sensor2B
Two weekslater
Sensor3A
Sensor 3B
Two weekslater
Third pair of runs is optional
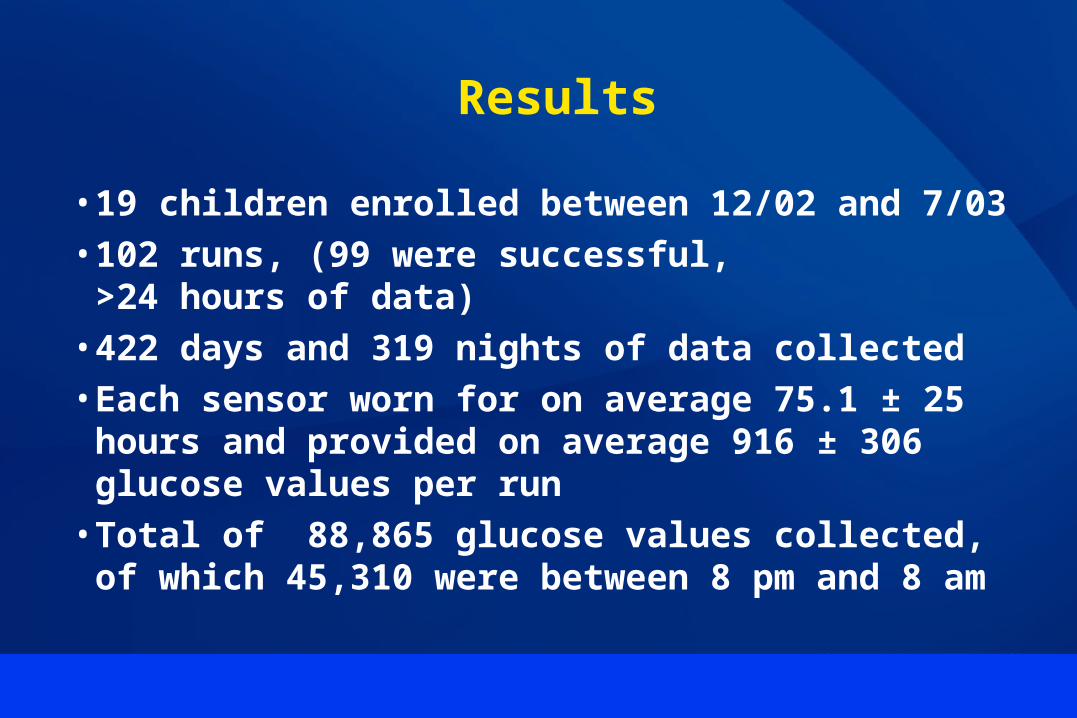
Results
• 19 children enrolled between 12/02 and 7/03• 102 runs, (99 were successful,
>24 hours of data)• 422 days and 319 nights of data collected• Each sensor worn for on average 75.1 ± 25 hours
and provided on average 916 ± 306 glucose values per run
• Total of 88,865 glucose values collected, of which 45,310 were between 8 pm and 8 am

Results: Adverse Events
• Adverse events included mild irritation and rash at the insertion site, which did not require therapy.
• No infections occurred. • The sensor was removed before 48 hours on 11
of 102 runs. Reasons for removal included– fell out (5)
– serial alarms due to low signal (5)
– parents’ preference (1)Fructose. Micro.magnet.fsu.edu
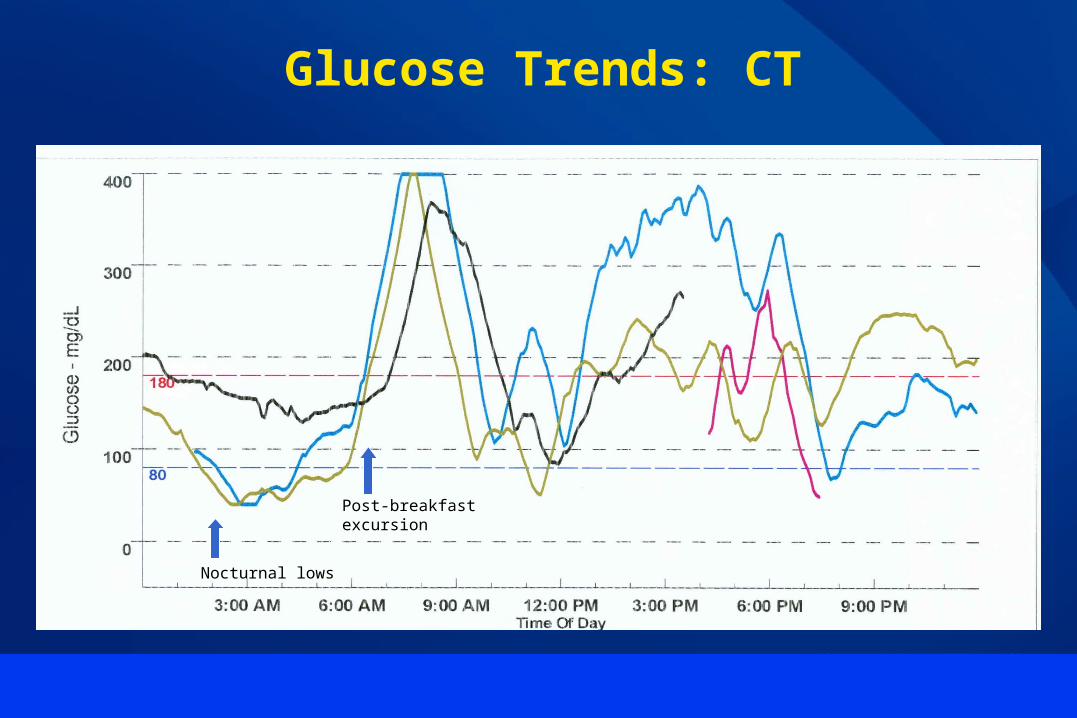
Post-breakfastexcursion
Nocturnal lows
Glucose Trends: CT

Glucose Trends: NB(1)
NPH “run-out”
NPH “run-out” NPH
NPH
NPH

Glucose Trends: NB(2)
NPHNPH


CGMS data on Jackson Pollack


Hypoglycemia Duration and Frequency
• Duration of hypoglycemia did not differ based on age (<5, ≥5yr), pump v. MDI, or HbA1c (<8, ≥8.0%)
• Frequency of mild hypoglycemia was higher in children on the pump (1.1 v. 1.8 episodes per day of monitoring, p<0.05)
• Frequency of severe hypoglycemia did not differ based on insulin regimen
• Frequency of mild or severe hypoglycemia did not differ based on age or HbA1c

Results: Timing of Hypoglycemia
0
10
20
30
40
50
60
70
80
90
100
12a-4a 4a-8a 8a-12p 12p-4p 4p-8p 8p-12a
Severe
Mild
Time of Day
No. ofEpisodes

Conclusions
• CGMS can be used successfully in young children:– Well tolerated without significant adverse effects– Accuracy is acceptable– Defines consistent patterns
• Nocturnal hypoglycemia in young children with diabetes is common– Severe hypoglycemia most frequently occurs between 4a-8a– Duration of hypoglycemia is longer at night

Conclusions
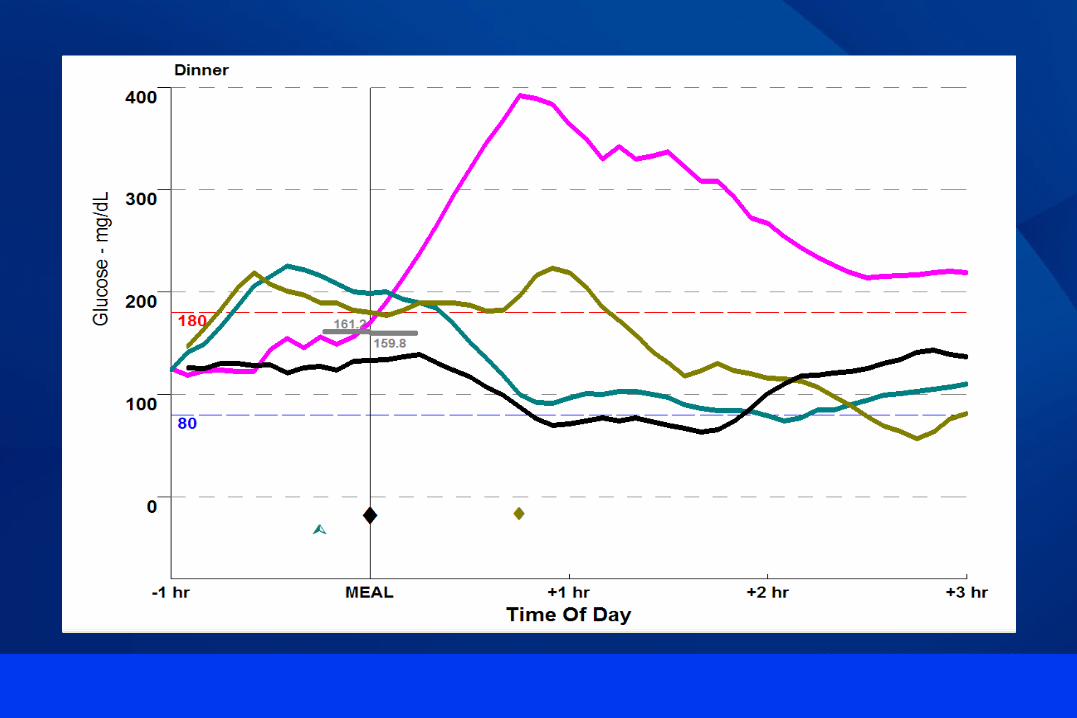
• Post-prandial hyperglycemia is common, especially after breakfast
• HbA1c is positively correlated with severity of glucose rise after breakfast and lunch; a similar association is not seen at dinner
• CGMS can be used to define and assess algorithms which address typical glycemic excursions
Glucose. Micro.magnet.fsu.edu
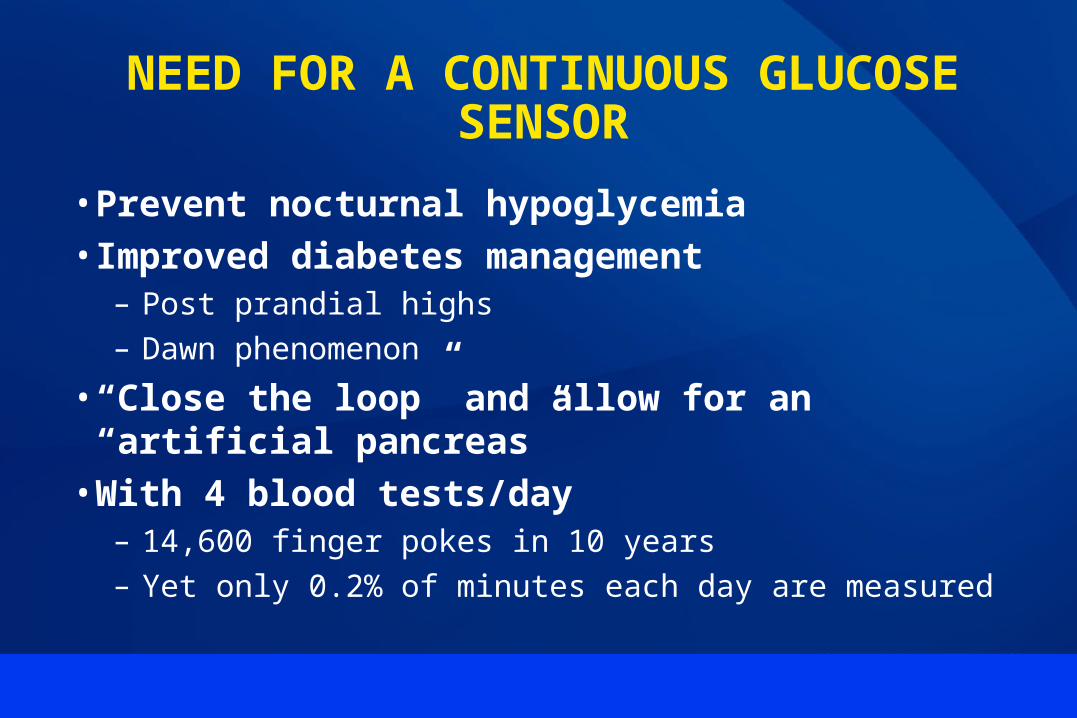
NEED FOR A CONTINUOUS GLUCOSE SENSOR
• Prevent nocturnal hypoglycemia• Improved diabetes management
– Post prandial highs– Dawn phenomenon
• “Close the loop” and allow for an “artificial pancreas”
• With 4 blood tests/day– 14,600 finger pokes in 10 years– Yet only 0.2% of minutes each day are measured
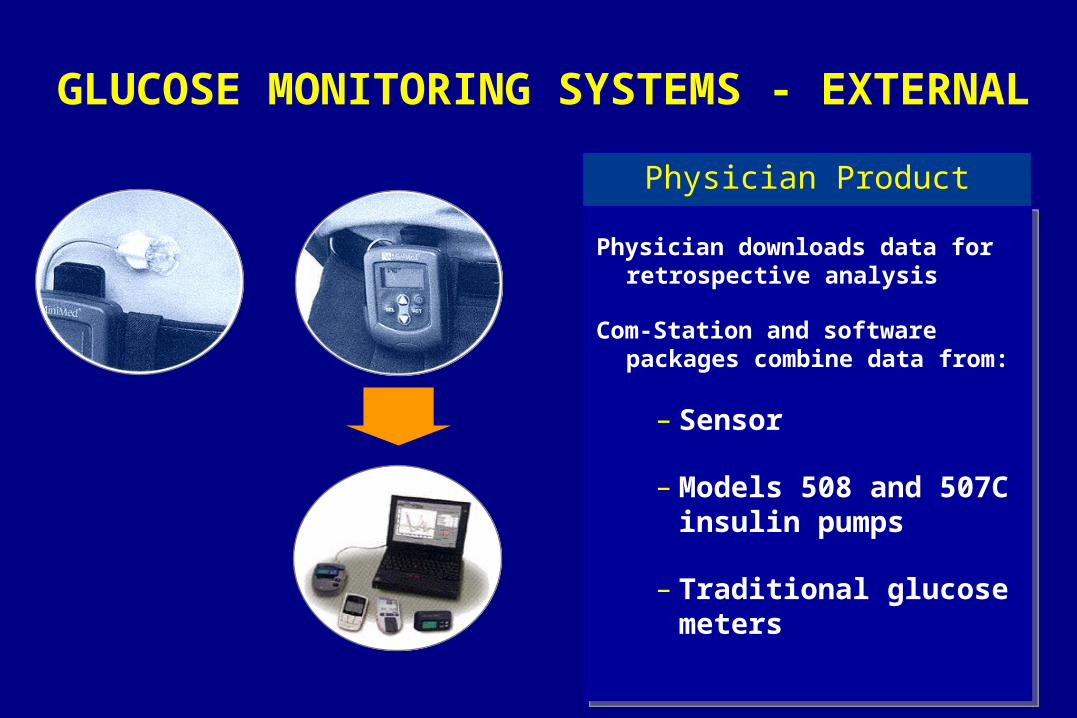
GLUCOSE MONITORING SYSTEMS - EXTERNAL
Physician downloads data for retrospective analysis
Com-Station and software packages combine data from:
– Sensor
– Models 508 and 507C insulin pumps
– Traditional glucose meters
Physician Product

Role of the School Nurse
Developmental, cognitive, and physical status of the student within his/her family structure to determine the ability of the student to independently manage diabetes care at school.
Identifying and coordinating the medical interventions the student requires at school, based on orders from the health care provider and the nursing assessment of the student;
Determining the nursing interventions and school accommodations needed for all school activities based on the developmental cognitive, and physical status of the student;Identifying and coordinating the interventions for school activities, which may include blood glucose monitoring, insulin administration, dietary intake, and instruction in identifying signs of and response to hypoglycemia/hyperglycemia;
Assisting the student in determining realistic and achievable personal goals for attaining self-care and independence in the management of her/his health.