Embed Size (px)
Citation preview


TWO TYPES OF POPULATION GROWTH IN ECOSYSTEMS:
EXPONENTIAL GROWTH LOGISTICAL GROWTH
Which represents the human population??

Malthusian Growth (Irruptive Growth) - Population explosions followed by population crashes.
Malthus concluded human populations tend to grow until they exhaust their resources and then crash.
POPULATION CHANGE:
N = (birth + immigration) – (death + emigration)
When these factors balance out it is known as ZERO POPULATION GROWTH (ZPG)
I heart musti
Population Growth
• 1. Ability to expand into diverse habitats and climates
• 2.Agriculuture
• 3. sanitations systems, antibiotics, vaccines

FACTORS AFFECTING HUMAN POPULATION SIZE
Crude Birth Rate = # of live births per Crude Birth Rate = # of live births per 10001000
Crude Death Rate = # of deaths per 1000Crude Death Rate = # of deaths per 100095% of daily population growth occurs in developing
countriesGlobal Growth Rate = 1.3% (equivalent to adding another USA
every 3.6 years)
China = 1.5 billionChina = 1.5 billion
India = over 1 India = over 1 billionbillion
USA = ~300 USA = ~300 millionmillion
~40%
5%
Indonesia, Brazil, Pakistan, Russia, Bangladesh, Japan, NigeriaIndonesia, Brazil, Pakistan, Russia, Bangladesh, Japan, Nigeria
Top 10 Most Populous


Replacement Level Fertility = # a couple must bear to replace themselves
Developed = 2.1 Developing = 2.5Total Fertility Rate (TFR) – average # of children a woman
will have during her child bearing years (15-49)
Developed = 1.6 (2.5 in 1950) Developing = 3.1 Developed = 1.6 (2.5 in 1950) Developing = 3.1 (6.5 in 1950)(6.5 in 1950)
FACTORS THAT INDICATE POPULATION GROWTH:
Even if each of today’s couples
had an average of 2.1 children, the population would continue to grow
for 50+ years because of: population momentum

The growth rate for the US in the year 2000 was close to 1% (~40-50% of the growth is due to immigration into the country)CURRENT POPULATION = over 300 million
The US will double in size in the next 70 years. It is currently growing faster than any other developed nation.
The TFR (total fertility rate) as a whole for the US is at replacement level = 2 . 1
United States Population Statistics
The period following WWII saw a spike in
birth rate known as the baby
boom.

POPULATION AGE STUCTURES:
Rapidly expanding populations: Have large number of pre-reproductive individuals and thus have population momentum.

AGE STRUCTURES: examples

Pre-Industrial = high BR + high DR (low pop growth) Transition = high BR + low DR (rapid pop growth) Industrialized = low BR + low DR (low pop growth)1) Access to birth control 2) decline in infant mortality
3) Increased education & jobs for women

What Affects Birth Rate & Fertility?• Education, employment, & status of
and for women• Infant mortality rate • Availability of contraceptives• Religious & social beliefs• The importance of children as a part of
the work force.• Urbanization – tend to have fewer
children• Cost of raising and educating children.• Average age of marriage.
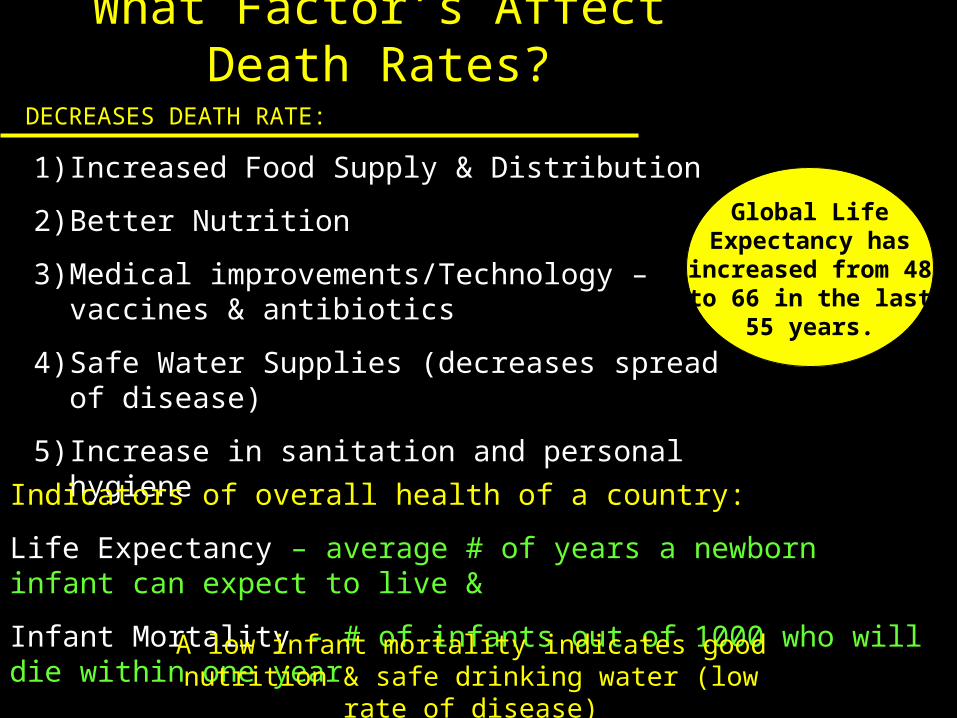
What Factor’s Affect Death Rates?
1) Increased Food Supply & Distribution
2) Better Nutrition
3) Medical improvements/Technology – vaccines & antibiotics
4) Safe Water Supplies (decreases spread of disease)
5) Increase in sanitation and personal hygiene
DECREASES DEATH RATE:
Indicators of overall health of a country:
Life Expectancy – average # of years a newborn infant can expect to live &
Infant Mortality - # of infants out of 1000 who will die within one year
A low infant mortality indicates good nutrition & safe drinking water (low rate of disease)
Global Life Expectancy has
increased from 48 to 66 in the last 55
years.


