Embed Size (px)
Citation preview
www.chronicpovertynetwork.org
Two ideas: Pro-poorest Growth and Preventing Backsliding
EGM on Strategies for Eradicating Poverty to Achieve the SDGs, 1-3 June 2016
UNDESA, Division of Social Policy and Development
Andrew Shepherd, CPAN Director

The Zero Poverty Tripod
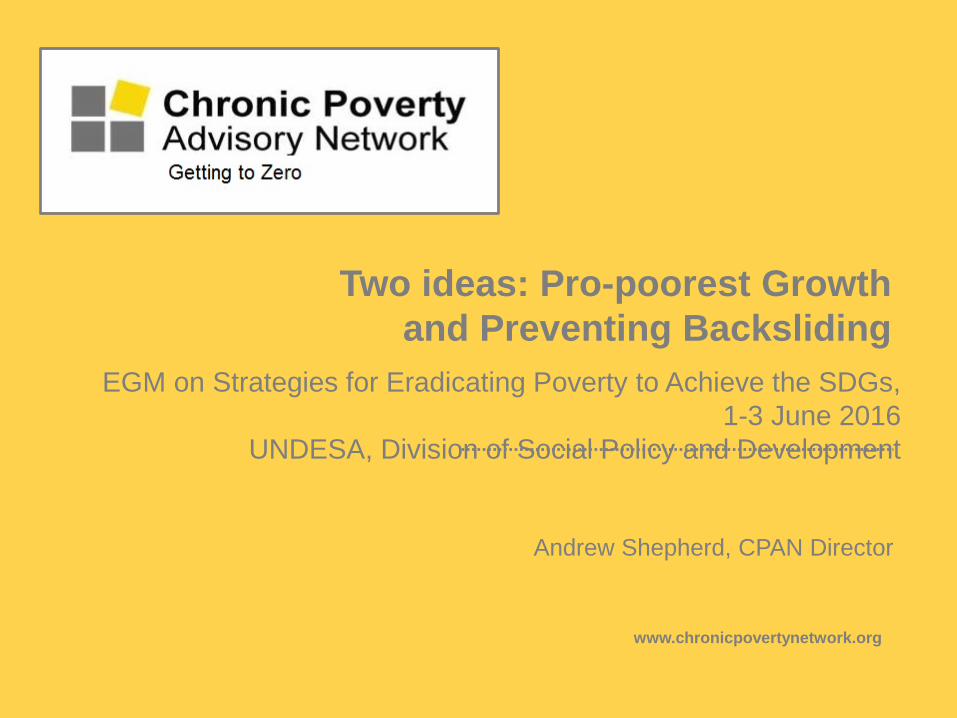
Policies for the zero poverty tripod
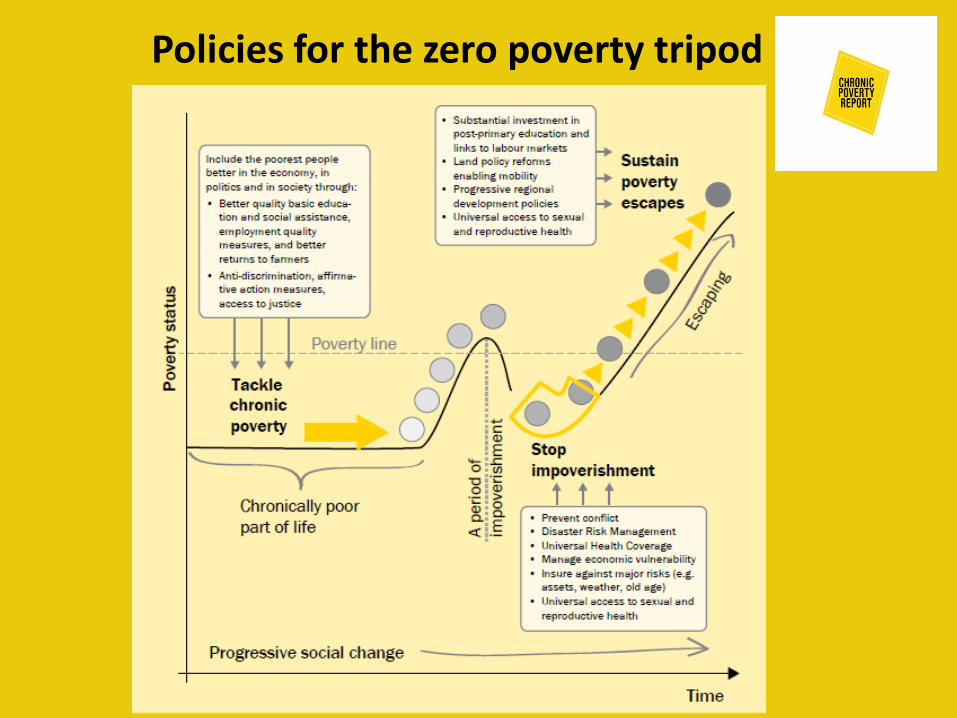
A 4th Chronic Poverty Report on Pro-poorest growth (PP²G): 2017-8
• Preparatory work underway: – Policy guides – Comparative research – Southeast Asia and East Africa – Conference at ADB, Manila, April 2016 – Research on anti-discrimination measures, including
labour markets
• More needed: – Invitation to join analysis of GICs for other regions to
identify and analyse more pro-poorest growth episodes – Growth and chronic poverty – workshop for panel data
analysts

What can policy makers do to make sure the poorest people do well out of economic growth? A comparative analysis of growth episodes in countries in East Africa and South East Asia
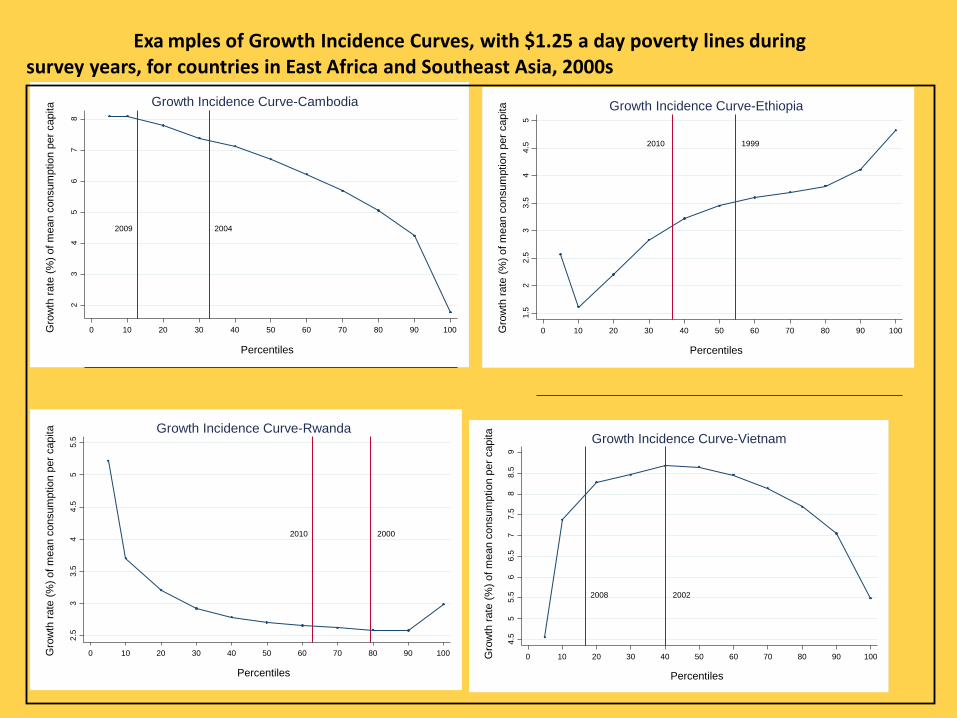
Exa mples of Growth Incidence Curves, with $1.25 a day poverty lines during survey years, for countries in East Africa and Southeast Asia, 2000s
2004 2009
2 3
4 5
6 7
8
Gro
wth
rate
(%) o
f mea
n co
nsum
ptio
n pe
r cap
ita
0 10 20 30 40 50 60 70 80 90 100
Percentiles
Growth Incidence Curve-Cambodia
1999 2010
1.5
2 2.
5 3
3.5
4 4.
5 5
Gro
wth
rate
(%) o
f mea
n co
nsum
ptio
n pe
r cap
ita
0 10 20 30 40 50 60 70 80 90 100
Percentiles
Growth Incidence Curve-Ethiopia
2000 2010
2.5
3 3.
5 4
4.5
5 5.
5
Gro
wth
rate
(%) o
f mea
n co
nsum
ptio
n pe
r cap
ita
0 10 20 30 40 50 60 70 80 90 100
Percentiles
Growth Incidence Curve-Rwanda
2002 2008
4.5
5 5.
5 6
6.5
7 7.
5 8
8.5
9
Gro
wth
rate
(%) o
f mea
n co
nsum
ptio
n pe
r cap
ita
0 10 20 30 40 50 60 70 80 90 100
Percentiles
Growth Incidence Curve-Vietnam
1993 - 1998 1993 - 2002
1998 - 2002
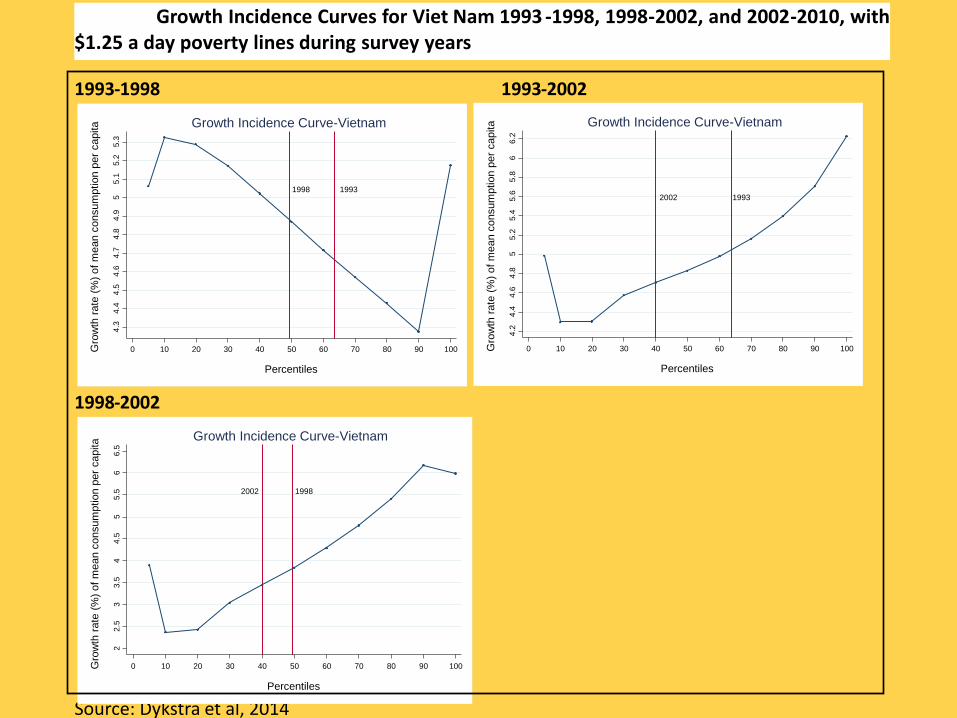
Source: Dykstra et al, 2014
1993 1998
4.3
4.4
4.5
4.6
4.7
4.8
4.9
5 5.
1 5.
2 5.
3
Gro
wth
rate
(%) o
f mea
n co
nsum
ptio
n pe
r cap
ita
0 10 20 30 40 50 60 70 80 90 100
Percentiles
Growth Incidence Curve-Vietnam
1993 2002
4.2
4.4
4.6
4.8
5 5.
2 5.
4 5.
6 5.
8 6
6.2
Gro
wth
rate
(%) o
f mea
n co
nsum
ptio
n pe
r cap
ita
0 10 20 30 40 50 60 70 80 90 100
Percentiles
Growth Incidence Curve-Vietnam
1998 2002
2 2.
5 3
3.5
4 4.
5 5
5.5
6 6.
5
Gro
wth
rate
(%) o
f mea
n co
nsum
ptio
n pe
r cap
ita
0 10 20 30 40 50 60 70 80 90 100
Percentiles
Growth Incidence Curve-Vietnam
Growth Incidence Curves for Viet Nam 1993 - 1998, 1998 - 2002, and 2002 - 2010, with $1.25 a day poverty lines during survey years

Contexts
1. Poverty reduction results from rapid growth, driven by extractive activities, where the poorest benefit less than the average [Laos and Mozambique]
2. Political settlement with clearly defined long term development strategy and varied levels of state intervention influencing the pattern of economic growth, where the poorest benefit more than average at least some of the time [Viet Nam, Ethiopia, Rwanda]
3. Mixed context, where pro-poorest outcomes result from expansion of one labour-intensive sector and agricultural growth [Cambodia]

Policy framework
• Inclusion of informal workers in legal
frameworks • Enforcement of health and
safety standards especially in agriculture and
construction • Workers informed of
entitlements
• Manage food price rises • Social Protection • Health insurance
• Support to smallholder
agriculture • Promotion of self-
employment with interventions tailored
for the poor
• Public investment in
education and infrastructure
• Strategic FDIs • Management of
natural resources • Openness and
support to migration
Long term perspective - diversification of the economy with strategic investment and opening
Diversification of rural
livelihoods in the farm and
non-farm economy
Improving the conditions of informal and casual wage
workers
Policies to manage macro and micro level risks and to respond to shocks

www.chronicpovertynetwork.org
Anti-discrimination measures: an
evaluation of their contribution to
poverty eradication
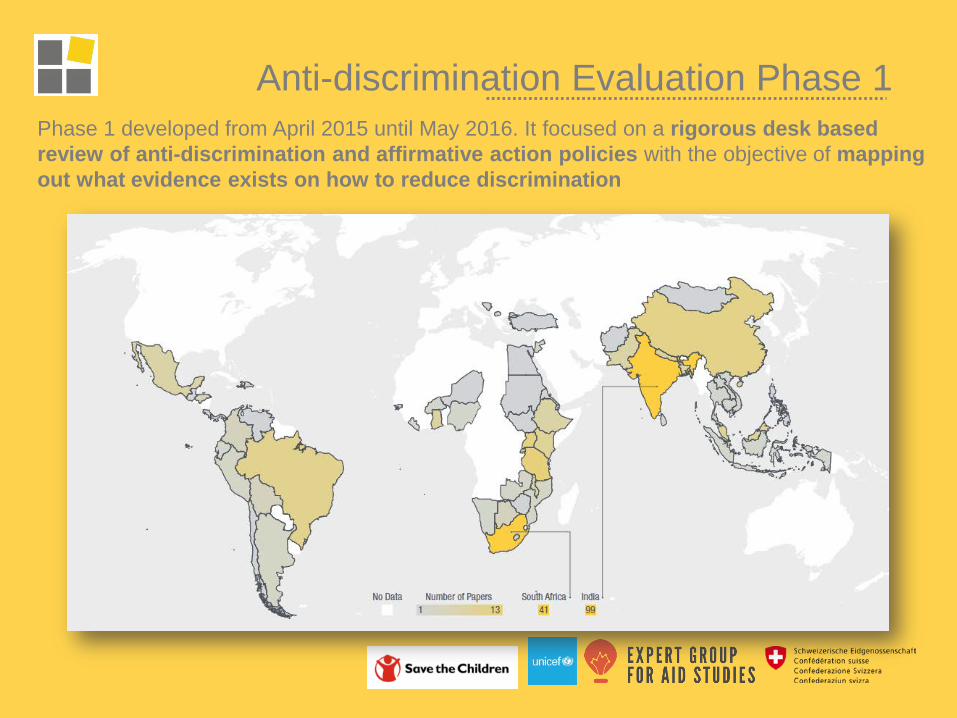
Phase 1 developed from April 2015 until May 2016. It focused on a rigorous desk based review of anti-discrimination and affirmative action policies with the objective of mapping out what evidence exists on how to reduce discrimination
Anti-discrimination Evaluation Phase 1
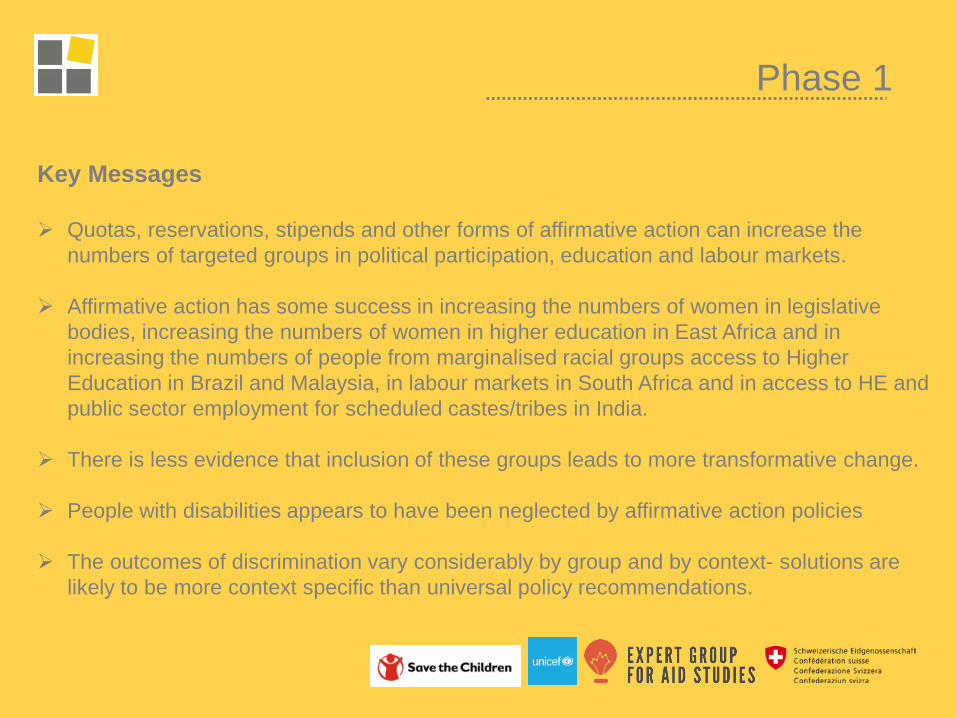
Key Messages Quotas, reservations, stipends and other forms of affirmative action can increase the
numbers of targeted groups in political participation, education and labour markets.
Affirmative action has some success in increasing the numbers of women in legislative bodies, increasing the numbers of women in higher education in East Africa and in increasing the numbers of people from marginalised racial groups access to Higher Education in Brazil and Malaysia, in labour markets in South Africa and in access to HE and public sector employment for scheduled castes/tribes in India.
There is less evidence that inclusion of these groups leads to more transformative change.
People with disabilities appears to have been neglected by affirmative action policies
The outcomes of discrimination vary considerably by group and by context- solutions are likely to be more context specific than universal policy recommendations.
Phase 1
Phase 1
Labour markets Affirmative action policies designed to address longstanding disadvantage have been successful in India and South Africa at increasing the representation of excluded groups in the workplace but evidence of their broader impacts on incomes and well-being is more mixed and clearer in India than South Africa. Labour market outcomes are also dependent on outcomes in other areas of national policy such as in education, welfare, health, housing and transportation. Participation in the labour market through public works programmes does appear to advantage women in accessing employment, and to enable them to build social networks, although the evidence here is not very strong in studies of labour guarantee programmes in India.

The Zero Poverty Tripod

www.chronicpovertynetwork.org
Preventing backsliding to end extreme poverty
Panel data and Life Histories for Uganda, Ethiopia and Bangladesh

Preventing backsliding to end extreme poverty
The objective of this project is to examine the observed variance (at household level and the national level) in backsliding impoverishment rates in Uganda, Bangladesh and Ethiopia. The project aims to understand poverty dynamics at the household level, through a combination of both quantitative and qualitative approaches.
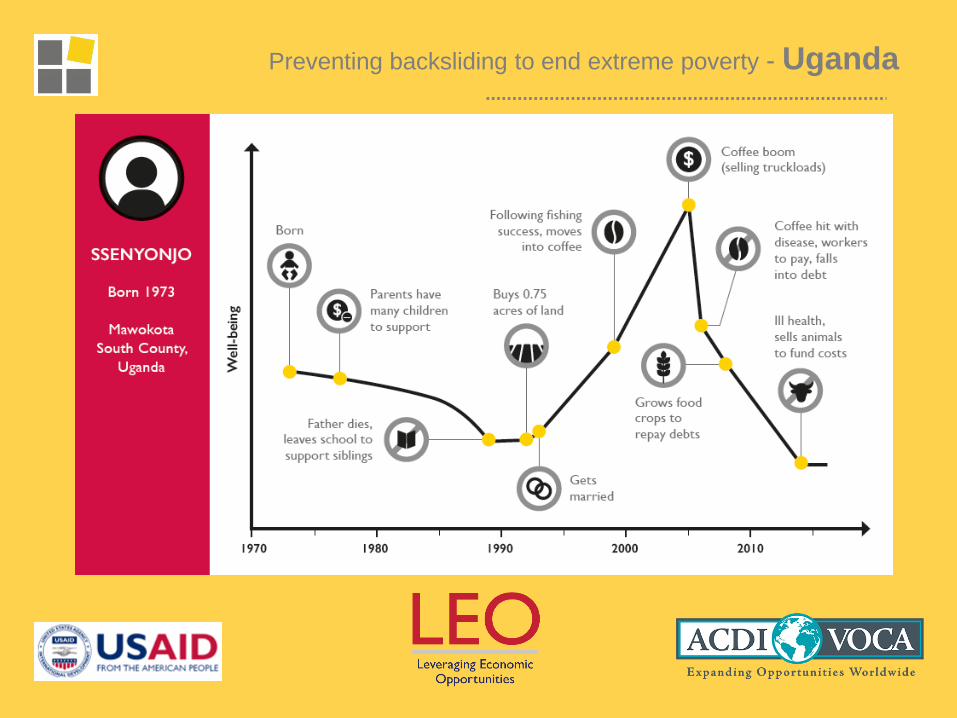
Preventing backsliding to end extreme poverty - Uganda
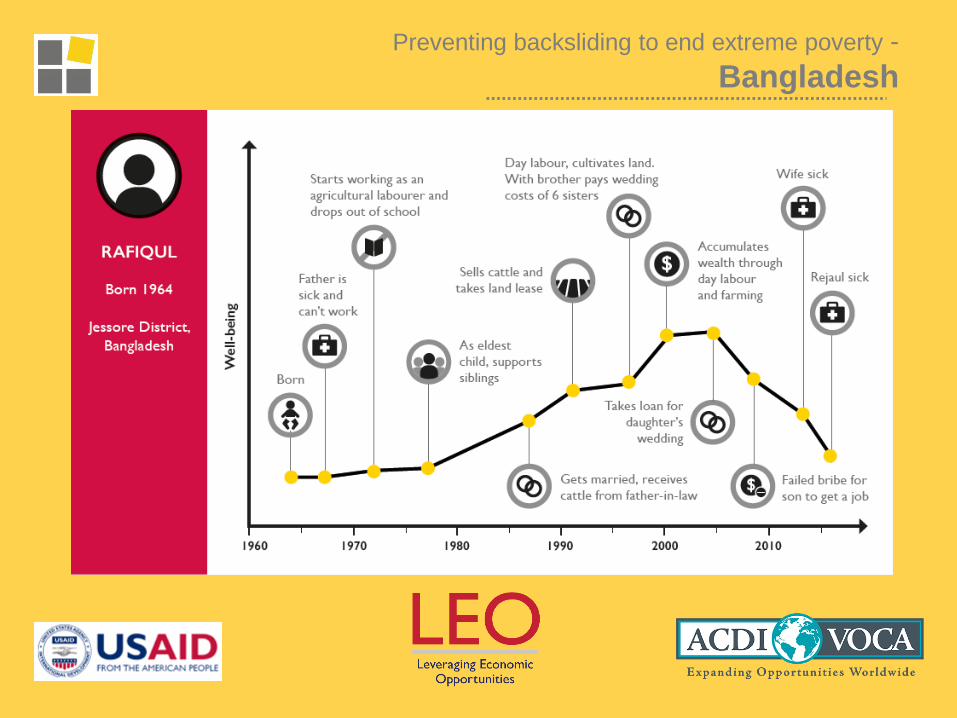
Preventing backsliding to end extreme poverty - Bangladesh