Embed Size (px)
Citation preview
am
Two-dimensional restoration of motion-degradedintensified CCD imagery
Kenneth J. Barnard, Carl E. White, and Anthony E. Absi
A Wiener filter-based deconvolution algorithm is developed to restore vibration-degraded video imageryfrom an intensified CCD camera. The method is based on the use of azimuth and elevation angularoptical line-of-sight data recorded from external sensors to estimate a two-dimensional vibration-blurimpulse response on a per frame basis. Flight conditions are reproduced in the laboratory by use ofprerecorded in-flight vibration data. The performance of the algorithm varies from frame to frame,following the time-varying characteristics of the vibration-blur impulse response. However, real-timedisplay of the restored video minimizes these effects because of eye integration, and near-full restorationof the original uncorrupted imagery is observed for both high-light- and low-light-level conditions withminimal amplification of noise. © 1999 Optical Society of America
OCIS codes: 040.1520, 040.3780, 100.1830, 100.2000, 100.3020, 110.4100.
1. Introduction
Mechanical line-of-sight ~LOS! stabilization of high-performance imaging sensors is required for aircraftapplications involving acquisition and tracking be-cause of vibration-induced image motion andblurring.1–3 Typically, the amount of stabilizationchievable is a strong function of cost and is deter-ined by imaging performance criteria.1 In simpli-
fied models, motion and vibration image degradationis characterized by a modulation transfer function~MTF! ~or MTF’s! depending on the category of themotion: linear, sinusoidal, random ~jitter!, or lowfrequency.4 Actual two-dimensional LOS motion isa complex combination of these types of vibrationalmotion and depends on the frequency spectrum of thevibration and the integration time of the sensor.5
In some cases it may be possible to reduce mechan-ical stabilization requirements or provide improvedimaging performance through use of image restora-tion techniques to further remove vibration degrada-tion from the imagery.6,7 Provided that the impulse
K. J. Barnard and A. E. Absi are with Sensors Directorate, U.S.Air Force Research Laboratory, Building 622, 3109 P Street,Wright-Patterson Air Force Base, Ohio 45433-7700. C. E. Whiteis with Optimetrics, Incorporated, 3115 Professional Drive, AnnArbor, Michigan 48104-5131.
Received 18 August 1998; revised manuscript received 23 No-vember 1998.
0003-6935y99y101942-11$15.00y0© 1999 Optical Society of America
1942 APPLIED OPTICS y Vol. 38, No. 10 y 1 April 1999
response of the vibration degradation can be calcu-lated, classical deconvolution methods can beused.8–11 Specifically, external angular positionsensors mounted on the imaging optics can providethe necessary information to determine the impulseresponse. In addition, blind deconvolution may beuseful for cases in which processing time is not crit-ical and the exact form of the impulse response is notknown, or external angular position sensor informa-tion is not available.12–14
In this paper we apply image restoration tech-niques to vibration-degraded intensified charge-coupled-device ~ICCD! RS-170 video imagery. ICCDcameras can be particularly appropriate for this typeof image processing because of their temporally gatedintensifier tube that controls the integration time andthe ability to monitor or externally control the gateinterval. Knowledge of the gate interval allows theimpulse response of the vibration degradation to becomputed accurately. Some ICCD cameras also pro-vide a frame mode or progressive scan operation inwhich all the pixels in the CCD array integrate si-multaneously, allowing full-frame processing at thehighest resolution without limitations that are due tointerlacing. The main drawback of applying decon-volution algorithms to intensified imagery is the re-duced signal-to-noise ratio ~SNR! especially at lowlight levels.
The procedure presented in this paper involvesgenerating a realistic two-dimensional vibration sig-nature in the laboratory, digitally recording a videosequence of vibration-degraded imagery, and pro-
cessing the video off line using classical deconvolu-tion techniques. Realistic LOS motion is generatedusing recorded in-flight azimuth and elevation datafrom rate sensors mounted on the optics housing of anoperational imaging system. In the laboratory a pi-ezoelectric scan mirror is used to steer the field ofview to reproduce the recorded motion. Video se-quences are captured and digitized while maintain-ing synchronization of the mirror scan signals andthe camera gating signal to allow a frame-by-frameestimation of the vibration-blur impulse response.Sequences of video imagery are obtained for test tar-gets under various light levels as well as for a realtarget on an outdoor range. The degraded video isprocessed using Wiener filtering techniques, andvideo sequences of the restored video are produced.
2. Vibration Characteristics
Flight data collected from previous sensor perfor-mance evaluation experiments were used to recreatein-flight LOS vibration. The operational imagingsystem used in the flight data collection was mechan-ically stabilized. Rate sensors, manufactured byATA Sensors, were attached to the optical system andmeasured the residual azimuth and elevation LOSangular rates under normal operating conditions.The LOS data were recorded on an analog data tapeusing a Metrum Information Storage RSR 512 and anAuxiliary Data Housing RH 512 with an input band-width setting of 625 Hz. In the laboratory, a Na-tional Instruments AT-MIO-16X data-acquisitionboard was used to digitize and create several differ-ent data sets from a single analog tape. For eachdata set, a total of 65,536 sample points were digi-tized at 16-bit resolution for each azimuthyelevationchannel with a sampling frequency of 10 kHz. Withthese data and an off-the-shelf ICCD camera andoptics, comparable motion-degraded imagery wasproduced in the laboratory.
Because angular position data are required to de-termine the image motion at the focal plane, the an-gular rate data were integrated and the constants ofintegration were removed. Low-frequency or con-stant rates present in the operational system tend toproduce angular position data having a time-varyingmean corresponding to changes in absolute angle.High-pass filtering prior to integration effectively re-moves any time-varying trends from the angularposition data. For this particular system, a sharp-transition linear-phase high-pass finite impulse re-sponse filter designed with a minimum cut-onfrequency of approximately 10 Hz produced angularposition data with a stationary mean. In a real-timeimplementation, an infinite impulse response filtermay be more efficient with less group delay at theexpense of introducing nonlinear phase.
Power spectral density estimates were calculatedfor all the digitized data sets using Welch’s procedurefor calculating an averaged periodogram.15 Prior tocomputing the periodograms, the data was down-sampled by a factor of 5 to eliminate unnecessarysamples while avoiding any aliasing. A Hanning-
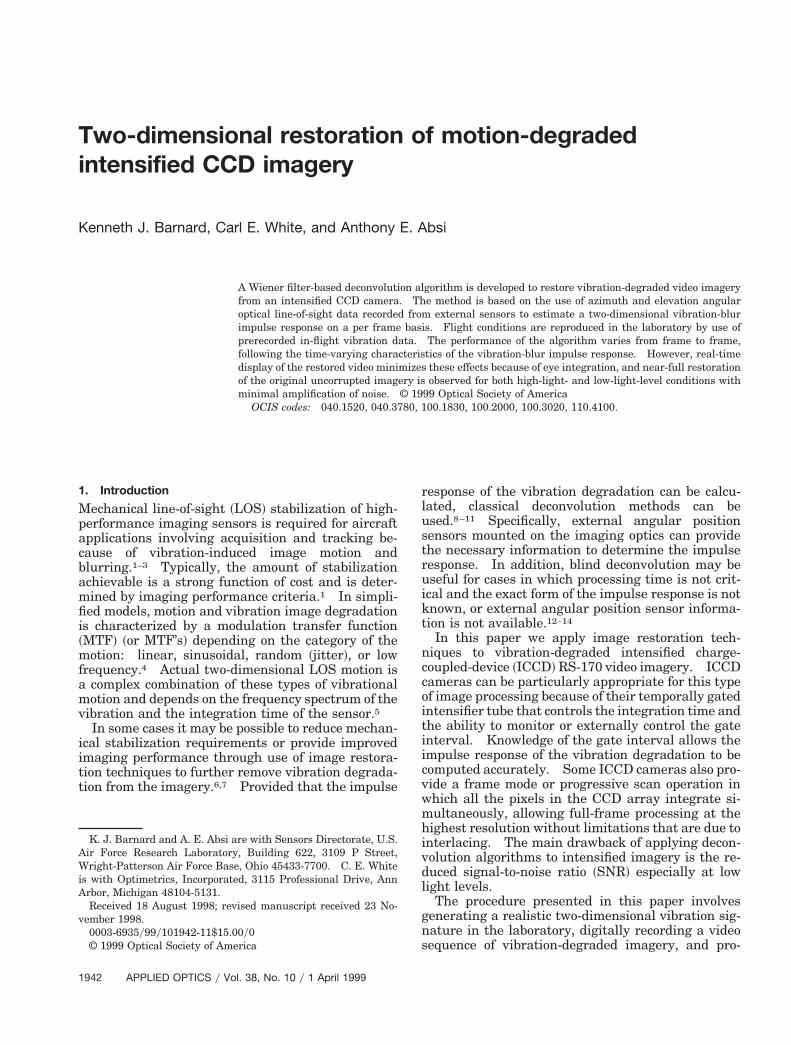
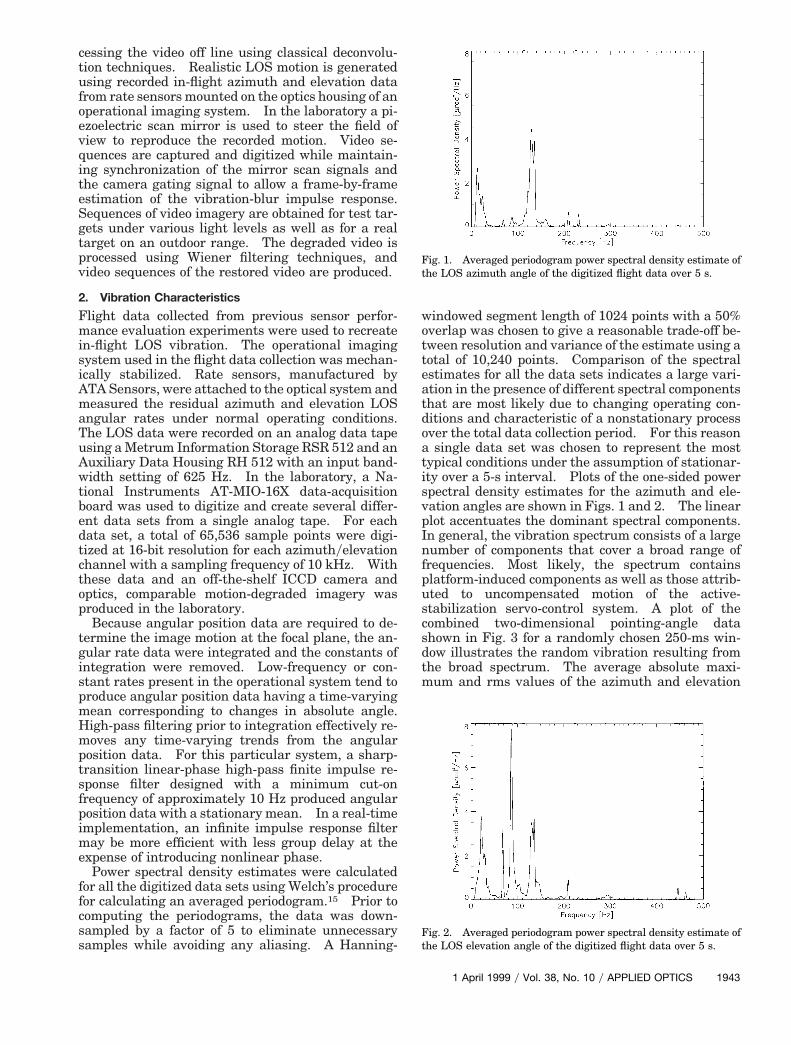
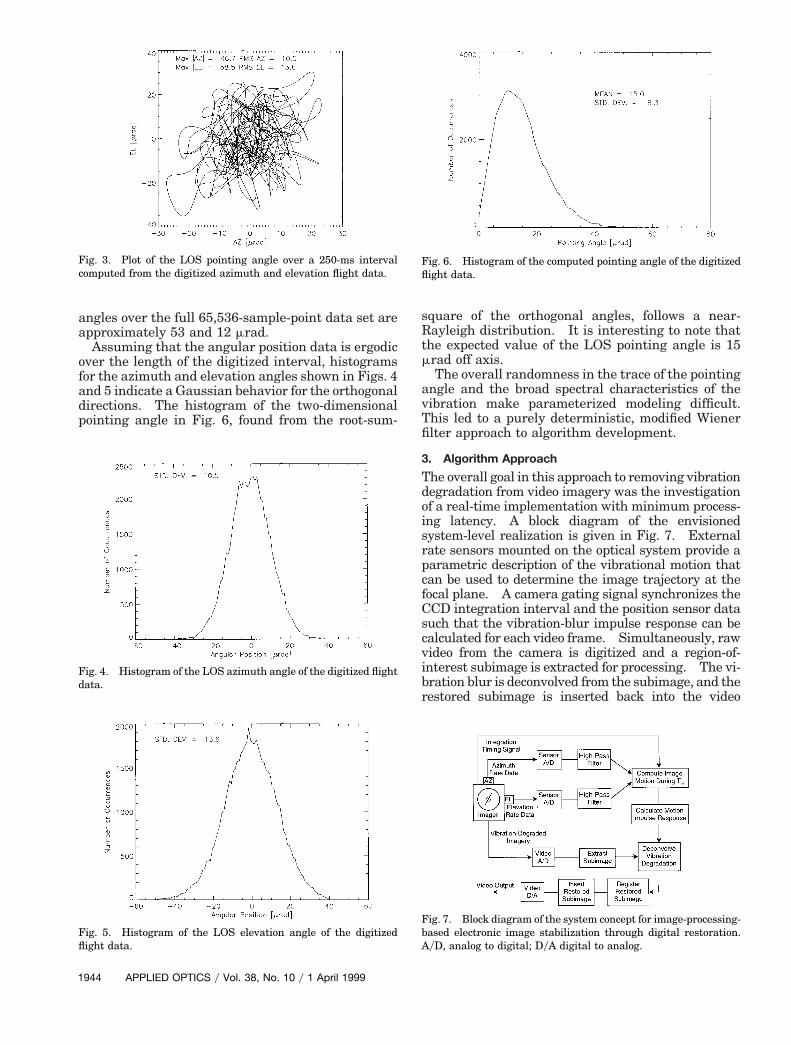
windowed segment length of 1024 points with a 50%overlap was chosen to give a reasonable trade-off be-tween resolution and variance of the estimate using atotal of 10,240 points. Comparison of the spectralestimates for all the data sets indicates a large vari-ation in the presence of different spectral componentsthat are most likely due to changing operating con-ditions and characteristic of a nonstationary processover the total data collection period. For this reasona single data set was chosen to represent the mosttypical conditions under the assumption of stationar-ity over a 5-s interval. Plots of the one-sided powerspectral density estimates for the azimuth and ele-vation angles are shown in Figs. 1 and 2. The linearplot accentuates the dominant spectral components.In general, the vibration spectrum consists of a largenumber of components that cover a broad range offrequencies. Most likely, the spectrum containsplatform-induced components as well as those attrib-uted to uncompensated motion of the active-stabilization servo-control system. A plot of thecombined two-dimensional pointing-angle datashown in Fig. 3 for a randomly chosen 250-ms win-dow illustrates the random vibration resulting fromthe broad spectrum. The average absolute maxi-mum and rms values of the azimuth and elevation
Fig. 1. Averaged periodogram power spectral density estimate ofthe LOS azimuth angle of the digitized flight data over 5 s.
Fig. 2. Averaged periodogram power spectral density estimate ofthe LOS elevation angle of the digitized flight data over 5 s.
1 April 1999 y Vol. 38, No. 10 y APPLIED OPTICS 1943
1
angles over the full 65,536-sample-point data set areapproximately 53 and 12 mrad.
Assuming that the angular position data is ergodicover the length of the digitized interval, histogramsfor the azimuth and elevation angles shown in Figs. 4and 5 indicate a Gaussian behavior for the orthogonaldirections. The histogram of the two-dimensionalpointing angle in Fig. 6, found from the root-sum-
Fig. 3. Plot of the LOS pointing angle over a 250-ms intervalcomputed from the digitized azimuth and elevation flight data.
Fig. 4. Histogram of the LOS azimuth angle of the digitized flightdata.
Fig. 5. Histogram of the LOS elevation angle of the digitizedflight data.
944 APPLIED OPTICS y Vol. 38, No. 10 y 1 April 1999
square of the orthogonal angles, follows a near-Rayleigh distribution. It is interesting to note thatthe expected value of the LOS pointing angle is 15mrad off axis.
The overall randomness in the trace of the pointingangle and the broad spectral characteristics of thevibration make parameterized modeling difficult.This led to a purely deterministic, modified Wienerfilter approach to algorithm development.
3. Algorithm Approach
The overall goal in this approach to removing vibrationdegradation from video imagery was the investigationof a real-time implementation with minimum process-ing latency. A block diagram of the envisionedsystem-level realization is given in Fig. 7. Externalrate sensors mounted on the optical system provide aparametric description of the vibrational motion thatcan be used to determine the image trajectory at thefocal plane. A camera gating signal synchronizes theCCD integration interval and the position sensor datasuch that the vibration-blur impulse response can becalculated for each video frame. Simultaneously, rawvideo from the camera is digitized and a region-of-interest subimage is extracted for processing. The vi-bration blur is deconvolved from the subimage, and therestored subimage is inserted back into the video
Fig. 6. Histogram of the computed pointing angle of the digitizedflight data.
Fig. 7. Block diagram of the system concept for image-processing-based electronic image stabilization through digital restoration.AyD, analog to digital; DyA digital to analog.
a
tta
tcoi~c
stream. A region-of-interest subimage is chosen toreduce processing requirements.
The impulse response must be calculated for everyframe because of the random nature of the imagetrajectory at the focal plane and the dependence ofthe impulse response on the exact path of the image.Several methods have been suggested for calculatingthe vibration-blur impulse response for various typesof motion.7–14,16–18 Here we assume a linear, shiftinvariant description of the imaging process and de-rive the vibration-blur impulse response directly.Including image motion during the integration timeof the CCD, the degraded image in the continuousspatial domain can be written as
g~x! 5 *t0
t01T
f ~x! p h~x! p d@x 2 a~t!#dt 1 n~x!, (1)
where g is the degraded image, f is the ideal geomet-ric image of the object scene, h is the imaging systemimpulse response, and n is additive noise. The Diracdelta function describes the two-dimensional motionof the image during the integration time T and is afunction of the image plane coordinates x 5 ~x1, x2!nd the parametric function for the image motion a~t!
5 @a1~t!, a2~t!#. Interchanging the order of integra-ion and integrating the two-dimensional delta func-ion with respect to time along the curve defined by~t!, the vibration-blur impulse response can be
found as
hvib~x! 5 *t0
t01T
d@x 2 a~t!#dt 5dNormal
U ddt
a~t!Ut5a21~x!
5dNormal
HF ddt
a1~t!G2Ut5a1
21~ x1!
1 F ddt
a2~t!G2Ut5a2
21~ x2!
J1y2,
(2)
where the negative exponent indicates a functionalinverse, and dNormal is a one-dimensional delta func-ion defined in a coordinate system normal to theurve for all points along the parametric path. Thene-dimensional delta function results from integrat-ng the original two-dimensional delta function in Eq.1! in one dimension defined by the tangent to theurve. From Eq. ~2! it is evident that the vibration-
blur impulse response is defined only for those pointsalong the path of the image trajectory and has a valueequal to the inverse of the speed. The speed is as-sumed to be nonzero, except possibly at the endpoints. If not, the curve is broken up into multiplesmooth curves. In addition, the inverse functionmay be multivalued and can produce multiple contri-butions to the impulse response for any given set ofimage plane coordinates.
Given the parameterized trajectory data derivedfrom external sensors, the two-dimensional pathtaken by the image during the integration time can
be determined. Provided that the external sensordata are digitized at a sufficiently high rate to avoidaliasing and generate a smooth curve, the discreteform of the vibration-blur impulse response hvib~n1,n2! can be found by sampling the continuousvibration-blur impulse response in Eq. ~2! as is donein the impulse invariance method of discrete infiniteimpulse response filter design.19 It can be shownthat if a high-resolution sampling grid is used to com-pute the impulse response, then a two-dimensionalhistogram will be approximately proportional to theinverse of the speed along the path, and the discreteform of Eq. ~2! can be found. The histogram is com-puted by counting the number of samples that occurwithin a specific ~Dx1, Dx2! bin on the two-dimensional grid. Assuming Dx 5 Dx1 5 Dx2, theinverse of the speed s along the path becomes
1s
< F2SDxDtD
2G21y2
5Dt
DxÎ2. (3)
For a fixed sample rate, the number of samples in thebin is approximately equal to Dt and is proportional tothe inverse of the speed at the bin location.
One difficulty in obtaining the discrete vibration-blur impulse response with this method is that Eq. ~2!defines a continuous ribbonlike function that will notbe band limited. Aliasing will occur when the im-pulse response is sampled, and the sampling gridmust be chosen such that aliasing is minimized overthe spatial frequencies of interest. Combining oneor more components of the total system impulse re-sponse with the calculated vibration-blur impulse re-sponse makes downsampling possible, thus reducingstorage and processing requirements for the algo-rithm. In the present case, the limiting resolutionelement in the ICCD is the intensifier tube that hasa MTF that can be approximated by a two-dimensional Gaussian function.20 Assuming thatthe limiting resolution is defined as the spatial fre-quency where the MTF is 5%, the discrete intensifierimpulse response can be written as
hintensifier~n1, n2! 5 r02 exp@2pr0
2Dx2~n12 1 n2
2!#, (4)
where r0 is the exp~2p! point in the intensifier MTFand can be calculated from the limiting resolution asr0 5 rlim@2pyln~0.05!#1y2, and the sample period Dx isthe same as in approximation ~3!. Convolving theimpulse response of the intensifier with thevibration-blur impulse response performs a spatiallow-pass filtering allowing downsampling withoutaliasing. This convolution can be included duringthe histogram calculation without requiring a sepa-rate convolution step.
The Wiener restoration filter is computed in thespatial frequency domain and is given by the stan-dard expression21
HWiener~v! 5Hvib*~v!
uHvib~v!u2 1 @Pn~v!yPim~v!#, (5)
1 April 1999 y Vol. 38, No. 10 y APPLIED OPTICS 1945

sdft
nfi
ba
bfistptd
ufifimii1libgpstfgcctti
1
where Hvib is the vibration-blur transfer function, Pimis the power spectral density of the image withoutnoise, Pn is the power spectral density of the noise,and v 5 ~v1, v2! are the normalized discrete-spacepatial frequencies. For numerical calculation andigital implementation using discrete Fourier trans-orms, the spatial frequencies are sampled accordingo v1 5 2pk1yN and v2 5 2pk2yN, where ~k1, k2! are
the discrete spatial frequencies of the N 3 N Wienerfilter.
The spatial frequency domain form of the Wienerfilter is derived under the assumption that the imageand noise are stationary random processes, a condi-tion not likely in real-world imagery. However, Eq.~5! is attractive because of implementation speed andits ability to produce reasonable results. The ratioof the two power spectral density functions repre-sents the noise-to-signal ratio as a function of spatialfrequency. Because a priori information regardingthe power spectral density functions may be un-known, the bracketed term in Eq. ~5! can be replacedby a nonnegative constant g, such that amplificationof noise is minimized at spatial frequencies whereHvib is small. In this context the restoration filter is
ot a true Wiener filter, but acts as a modified inverselter. The optimum choice for g depends on the
SNR in the image and requires dynamic adjustmentto produce the best visual image quality. Otherchoices of restoration filters may produce improvedresults.
An important consideration in the implementationof the Wiener filter is the support in the spatial fre-quency domain that is required to operate on thevibration-degraded image. The vibration-blur im-pulse response must be sampled at a sufficiently highspatial frequency such that Hvib is accurate out to theNyquist frequency of the vibration-degraded image.To maintain equal spatial frequency resolution in thevibration-degraded image and Hvib, the vibration-lur impulse response can be zero padded appropri-tely with additional unnecessary samples in Hvib
discarded, or, alternatively, the vibration-degradedimage can be interpolated. Including the intensifiertube impulse response with the vibration-blur im-pulse as described above significantly reduces thesampling requirements.
Recreating the vibration signature in the labora-tory provides an absolute position reference for imagerestoration such that both low-frequency motion andhigh-frequency blurring are removed simulta-neously. For aircraft-mounted imaging sensors, thederived image position data are relative, and addi-tional registration may be required depending on themaximum amplitude of the vibration. In this case,registration techniques, such as block-matching,phase-correlation, or gradient-based methods, can beused to register a current frame to the previous framewith enough flexibility to allow for frame-to-framescene dynamics and prevent cumulative position er-rors.6,22
Current computation requirement estimates indi-cate that restoration requires approximately 7 3 106
946 APPLIED OPTICS y Vol. 38, No. 10 y 1 April 1999
integer operations per frame and 33 3 106 floating-point operations per frame. These estimates assumea 256 3 256 subimage, a 512 3 512 vibration-lur impulse response, and a 256 3 256 Wienerlter. Possible real-time implementation may be pos-ible through use of a combination of multiprocessorechniques using digital signal processors, field-rogrammable gate arrays, specialized fast-Fourier-ransform chips, or reduced instruction set computerevices.
4. Laboratory Setup
The laboratory setup for simulating vibrational LOSmotion of the ICCD camera is shown in Fig. 8. TheICCD camera consists of a Xybion ISG-350 camerathat produces standard RS-170 video output and aXybion CCU-01 camera control unit. The camera’sCCD array is an interline transfer device having 756~H! 3 484 ~V! elements with a detector pitch of 11 mm~H! 3 13 mm ~V! and a fill factor of 34%. The camera
ses an 18-mm Gen III intensifier with a taperedber-optic minifier having a 1.46 6 5% magnificationrom the CCD to the intensifier. At the intensifiermage plane, the active image area is 12.7 mm 3 9.5
m, based on collimator measurements using a cal-brated target. Limiting resolution of the intensifiers 38 cyclesymm. The camera’s lens is a Computar-in. ~2.54-cm! format C-mount 28–200-mm zoomens adjusted for a fixed focal length of 200 mm. Thentegration time for the CCD array is partially sharedetween fields. Each field in the CCD video inte-rates approximately 33.3 ms with an overlap of ap-roximately 16.7 ms where both fields integrateimultaneously. During the field overlap intervalhe intensifier can be gated to produce an adjustableull-frame exposure period. For this experiment, aated frame integration time of 15.8 ms is used for allases. The irradiance at the CCD image plane isontrolled using a combination of the gated integra-ion time, the autogain circuitry within the camerahat controls the intensifier gain, and the adjustableris of the optics.
Fig. 8. Detailed layout of laboratory experiment. LP, low pass;EFL, equivalent focal length.

n
qtEclriuo
A piezoelectric scan mirror simulates the in-flightsensor LOS vibrational motion. A 76 mm 3 51 mmmirror, mounted to a Burleigh PZ-80 piezotranslator~PZT! Alignerytranslator, is driven using customelectronics and a Burleigh PZ-73 high-voltage ampli-fier. The PZ-80 consists of three PZT’s mounted at120 deg in a cylindrical housing that screws into themirror mount. The response for each PZT is approx-imately 0.006 mmyV with a total travel of 6 mm for a0–1000-V input range. The piezodriver electronicscontain three separate channels, one for each PZT.The required PZT voltages are coded into program-mable read-only memories using a total of 32,768samples per channel. Angle coding of the azimuthand elevation data produces the required LOS motionwhile maintaining a stationary point at the center ofthe mirror. Assuming a Cartesian coordinate sys-tem such that the unsteered mirror is parallel to thex,y plane and z is normal to the front surface of themirror, the equation for a plane containing the sta-tionary point ~0, 0, z0! and describing the mirror atany steering angle can be written as
x sin~uAZ!cos~uEL! 1 y sin~uEL!
1 ~z 2 z0!cos~uAZ!cos~uEL! 5 0, (6)
where uAZ and uEL are the mirror azimuth and ele-vation angles. Here the mirror angles are half thoseof the desired LOS motion. For angles less than 1mrad, sin~u! ' u and cos~u! ' 1 1 u2y2 ' 1, and thenecessary translational position of the ith PZT can beapproximated as
zi < 2~xiuAZ 1 yiuEL! 1 z0, (7)
where xi and yi are the coordinates of the PZT relativeto the center of the housing, z is in the direction
ormal to the mirror surface, and z0 is the midrangebias position of all the PZT’s. Based on approxima-tion ~7! and the PZT response, the PZT voltages arefound and digitally coded as 8-bit binary values.The coded voltages are read out using a 10-kHz sam-ple clock and converted to an analog voltage between0 and 10 V. Simple single-pole low-pass filters act asreconstruction filters following the digital-to-analogconversion. The analog signals are amplified by thePZ-73, which has a gain of 100, and then input to thePZT’s. The piezodriver electronics are driven by theintensifier gate signal from the camera control unitsuch that the mirror is scanned only during the in-tegration time for each frame. Using this approach,the LOS motion sequence is scanned through frameby frame. At the end of the sequence, the program-mable read-only memory address counter is reset tosynchronize the beginning of the next LOS motionsequence with the next gate signal. An external re-set signal is generated to indicate the first frame inthe vibration-degraded video. A reset-triggeredLED within the field of view provides a visual iden-tification of the first frame in the sequence.
Video from the camera control unit is digitized andstored using a Microdisk video-acquisition system
that allows real-time direct-to-hard-disk capture ofRS-170 video digitized at 752 3 480 samples perframe. Starting with the first ~LED! frame, a se-uence of vibration-degraded video frames are cap-ured under different conditions. A standard 1956lectronic Industries Association ~EIA! resolution
hart is imaged under low light and regular roomight conditions within the laboratory. For long-ange testing, a truck on an outdoor test range ismaged from a distance of 2.2 km during middaysing a neutral density filter with an optical densityf 3.0 to reduce the light level entering the optics.
5. Experimental Limitations
The main limitation in this experiment is associatedwith the accuracy of the pointing angles produced bythe piezoelectric scanning mirror. The mirror is cal-ibrated with a He–Ne laser and a standard CCDcamera. A converging beam is reflected off the mir-ror, propagated over an extended path length of8.7 m, and then focused directly on the CCD array.Scan angles can be measured with an estimated ac-curacy of 64 mrad using digitized RS-170 video fromthe CCD camera. Calibration involves assumingvalues for the voltage response of the individualPZT’s, programming a generic scan pattern with afixed peak angle, and measuring the resulting scanangles in azimuth and elevation directly from thedigitized video. The values for the PZT voltage re-sponses are then adjusted, and the process is re-peated until the measured peak angles are equal tothose of the programmed scan pattern. For simul-taneous measurement of both the azimuth and theelevation angles, a four-leaf rose pattern is used.23
This discretely sampled pattern can be described by
uAZ~n! 5 upeak cos~nv0!cos~n2v0!,
uEL~n! 5 upeak sin~nv0!cos~n2v0!, (8)
where upeak is the peak angle and v0 is a normalizeddiscrete-time frequency chosen to be within the band-width of the piezo scan mirror and such that an evennumber of periods of the pattern occur over 32,768samples. A plot of the parametric representation ofthe curve given in Eqs. ~7! is shown in Fig. 9.
The described single-angle calibration assumes alinear scan response. However, the PZ-80 deviceuses a soft PZT material that exhibits both hysteresisand nonlinearity. This produces an error in the ac-tual scan angle that increases as the difference be-tween the calibrated angle and the programmedangle increases. Errors up to 20% were measuredfor extreme peak angles.
Additional limitations result from the mountingstructure of the PZ-80. To provide adjustment, thePZ-80 is secured in a spring-loaded gimbal mount.Spectral response measurements indicate a mechan-ical resonance around 120 Hz that distorts the scan.This problem is avoided by low-pass filtering the databelow 120 Hz at the expense of slightly altering thecharacteristics of the flight data. The original rms
1 April 1999 y Vol. 38, No. 10 y APPLIED OPTICS 1947

ateft
1
value of the data is maintained by applying a scalingfactor to the angle data after low-pass filtering.
Further angle scaling of the data is required be-cause of the difference in angular resolution of theICCD camera compared with a typical operationalsensor. In addition to the distinct focal lengths ofthe optical systems, there is a difference in spatialresolution of the two systems. For the ICCD cam-era, the limiting spatial resolution is determined bythe intensifier tube. To obtain an equivalentamount of image degradation compared with an op-erational sensor, an angle scaling factor, defined asthe ratio of the limiting angular resolution of the twosystems, is applied to the angular position data. Asa result of angle scaling, the fractional motion rela-tive to the field of view differs between the systems,causing more overall image jitter that is due to over-emphasis of low-frequency components. The ampli-tude of the motion relative to the angular resolutionof the systems remains the same.
6. Results
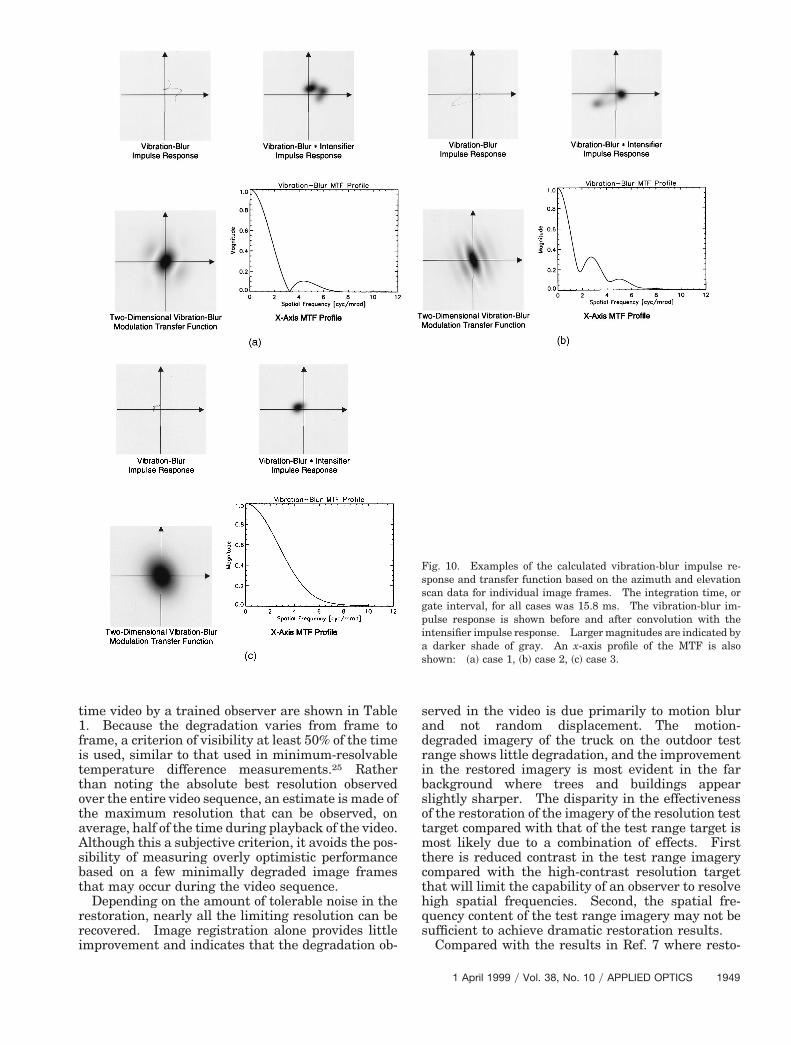
The observed vibration-blur degradation is highly de-pendent on the characteristics of the image motionpath during the integration time of the camera.Wide spectral content of the motion produces a com-plex vibrational motion described by a time-varyingtransfer function. Examples of the impulse re-sponse and transfer functions for three different im-age frames are shown in Fig. 10. For this case it isdifficult to characterize the image degradation be-cause of vibration with a single parameter such asrms motion in azimuth and elevation.
A sequence of 80 motion-degraded image frameswas processed by use of both the restoration algo-rithm and the standard subpixel block-matching reg-istration for comparison with stationary videoimagery. Excessive noise present in the individualimage frames of the ICCD video precludes a directcomparison of imagery on a frame-to-frame basis.During real-time playback of the video sequences, theimage noise is reduced considerably because of eyeintegration effects. This is observed in both the pro-cessed and the unprocessed imagery. To more
Fig. 9. Four-leaf rose scan pattern used to calibrate the piezo-electric scanning mirror.
948 APPLIED OPTICS y Vol. 38, No. 10 y 1 April 1999
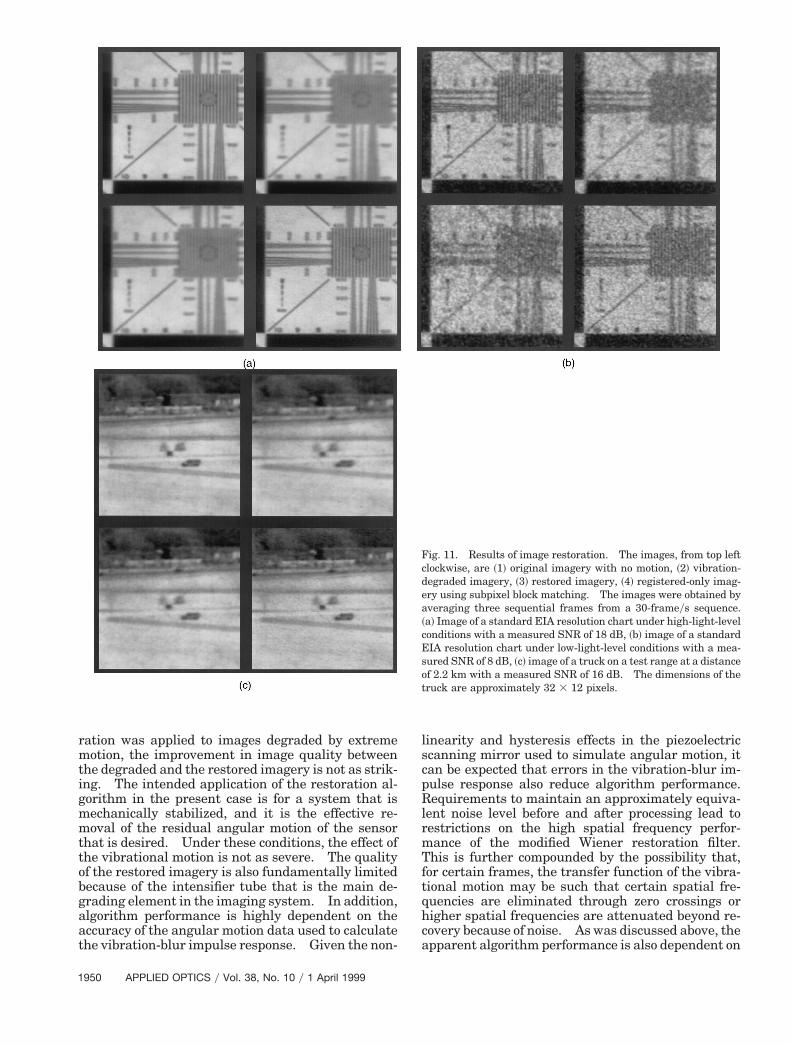
closely match the noise levels in the real-time video,three sequential frames, corresponding to a 0.1-s eyeintegration time, were averaged to generate the im-ages in Figs. 11~a! and 11~b! for the conditions of highnd low scene illumination levels with a resolutionarget, and in Fig. 11~c! for a test range target. Thestimated SNR’s of the averaged stationary imagerames for the three cases are 18, 8, and 16 dB, wherehe SNR is defined as
SNR 5 10 logS sim2
snoise2D , (9)
where sim2 is the variance of the noise-free image and
snoise2 is the variance of the noise. Estimates of the
variances are found from the three-frame-averagedimages by first assuming a zero-mean additiveGaussian noise model. The noise variance is esti-mated by selecting a reasonably uniform contiguousarea within the image and computing the varianceover that area under the assumption that the mean isconstant within the selected subimage. An estimateof the image variance is found by computing the vari-ance of the entire image and subtracting the noisevariance to yield the variance of the noise-free image.This estimate is valid if the image and the noise areindependent, and the noise is zero mean.
Although the results for the three-frame-averagedimagery indicate a large amount of vibration degra-dation for the resolution target, this is not represen-tative of what is actually seen in the real-timeplayback of the video sequences. During playback ofthe sequences, the motion-degraded imagery con-tains random displacement motion as well as a time-varying blur. To an observer, there are times whenthe resolution of the imagery approaches that of theimagery under stationary conditions and other mo-ments when the resolution is reduced. This is mostlikely due to the variation of the vibration-blur trans-fer function from frame to frame, but may also in-volve more-complex processes that occur in thehuman visual system.24 Under these conditions, thesimple three-frame average does not accuratelymodel the eye response, and the resolution of theaveraged image is worse than that observed in thevideo. In addition, variability in the severity of thevibration-blur degradation from frame to frame andlimitations in the Wiener filter cause a frame-to-frame variation in the quality of the restoration aswell as in the amount of image noise generated in therestoration process. Trade-offs must be made to de-termine the optimum SNR value in the Wiener filterto minimize temporal noise effects that are not re-duced because of averaging by the eye integrationtime. For the case of intensified imagery, temporalaveraging of the restored video through direct frameaveraging or real-time playback of the video is re-quired because of the large amount of noise present inthe individual image frames. This allows Wienerfilter restoration of imagery under conditions not pos-sible for typical single-frame processing.
Resolution measurements performed on the real-
time video by a trained observer are shown in Table1. Because the degradation varies from frame toframe, a criterion of visibility at least 50% of the timeis used, similar to that used in minimum-resolvabletemperature difference measurements.25 Ratherthan noting the absolute best resolution observedover the entire video sequence, an estimate is made ofthe maximum resolution that can be observed, onaverage, half of the time during playback of the video.Although this a subjective criterion, it avoids the pos-sibility of measuring overly optimistic performancebased on a few minimally degraded image framesthat may occur during the video sequence.
Depending on the amount of tolerable noise in therestoration, nearly all the limiting resolution can berecovered. Image registration alone provides littleimprovement and indicates that the degradation ob-
served in the video is due primarily to motion blurand not random displacement. The motion-degraded imagery of the truck on the outdoor testrange shows little degradation, and the improvementin the restored imagery is most evident in the farbackground where trees and buildings appearslightly sharper. The disparity in the effectivenessof the restoration of the imagery of the resolution testtarget compared with that of the test range target ismost likely due to a combination of effects. Firstthere is reduced contrast in the test range imagerycompared with the high-contrast resolution targetthat will limit the capability of an observer to resolvehigh spatial frequencies. Second, the spatial fre-quency content of the test range imagery may not besufficient to achieve dramatic restoration results.
Compared with the results in Ref. 7 where resto-
Fig. 10. Examples of the calculated vibration-blur impulse re-sponse and transfer function based on the azimuth and elevationscan data for individual image frames. The integration time, orgate interval, for all cases was 15.8 ms. The vibration-blur im-pulse response is shown before and after convolution with theintensifier impulse response. Larger magnitudes are indicated bya darker shade of gray. An x-axis profile of the MTF is alsoshown: ~a! case 1, ~b! case 2, ~c! case 3.
1 April 1999 y Vol. 38, No. 10 y APPLIED OPTICS 1949
1
ration was applied to images degraded by extrememotion, the improvement in image quality betweenthe degraded and the restored imagery is not as strik-ing. The intended application of the restoration al-gorithm in the present case is for a system that ismechanically stabilized, and it is the effective re-moval of the residual angular motion of the sensorthat is desired. Under these conditions, the effect ofthe vibrational motion is not as severe. The qualityof the restored imagery is also fundamentally limitedbecause of the intensifier tube that is the main de-grading element in the imaging system. In addition,algorithm performance is highly dependent on theaccuracy of the angular motion data used to calculatethe vibration-blur impulse response. Given the non-
950 APPLIED OPTICS y Vol. 38, No. 10 y 1 April 1999
linearity and hysteresis effects in the piezoelectricscanning mirror used to simulate angular motion, itcan be expected that errors in the vibration-blur im-pulse response also reduce algorithm performance.Requirements to maintain an approximately equiva-lent noise level before and after processing lead torestrictions on the high spatial frequency perfor-mance of the modified Wiener restoration filter.This is further compounded by the possibility that,for certain frames, the transfer function of the vibra-tional motion may be such that certain spatial fre-quencies are eliminated through zero crossings orhigher spatial frequencies are attenuated beyond re-covery because of noise. As was discussed above, theapparent algorithm performance is also dependent on
Fig. 11. Results of image restoration. The images, from top leftclockwise, are ~1! original imagery with no motion, ~2! vibration-degraded imagery, ~3! restored imagery, ~4! registered-only imag-ery using subpixel block matching. The images were obtained byaveraging three sequential frames from a 30-frameys sequence.~a! Image of a standard EIA resolution chart under high-light-levelconditions with a measured SNR of 18 dB, ~b! image of a standardEIA resolution chart under low-light-level conditions with a mea-sured SNR of 8 dB, ~c! image of a truck on a test range at a distanceof 2.2 km with a measured SNR of 16 dB. The dimensions of thetruck are approximately 32 3 12 pixels.
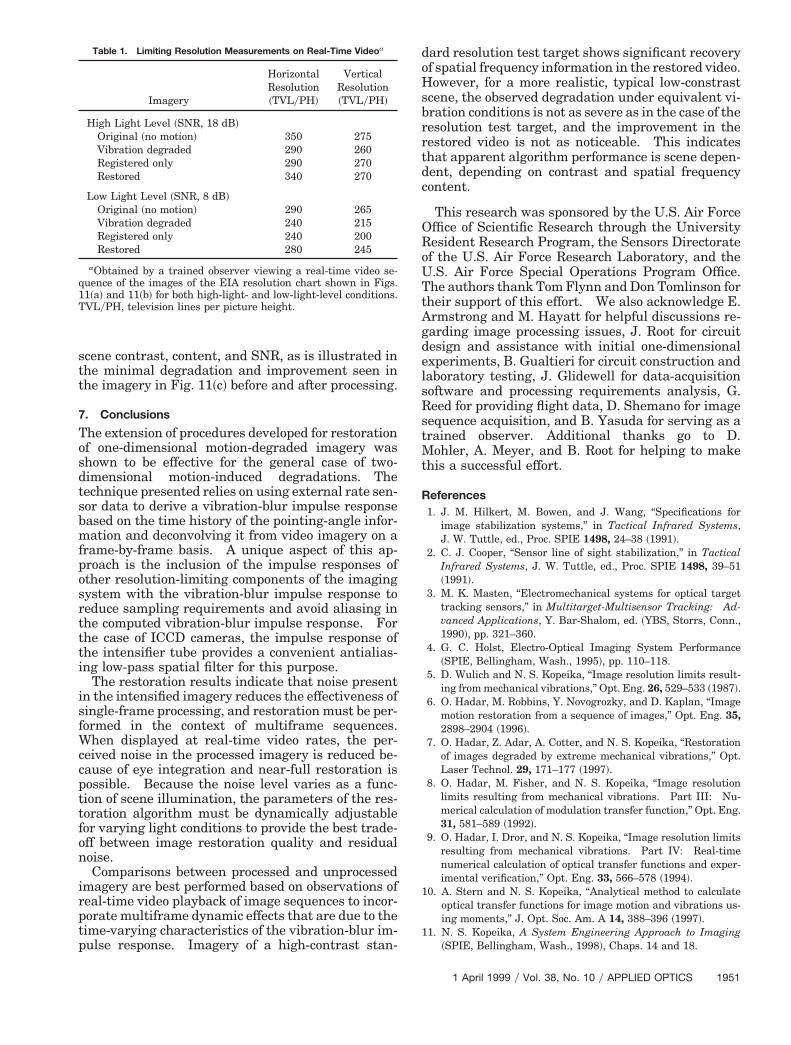
Table 1. Limiting Resolution Measurements on Real-Time Videoa
scene contrast, content, and SNR, as is illustrated inthe minimal degradation and improvement seen inthe imagery in Fig. 11~c! before and after processing.
7. Conclusions
The extension of procedures developed for restorationof one-dimensional motion-degraded imagery wasshown to be effective for the general case of two-dimensional motion-induced degradations. Thetechnique presented relies on using external rate sen-sor data to derive a vibration-blur impulse responsebased on the time history of the pointing-angle infor-mation and deconvolving it from video imagery on aframe-by-frame basis. A unique aspect of this ap-proach is the inclusion of the impulse responses ofother resolution-limiting components of the imagingsystem with the vibration-blur impulse response toreduce sampling requirements and avoid aliasing inthe computed vibration-blur impulse response. Forthe case of ICCD cameras, the impulse response ofthe intensifier tube provides a convenient antialias-ing low-pass spatial filter for this purpose.
The restoration results indicate that noise presentin the intensified imagery reduces the effectiveness ofsingle-frame processing, and restoration must be per-formed in the context of multiframe sequences.When displayed at real-time video rates, the per-ceived noise in the processed imagery is reduced be-cause of eye integration and near-full restoration ispossible. Because the noise level varies as a func-tion of scene illumination, the parameters of the res-toration algorithm must be dynamically adjustablefor varying light conditions to provide the best trade-off between image restoration quality and residualnoise.
Comparisons between processed and unprocessedimagery are best performed based on observations ofreal-time video playback of image sequences to incor-porate multiframe dynamic effects that are due to thetime-varying characteristics of the vibration-blur im-pulse response. Imagery of a high-contrast stan-
Imagery
HorizontalResolution~TVLyPH!
VerticalResolution~TVLyPH!
High Light Level ~SNR, 18 dB!Original ~no motion! 350 275Vibration degraded 290 260Registered only 290 270Restored 340 270
Low Light Level ~SNR, 8 dB!Original ~no motion! 290 265Vibration degraded 240 215Registered only 240 200Restored 280 245
aObtained by a trained observer viewing a real-time video se-quence of the images of the EIA resolution chart shown in Figs.11~a! and 11~b! for both high-light- and low-light-level conditions.TVLyPH, television lines per picture height.
dard resolution test target shows significant recoveryof spatial frequency information in the restored video.However, for a more realistic, typical low-constrastscene, the observed degradation under equivalent vi-bration conditions is not as severe as in the case of theresolution test target, and the improvement in therestored video is not as noticeable. This indicatesthat apparent algorithm performance is scene depen-dent, depending on contrast and spatial frequencycontent.
This research was sponsored by the U.S. Air ForceOffice of Scientific Research through the UniversityResident Research Program, the Sensors Directorateof the U.S. Air Force Research Laboratory, and theU.S. Air Force Special Operations Program Office.The authors thank Tom Flynn and Don Tomlinson fortheir support of this effort. We also acknowledge E.Armstrong and M. Hayatt for helpful discussions re-garding image processing issues, J. Root for circuitdesign and assistance with initial one-dimensionalexperiments, B. Gualtieri for circuit construction andlaboratory testing, J. Glidewell for data-acquisitionsoftware and processing requirements analysis, G.Reed for providing flight data, D. Shemano for imagesequence acquisition, and B. Yasuda for serving as atrained observer. Additional thanks go to D.Mohler, A. Meyer, and B. Root for helping to makethis a successful effort.
References1. J. M. Hilkert, M. Bowen, and J. Wang, “Specifications for
image stabilization systems,” in Tactical Infrared Systems,J. W. Tuttle, ed., Proc. SPIE 1498, 24–38 ~1991!.
2. C. J. Cooper, “Sensor line of sight stabilization,” in TacticalInfrared Systems, J. W. Tuttle, ed., Proc. SPIE 1498, 39–51~1991!.
3. M. K. Masten, “Electromechanical systems for optical targettracking sensors,” in Multitarget-Multisensor Tracking: Ad-vanced Applications, Y. Bar-Shalom, ed. ~YBS, Storrs, Conn.,1990!, pp. 321–360.
4. G. C. Holst, Electro-Optical Imaging System Performance~SPIE, Bellingham, Wash., 1995!, pp. 110–118.
5. D. Wulich and N. S. Kopeika, “Image resolution limits result-ing from mechanical vibrations,” Opt. Eng. 26, 529–533 ~1987!.
6. O. Hadar, M. Robbins, Y. Novogrozky, and D. Kaplan, “Imagemotion restoration from a sequence of images,” Opt. Eng. 35,2898–2904 ~1996!.
7. O. Hadar, Z. Adar, A. Cotter, and N. S. Kopeika, “Restorationof images degraded by extreme mechanical vibrations,” Opt.Laser Technol. 29, 171–177 ~1997!.
8. O. Hadar, M. Fisher, and N. S. Kopeika, “Image resolutionlimits resulting from mechanical vibrations. Part III: Nu-merical calculation of modulation transfer function,” Opt. Eng.31, 581–589 ~1992!.
9. O. Hadar, I. Dror, and N. S. Kopeika, “Image resolution limitsresulting from mechanical vibrations. Part IV: Real-timenumerical calculation of optical transfer functions and exper-imental verification,” Opt. Eng. 33, 566–578 ~1994!.
10. A. Stern and N. S. Kopeika, “Analytical method to calculateoptical transfer functions for image motion and vibrations us-ing moments,” J. Opt. Soc. Am. A 14, 388–396 ~1997!.
11. N. S. Kopeika, A System Engineering Approach to Imaging~SPIE, Bellingham, Wash., 1998!, Chaps. 14 and 18.
1 April 1999 y Vol. 38, No. 10 y APPLIED OPTICS 1951

12. Y. Yitzhaky and N. S. Kopeika, “Identification of blur param-
1
1
1
1
cessing ~Prentice-Hall, Englewood Cliffs, N.J., 1989!, pp. 407–
1
eters from motion blurred images,” CVGIP: Graph. ModelsImage Process.” 59, 310–320 ~1997!.
3. Y. Yitzhaky, I. Mor, A. Lantzman, and N. S. Kopeika, “Directmethod for restoration of motion-blurred images,” J. Opt. Soc.Am. A 15, 1512–1519 ~1998!.
4. A. Stern and N. S. Kopeika, “General restoration filter forvibrated-image restoration,” Appl. Opt. 37, 7596–7603 ~1998!.
5. C. W. Therrien, Discrete Random Signals and Statistical Sig-nal Processing ~Prentice-Hall, Englewood Cliffs, N.J., 1992!,pp. 587–588.
6. L. Levi, “Motion blurring with decaying detector response,”Appl. Opt. 10, 38–41 ~1971!.
17. S. C. Som, “Analysis of the effect of linear smear on photo-graphic images,” J. Opt. Soc. Am. 61, 859–864 ~1971!.
18. A. A. Sawchuk, “Space-variant image motion degradation andrestoration,” Proc. IEEE 60, 854–861 ~1972!.
19. A. V. Oppenheim and R. W. Shafer, Discrete-Time Signal Pro-
952 APPLIED OPTICS y Vol. 38, No. 10 y 1 April 1999
415.20. G. C. Holst, CCD Arrays, Cameras, and Displays ~SPIE, Bel-
lingham, Wash., 1996!, pp. 269–270.21. For example, A. K. Jain, Fundamentals of Digital Image Pro-
cessing, 2nd ed. ~Addison-Wesley, Reading, Mass., 1987!, pp.275–289.
22. A. M. Tekalp, Digital Video Processing ~Prentice-Hall PTR,Upper Saddle River, N.J., 1995!, pp. 95–116.
23. For example, P. Gillett, Calculus and Analytic Geometry~Heath, Lexington, Mass., 1981!, pp. 555–561.
24. S. T. Hammett and P. J. Bex, “Motion sharpening: evidencefor the addition of high spatial frequencies to the effectiveneural image,” Vision Res. 36, 2729–2733 ~1996!.
25. G. C. Holst, “Infrared imaging system testing,” in Electro-Optical Systems Design, Analysis, and Testing, Vol. 4 of TheInfrared and Electro-Optical Systems Handbook, M. C.Dudzik, ed. ~SPIE, Bellingham, Wash., 1993!, pp. 235–241.