Embed Size (px)
Citation preview

FINAL REPORT
Twentynine Palms Wastewater Master Plan
August 2014
Prepared for
City of Twentynine Palms and Twentynine Palms Water District72401 Hatch Road
Twentynine Palms, CA 92277-2935
3210 El Camino Real, Suite 150Irvine, California 92602-1365
949-261-1577FAX: 949-261-2134
K/J Project No. 1283001*00

3210 El Camino Real Street, Suite 150Irvine, California 92602
949-261-1577949-261-2134 (Fax)
Twentynine Palms
Wastewater Master Plan
29 August 2014
Prepared for
City of Twentynine Palms and Twentynine Palms Water
District 72401 Hatch Road
Twentynine Palms, CA 92277-2935
K/J Project No. 1283001*00

FINAL Twentynine Palms Wastewater Master Plan i
Table of Contents
List of References ........................................................................................................................ iv
List of Tables ................................................................................................................................ iv
List of Figures............................................................................................................................... iv
List of Appendices ......................................................................................................................... v
Executive Summary ....................................................................................................................... I
Section 1: Introduction ............................................................................... 1-1
1.1 Background ......................................................................................... 1-1 1.2 Purpose ............................................................................................... 1-1 1.3 Objectives and Scope ......................................................................... 1-2 1.4 Underlying Regulatory Framework ...................................................... 1-3
1.4.1 RWQCB Region 7 Basin Plan .................................................. 1-3 1.4.2 Region 7 Basin Plan Amendment ............................................ 1-4 1.4.3 Statewide Septic Systems Proposed Policy ............................. 1-5 1.4.4 Region 7 Guidelines for Sewage Disposal from Land
Developments .......................................................................... 1-6 1.4.5 Anti-Degradation Policy Summary ........................................... 1-6
1.5 District Water Planning and Previous Studies ..................................... 1-6 1.5.1 2010 Urban Water Management Plan (UWMP) ....................... 1-6 1.5.2 1997 Master Plan of Drainage (MPD) ...................................... 1-7 1.5.3 2008 Wastewater Treatment Plant, Joint-Use Study ............... 1-7 1.5.4 2008 Groundwater Management Plan ..................................... 1-7 1.5.5 Other Relevant Data ................................................................ 1-7 1.5.6 Groundwater Study .................................................................. 1-7
1.6 Report Organization ............................................................................ 1-8 1.7 Abbreviations and Acronyms ............................................................... 1-8
Section 2: Background and Study Area ...................................................... 2-1
2.1 Study Area .......................................................................................... 2-1 2.2 Land Use ............................................................................................. 2-1 2.3 Climate and Rainfall ............................................................................ 2-2 2.4 Topography ......................................................................................... 2-3 2.5 Geology ............................................................................................... 2-3 2.6 Water Sources .................................................................................... 2-3
2.6.1 Groundwater ............................................................................ 2-4 2.7 Groundwater Subbasins ...................................................................... 2-4
2.7.1 Indian Cove Subbasin .............................................................. 2-5 2.7.2 Fortynine Palms Subbasin ....................................................... 2-5 2.7.3 Eastern Subbasin ..................................................................... 2-5 2.7.4 Mesquite Lake Subbasin .......................................................... 2-5

Table of Contents (cont'd)
FINAL Twentynine Palms Wastewater Master Plan ii
Section 3: Water Usage .............................................................................. 3-1
3.1 Historic Water Use .............................................................................. 3-1 3.1.1 Water Demand Classification by Customer Type .................... 3-1 3.1.2 Water Demand Classification by Number of Connections ....... 3-2 3.1.3 Historic Water Demand Seasonal Variation ............................. 3-3 3.1.4 Non-Revenue Water ................................................................ 3-3
3.2 Project Planning Scenarios ................................................................. 3-4 3.2.1 Current Scenario: Baseline ...................................................... 3-4 3.2.2 2035 Scenario .......................................................................... 3-4 3.2.3 Build-Out Scenario ................................................................... 3-4
3.3 Population Projections......................................................................... 3-4 3.3.1 Current Population ................................................................... 3-5 3.3.2 2035 Population ....................................................................... 3-5 3.3.3 Build-Out Population ................................................................ 3-5
Section 4: Wastewater Flows ..................................................................... 4-1
4.1 Wastewater Flow Projections Approach .............................................. 4-1 4.1.1 Key Assumptions for Flow Calculations ................................... 4-1
4.1.1.1 Water to Sewer Return Ratios ............................... 4-1 4.1.1.2 Per Capita Water Demand for Current
Scenario ................................................................. 4-2 4.1.1.3 Per Capita Water Demand for Build-out
Scenario ................................................................. 4-2 4.1.2 Residential Loadings ................................................................ 4-3 4.1.3 Non Residential Loadings ........................................................ 4-3
4.2 Wastewater Flows ............................................................................... 4-4 4.3 Data Sources for Wastewater Flow Estimation ................................... 4-5
Section 5: Wastewater Hydraulic Model .................................................... 5-1
5.1 Modeling Software............................................................................... 5-1 5.2 Data Sources ...................................................................................... 5-1 5.3 Model Construction ............................................................................. 5-2
5.3.1 Basic Terminology of Model Data ............................................ 5-2 5.3.1.1 Nodes .................................................................... 5-2 5.3.1.2 Links ...................................................................... 5-2 5.3.1.3 Sub-catchments ..................................................... 5-2 5.3.1.4 Model loads ........................................................... 5-3 5.3.1.5 Models ................................................................... 5-3
5.3.2 Model Building.......................................................................... 5-3 5.3.2.1 Network Trunks ...................................................... 5-3 5.3.2.2 Delineation of Trunk Sheds ................................... 5-3 5.3.2.3 Sub catchment and Watershed Definitions ............ 5-4 5.3.2.4 Manholes ............................................................... 5-4
5.4 Hydraulic Design Criteria and Boundary Conditions ........................... 5-4 5.4.1 Dry Weather Peak Design Flows ............................................. 5-4
Table of Contents (cont'd)
FINAL Twentynine Palms Wastewater Master Plan iii
5.4.2 Wet Weather Flows - Infiltration/Inflow (I&I) ............................. 5-5 5.4.3 Diurnal Peaking Factors ........................................................... 5-6 5.4.4 d/D Ratios ................................................................................ 5-6 5.4.5 Pipeline Slopes ........................................................................ 5-6 5.4.6 Maximum Allowable Velocity .................................................... 5-6 5.4.7 Facilities ................................................................................... 5-7 5.4.8 Crown Depth ............................................................................ 5-7
5.5 Demand Loading ................................................................................. 5-7
Section 6: Wastewater System Evaluation ................................................ 6-1
6.1 Evaluation Approach ........................................................................... 6-1 6.2 System Capacity Analysis ................................................................... 6-2
6.2.1 System Alignment .................................................................... 6-2 6.2.2 Trunk-Sewer Pipelines ............................................................. 6-2 6.2.3 Wastewater Treatment Plan ..................................................... 6-3
6.2.3.1 Mainside Facility .................................................... 6-3 6.2.3.2 New WWTP for Area Flows ................................... 6-4
6.3 Treatment Disposal Technologies and Options .................................. 6-4 6.3.1 Cost Effectiveness of Staging .................................................. 6-4 6.3.2 Plant Development Scenario .................................................... 6-5 6.3.3 Treatment Process Selection ................................................... 6-6
6.3.3.1 Sequencing Batch Reactor .................................... 6-6 6.3.3.2 Extended Aeration Membrane Bioreactor .............. 6-6 6.3.3.3 Modified Ludzack Ettinger ..................................... 6-7 6.3.3.4 Five Stage Bardenpho ........................................... 6-7
6.3.4 Recommended Process for Twentynine Palms ....................... 6-7
Section 7: Capital Improvement Program (CIP) ......................................... 7-1
7.1 Cost Estimating Criteria ....................................................................... 7-1 7.1.1 Trunk Sewer Costs ................................................................... 7-1 7.1.2 Manholes Costs ....................................................................... 7-2 7.1.3 Collector and Laterals Costs .................................................... 7-2 7.1.4 Trunk System Lift Stations ....................................................... 7-2 7.1.5 Wastewater Treatment Facility ................................................. 7-3
7.2 Total CIP for Entire Area ..................................................................... 7-3 7.3 Overview of the SNMP Findings and Influence on the CIP ................. 7-4
7.3.1 Existing and Future Wastewater Systems ............................... 7-4 7.3.2 Salt and Nutrient Management Plan Overview ........................ 7-5 7.3.3 Salt and Nutrient Management Plan Findings .......................... 7-6 7.3.4 Groundwater Protection Sensitivity Analysis and
Implementation Plan for Phasing of Improvements ................. 7-7 7.3.4.1 Revised Lower Loading Conditions ....................... 7-8 7.3.4.2 Revised Higher Loading Conditions ....................... 7-8
7.3.5 Ultimate Build-Out of Wastewater Improvements .................... 7-9 7.4 Conclusion and Recommendations ................................................... 7-10

Table of Contents (cont'd)
FINAL Twentynine Palms Wastewater Master Plan iv
List of References
List of Tables
Table 1-1 List of Acronyms
Table 2-1 Twentynine Palms Climate Data
Table 3-1 Historic Water Use
Table 3-2 Historic Water Demand by Customer Type (AF)
Table 3-3 Historic Number of Service Connections by Customer Type
Table 3-4 Historic Production, Sales and Losses
Table 3-5 Historic Population Estimates
Table 3-6 Population Projections
Table 3-7 Projected Build-Out Population Estimate
Table 4-1 Summary of Wastewater Flow Estimates
Table 4-2 Data Sources for Wastewater Flow Estimates
Table 5-1 Average Monthly Precipitation Data for Twentynine Palms Station (1935-2012)
Table 5-2 Sub-Catchment and Manhole Loading
Table 6-1 Sewer System Pipe Types, sizes and Lengths
Table 7-1 Sewer Trunk System Unit Costs
Table 7-2 Lift Station CIP Costs
Table 7-3 Estimated CIP Costs for Build-out Area
Table 7-4 Estimated CIP Costs Excluding Northern Unincorporated Area
Table 7-5 Septic Loading Rate Sensitivity Analysis (Current Conditions)
List of Figures
Figure 1-1 Site Map
Figure 2-1 Groundwater Basin and Sub Basins
Figure 2-2 Total Land Use Area Percentages
Figure 2-3 Build Out Land Use
Figure 2-4 Twentynine Palms Topographical Map
Figure 2-5 Regional Geologic Map
Table of Contents (cont'd)
FINAL Twentynine Palms Wastewater Master Plan v
Figure 2-6 Location of Geographic Faults for the Twentynine Palms Area
Figure 2-7 Groundwater Subbasin Boundaries and Wells
Figure 3-1 Water Demand by Customer Type (2011)
Figure 3-2 Service Connections by Customer Type (2011)
Figure 3-3 Comparison of Number of Services Connections and Demand (2011)
Figure 3-4 Monthly Water Usage (CCF) by Customer Category
Figure 3-5 Area Populations
Figure 5-1 Sewer Trunk Locations
Figure 5-2 Sewer Trunk Sheds Flows and Land Uses
Figure 5-3 Daily Average Precipitation
Figure 5-4 Precipitation Probability by Quantity
Figure 5-5 Twentynine Palms Region Diurnal Curve
Figure 7-1 Representative Wastewater System – Build-out Conditions
Figure 7-2 Representative Wastewater System – Excluding Northern Unincorporated Area
List of Appendices
A Wastewater Flow Calculations
B CIP Cost Estimates C Twentynine Palms Parcel Size Map

FINAL Twentynine Palms Wastewater Master Plan Executive Summary - I
Executive Summary
The primary purpose of the Wastewater Master Plan (WWMP or Plan) is to develop a conceptual sewer collection and treatment system that could serve the City of Twentynine Palms (City) and the Twentynine Palms Water District (District) for the prevention of future potential groundwater impacts from septic tanks within their boundaries and sphere of influence (SOI). The WWMP was prepared in conjunction with a Salt and Nutrient Management Plan (SNMP), prepared under separate cover, and incorporates the results of that study with master planning processes and outcomes.
Goals and Purpose
Given that groundwater is currently the area’s only source of water supply, understanding the potential effects of growth on water use and sewer loadings to the groundwater is very important. To this end, the City and the District retained Kennedy/Jenks Consultants to prepare a SNMP to assess the long-term potential impacts to groundwater quality from the continued use of septic systems. To minimize the quantities of nutrients and minerals that return to the groundwater following pumping and use requires the implementation of a wastewater collection and treatment system. This WWMP incorporates the findings of the above and assesses the need for sewers and its implications as a wastewater treatment disposal alternative.
The Wastewater Master Plan is designed to identify and describe the potential facilities that would be required for a centralized sewer collection system and wastewater treatment plant to replace the septic systems currently in place. A new centralized system would include the area of the City of Twentynine Palms and the unincorporated areas around the City. The main objectives of the Wastewater Master Plan study documented in this report are:
Estimate existing and future wastewater flows in the Study Area
Develop a hydraulic model of the trunk-sewer system to identify future facilities that could be needed if the area was to be taken off the existing septic systems
Prepare conceptual level planning costs for the wastewater system identified
Given the uncertainty of key data, it is important to note that this Plan is intended to be used as a general planning tool rather than a blueprint.
Overview of Wastewater System Analysis
Twentynine Palms is located in the high desert of Southern California in San Bernardino County (County). The Twentynine Palms Water District (Water District or District) serves the entire City as well as some of the City’s SOI, located in unincorporated areas of San Bernardino County. The current estimate of the population of the Water District is near 19,000 based on the 2010 UWMP with projections scheduled to reach as high as 31,000 by 2035 (Kennedy/Jenks, 2011)
The overall land area of the City is sparsely populated, having higher density areas of 4 to 8 residences per acre primarily in areas adjacent to the City’s main thoroughfares. This is also the location of the large majority of the City’s commercial, industrial and public land area as well.

FINAL Twentynine Palms Wastewater Master Plan Executive Summary - II
These regions produce the highest quantity of wastewater due to their density and are therefore the greatest potential threat to the quality of the groundwater basin.
As with the City’s population and services, much of the infrastructure that serves the residents of Twentynine Palms is also in the City’s main roads. The City, County and other reference sources were consulted in assembling data to conduct the analysis of the City for the implementation of a wastewater collection and treatment system. GIS Data obtained included land use, parcels, streets, digital contours, water line coverage’s, city and water district boundaries, etc.. Additional data included municipal water use and well use, land use characteristics and restrictions, and census data.
The data collected was reviewed within the context of water use to wastewater production for the current, 2035 and ultimate populations expected to inhabit the City and its SOI. The SNMP reviewed studies completed recently in nearby areas as reference for expected rates of conversion of water use to wastewater production. The results of this analysis became the basis for the analysis of groundwater salt and nutrient loading as well as wastewater collection system loading. GIS data for land uses, City, County and water district boundaries, streets and digital contour data were used to create sub-catchments, or drainage sub-basins. Given the elevation and characteristics of each sub-catchment, a representative sewer trunk pipeline alignment was chosen. These facilities were loaded with the wastewater generation factors derived and modeled for conveyance to a regional area for wastewater treatment and disposal.
The analysis also determined that due to the relatively flat geography in much of the City, sewage lift stations and force mains would be required in multiple locations to deliver this wastewater to a treatment facility. Several options were considered for treatment including the development of facility staging strategies that would maximize the performance and cost effectiveness of long-term treatment and disposal options.
The wastewater system master plan concluded with the development of the potential capital improvement requirements that may be needed to provide a system-wide sewer system for the area at build-out. To support the overarching goal of long-term protection of the groundwater quality, implementation and phasing needs were driven by the results and recommendations of the Salt and Nutrient Management Plan (SNMP).
System Analyses Findings
Wastewater quantity estimates were derived under current, 2035 and ultimate build-out conditions. Consistent with the goals of this plan, the build-out population was used to size regional sewer facilities, such as trunk pipelines, lift stations, and treatment facility capacity requirements. As discussed with City staff, the build-out population for the City of Twentynine Palms and its SOI were estimated to be 102,963. Planned land uses and adopted densities were primarily used to estimate maximum attainable population. The timeframe associated with growing from a current population of approximately 20,000 to this build-out level was not estimated. However, it can be assumed that build-out is decades away.

FINAL Twentynine Palms Wastewater Master Plan Executive Summary - III
To support the development of the master plan's potential infrastructure in the area, the population was divided into sub-catchments/watersheds. Eleven area were defined within the City and its sphere of influence with areas ranging from approximately 1,350 to 11,700 acres. Flows within the watershed areas were estimated to be from 0.18 million gallons per day (MGD) in the sparsely populated unincorporated areas northwest of the City, to 4.13 MGD in the more urban areas at the center of town. Together, these eleven areas combined for an estimated daily wastewater loading at build-out of approximately 9.3 MGD.
Based on the hydraulic system analysis, sewer trunk pipelines and facilities were derived. Sizing of sewer trunk gravity and force main pipelines are recommended based upon criteria developed within the study, including sizing for peak flows and minimum slopes and velocities within each pipeline. Calculated trunk size varies greatly throughout the City and Water District boundaries, being quite small in outlying regions such as the unincorporated area and western portions of the City and quite large in the center and eastern portions of the City. In order to handle these flows, gravity pipelines range from 10 to 42 inches in diameter. Force mains vary from 6 to 30 inches in diameter. Pumps at low points in the system are also sized based on the results of the analyses and range from 300 gallons per minute (gpm) when collecting from smaller trunk lines in the unincorporated area to more than 10,000 gpm near the end of the collection system.
The alignment of a potential trunk system follows the major arterial roads within the City, as well as sharing its alignment with some of the larger water pipelines in the Water District. Sewer trunks were generally sited along Lear Avenue, Two Mile Road, 29 Palms Highway, Adobe Road, Camino del Oro, Utah Trail and Baseline Avenue. All of these alignments are on major local streets; the majority of them run through high density areas. These trunk system pipelines would serve as the backbone of a larger sewage collection system. New branches from each trunk system would be established to serve the City and its sphere of influence. The collector and lateral pipeline analysis has not been derived as that level of detail is beyond the scope of this planning study.
As discussed with City and District staff, it is suggested that the approach for long-term treatment and disposal be based on centralized treatment, and a future location be established that would serve the entire service area. Decentralized treatment facilities are an option that was considered in this study, however they have not been recommended due to the decreased ability to provide oversight and the difficulties of regulating private treatment facilities. Similarly, expanding and utilizing the MCGACC Mainside Treatment facility was also not recommended. A shared treatment facility was also explored in a 2008 report prepared by Winzler & Kelly for the Naval Facilities Engineering Command. The recommendation of that study was consistent with the findings of this Master Plan. That is - the costs associated with the additional infrastructure required to move the entire volume of city-generated wastewater several miles north, and pay for the expansion of the existing MCGACC treatment facility are considered prohibitive.
A important consideration of a centralized treatment plant approach is the need to accommodate system phasing. The central treatment plant should be sited at a location that could ultimately treat the estimated build-out wastewater discharges of approximately 9.3 MGD. Incremental construction of phased capacity expansions could then be provided as the City grows. The total conceptual cost for a build-out wastewater collection, pumping and treatment system is estimated at approximately $290 million.
FINAL Twentynine Palms Wastewater Master Plan Executive Summary - IV
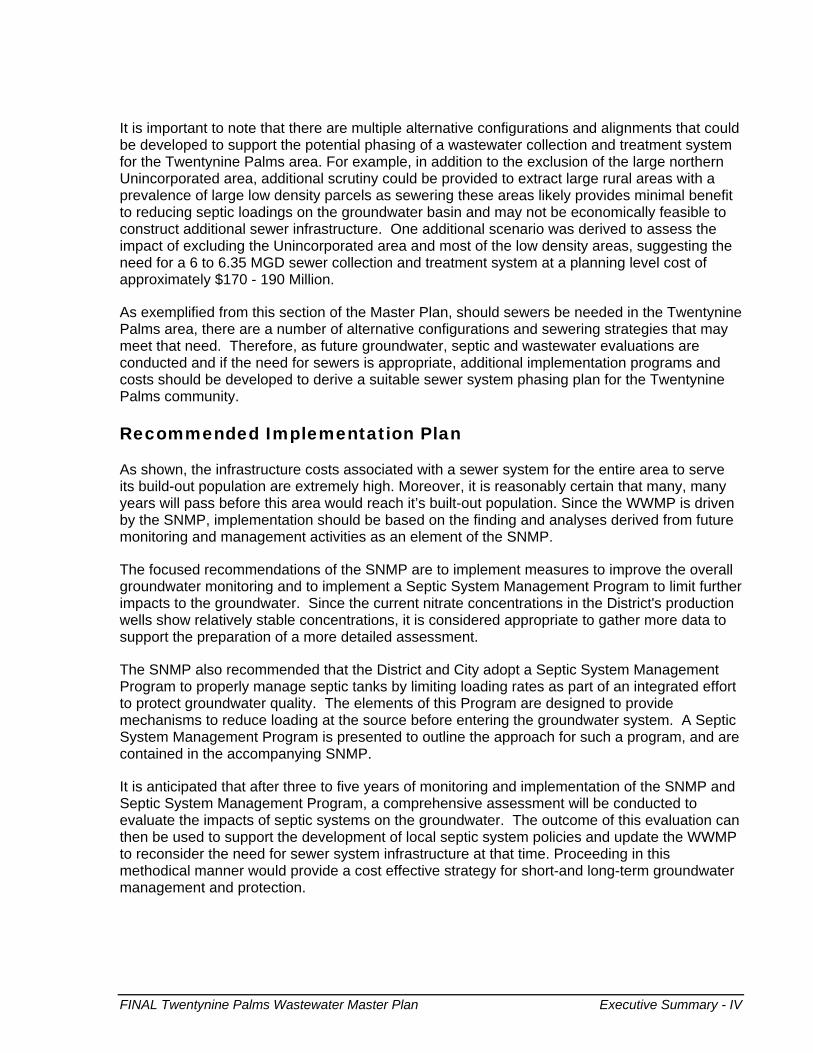
It is important to note that there are multiple alternative configurations and alignments that could be developed to support the potential phasing of a wastewater collection and treatment system for the Twentynine Palms area. For example, in addition to the exclusion of the large northern Unincorporated area, additional scrutiny could be provided to extract large rural areas with a prevalence of large low density parcels as sewering these areas likely provides minimal benefit to reducing septic loadings on the groundwater basin and may not be economically feasible to construct additional sewer infrastructure. One additional scenario was derived to assess the impact of excluding the Unincorporated area and most of the low density areas, suggesting the need for a 6 to 6.35 MGD sewer collection and treatment system at a planning level cost of approximately $170 - 190 Million.
As exemplified from this section of the Master Plan, should sewers be needed in the Twentynine Palms area, there are a number of alternative configurations and sewering strategies that may meet that need. Therefore, as future groundwater, septic and wastewater evaluations are conducted and if the need for sewers is appropriate, additional implementation programs and costs should be developed to derive a suitable sewer system phasing plan for the Twentynine Palms community.
Recommended Implementation Plan
As shown, the infrastructure costs associated with a sewer system for the entire area to serve its build-out population are extremely high. Moreover, it is reasonably certain that many, many years will pass before this area would reach it’s built-out population. Since the WWMP is driven by the SNMP, implementation should be based on the finding and analyses derived from future monitoring and management activities as an element of the SNMP.
The focused recommendations of the SNMP are to implement measures to improve the overall groundwater monitoring and to implement a Septic System Management Program to limit further impacts to the groundwater. Since the current nitrate concentrations in the District's production wells show relatively stable concentrations, it is considered appropriate to gather more data to support the preparation of a more detailed assessment.
The SNMP also recommended that the District and City adopt a Septic System Management Program to properly manage septic tanks by limiting loading rates as part of an integrated effort to protect groundwater quality. The elements of this Program are designed to provide mechanisms to reduce loading at the source before entering the groundwater system. A Septic System Management Program is presented to outline the approach for such a program, and are contained in the accompanying SNMP.
It is anticipated that after three to five years of monitoring and implementation of the SNMP and Septic System Management Program, a comprehensive assessment will be conducted to evaluate the impacts of septic systems on the groundwater. The outcome of this evaluation can then be used to support the development of local septic system policies and update the WWMP to reconsider the need for sewer system infrastructure at that time. Proceeding in this methodical manner would provide a cost effective strategy for short-and long-term groundwater management and protection.

FINAL Twentynine Palms Wastewater Master Plan Page 1-1
Section 1: Introduction
This Wastewater Master Plan (WWMP or Plan) was prepared by Kennedy/Jenks Consultants (Kennedy/Jenks) for the City of Twentynine Palms (City) and Twentynine Palms Water District (TPWD or District). The main objective of the Plan is to consider the need for sewers, in comparison to the septic systems currently in use, based on the findings of the Salt and Nutrient Management Plan study for the Twentynine Palms area.
1.1 Background This WWMP was prepared in parallel with a Salt and Nutrient Management Plan(SNMP) for the Twentynine Palms area. The WWMP and SNMP are the two major elements of the overall management plan for assessing the potential impact on groundwater quality from the existing septic systems and anticipated future development. The WWMP, in particular, was prepared to assess the need for sewers to meet the management objective established by the City and District, with an implementation plan and financial impact analysis. The WWMP relies on the SNMP assessment findings for the estimates of current and future projected salt and nutrient loadings from septic tanks to the groundwater basins and potential anticipated groundwater quality issues. The potential impact of septic systems on groundwater quality was considered to derive localized sewers/treatment systems, as discussed. Figure 1-1 shows the general site map for the Twentynine Palms area with the boundaries of the City and District considered in the WMMP.
1.2 Purpose The Twentynine Palms Water District service area consists primarily of the City of Twentynine Palms, and surrounding unincorporated areas located in the County of San Bernardino. This service area is approximately 87 square miles in size and currently serves potable water to a civilian population of approximately 19,000. The Mainside area of the Marine Corp Air Ground Combat Station (MCAGCC) is incorporated in the City’s service area, but the City is not providing any services. The TPWD operates and maintains a water treatment distribution system including a water treatment facility, pumping, storage, and pipelines to meet this demand. To date TPWD has not contracted with MWD or the SWP to receive water deliveries and is extracting its entire water supply from three local groundwater basins which are the Twentynine Palms Valley Groundwater Basin, Joshua Tree Groundwater Basin and Dale Valley Groundwater Basin.
Wastewater generated in Twentynine Palms is currently treated in septic tanks or leach fields and discharged to the ground. The exceptions to this are the Mainside area of MCAGCC and some of the newer subdivisions which contain on-site wastewater collection and treatment systems. The City is concentrated around commercial areas which run along State Highway 62, also known as the Twentynine Palms Highway, and Adobe Road, which runs north to the Military Base. These areas contain the majority of multifamily and relatively dense single family land uses. Less dense single family and rural living are located in the majority of the remainder of the City. As population growth continues and more lands are urbanized, water usage, and therefore, septic loading within the District service area is anticipated to increase.

FINAL Twentynine Palms Wastewater Master Plan Page 1-2
Given that groundwater is currently the area’s only source of water supply, understanding the potential effects of growth on water use and sewer loadings to the groundwater is very important. To this end, the City and the District prepared a SNMP to assess the long-term potential impacts to groundwater quality from the continued use of septic systems. This WWMP incorporates the findings of the above and assesses the need for sewers and its implications as a wastewater treatment disposal alternative.
1.3 Objectives and Scope The objective of this study is to apply the findings of the concurrent Salt and Nutrient Management Plan (SNMP) to establish a potential system for treating wastewater within the TPWD service area. Currently the entire City and the surrounding unincorporated areas, except for the Mainside area of MCAGCC, are on septic tanks or leach fields. It is known that septic tanks in urban areas can negatively affect the quality of groundwater so the City and District has decided to investigate the installation of sewers and a wastewater treatment system. Neither the District, City, nor the County of San Bernardino has any knowledge of or data showing problems with the local septic systems or degradation of the groundwater basin, however all parties have committed to a proactive assessment of the potential contamination of local groundwater resources.
This Wastewater Master Plan study is to identify and describe the facilities that would be required for a centralized sewer collection system and wastewater treatment plant to replace the septic systems currently in place. The new centralized system, if implemented, would include the area of the City of Twentynine Palms and the unincorporated areas around the City.
The main objectives of the Wastewater Master Plan study documented in this report are:
Estimate existing and future wastewater flows in the Study Area
Develop a hydraulic model of the City’s trunk- sewer system to identify future facilities that could be needed if the area was to be taken off the existing septic systems
Prepare conceptual level planning costs for the wastewater system identified
This Plan shall serve as a management and planning document that shall generally guide the actions of TPWD. It is important to note that this Plan is intended to be used as a general planning tool rather than a blueprint. Due to the uncertainty of growth, and other factors like groundwater quality, cost, etc. it will be necessary to update this Plan in the future to incorporate an increase in the influx of relevant data that affects the City and any proposed system.
The Scope of Work for this study includes the following tasks:
Task 1: Data Collection and Review
Task 2: Assessment of the Need for Sewers
Task 3: Evaluation of Effluent Disposal Options
Task 4: Evaluation of Necessary Treatment Processes
FINAL Twentynine Palms Wastewater Master Plan Page 1-3
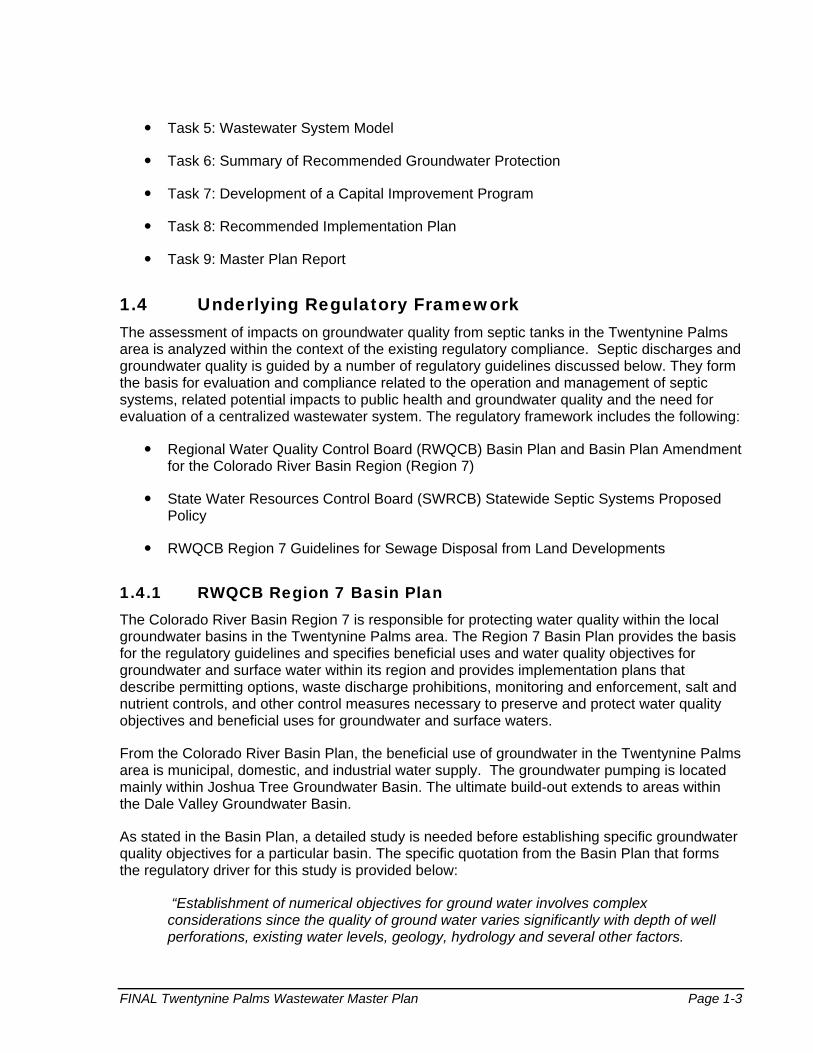
Task 5: Wastewater System Model
Task 6: Summary of Recommended Groundwater Protection
Task 7: Development of a Capital Improvement Program
Task 8: Recommended Implementation Plan
Task 9: Master Plan Report
1.4 Underlying Regulatory Framework The assessment of impacts on groundwater quality from septic tanks in the Twentynine Palms area is analyzed within the context of the existing regulatory compliance. Septic discharges and groundwater quality is guided by a number of regulatory guidelines discussed below. They form the basis for evaluation and compliance related to the operation and management of septic systems, related potential impacts to public health and groundwater quality and the need for evaluation of a centralized wastewater system. The regulatory framework includes the following:
Regional Water Quality Control Board (RWQCB) Basin Plan and Basin Plan Amendment for the Colorado River Basin Region (Region 7)
State Water Resources Control Board (SWRCB) Statewide Septic Systems Proposed Policy
RWQCB Region 7 Guidelines for Sewage Disposal from Land Developments
1.4.1 RWQCB Region 7 Basin Plan The Colorado River Basin Region 7 is responsible for protecting water quality within the local groundwater basins in the Twentynine Palms area. The Region 7 Basin Plan provides the basis for the regulatory guidelines and specifies beneficial uses and water quality objectives for groundwater and surface water within its region and provides implementation plans that describe permitting options, waste discharge prohibitions, monitoring and enforcement, salt and nutrient controls, and other control measures necessary to preserve and protect water quality objectives and beneficial uses for groundwater and surface waters.
From the Colorado River Basin Plan, the beneficial use of groundwater in the Twentynine Palms area is municipal, domestic, and industrial water supply. The groundwater pumping is located mainly within Joshua Tree Groundwater Basin. The ultimate build-out extends to areas within the Dale Valley Groundwater Basin.
As stated in the Basin Plan, a detailed study is needed before establishing specific groundwater quality objectives for a particular basin. The specific quotation from the Basin Plan that forms the regulatory driver for this study is provided below:
“Establishment of numerical objectives for ground water involves complex considerations since the quality of ground water varies significantly with depth of well perforations, existing water levels, geology, hydrology and several other factors.

FINAL Twentynine Palms Wastewater Master Plan Page 1-4
Unavailability of adequate historical data compounds this problem. The Regional Board believes that detailed investigation of the ground water basins should be conducted before establishing specific ground water quality objectives.”
The RWQCB’s objective is to minimize the quantities of contaminants reaching any groundwater basin and maintain existing water quality where feasible. The Region 7 Basin Plan has narrative groundwater quality objectives with respect to TDS, EC, nitrate, and other chemicals of concerns. In general, water quality objectives for groundwater are drinking water standards or the maximum contaminant levels (MCLs), as described below:
Waters designated for use as domestic or municipal supply (MUN) shall not contain concentrations of chemical constituents in excess of the limits specified in California Code of Regulations, Title 22 (Chapter 15, Article 4, Section 64435, Tables 2, 3, and 4) as a result of human activity.
Ground waters designated for use as domestic or municipal supply (MUN) shall not contain taste or odor-producing substances in concentrations that adversely affect beneficial uses as a result of human activity.
Ground waters designated for use as domestic or municipal supply (MUN) shall not contain concentration of coliform organisms in excess of the limits specified in California Code of Regulations, Title 22, Chapter 15, Article 3.
Nitrates and TDS are specifically noted in the Basin Plan and the objective is to establish appropriate management practices. The limit is defined by the MCL of 10 mg/l for nitrate (as nitrogen). With respect to salt, all surface and ground waters are considered to be suitable, or potentially suitable, for municipal or domestic water supply with the exception of surface or groundwater where TDS exceeds 3,000 mg/l (5,000 us/cm, electrical conductivity), and it is not reasonably expected by the RWQCB to supply a public water system.
The Basin Plan also states that ideally the RWQCB's goal is to maintain the existing water quality of all non-degraded ground water basins. However, in most cases ground water that is pumped generally returns to the basin after use with an increase in mineral concentrations such as TDS, nitrate etc., that are picked up by water during its use. Under these circumstances, the RWQCB’s objective is to minimize the quantities of contaminants reaching any ground water basin. This could be achieved by establishing management practices for major discharges to land. Until the RWQCB can complete investigations for the establishment of management practices, the objective will be to maintain the existing water quality where feasible.
1.4.2 Region 7 Basin Plan Amendment The Region 7 Basin Plan includes prohibitions on the use of septic systems in certain areas. The 2008 Basin Plan includes prohibitions in two areas, including Cathedral City Cove, and in areas that overlie the Mission Creek and Desert Hot Springs Aquifers. These prohibitions were adopted in 2002, and 2004, respectively.

FINAL Twentynine Palms Wastewater Master Plan Page 1-5
In May 2011, the Region 7 Basin Plan was further amended to prohibit the discharge of wastes from septic systems in specific areas in the Town of Yucca Valley to mitigate and eliminate the threat of nitrate contamination to groundwater due to septic tank discharges (RWQCB, 2011). This Basin Plan Amendment requires the Town of Yucca Valley to construct a wastewater treatment plant and collection system.
The 2003 USGS study that was conducted in support of the 2011 Basin Plan amendment is of particular interest and briefly discussed below, to provide the background studies that led to the Basin Plan amendment on the use of septic systems in the Yucca Valley area.
1.4.3 Statewide Septic Systems Proposed Policy On June 5 2012, SWRCB has released a new proposed policy to meet the legal mandate that requires the SWRCB to develop statewide regulations for septic systems. The California Water Code requires regulation of waste discharges that impair or threaten to impair surface water or groundwater quality. Septic tanks not properly sited, built, or maintained can pollute groundwater, surface water, and pose a direct threat to public health due to the release of bacteria and other pathogens. This Policy was prepared in response to the California Legislature that passed Assembly Bill 885 (Wat. Code § 13290) in 2000 that requires the SWRCB to adopt regulations or standards for the operation of septic tanks. In 2008, SWRCB first released draft regulations. This proposed Policy is the result of multiple public workshops, comments received by stakeholders from all over the state, and collaboration with RWQCB staff and local government health representatives. The new proposed Policy relies extensively on Local County and city programs, currently in practice, to educate and regulate septic tank owners and operators about the impact that improperly operating septic tanks can pose to public health and water quality. This proposed statewide Policy is designed to ensure that surface waters and ground waters are not contaminated by septic systems and are safe for beneficial uses.
According to the Policy, no impaired water bodies are identified in San Bernardino related to the use of septic systems and two impaired water bodies were identified in Imperial County and Riverside county in the Colorado Region (http://www.waterboards.ca.gov/water_issues/programs/owts/policy.shtml). Nutrient- or pathogen-impaired waters are identified in Attachment 2 of the Policy. Owners of existing septic systems that are located near a specifically identified surface water body that exceeds water quality standards for bacteria or nitrogen compounds such as nitrates may have to take actions as directed by implementation plans developed by the State’s RWQCBs. The actions required may range from regular inspections to modifying or retrofitting existing septic systems.
At the statewide level, it is estimated that the new proposed Policy will affect less than two percent of current septic systems (or Onsite Wastewater Treatment System, OWTS, as the term used to refer to septic systems or septic tanks in the Policy); thus, more than 98 percent of current OWTS owners will not need to make any changes to their septic systems. If an individual OWTS is currently in good operating condition, and it is not near a stream, river, or lake that the SWRCB has identified in the Policy as possibly contaminated with bacteria and/or nitrogen related compounds from OWTS, then this proposed Policy will have little or no effect on that property owner.

FINAL Twentynine Palms Wastewater Master Plan Page 1-6
1.4.4 Region 7 Guidelines for Sewage Disposal from Land Developments
According to the Region 7 guidelines adopted in 1989, the minimum lot size of one-half acre (average gross) per dwelling unit is required for new developments in the region using on-site Septic tank systems. Several areas in the City appear to have an average gross lot size of less than one-half acre per dwelling unit. Although these guidelines do not apply to the existing developments, they represent the regulatory standard indicating that the RWQCB considers high-density residential developments as high risk areas. This SNMP and the proposed groundwater monitoring program were prepared to address issues specifically in the high-density areas.
1.4.5 Anti-Degradation Policy Summary State Water Resources Control Board Resolution 68-16, known as the Anti-Degradation Policy, requires that the CRWQCB regulate the discharge of waste materials to maintain the high quality of waters of the state. Waste Discharge Requirements for facilities must insure that beneficial uses of groundwater are not unreasonably affected. In addition, the facility must meet a standard of Best Practicable Treatment or Control (BPTC) for discharged wastes.
The “Statement of Policy with Respect to Maintaining High Quality of Waters in California,” known as the Antidegradation Policy, adopted in 1968, requires the continued maintenance of existing high quality waters. It provides conditions under which a change in water quality is allowable. A change must:
Be consistent with maximum benefit to the people of the State,
Not unreasonably affect present and anticipated potential beneficial uses of water, and
Not result in water quality less than that prescribed in water quality control plans or policies.
1.5 District Water Planning and Previous Studies Since 2000, the TPWD has developed groundwater management plans, urban water management plans and conducted a comprehensive groundwater study as the basis of the District’s water planning responsibilities. All these have been consulted in the preparation of this report. These include the following:
1.5.1 2010 Urban Water Management Plan (UWMP) The Twentynine Palms 2010 UWMP was prepared in accordance with the California (CA) UWMP Act that applies to all CA water suppliers with 3,000 or more service connections, or that serve more than 3,000 AF of water in a wholesale or retail capacity. The main focus of the UWMP was to identify potential gaps in supply and demand through a 20 year time period for all major hydrological year types (normal, multiple dry, critical dry). Additionally the UWMP specified goals and implementation plans for the District to reach in order to be in compliance with SBX7-7 conservation requirements, along with contingency planning for periods of water shortage and investigations of potential water quality problems.

FINAL Twentynine Palms Wastewater Master Plan Page 1-7
In the preparation of this report the UWMP was used to reference historic water use throughout several Land Use (LU) categories, unaccounted-for-water use, SBX7-7 compliance water use targets and population projection results. These references were used as a basis for many of the calculations contained herein. The UWMP was also utilized as a general reference tool to gain knowledge of the District.
1.5.2 1997 Master Plan of Drainage (MPD) The 1997 MPD contains significant information, analysis and recommendations related to the climate, geography, watershed delineation, soil hydrology and other characteristics of the Twentynine Palms region. At the time of its production the City of Twentynine Palms had experienced growth which the City expected to continue. To this end this plan was developed in order to lessen flooding problems associated with short, intense rains and to assist in the planning of future developments and facilities.
1.5.3 2008 Wastewater Treatment Plant, Joint-Use Study The 2008 Wastewater Treatment Plant, Joint-Use Study for the Marine Corp Air Ground Combat Center (MCAGCC) explored the costs and impacts of establishing a joint-use wastewater treatment facility that the military base could share with the City. In exploring this possibility current water use conditions, wastewater generation predictions, population projections, groundwater conditions and ultimate system costs were generated for the City and MCAGCC. Ultimately, due to the cost of constructing a joint-use system, and due to that fact that there was no available evidence showing poor performance of the City septic system, the study recommended against a joint-use facility.
1.5.4 2008 Groundwater Management Plan The 2008 Groundwater Management Plan (GMP) was an update from its 2001 predecessor. It was conducted to determine the condition of the groundwater basin quality and capacity, and to explore possible impacts to groundwater, drinking water quality and drinking water quantity as well as how to safeguard against them.
1.5.5 Other Relevant Data Other relevant information referenced to develop this report include USGS and ESRI maps, studies and reports prepared for surrounding communities (Hi-Desert, Joshua Tree, Yucca Valley) and studies prepared for MCAGCC. Meetings with District and City personnel were conducted to obtain a thorough understanding of the their needs and to help gather additional information related to billing data, historical water use data, planning and development criteria and GIS information among others. The various reference documents are provided in the Reference section.
1.5.6 Groundwater Study As discussed in the SNMP, the District took the lead to develop a numerical model for the Mesquite Lake Subbasin. Overall, the model is being used to make informed decisions in future management of groundwater resources in a sustainable manner while meeting increased water

FINAL Twentynine Palms Wastewater Master Plan Page 1-8
demand. The model was set up using the USGS MODFLOW-2000 (Kennedy/Jenks, 2010) and calibrated to the historical data. The main objective of the model was to simulate the long-term changes in groundwater elevation over time. The calibrated model demonstrated that the model is capable of simulating previously observed groundwater trends over time across the entire model domain. The model was used to evaluate the effects on groundwater levels of various potential future groundwater pumping scenarios. The model results indicated that shifting pumping to the Mesquite Lake Subbasin will mitigate the decline in groundwater levels in Indian Cove, Fortynine Palms, and Eastern Subbasins.
During the development of the model, extensive review of background studies on the groundwater basin hydrogeology was conducted. Data from the existing numerical groundwater model were used in the development of the water balance analysis in this SNMP which was used to calculate the sewer loading for the WWMP.
1.6 Report Organization This Wastewater Master Plan (WWMP) is divided into six sections.
Section 1: Gives the introduction and purpose of this Wastewater Master Plan.
Section 2: Provides detailed description of the TPWD and City of Twentynine Palms service area and projections related to climate and population.
Section 3: Discusses historical and projected wastewater flows within the District, including the City limits and unincorporated areas.
Section 4: Presents the methods, inputs and findings of the hydraulic model and hydraulic modeling process.
Section 5: Evaluates the hydraulic analysis, SNMP findings and identifies collection and treatment facilities as well as discusses disposal options.
Section 6: Presents the summary and planning level costs associated with the District’s and City’s collection and treatment facilities for built-out conditions and potential implementation phasing considerations.
1.7 Abbreviations and Acronyms Table 1-1 below give a list of the acronyms used in this report.

FINAL Twentynine Palms Wastewater Master Plan Page 1-9
TABLE 1-1 LIST OF ACRONYMS
AAF Average Annual Flow ac Acre ac-ft Acre-Feet ADD Average Daily Demand ADWF Average Dry Weather Flow APN Assessor Parcel Number AWWF Average Wet Weather Flow CIP Capital Improvement Program City City Of Twentynine Palms CWRC California Water Recycling Criteria d/D Depth To Diameter dia. Diameter DU Dwelling Unit DU/ac Dwelling Unit Per Acre EDU Equivalent Dwelling Unit ft Feet fps Feet Per Second FY Fiscal Year GIS Geographic Information System gpad Gallons Per Acre Per Day gpd Gallons Per Day gpm Gallons Per Minute HL Headloss I/I Infiltration And Inflow LF Linear Foot LS Lift Station MGD Million Gallons Per Day MG Million Gallon mg/l Million Gallon Per Liter ml Milliliter OWTS Onsite Wastewater Treatment System PDWF Peak Dry Weather Flow psi Pounds Per Square Inch PWWF Peak Wet Weather Flow RWQCB Regional Water Quality Control Board SNMP Salt and Nutrient Management Plan SWRCB State Water Resources Control Board TPWD Twentynine Palms Water District TSS Total Suspended Solids UV Ultraviolet WWMP Wastewater Master Plan
FINAL Twentynine Palms Wastewater Master Plan Page 2-1
Section 2: Background and Study Area
Section 2 presents a brief overview of the study area characteristics based on the previous studies and planning documents prepared in the Twentynine Palms area. Specifically, this section characterizes the local service area in relation to climate, land use, current and future projected population, water sources and, service area water demands, and the existing wastewater management, groundwater management and monitoring activities.
2.1 Study Area The service area of the Twentynine Palms Water District (TPWD, the District) is located in the southern portion of the Mojave Desert, in San Bernardino County, approximately 72 miles due east of the City of San Bernardino and 35 miles northeast of the City of Palm Springs, as shown in Figure 1-1 in Section 1.The District supplies potable water to the City of Twentynine Palms, the Mainside area of MCAGCC as well as some unincorporated areas located to the Northwest of the City. The majority of the current land development is within the City and the District. Currently, only small, low-density development is outside of the District and City boundaries but within the City’s sphere of influence (SOI). Based on the new land use/zoning of the City’s boundary, the City boundary has recently been extended to change the City's SOI to match that of the District. With this change, the City’s boundary extends beyond the current City limits and more closely matches that of the District and includes the unincorporated areas. The District service area encompasses approximately 86.6 square miles and includes the City. Throughout this Plan, the District service area and the Twentynine Palms service area are used interchangeably to refer to the general study area considered in this WWMP.
Currently, the District’s sole water source is its groundwater basins. The District’s service area is underlain by three groundwater basins, which are the Twentynine Palms Valley Groundwater Basin, the Joshua Tree Groundwater Basin and the Dale Valley Groundwater Basin. The Joshua Tree Groundwater Basin is located at the southern end of the City and is divided into three subbasins: Indian Cove, Fortynine Palms and Eastern subbasins. Location of the three basins in relation to TPWD boundaries can be seen in Figure 2-1. Currently, the District has 10 active wells from which it extracts the supply it uses to serve the City of Twenty-nine Palms and surrounding areas. Additionally, there are more than 400 private wells which serve parcels not connected to the distribution system; however most of these wells are not currently operated.
Historic records show that both pumping quantities and deliveries have steadily increased since inception in the mid 1950’s. Demand was near 2.4 MGD for an average day and deliveries totaled approximately 2,700 acre-feet (AF) in 2010. This demand is supplied to approximately 8,000 connections and a population of nearly 30,000, including the Military population at MCAGCC.
2.2 Land Use Twentynine Palms current and projected primary land use is residential. Planned residential zoning varies from low density multifamily to rural living, with single family and rural land uses accounting for more than eighty percent of the City’s land area. Approximately eighty percent of the City’s current residential development is in single family homes.

FINAL Twentynine Palms Wastewater Master Plan Page 2-2
Figure 2-2 shows the City’s total percentage of land area occupied by specific land uses.
As can be seen in the figure, Land Use categories with similar characteristics are grouped together for planning purposes. For example, land use categories such as General Commercial, Mixed Use Commercial, Neighborhood Commercial etc. are lumped into a single Commercial land use category. These consolidated land use categories are used for estimating projected water demands for the District’s service area.
Commercial and Industrial Land Uses account for three percent of the land area and are located along the City’s main thoroughfares, which are Highway 62 traveling east and west and Adobe Road traveling North and South. The majority of future commercial and industrial zoning is also planned along these areas. Figure 2-3 shows the preferred Land Use for build-out conditions according to the City’s General Plan.
2.3 Climate and Rainfall The study area is located in the southern portion of the Mojave Desert, also known as the “high desert”, in southern California. The weather is consistently arid. Temperature varies largely by season with the summer temperatures ranging from 80 to 110F and winter temperatures ranging from 20 to 60F. Annual rainfall totals approximately four inches with the majority of rainfall occurring during the late summer and winter months.
The climate in the District’s water service area is arid, with average annual rainfall of less than five inches, most of which occurs during the winter months. Temperatures range from 20 to 60F during the winter and from 80 to 110F degrees during the summer. Table 2-1 presents the region’s annual average climate data.
TABLE 2-1 TWENTYNINE PALMS CLIMATE DATA
Jan Feb Mar Apr May Jun Standard Monthly Average ETo(a)
1.59 2.20 3.66 5.08 6.83 7.80
Average Rainfall (inches) 0.4 0.3 0.4 0.1 0.1 0.0 Average Max. Temperature (Fahrenheit)
63 68 74 82 91 101
Average Min. Temperature (Fahrenheit)
36 39 43 49 57 65
Jul Aug Sep Oct Nov Dec Annual
Standard Monthly Average ETo
8.67 7.81 5.67 4.03 2.13 1.59 57.06
Average Rainfall (inches) 0.7 0.8 0.5 0.3 0.3 0.4 4.3 Average Max. Temperature (Fahrenheit)
105 103 98 86 72 63 84
Average Min. Temperature (Fahrenheit)
72 70 64 53 42 35 52
Note: (a) Standard Monthly Average ETo determined from CIMIS Station No. 118 Cathedral City.

FINAL Twentynine Palms Wastewater Master Plan Page 2-3
2.4 Topography Figure 2-4 below shows the study area and the existing topography at 50-foot contours. As shown, the area generally slopes from the south west to the north east.
2.5 Geology The Twentynine Palms Basin is in the eastern Mojave Desert geomorphic province. The principal landforms are Cenozoic alluvial fans and alluvial plains bordered by mountains composed of Precambrian and Mesozoic igneous and metamorphic basement rock (Figure 2-5). The geology in the Twentynine Palms area primarily consists in Tertiary to Quaternary alluvium deposits in the basins enclosed by bedrock materials in the surrounding hills and mountains (Riley and Worts, 1953).
Several major faults traverse the District and are shown in Figure 2-6. These faults include the Pinto Mountain, Mesquite, Surprise Spring, and Calico Faults. These faults are significant in that they have offset alluvial sediments and have affected the movement of groundwater. The Mesquite Fault is a significant barrier to the easterly migration of groundwater, while the Pinto Mountain Fault also restricts groundwater movement from moving northward. (Haley & Aldrich, 2000) Additionally, an anticline on the northern boundary of the Twentynine Palms Valley Basin acts as a partial barrier to groundwater flow to the south.The faults also serve to delineate some of the basins. The Pinto Mountain Fault forms the southernmost boundary between the Twentynine Palms Valley and Joshua Tree Basins. The Twentynine Palms Valley Basin is constricted on the East by the Mesquite Fault and on the West by the Surprise Spring Fault.
2.6 Water Sources As described in the SNMP, the study area considered in this Plan is mainly served by the District. Groundwater is the sole source of water in the District service area. The District neither receives water from a wholesaler nor supplies water to retail water purveyors. As described in the District’s 2010 UWMP (Kennedy/Jenks, 2011), groundwater will continue to be the sole source in the future and no additional sources of water are anticipated to be available to the District.
The District recognizes the importance of recycled water and water reliability; however, recycled water is not a feasible solution in the District service area, due to the small size of the system, low annual demand and the use of individual septic systems. The District has considered partnering with other agencies in the region; however, the nearest water agency is 25 miles away suggesting that an intertie is cost prohibitive. As such, at this time there are no opportunities for water recycling or programs that include recycled water. As an alternative, the District will invest in water conservation approaches to reduce demand and compensate for the lack of recycled water through developing approaches to emphasize outdoor water conservation.
Potable water is scarce in the District for several reasons. As discussed above, the area receives an average of only four inches of annual rainfall. There is negligible infiltration and recharge of direct precipitation in areas where the alluvial deposits are thick. In addition, a substantial amount of runoff is lost to evaporation after flowing into the basin. In addition to the

FINAL Twentynine Palms Wastewater Master Plan Page 2-4
scarce sources, water quality issues in groundwater due to naturally occurring soluble minerals, such as fluoride, make some of the water unsuitable for drinking water prior to treatment.
2.6.1 Groundwater Groundwater pumping by the District is a good indication of water use in the study area as the District pumps groundwater as the sole source to meet the residential and non-residential water demand. As the majority of water use is the residential demand and outdoor water use is generally small, residential indoor water use (and in turn residential wastewater) is considered to be a large contributor to septic systems.
Historic pumping and water deliveries by the District have steadily increased since its formation in the mid-1950s. Annual pumping in the 1990s regularly exceeded 900 million gallons, approximately 2,760 acre-feet per year (AFY), with average daily delivery per service connection slightly under 400 gallons. Total water demand in the District was 2,674 AF in 2010, with a projected demand of 5,119 AF in 2035, based on the UWMP (Kennedy/Jenks, 2011).
Water provided by the District is derived from water supply wells located along the southern limit of the service area. The District has been historically pumping from the three subbasins that have high quality of water, but are over drafted. As of 2010, the District has ten (10) active production wells and pumps from the four different aquifers:
Fortynine Palms Subbasin has two wells (Well #4 and Well #14)
Indian Cove Subbasin has five wells (Well #6, Well #9, Well #11, Well #12, and Well #15) and one well on standby
Eastern Subbasin has two wells, one of which (Well #16) is used for water supply and another well for non-potable use
Mesquite Lake Subbasin has one well (Well #TP-1).
Figure 2-7 shows the boundaries of the four groundwater subbasins in the Twentynine Palms area and locations of the District’s active supply wells. Also shown in Figure 2-7 are the District’s inactive wells. In addition to the District wells, available information indicates that more than 400 private wells have also been constructed within the District’s service area. Most of these wells are not currently operated. Among the private wells, locations of 250 wells are shown in Figure 2-7 approximately based on the parcel information where the wells are located.
2.7 Groundwater Subbasins The Twentynine Palms area includes the Mesquite Lake, Indian Cove, Fortynine Palms, and Eastern Subbasins and a portion of the Dale Basin. This section defines the individual basins within the study area, as well as their bounding barriers and the degree to which they are effective (Figure 2-1 shown earlier).

FINAL Twentynine Palms Wastewater Master Plan Page 2-5
2.7.1 Indian Cove Subbasin The Indian Cove Subbasin is located between the Joshua Tree Subbasin on the west and the Fortynine Palms Subbasin on the east. The basin is floored by bedrock, which generally slopes northward with depth to bedrock ranging from 100 to 1,200 feet below ground surface (Kennedy/Jenks, 2001, 2008, 2010). The Indian Cove Subbasin is defined by the Oasis Fault on the north, an unnamed fault and the Joshua Tree Subbasin on the west, an unnamed fault and the Fortynine Palms Subbasin on the east, and the bedrock of the Little San Bernardino Mountains on the south. The water level in the Indian Cove Subbasin is more than 250 feet above the water level in the Fortynine Palms Subbasin to the east, indicating that there is some barrier between the two basins, although its character is not defined.
2.7.2 Fortynine Palms Subbasin The Fortynine Palms Subbasin is located directly east of the Indian Cove Subbasin. The known depth to bedrock in the basin is between 170 and 430 feet below ground surface making this the shallowest of the Subbasins (Kennedy/Jenks, 2001, 2008, 2010). The Fortynine Palms Subbasin is defined by the Oasis Fault on the north, an unnamed fault and the Indian Cove Subbasin on the west, an undetermined boundary with the Eastern Subbasin on the east, and the bedrock of the Little San Bernardino Mountains on the south.
2.7.3 Eastern Subbasin The Eastern Subbasin is located immediately to the east of the Fortynine Palms Subbasin. Groundwater supplies within the basin are limited, with most flow occurring in a shallow zone just above or just in the bedrock surface. The depth to bedrock varies from 160 to 750 feet (Kennedy/Jenks, 2001, 2008, 2010). The Eastern Subbasin is defined by the Oasis Fault on the north, an undetermined boundary with the Fortynine Palms Subbasin on the west; the eastern boundary is undetermined but may be a northward extension of the Pinto Mountains, and the bedrock of the Little San Bernardino Mountains on the south.
2.7.4 Mesquite Lake Subbasin The Mesquite Lake Subbasin is located south of the Deadman Lake Subbasin. The northern boundary is the Transverse Arch, which separates it from the Deadman Lake Subbasin (Riley and Worts, 1952). The eastern boundary is the Mesquite Fault, which separates it from the Bullion Mountains in the northern part of the basin and the Dale Basin in the southern part of the basin. The southern boundary is a combination of the Oasis, Chocolate Drop, and Bagley Faults; although Riley and Worts (1953) state that the southern boundary is not well-defined in the western part of the basin. The western boundary is Copper Mountain, several faults (such as the Elkins/Surprise Spring Faults) and bedrock that is close to the surface, all of which severely restricts flow and separates this basin from the Copper Mountain Subbasin to the west.
The Dale Basin is located immediately to the east of the Mesquite Lake Subbasin. Little work has been done on the hydrogeology of the Dale Basin, as it is not a host to significant population, nor does it contain many wells. Its western boundary is the Mesquite Fault, which separates it from the Mesquite Lake Subbasin. The northern boundary is the Bullion Mountains. The eastern boundary is the Sheep Hole Mountains. The southern boundary is the Pinto Mountains. The depth to bedrock in this basin is unknown.

FINAL Twentynine Palms Wastewater Master Plan Page 3-1
Section 3: Water Usage
This section describes the District’s water uses in terms of per capita flow for different categories as well as characteristics of the system that account for that demand. Characteristics addressed include land uses, connection volume, customer type and seasonal demand variations. This section also contains discussion of future anticipated water use and its implications on the WWMP planning scenarios used in later portions of this report.
3.1 Historic Water Use Since 1994, water demands within the District have ranged from about 2490 AF to approximately 3,129 AF (Table 3-1). Typically the annual fluctuations are primarily in response to weather conditions. Typically, water demands are higher during hotter, drier years because more water is needed for landscape irrigation, and lower during cooler, wetter years when less irrigation is required. For example the District’s water demand in 2005, a wetter than average year in California, was less than in years 2007 through 2009 which was California’s last drought period (Table 3-1).
TABLE 3-1 HISTORIC WATER USE
Year Demand (AF) 1994 2,730 1995 2,490 1996 2,617 1997 2,609 1998 2,613 1999 2,717 2000 2,817 2001 2,944 2002 3,129 2003 3,048 2004 2,933 2005 2,831 2006 3,030 2007 2,981 2008 2,860 2009 2,805 2010 2,674 2011 2,564
Average 2,800
3.1.1 Water Demand Classification by Customer Type As shown in Table 3-2 and Figure 3-1 the single largest customer category and user within the District is single family residential customers. Single family homes account for nearly 56%, or

FINAL Twentynine Palms Wastewater Master Plan Page 3-2
1,704 AF, of the 2011 annual demand. The multifamily residential customer class accounted for the next largest portion of demand, accounting for 14%, or 437 AF. Primary metered, Commercial and Industrial or Institutional and irrigation customers accounted for the remaining demand categories. Unmetered and unaccounted for water comprised approximately 17% of the 2011 demand allocation. Into the future these patterns of demand are expected to continue as single family residential and multifamily residential make up a large majority of the non-rural parcels in the District area.
TABLE 3-2 HISTORIC WATER DEMAND BY CUSTOMER TYPE (AF)
Customer Type 2000 2005 2010 2011 Single Family Residential 1,686 1,717 1,682 1,704 Multi-Family Residential 552 564 414 437 Commercial/Institutional 339 291 278 280 Landscape Irrigation 111 108 115 118 Other (Fire Protection/ Non-Potable) 131 153 83 24 Unaccounted for Water 430 468 326 504
Total Water Use 3,249 3,301 3,000 3,068
3.1.2 Water Demand Classification by Number of Connections The District’s nearly 8,000 service connections serve a variety of different customer types, including residential, commercial, institutional, and landscape customers (Table 3-3, Figure 3-2). Ninety-four percent of the District’s total service connections are residential; seventy-nine percent single family and fourteen percent multi-family. The next largest user are Commercial and Institutional accounts with about four percent of the total connections. Landscape irrigation and “other” accounts make up the remaining two percent of the customers.
TABLE 3-3 HISTORIC NUMBER OF SERVICE CONNECTIONS BY CUSTOMER TYPE
Customer Type 1994 2000 2005 2009 2010 2011(a)
Single Family Residential
5,956 5,237 5,895 6,314 6,368 6,011
Multi-Family Residential 824 1,047 1,045 1,110 1,111 1,094 Commercial/Institutional 333 379 456 362 363 324 Landscape Irrigation (Potable)
0 15 18 26 29 29
Other NA(a) 104 4 108 112 113 Landscape Irrigation (Recycled) 0 0 0 0 0 0
Commercial/Institutional (Recycled)
0 0 0 0 0 0
Total 7,113 6,782 7,418 7,920 7,983 7,571 Note: (a) 2011 Connection data is for active connections. 1994-2010 data lists total connections

FINAL Twentynine Palms Wastewater Master Plan Page 3-3
As expected, the majority of the water use occurs within the residential sector. Typically, multi-family service connections serve multiple residences and therefore use more water per service connection. While they comprise a little over four percent of the District’s service connections, commercial and institutional customers account for nearly ten percent of the District’s consumption.
Figure 3-3 compares the number of service connections the City has for its four major customer types with the demand for each customer type. The District’s dedicated landscape irrigation customers — customers with separate meters specifically for landscape water use — account for four percent of the District’s total water use. Except for these few accounts equipped with dedicated landscape irrigation meters, outdoor water use is not metered separately from indoor use.
3.1.3 Historic Water Demand Seasonal Variation Water usage data was collected from the District for 2010-2012. Figure 3-4 below shows the distribution of average water usage for single family, multi-family and commercial users. As shown, the majority of the water is used by SF accounts for almost 162,000 ccf during summer high temperature months.
Multi-family uses ranges from about 20,000 cfs to 40,000 cfs in summers. Non-residential water usage ranges from as low as 15,000 cfs in winters to a 25,000 cfs high during summers.
3.1.4 Non-Revenue Water Unaccounted for water, also called non-revenue water is the difference between the amount of water that enters the District’s distribution system and the amount of water distributed to the District’s customers. Unaccounted for water is water lost from the distribution system through a variety of ways, both authorized and unauthorized, including water for firefighting, pipe flushing, leakage from pipelines, meter error, and theft. Table 3-4 shows the non-revenue water trend over the past few years.
TABLE 3-4 HISTORIC PRODUCTION, SALES AND LOSSES
Year Water (AFY)
Unaccounted Percent Production Sales 2000 3,248 2,818 430 13.2% 2001 3,250 2,945 305 9.4% 2005 3,300 2,832 468 14.2% 2009 3,035 2,805 230 7.6% 2010 3,000 2,674 326 10.9% 2011 3,068 2,564 504 16.4% Total 7,113 6,782 7,418 7,920

FINAL Twentynine Palms Wastewater Master Plan Page 3-4
3.2 Project Planning Scenarios The approaches used for population estimation, wastewater flow calculations and projections, using historical water usage data, were categorized by the use of three planning scenarios. The flow calculations were developed for these three scenarios for consistency with the Salt and Nutrient Management Plan. The three scenarios which were analyzed are described below.
Because the proposed service area is not currently sewered, there is an absence of accurate information to quantify or estimate the actual per-capita wastewater flow production. As such, potable water consumption data is used to estimate wastewater flow rates by determining sewer return ratios and per capita duty factors to estimate future projections.
3.2.1 Current Scenario: Baseline The “current” scenario corresponds to development conditions for 2010-2011. This was selected for two main reasons:
The City updated its General Plan in 2011 which reflects the latest information available for use in the WWMP study; and
The most recent water usage data collected from the District was from 2010-2011.
3.2.2 2035 Scenario The year 2035 was selected as an intermediate planning scenario consistent with the SNMP. This year was selected because it corresponds to the planning horizon of the District’s Urban Water Master Plan and the City’s General Plan. The 2035 Scenario assumes the continued use of septic systems and future septic loading to meet anticipated increases in population and water demands and evaluates the potential for the continued discharges from septic systems to the groundwater.
3.2.3 Build-Out Scenario This is based on the City of Twentynine Palms General Plan and represents the ultimate build-out land use and water demand. For near-term projections, existing water demands are used to predict wastewater flows. For the longer term build-out scenarios, wastewater flows are projected on the basis of unit wastewater flow production for each type of land use. The estimated unit wastewater flow for both residential and non-residential was used to project wastewater usage for the area.
3.3 Population Projections For this study the method of projecting populations used in the City of Twentynine Palms UWMP has been incorporated, and modified as necessary. This method centers around projecting the population based on the number of dwelling units inhabited and combining it with the average number of persons housed per dwelling unit.

FINAL Twentynine Palms Wastewater Master Plan Page 3-5
3.3.1 Current Population The 2010 UWMP estimates the City of Twentynine Palms to have a population of 18,975 as of the close of 2010. Estimates and analysis of current conditions were performed using this projection. This projection estimates the number of dwellings per major Land Use category using the number of connections, as shown in Table 3-2, and estimates population by factoring the number of connections against average residential dwelling densities.
3.3.2 2035 Population Similar to the current population estimate, future projections in the UWMP were made by estimating the number of dwellings and adding up the population within those dwellings. Projections of growth calculated in the 2010 UWMP were estimated at 30,931 in 2035. Tables 3-5 and 3-6 present the historic population from 2006 to 2010 and the 2035 projected population, respectively.
TABLE 3-5 HISTORIC POPULATION ESTIMATES
2006 2007 2008 2009 2010 18,462 18,716 18,736 18,737 18,795
TABLE 3-6 POPULATION PROJECTIONS
2015 2020 2025 2030 2035 Build-Out 22,135 25,476 27,339 29,202 30,931 102,963
3.3.3 Build-Out Population In determining the build-out population for the area within the District, several sources were referenced to create a viable projection. Current population data available through the 2010 Census showed that the average household in Twentynine Palms contained 2.63 persons. The Twentynine Palms General Plan (General Plan) was referenced in order to determine the number of dwellings zoned to be built on an acre (DU/acre) of each specific land use. Land Use data supplied by the City of Twentynine Palms and the County of San Bernardino was used to determine the number of parcels and the area of land by land use.
The largest component of land use was RL 1ac, which is rural living, zoned for 1 dwelling per acre. Following that, higher density rural single family land use was the second largest proportion, which allows for up to 2.5 dwelling units per acre, or a minimum of 0.4 acres per dwelling unit. The third largest land use category belonged to higher density single family residential, allowing 3 to 4 dwelling units per acre. Lastly, High density single family and multifamily make up a large percentage of the remaining residential land.
Dwelling unit per acre factors were applied to each of the parcels to generate a maximum allowable population for the District service area. Per procedures laid out in the General Plan, this figure was reduced by 20 percent to reflect inefficiencies in development, rights of way, public spaces like parks and other spaces that will go undeveloped and thus not be available.

FINAL Twentynine Palms Wastewater Master Plan Page 3-6
A large portion of the District service area was, until recently, not incorporated within the City of Twentynine Palms, and thus, much data was not readily available. These areas consist of the area East and North of the City of Twentynine Palms, and the City’s Sphere of Influence (SOI) which extends to several small areas directly outside of City boundaries that are expected to experience growth due to City activity. The populations for these areas were calculated in a similar manner as the incorporated region, assuming that the average dwelling unit would house 2.63 persons. There are currently only three land uses in these areas, which are RL 1, RL 5 and RC. RL 1 allows for 1 dwelling per acre, and accounts for approximately 26 percent of the District’s unincorporated service area. RL 5 allows 1 dwelling unit per five acres and accounts for approximately 61 percent of the District’s unincorporated area. RC is resource conservation land and does not allow any building and accounts for approximately 13 percent of the unincorporated area.
As part of this Plan, the build-out population was estimated which included the unincorporated area and the City’s SOI population, based on the formula below and population data shown in Table 2-4:
Build-out population = Total City build-out population - Marine Base population + Unincorporated population (adjusted) + SOI population outside of City boundary
As mentioned above, based on the new land use/zoning of the City boundary, the City boundary has recently been extended and the City boundary extends beyond the City limits and more closely matches that of the District and includes the unincorporated areas. The build-out population projection accounts for this change. Based on the discussions with City’s Staff (refer to Appendix A - email attachment by Matt McCleary 2014) and General Plan, the City build-out population is 103,275 and the Marine Base population is 22,500. Since the Marine Base is served by sewer systems, based on the discussion with the City Staff the Marine Base population was excluded from the City build-out population calculations. The City’s SOI population is 7,586, based on population estimates from the City General Plan. The total unincorporated population is estimated to be 17,253, but a small southern portion of the unincorporated area falls within the City SOI; thus it is adjusted to account for the population of 14,602 that corresponds to the area but outside of the City’s SOI. The unincorporated area covers a large area with a very low population density.
TABLE 3-7 PROJECTED BUILD-OUT POPULATION ESTIMATE
City’s Build-out population* 103,275 Marine Base population** 22,500 Total City Population** 80,775 Unincorporated population (adjusted)*** 14,602 City Sphere Of Influence population** 7,586 Total build-out population 102,963
*Per City Staff Matt McCleary ** Per City of Twentynine Palms General Plan *** Area included in Twentynine Palms Water District service area. Land use and housing estimates derived from County of San Bernardino planning data. Effective population estimated in accordance with the City of Twentynine Palms Land Use Plan.
Figure 3-5 shows graphically the areas used for the calculation of the ultimate Build-out population.

FINAL Twentynine Palms Wastewater Master Plan Page 4-1
Section 4: Wastewater Flows
Evaluation of the wastewater flows is a fundamental element in evaluating the infrastructure requirements for the project area. Based on the historic water usage data, UWMP population and land use projections, General Plan preferred expansion and GIS areal coverage’s, wastewater loadings were calculated for the three planning scenarios discussed in Section 3. This Section describes the evaluation of the wastewater flows for the area and describes the data sources used for the development of these wastewater loading factors.
4.1 Wastewater Flow Projections Approach As discussed in Section 3, the general approach used in the WWMP for the evaluation of the wastewater loading rates was primarily based on two scenarios i.e. Current and Build-out (worst case scenario).
For the calculation of the wastewater loadings, there are two major categories of onsite system wastewater – residential and non-residential in the Twentynine Palms area. Single family and multifamily households all fall under the residential dwellings. A variety of commercial (e.g., restaurants and hotels) and institutional (e.g., school) establishments and facilities fall into the non-residential wastewater category. Residential wastewater flow projections are based on population and per-capita unit flow factors. Non-residential wastewater flows have been calculated on a per acre basis, with differentiations for high density non-residential, such as hotels and restaurants, and low density non-residential, such as warehouses and storefronts.
4.1.1 Key Assumptions for Flow Calculations The following main assumptions were made for the calculations of the wastewater flows for the current and the build-out conditions:
4.1.1.1 Water to Sewer Return Ratios
Generally, the development of land-use based wastewater generation factors can be estimated from field generated flow measurement and mass loading calculations. However, since the study area is not currently sewered, actual per capita wastewater flows are not available. In the absence of this data, the District’s actual potable water billing consumption data for each land use category was used to predict wastewater flow rates based on water to sewer return ratios for the system. The amount of water estimated to return to the sewer was assumed to be the amount which would be collected through the wastewater system. Hence the wastewater system infrastructure was based on the flows from the septic systems as if they were to be collected by a wastewater sewer system.
Since all the water that is used is not converted to sewer flow, water to sewer return ratios were applied to calculate the loading for the area. For the Twentynine Palms area an assumption of 80% water to sewer return ration was applied. Experience in the region suggested that an average water to sewer conversion of 80 percent of water use is discharged to local septic systems is a reasonable assumption.

FINAL Twentynine Palms Wastewater Master Plan Page 4-2
To estimate the wastewater values, potable water usage billing information was evaluated to segregate between interior and exterior water usage. This water to sewer ratio represents indoor water use, which will have an almost complete transfer to sewer loading. In most communities, summer irrigation is the main use of potable water that does not return to the sewer and water usage in the winter months is generally in excess of 80% used for interior usage. Water use during summer and winter months was analyzed using current billing data and used to verify that the 80 percent water to sewer conversion is a good indicator for the average indoor water usage as an average sewer loading rate. This is a reasonable and commonly used approach to estimate recharge from septic tanks from other areas in the vicinity, such as the Yucca Valley and High Desert areas.
4.1.1.2 Per Capita Water Demand for Current Scenario
Current scenario residential loadings were based on the current population and per capita water demand. Current per capita unit flows for residential areas were based on historical calculations of per capita water consumption. In 2010, Twentynine Palms experienced an approximate average residential consumption of 1,900,000 gallons per day. That average usage and the existing population estimate was used to calculate the average water use of 101 gallons per day per capita (gpcd). A 80 gpcd sewer loading rate was calculated for the Twentynine Palms area using the 80% water to sewer return ration described in the section above.
The 80 gpcd sewer loading rate used for the Twentynine Palms area for the Current Scenario is comparable with sewer loading rate from the communities in the vicinity. For comparison, a per-capita waste water flow rate of 83 gpcd was considered for the Yucca Valley (MWH, 2009) and 80 gpcd for the High-Desert Water District. The 80 gpcd is considered relatively conservative compared to findings of several other studies that evaluated the residential indoor water use in detail. A study funded by AWWARF that involved the largest number of residential water users ever characterized (1,188 homes in 12 metropolitan areas in North America) wastewater discharges and included a detailed indoor water use characterization of approximately 100 homes in each of the 12 study area using continuous data loggers and computer software that quantified the end uses of water. These data were derived from some 1 million measured indoor water use events in 1,188 homes in 12 suburban areas.
The study found that the average gpcd wastewater discharges ranged from 57 to 83.5 with the average of about 69 gpcd in all 12 study sites (Mayer et al., 1999). The previous studies estimated average daily wastewater flows are approximately 50 to 70 gpcd, typical for residential dwellings built before 1994, with homes built after 1994 retrofitted with energy and water–efficient appliances would have typical average daily wastewater flows in the 40 to 60 gpcd. As such, the 80 gpcd used herein is above the average estimates and is therefore considered a conservative estimate for sewer loading at this time.
4.1.1.3 Per Capita Water Demand for Build-out Scenario
The approach used for calculating the loadings for build-out conditions was based on the UWMP base daily per capita water use, maximum allowable daily water use target for SBX 7-7 compliance and current gpcd water. Per capita sewer loading rate was calculated to be 73.5 gpcd for 2035 and build-out scenarios compared to 80 gpcd for the current condition. This accounts for a reduction in sewer loading rate proportional to the reduction in the per capita water use. As reported in the 2010 UWMP and discussed above, per capita water use is estimated to be 147 gpcd and is projected to reduce to 135 gpcd to meet the water reduction

FINAL Twentynine Palms Wastewater Master Plan Page 4-3
compliance by 2020 by water conservation. This is equivalent to 8 percent reduction in the gpcd. As described above, the sewer loading rate for the Current Scenario is 80 gpcd. With the 8 percent reduction, sewer loading rate with water conservation is projected to be 73.5 gpcd. It was assumed that once the water use target by 2020 is achieved, the intent is to keep it at that level. Therefore, the 73.5 gpcd is considered applicable for projecting sewer loading beyond 2020 and used as a reasonable approximation for the build-out scenario.
The 73.5 gpcd is considered reasonable for future projections. Beginning in recent years, greater attention is being given to water conservation and the installation of water-conserving devices and appliances, including in the District service area. With the energy use standards that went into effect since 1994, indoor retrofits are expected to reduce water use in indoor appliances. Homes built after 1994 or retrofitted with energy and water–efficient appliances would have typical average daily wastewater flows in the 40 to 60 gpcd (Mayer et al., 2000). The reduced 73.5 gpcd results in reduced wastewater flows, thus decreasing the quantity of CECs discharged to the waste stream.
Indoor residential water use and resulting wastewater flows are attributed mainly to toilet flushing, bathing, and clothes washing. Toilets, showers, and faucets in combination can represent more than 70 percent of all indoor use. Residential wastewater flow reduction can therefore be achieved most dramatically by addressing these primary indoor uses. Installing indoor plumbing fixtures that reduce water use and replacing existing plumbing fixtures or appliances with units that use less water are successful practices that reduce wastewater flows.
4.1.2 Residential Loadings The approach used to estimate residential sewer loading for the scenarios rely on the estimated population and projected per capita sewer loading rate. Total residential sewer loading for the current and build-out scenarios was calculated using the population numbers presented in Section 3. The water to sewer conversion is assumed to remain at 80 percent for both the current and build-out scenarios. Future land development associated with the Build-out Scenario is anticipated to occur to accommodate the increased population projection. While the population projection was previously estimated within the District service area and readily available to use in this study, the exact locations of future land development and land use density are uncertain at this time. For the purpose of this assessment, the spatial distribution of sewer loading by each subbasin is needed to assess the potential impact of future septic loading. Therefore, for the wastewater flow analysis, a reasonable assumption was made to distribute the total future projected septic loading among the subbasins proportional to the Current Scenario septic loading in each subbasin.
4.1.3 Non Residential Loadings For non-residential land use such as commercials and institutions, flow rates are generally expressed in terms of quantity of flow per unit area. The results of previous studies have demonstrated that in many cases nonresidential wastewater is considerably different from residential wastewater.
Total non-residential sewer loading was calculated based on the non-residential water use of based on area and 80 percent water to sewer conversion factor. Similar to the residential, the 80 percent conversion factor was used to represent indoor water use and the portion of water

FINAL Twentynine Palms Wastewater Master Plan Page 4-4
use returning to sewer tanks. Average winter water usage was compared with 80 percent of annual water usage to verify that the 80 percent water to sewer conversion factor is reasonable for the non-residential sector.
Based on the GIS aerial image, the acreages of the non-residential land use were identified and high and low density areas were estimated. Using the GIS based acreages and the assumed sewer rates (gal/day/acre); total sewer rate for high density commercial was calculated. The remaining sewer loading was distributed between the low density commercial and institutions based on the acreages estimated from land use data. It is anticipated that non-residential sewer loading varies depending on the land use density and types of activities. Site specific data from different water use sectors are unavailable to differentia sewer loading for high and low density non-residential sectors. Sewer loading rates for the high density commercial, low density commercial, and institutions were assumed to be 900, 320, and 320 gal/day/acre, respectively, based on data available from nearby communities and simplifying assumptions. A sewer loading rate used for the communities in the vicinity ranged from 800 gal/day/acre for the High-Desert Water District to 1,000 gal/day/acre for the Yucca Valley (USGS, 2003). For the Twentynine Palms area, high density commercial sewer loading rate was assumed to be 900 gal/day/acre as an average of the ranges used for the nearby communities.
4.2 Wastewater Flows Using the approach described above, wastewater flows were calculated for current and build-out conditions. These values were then used for the allocation of demands for various sub catchments in the hydraulic model to analyze the system. Table 4-1 below shows the summary of the population projections, per capita water and wastewater use, wastewater flow etc. for the current, 2035 and build-out conditions.
TABLE 4-1 SUMMARY OF WASTEWATER FLOW ESTIMATES
Current - 2010 2035 Projections Build-out Population 18,795 30,931 102,963 Residential - Includes single family and multi-family (Within and Outside District) Water usage (gal/day) 1,898,295 2,845,652 9,472,596 Water Usage (gal/day/person) 101 92 92 Water to sewer factor 0.8 0.8 0.8 Indoor water use (gal/day/person) (sewer loading)
80 73.5 73.5
Sewer loading (gal/day) (total) 1,518,636 2,276,522 7,578,077 Non-Residential - Includes commercial, institutions, and industrial. Water usage (gal/day) 251,137 507,579 2,328,613 Water to sewer factor 0.8 0.8 0.8 Acreage (total) 385 778 4,312 Sewer loading (gal/day/acre) Non-residential (high density) 900 900 900 Non-residential (low density) 320 320 320 Institutional/Industrial 320 320 320 Total Wastewater Flows (MDG) 1.71 2.67 9.3

FINAL Twentynine Palms Wastewater Master Plan Page 4-5
4.3 Data Sources for Wastewater Flow Estimation The main sources of land use and flow data available for use in estimating wastewater flows are listed in Table 4-2. The table provides a brief description of each data source, its description, format, and use. Details on how each of these data sources was used are covered in subsequent sections of this chapter.
TABLE 4-2 DATA SOURCES FOR WASTEWATER FLOW ESTIMATION
Data Description Data
Format Used for Calculating Land Use and Parcel Data
Land Use element by Parcel GIS
Shapefile Expected water use on
a per parcel basis Unincorporated Area and Sphere of Influence (SOI) Land Use and Parcel Data
Land Use element by Parcel for the Unincorporated region
GIS Shapefile
Water use on a per parcel basis in the
Unincorporated area
Street Grid Southern California Streets GIS
Shapefile Pipeline alignments
Water District Potable Distribution System
Twentynine Palms Water District potable water
distribution grid
GIS Shapefile
Pipeline alignments
Digital Elevation Model (DEM)
Elevation data for the City and surrounding areas
GIS Shapefile
Model required pipeline elevations
City and Water District Boundaries
City of Twentynine Palms and Twentynine Palms Water
District Boundaries
GIS Shapefile
Extents of parcels that influence expected
sewer loading in City and Unincorporated
areas Sewer Loading Sub-catchment Boundaries
Boundaries of sewer sub-catchment loading
GIS Shapefile
Loading at Sewer sub-catchment boundaries
Sewer Loading Factors
Calculations of per dwelling unit water use (residential)
and per acre water use (non-residential)
Excel Loading at sewer sub-
catchments
Historical Water Data
Several years of data for total water use
Excel Development of
expected wastewater flows
Population Data
Estimations of past and current population and
projections of future population
Excel
Develop an accurate estimation of
wastewater flow based on per capita water use
Housing/Land Use Inventory/Parcel
Data pertaining to zoned land uses and parcel shapes,
sizes and locations. SHP
Categorize production of wastewater flow.

FINAL Twentynine Palms Wastewater Master Plan Page 4-6
Data Description Data
Format Used for Calculating
General Plan Data 29 Palms General Plan,
containing info relating to development of the City
PDF Accurate assumptions
relating to the City
Aerial GIS Coverage
Recent detailed aerial photography of the region
SHP Current extents of
development for current flow projections

FINAL Twentynine Palms Wastewater Master Plan Page 5-1
Section 5: Wastewater Hydraulic Model
Hydraulic distribution models are frequently used for the planning, design and operational management of wastewater collection systems. In order to evaluate wastewater system hydraulics, computerized modeling software using complex mathematical equations are used. These models serve as tools to identify potential deficiencies in the system, size future facilities and develop long range planning studies. This section describes development of the hydraulic model of the proposed wastewater system. As described above, the hydraulic model is the primary analytical tool used to determine pipe sizing, and flow distribution.
To assess the appropriate sizing of the wastewater collection and treatment systems, the build-out conditions were used and integrated in a newly developed wastewater model. A main-trunk skeleton hydraulic model of the District was created using Digital Elevation Models (DEM) and the GIS based sewer modeling software H2OMap Sewer. The model was used as an analytical tool to determine the infrastructure system requirements that would be needed for the potential collection and treatment systems to meet the District’s/City’s near and long term needs. From these findings, a Capital Improvement Program (CIP) and Implementation Plan were developed. A cornerstone element of the CIP and Implementation Plan was derived based on the findings from the Salt and Nutrient Management Plan, prepared by Kennedy/Jenks Consultants and submitted under a separate cover.
The study has outlined the extent of the proposed sewer area, the location of the trunk lines along with identified major collector pipelines, the WWTP and the catchment areas. Sewer loadings were calculated based on the historic water consumption data, in conjunction with the growth projections defined in the UWMP 2010 and the duty factors developed in the GWMP.
5.1 Modeling Software K/J’s modeling team selected Innovyze’s H2OMap Sewer (version 10.5) software to use for this project. H2OMap Sewer uses Innovyze’s proprietary hydraulic engine, which provides a fully dynamic solution for modeling stormwater and sanitary sewer systems. The program has a GIS-based model interface and features many useful tools for model development, calibration, and simulation results analysis.
5.2 Data Sources H2OMap Sewer uses a GIS based interface. In order to accurately construct the model, the District and the City provided several pieces of vital GIS information that were used as the basis of the model. Additionally, PDFs of Land Use maps were provided by San Bernardino County and were used to help determine properties of the Unincorporated Area and SOI. As previously discussed, the following data sources were used in the development of the hydraulic model:
Land use data
Parcel level data
Street Grid

FINAL Twentynine Palms Wastewater Master Plan Page 5-2
Water District Potable Distribution System
Digital Elevation Model (DEM)
City and Water District Boundaries
Sewer Loading Sub-catchment Boundaries
Sewer Loading Factors
Current and Historic Water Usage Data
Population Data
Aerial GIS Coverage
5.3 Model Construction The following sections describe the model building process and software terminology. The analysis was conducted using a computerized static model. As discussed in the earlier sections, the information required for the model (pipe diameters and lengths, invert and ground elevations, etc.) was obtained from the City’s GIS database and validated to ensure the information was comprehensive enough to support this planning effort.
5.3.1 Basic Terminology of Model Data The model data consist of these basic components:
5.3.1.1 Nodes
This component includes manholes and pump station wet wells. The primary data for nodes is ground elevation. Pump station wet wells also have other attribute data like chamber roof elevations, chamber floor elevations, and cross sectional areas.
5.3.1.2 Links
The model represents physical connections between two nodes as links. Links are mostly pipes but also include flow control structures such as pumps, weirs, sluice gates, and orifices. A model link requires an upstream and a downstream node. Attribute data for pipes also include pipe type (gravity or force main), length, diameter, upstream and downstream invert elevations, Manning’s roughness coefficient, and headloss coefficient. Modeling pump operation requires discharge flow rate data (or pump curves for actual pumps) and pump on and off levels. For other flow control structures, the model also requires dimensional inputs.
5.3.1.3 Sub-catchments
Multiple sub-catchments combine to form watershed area tributary to a node. Attribute data for sub-catchments include loading node identification (ID), contributing acreage, and land use ID. Land use ID information are specific wastewater diurnal flow pattern, flow factor, RDI/I

FINAL Twentynine Palms Wastewater Master Plan Page 5-3
parameters assigned to a particular shed. Wastewater flows are generated from the sub-catchments and routed through the piping network.
5.3.1.4 Model loads
Model loads are residential and non-residential dry weather flows and I/I (which is neglected for this study). As a sum, they represent the total wastewater flow applied to modeled pipes.
5.3.1.5 Models
Models are the combination of a modeled network, its associated sub-catchments and loads, and other data files (e.g., diurnal profiles) that comprise a specific model scenario.
5.3.2 Model Building This section describes how the network for the model sewers and service areas was defined and built. The extension of the model to cover currently undeveloped areas is described later in this chapter. Selection of the area to be sewered is based on key parameters including SNMP findings, topography, General Plan build-out population projections, water usage etc. The planning approach for identifying the extents of the sewered area includes the ultimate buildout conditions based on the City’s General plan and phasing/implementation plan based on high density commercial, industrial, residential etc. parcels that can primarily drain by gravity in a single direction. The need for lift stations was evaluated based on topography and pumping to a higher elevation point, if needed. Gravity sewer flows from the parcels was collected using a Trunk Sewer model and a wastewater treatment centralized plant was cited using GIS spatial DEM analysis to evaluate the most feasible lowest point in the basin. These discussions follow in the later sub-sections.
5.3.2.1 Network Trunks
Determination of the modeled location of the sewer trunks was based on several factors. The first factor was the location of current water distribution mains. These were chosen as appropriate sewer trunk locations for ease of internal facility tracking and maintenance access. Topography was also a large consideration in the placement of trunk lines. In such cases where a sewer pipeline could not appear to parallel an existing water main, alternate alignments were selected. Land use data was also used to align the trunk with the major population centers. These factors helped create the modeled alignment which includes over 25 miles of sewer trunk, over 18 miles of which is gravity sewer, and over 7 miles of which is force main. The conceptual alignment of local trunk locations is shown in Figure 5-1.
5.3.2.2 Delineation of Trunk Sheds
The project area was divided into individual trunk sheds by sewer tracing. Each trunk shed was characterized by its downstream interceptor connection to the main line. Starting from its discharge point into a main trunk interceptor, a sewer shed was selected by performing upstream traces. The trunk sheds were identified based on: (1) Its corresponding existing main street and (2) The shed location.

FINAL Twentynine Palms Wastewater Master Plan Page 5-4
5.3.2.3 Sub catchment and Watershed Definitions
The sewer area was divided into a number of geographic units called sub-catchments. Each subcatchment is a tributary area for which wastewater flows are computed and then loaded to a manhole on a modeled sewer pipeline. Tributary flow from each subcatchment was geoprocessed using watershed delineation and depends upon topography, direction of drainage, area of the sub-catchment. Since this study involves a Trunk-Sewer model and is not a detailed collection system model with collectors and laterals, subcatchments were combined to form a representative watershed area and the total load of each watershed area allocated to a pour point in the model. Note that these pour points were strategically selected based on the watershed delineation to optimize gravity flow for each watershed. Wastewater loadings were calculated for the Build-out scenario using these watershed loadings and the City’s General Plan preferred land use and acreages. The Build-out scenario was used to size infrastructure for the project area. The various sewer trunk watershed areas are shown in Figure 5-2.
5.3.2.4 Manholes
Manholes shown in the model serve several purposes. Their first purpose is to serve as load manholes and apply a load to the sewer trunk which serves a region of the modeled area. To that end, each manhole represents the pour point of a tributary area within the District. At a minimum each trunk shed has one pour point representative of the loading for that watershed. Additionally, several trunk sheds have sewer lift stations which require a wet well to pump from. In the model these wet wells require a manhole prior to the pump and force main. These manholes are referred to in the model as chamber manholes. Such manholes do not receive any load. The final variety of manhole seen in the model generated for this project is also a load manhole. These manholes do not delineate any boundary of a trunk shed, but rather were chosen because the stretch of pipe required to traverse a trunk shed was too large for a single manhole. These manholes served the purpose of allowing for additional elevation information and more accurate modeling of the associated pipe, and additional locations to spread the load of a trunk shed. Not all of these manholes received a load in the model.
5.4 Hydraulic Design Criteria and Boundary Conditions Evaluation of the wastewater hydraulic system requires the system meet key industry design criteria. Design criteria include the pipeline peak-flows, minimum/maximum velocities, d/D, crown depth requirements, minimum allowable pipeline slopes, etc. Based on industry standards, comprehensive experience in wastewater modeling and discussions with staff, these criteria are documented below and incorporated in the development of the hydraulic model and hydraulic system analysis.
5.4.1 Dry Weather Peak Design Flows The District’s sewer system was sized to accommodate the peak dry weather flow (PDWF) observed within the District’s service area. This assumption takes into account the limited precipitation and the high temperatures within the area.
For collector sewers less than 18-inches in diameter, the design peak flow was assumed to be equal to 3 times the average day flow.

FINAL Twentynine Palms Wastewater Master Plan Page 5-5
For trunk sewers greater than or equal to 18-inches in diameter, the design peak flow was assumed be equal to 2.5 times the average day flow.
The District pipelines have been sized to accommodate additional wet weather flows when the design peak flows are greater than 3.0 times the average day flow. Additional pipeline capacity is accounted for in the pipeline design criteria, d/D (flow depth/sewer diameter) ratio, listed in the sub-sections that follow.
5.4.2 Wet Weather Flows - Infiltration/Inflow (I&I) I/I is infiltration and inflow that is directly related to rainfall events. I/I may also enter the sewer system through joints in pipes and manholes, as well as through direct surface drainage connections such as illegally connected roof and yard drains or storm drain cross connections. The magnitude of I/I flows are related to the following:
Intensity and duration of the rainfall
Relative soil moisture at the time of the rainfall event
Condition of the sewers
In order to evaluate the effect of wet whether precipitation data were obtained from the Western Regional Climate Center (WRCC) for the Twentynine Palms Station (049099). Annual precipitation data are available for the period of record of 1935 through 2012. Annual total rainfall during this period of record averaged 4.24 inches per year. Average monthly rainfall data are provided in Table 5-1 below.
TABLE 5-1 AVERAGE MONTHLY PRECIPITATION DATA FOR
TWENTYNINE PALMS STATION (1935-2012)
Month Jan Feb Mar Apr May Jun Jul Aug Sep Oct Nov Dec Annual
Rainfall 0.5 0.41 0.36 0.12 0.07 0.01 0.54 0.74 0.42 0.29 0.28 0.51 4.24
Note: Rainfall is in inches per month; Source: http://www.wrcc.dri.edu/cgi-bin/cliMAIN.pl?ca9099
The record maximum for daily rainfall total is 2.49 inches, occurring on 22 August 1968. The record annual maximum rainfall was 21.14 inches, recorded in 1983. The 24-hour duration, 1,000-year storm event would produce an estimated 3.14 inches of rain, according to the WRCC. Figure 5-3 shows the daily precipitation average based on historical data collected for the Twentynine Palms Precipitation station. As shown, the average daily rainfall is minimal and has never exceeded 0.09 inch for the past 78 years showing the area to be predominantly dry.

FINAL Twentynine Palms Wastewater Master Plan Page 5-6
Figure 5-4 shows the probability of a 0.01 inch quantity of precipitation over varying time periods. Similarly, the figure shows that the probability does not exceed 30% for a combined 5 day period, again confirming the arid nature of the area and its general lack of significant precipitation.
Studies have shown that for newly-constructed sewers, the infiltration component is insignificant. Since the system being evaluated will be new, it is expected that the infiltration will be negligible. Additionally, taking into account the dry climate for the District’s service area, soil types present in the region and WRCC precipitation data, it is unlikely that soil and precipitation conditions would be such that infiltration would occur in a sewer of almost any age or condition. As such, neither infiltration nor inflow is expected to occur and thus have been formally omitted in the construction of the model. Sewer flows were therefore calculated based on peak dry weather flows, with infrastructure sizing based on peak flow conditions. Of note, while I&I has essentially be omitted from the future sewer system demands, it is believed that sewer system sizing has accounted for various planning contingencies by using conservative per capita flow values.
5.4.3 Diurnal Peaking Factors Figure 5-5 below shows the typical daily diurnal curves for daily wastewater flow generation by primary customer type. These curves were developed for nearby agencies (Hi-Desert/Yucca Valley) and used to represent the variation in sewer flows for each land use type during a typical 24-hour period.
5.4.4 d/D Ratios Typically, sewer systems are designed to account for extraneous flows by designing pipes to have a d/D ratio of 0.5 for peak dry weather flows (PDWF). For example, when PDWF conditions are exceeded, pipelines designed at a maximum d/D ratio of 0.5 will have 50 percent of the pipeline remaining to accommodate additional flows. For the District’s proposed sewer system the maximum d/D ratio for all sewers that are less than 18-inches in diameter shall be 0.50 and the maximum d/D ratio for all sewers that are greater than or equal to 18-inches in diameter shall be 0.66.
5.4.5 Pipeline Slopes All trunk and collector sewers have been designed to meet minimum slope criteria of 0.4 percent in order to allow for sufficient velocities at the peak day flow rate. As a secondary criteria, trunk sewers should have a velocity of 3 feet per second (fps) or greater at peak day flow to have adequate cleansing velocity to avoid sedimentation in the pipes.
5.4.6 Maximum Allowable Velocity In addition to the pump station capacity and wet well cycling considerations, the potential construction of new force mains in the system also requires the need for a force main maximum velocity design criteria. The suggested criterion to be used for the evaluation or design of a new sewer force main is for the velocity to not exceed six (6) feet per second.

FINAL Twentynine Palms Wastewater Master Plan Page 5-7
5.4.7 Facilities It is assumed that manholes shall be installed on sewers at all changes in slope, size of pipe, or alignment and at all intersections of main line sewers. The maximum spacing allowable between manholes should be 500 feet unless otherwise approved. However, for the purpose of modeling the system manholes have been installed only at areas of significant change in slope, change in size of pipe, changes in pipe alignment and at pipe intersection.
5.4.8 Crown Depth When designing sewer trunks it is important to keep in mind the depth of the pipe, as the sewer trunk should be located at a greater depth than the adjacent water main lines, to avoid any infiltration of sewage into water lines in the case of a sewer break. For this concept planning model, such detailed criteria were not considered, and all pipelines were modeled with a minimum crown depth, also known as cover, of three (3) feet and a maximum cover of fifteen (15) feet.
5.5 Demand Loading Flows are loaded into the model at “load manholes,” each of which represents the point where flows from un-modeled sewers discharge into the modeled network. Parcels connected to un-modeled sewers were grouped into sewer sub-catchments, each with a unique load manhole in the modeled network. Sub-catchments were given identifiers consistent with the identifiers of their load manholes. In the outlying sub-catchments, 1, 9 and 10, loads were applied at multiple points. Due to the fact that these areas do not have upstream flows, but will still require a trunk running through their region it was appropriate to split up the load within that sub-catchment to more accurately model those areas and determine necessary pipe sizes. A total of 11 representative sewer watersheds were defined to represent the build-out model loads and sewer alignment.
Table 5-2 below shows the above, their respective load manholes, the loads applied at each manhole, as well as the flow received from upstream. The loads shown below are derived from an average per capita loading of 73.5 gpcd.

FINAL Twentynine Palms Wastewater Master Plan Page 5-8
TABLE 5-2 MANHOLE LOADING
Watershed Load
Manhole(s)
Manhole Load (Max.) (cfs)*
1 1100 1130 1180
0.67 0.67 0.67
2 1200 1.68 3 1305 2.24 4 1400 0.49 5 1500 1.59 6 1600 0.96 7 1700 0.41 8 1800 9.06
9 1900 1930 1940
3.22 3.22 3.22
10 2000 2020
2.27 2.27
11 2100 3.93 *Flow values are not cumulative
Following the initial setup of the model and calculation of watershed loads, the load manholes at the outlet of each sub-catchment were applied the appropriate load(s) and the model simulation performed. The model was updated iteratively in order to meet the design criteria and boundary conditions described in Section 4.1.5. System updates included:
Updating pipe sizes to meet maximum and minimum d/D, velocity and slope criteria,
Updating of pipe upstream and downstream inverts as pipe sizes changed, and
Evaluation of multiple scenarios to determine proper load application at load manholes.
The hydraulic model is used in subsequent sections to evaluate the infrastructure needs of the community’s build-out scenario, and prepare concept level alignments and cost considerations for future wastewater collection and treatment systems.

FINAL Twentynine Palms Wastewater Master Plan Page 6-1
Section 6: Wastewater System Evaluation
The main objective of this Plan is to prepare a concept plan for the potential the need for sewers based on the findings of the Salt and Nutrient Management Plan study for the Twentynine Palms area. The findings of the SNMP determination the WWMP infrastructure needs and are described in the sections that follow. This section describes the hydraulic analysis used for infrastructure sizing for the City. The evaluation was based on the build-out population conditions discussed in Section 3. The build-out scenario was chosen because it would provide an estimation of the cost of the infrastructure needed if the service area were to develop in accordance with adopted land use plans and ultimately convert to a regional sewer system.
The Section also discusses various treatment technologies and options for disposal of the wastewater generated. Finally a staging plan for the treatment plant is also discussed in this section.
6.1 Evaluation Approach The hydraulic capacity analysis of the system incorporated approximately 25 miles of pipeline for the areas which included all large trunk sewers in the study area. The analysis was conducted using a computerized dynamic model (H2OMap Sewer, a GIS based-hydraulic modeling software). The information required for the model (pipe diameters and lengths, invert and ground elevations, etc.) was populated, and the hydraulic capacity evaluated by checking its conformance with the planning criteria described in Section 5.
The future flows in the modeled sewers were estimated by dividing the study area into a number of sub-catchments/watersheds based on delineation. Various sub-catchments were then combined into approximately 11 watersheds areas and flow loadings for the build out period were computed for each of those areas. The primary sources of information used included the District’s population and water use projections, and land use performed as part of the City’s General Plan Update. Other data sources used in estimating flows included census data, general and specific plans, parcel-level land use and other water consumption records.
The population within the District’s Sphere of Influence is projected to increase to an estimated 102,963 at build-out. The unit flow factors (e.g., flow per capita and per acre) and 24-hour flow profiles used to convert the population and acreage estimates to wastewater flows. Sewer loadings were thus developed using historical water use data and population projections primarily as defined in the UWMP 2010 and discussed in Section 4.
The capacity of the modeled sewers was assessed under peak dry weather flow conditions as defined in Section 5. Peak wet weather flow conditions were omitted due to the fact that wet weather conditions are sparse and when they do occur there is rarely the potential that it will influence sewer flow due to the arid climate and extremely dry soils. See Section 5.4.2 for additional discussion based on precipitation evaluation using the Twentynine Palms rain gage station.

FINAL Twentynine Palms Wastewater Master Plan Page 6-2
6.2 System Capacity Analysis Section 6.2 discusses system alignment, trunk-sewers, pipe sizes and types of pipes in the system model.
6.2.1 System Alignment The system alignment was chosen primarily based on the location of existing Twentynine Palms Water District distribution mains. The District’s largest mains run along its major roads: Two Mile Road and Twentynine Palms Highway running East-West, and Lear, Adobe and Utah Trail running North-South. Similarly the sewer trunks were modeled to be placed along the City’s main roads for ease of construction and to serve as main lines to collect wastewater flows from the highly populated areas. Sewer trunks run south on Lear and Adobe down to Two Mile Road. Trunks run east on Two Mile Road and Twentynine Palms Highway and Amboy, where they are presumed to be treated at a future WWTP. Trunk lines also run north on Utah trail as they collect from the south eastern portion of the District. Note that though the majority of laterals and collector lines were not modeled as it was beyond the scope of work for this study, it is assumed that the customer will be responsible for getting these flows to the main trunk-lines. Infrastructure requirements for getting flows to the trunk sewers have not been accounted for in this study.
Twentynine Palms resides in a relatively flat, desert region which provides additional challenges for sewer system planning. In order to avoid extremely deep sewer lines and ease excavation costs during construction and maintenance in the future, pipes have been modeled in compliance with the maximum crown depth criteria of fifteen (15) feet. Extremely flat regions connecting to higher elevation areas are assumed to require sewer lift stations in order to meet the specified modeling criteria. Additionally, extremely flat areas within each of these sub-catchments also included the placement of lift stations to stay within maximum depth criteria. In reality a more focused study of ground contours in the planning of the sewer system may eliminate the need for some, require additional, or change the location of these concept level, sewer lift stations. The collection system for the Twentynine Palms area has been conceptually designed to service all properties within the service area. The majority of flow was modeled to operate under gravity flow conditions for disposal at a future WWTP facility.
6.2.2 Trunk-Sewer Pipelines After the model construction and hydraulic simulations have been performed, the model outputs were closely analyzed to determine where the system needed to be adjusted in order to meet the established planning criteria. Multiple iterations of the model adjustment and simulation analysis process were performed to achieve overall system conformance with the design criteria. In designing a trunk sewer layout that efficiently and cost effectively collects (maximize gravity sewers) and send all sewer flows to a potential treatment plant, it is necessary to have a mix of gravity and force mains. Though majority of the pipelines were gravity, a few force mains were also included due to the system’s need for area specific lift stations.
Recommended pipe sizes for the modeled system for gravity lines ranged from 10 inches in the sparsely populated un-incorporated area to 42 inches at the head of the system heading to the wastewater treatment plant where the entire flow for the system gets accumulated. Force mains ranged from 6 inches to 30 inches for the system. The majority of the gravity trunk pipelines
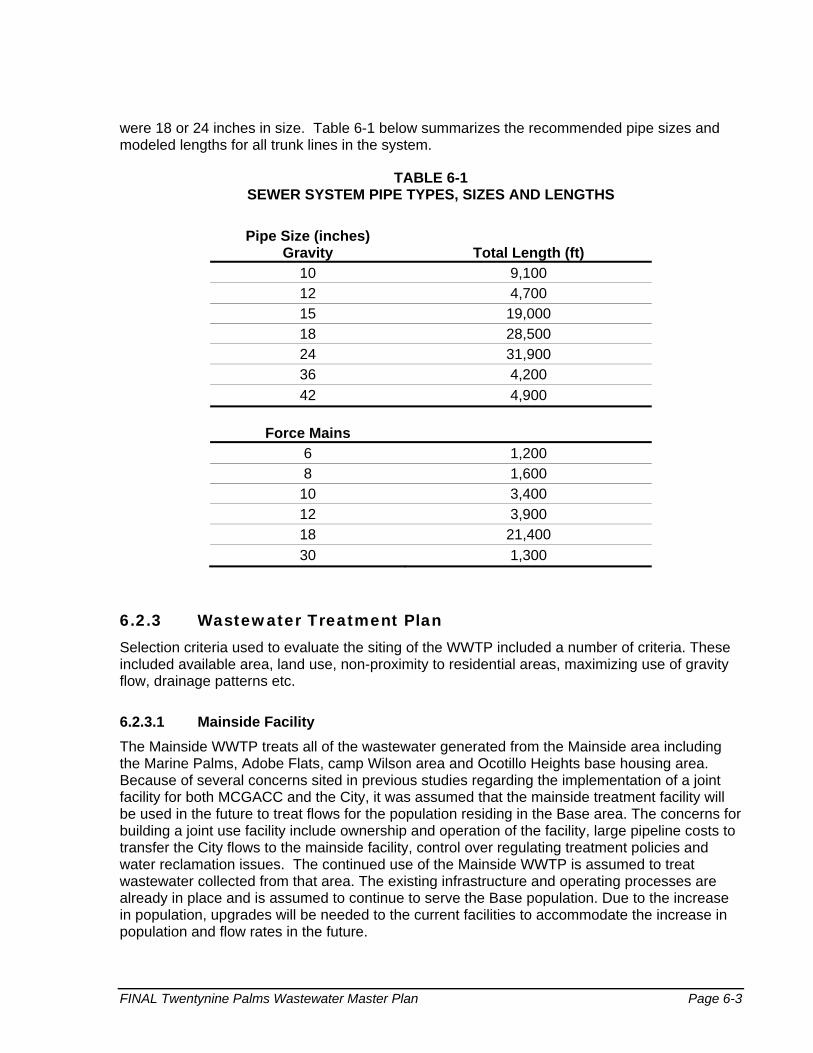
FINAL Twentynine Palms Wastewater Master Plan Page 6-3
were 18 or 24 inches in size. Table 6-1 below summarizes the recommended pipe sizes and modeled lengths for all trunk lines in the system.
TABLE 6-1 SEWER SYSTEM PIPE TYPES, SIZES AND LENGTHS
Pipe Size (inches) Gravity Total Length (ft)
10 9,100 12 4,700 15 19,000 18 28,500 24 31,900 36 4,200
42 4,900
Force Mains
6 1,200 8 1,600
10 3,400 12 3,900 18 21,400
30 1,300
6.2.3 Wastewater Treatment Plan Selection criteria used to evaluate the siting of the WWTP included a number of criteria. These included available area, land use, non-proximity to residential areas, maximizing use of gravity flow, drainage patterns etc.
6.2.3.1 Mainside Facility
The Mainside WWTP treats all of the wastewater generated from the Mainside area including the Marine Palms, Adobe Flats, camp Wilson area and Ocotillo Heights base housing area. Because of several concerns sited in previous studies regarding the implementation of a joint facility for both MCGACC and the City, it was assumed that the mainside treatment facility will be used in the future to treat flows for the population residing in the Base area. The concerns for building a joint use facility include ownership and operation of the facility, large pipeline costs to transfer the City flows to the mainside facility, control over regulating treatment policies and water reclamation issues. The continued use of the Mainside WWTP is assumed to treat wastewater collected from that area. The existing infrastructure and operating processes are already in place and is assumed to continue to serve the Base population. Due to the increase in population, upgrades will be needed to the current facilities to accommodate the increase in population and flow rates in the future.

FINAL Twentynine Palms Wastewater Master Plan Page 6-4
6.2.3.2 New WWTP for Area Flows
A number of sites locations were considered and evaluated for a potential future WWTP. Based on the selection criteria, need for overarching cost control measures, and discussions with the City and District staff, a generalized location for the wastewater plant is suggested in the vicinity of Amboy Road and Bagdad Road. Based on our siting discussions, no particular area was selected at this time. The topography of the project area tends to generate a drainage pattern which slopes towards the South West therefore it was taken into consideration that having a treatment facility in that area would maximize the use of gravity sewers. As per earlier studies, it shows that approximately 70 acres of land may be available for the WWTP in this area. This allows for the treatment plants layout and siting, and future facility expansion if desired. The area is mainly undeveloped and may be a suitable location for a centralized treatment facility.
Note that for future refinement, the project would need to go through the environmental review process. California Environmental Quality Act (CEQA) and National Environmental Policy Act (NEPA) studies will be required for further refinement of the plan siting. After the environmental process, the best location for siting this facility should be determined. The location of the treatment facility determines the direction of flow, lift stations needed, and sizes of the pipelines. Figure 5-1 reflects the generally alignment and location of a potential trunk sewer system and the accompanying lift stations associated with conveying wastewater to a wastewater plant in this general location.
6.3 Treatment Disposal Technologies and Options Various treatment disposal technologies and options were evaluated for the disposal of the wastewater generated. The objectives for the proposed wastewater treatment plant are to:
● Provide a long term build-out capacity of approximately 9.3 MGD
● Process domestic strength (commercial and residential) wastewater
● Produce a reliable Title 22 (2.2 tertiary) effluent for disposal to surface spreading grounds
● Process the sludge to a Class B standard for disposal
● Have the ability to gradually accept flows from less than 1.0 MGD to the ultimate plant capacity level
6.3.1 Cost Effectiveness of Staging There are two overriding challenges that are critical and could affect the process. The first is the large capital cost of the total plant capacity being allocated to a small customer base that would initially be available to fund both capital and operating costs. A basic cost could exceed $40,000 per single family household unit, solely for the treatment plant, excluding the cost of the collection system improvements. The second, is challenge associated with facility staging, an issue that is inherent with building small treatment process units for 1 MGD with the need to either demolish or attempt to integrate unequally sized process units as the facility expands to its ultimate 9.3 MGD capacity. Operating a plant with a multitude of process unit sizes, all trying

FINAL Twentynine Palms Wastewater Master Plan Page 6-5
to perform identical tasks is an un-desirable outcome. However, there is a solution that overcomes these two challenges.
In developing communities, the dilemma of how to cost effectively “grow” a wastewater treatment plant efficiently is a common one, and is generally resolved by building system flexibility and cost effectiveness into the long-term facility needs. The staging technique focuses on building process units that become conversions for expanded plant capacity. As such, as expansion is needed, a “re-labeling” process is derived so that existing tanks originally designed to perform a specific function is “re-labeling” in the expansion to do a different function. The potential plant development scenario derived herein is explained below.
6.3.2 Plant Development Scenario The following scenario describes how the above might work for Twentynine Palms:
Initially a sequencing batch reactor (SBR) plant, fabricated from three circular tanks, would be installed for a Stage 1, capacity of 1.0 MGD. Install the basic process units for producing tertiary effluent. Include a site footprint for the final treatment plant, allowing the SBR units to be located in the area where solids treatment will occur. Include a single building that serves as combination housing for electrical MCC, operations center, and shop. This building would eventually become the shop facility for the final 2.0 MGD layout.
Create a different process plant for 2.0 MGD. Incorporate the SBR process units and convert them into two aerobic digesters and a holding tank. Add a portion of the non-process buildings that are planned for the Stage 2, 2.0 MGD plant layout
Expand the 2.0 MGD Stage 2 plant by duplicating parallel process units for a combined capacity of 4.0 MGD of the Stage 3 plant. Complete the addition of the non-process buildings by adding the administration building.
Expand the Stage 3, 4.0 MGD plant to the final Stage 4 plant with the projected ultimate capacity of 9.3 MGD. This final expansion, as in Stage 3, would be completed by building parallel units.
There are two options for this particular plant: either make the 2 MGD the common unit size or make 4 MGD the common unit size. If 2 MGD becomes the common unit size, then Stage 2 is the starting point for a change from the SBR process to the selected final process. If, however, 4 MGD becomes the common unit size, then Stage 2 continues with the SBR process (by duplicating Stage 1) and Stage 3 becomes the starting point for the selected final process.
The advantage of making Stage 2 the starting point is that the necessary “standby” process unit required for Title 22 compliance is smaller and less expensive.
The advantage of making Stage 3 the starting point is that more capital costs become deferred later.
By following the above pattern, the below mentioned important benefits would occur. No capital would be invested prematurely in fixed assets before they are capable of being used and useful.

FINAL Twentynine Palms Wastewater Master Plan Page 6-6
Also, the plant capacity would always be used at or above the minimum operating capacity. An important factor in operations is that a wastewater treatment plant cannot be successfully operated below a threshold minimum capacity (20 to 25 percent of the rated capacity). Additionally, very nominal asset value would be lost in transition from one capacity to another and finally at no time, would the plant configuration result in an inefficient operation.
By following this plant development scenario of plant construction and operation, the results would be:
Cost-effective implementation
Completion of the “plan” for the final stage of plant layout
Operational performance that is efficient as the flow vs. capacity follows a parallel growth
Treatment objectives remain at a constant standard
The groundwater resources are protected equally well at each stage of plant capacity
6.3.3 Treatment Process Selection An important decision is the process selection at each of the stages of the plant expansion. Initially, an SBR plant provides the flexibility to operate within a wide flow and loading range and also allows the process units to be integrated into a larger capacity plant in a different role and sludge processing units. After stage 1, a process selection should be made that can be replicated with parallel units for the ultimate plant capacity of 9.3 MGD.
6.3.3.1 Sequencing Batch Reactor
Construct three above ground circular tanks. Two will be batch reactors and the third a sludge aeration vessel. These will provide a nitrified and de-nitrified secondary effluent followed by a cloth disk filtration unit (Title 22 certified). Include one more disk inside the tank as a standby tertiary unit. Follow the tertiary treatment with a sodium hypochlorite disinfection system. Provide adequate contact time to include a 90 minute modal contact time at peak dry weather flow.
Once the SBR system is converted, the larger two tanks will serve as sludge aeration basins for meeting Class B sludge and the smaller tank will serve as a holding tank for recirculating streams (tertiary backwash, rejected effluent, drainage). If dual SBR systems (1 MGD each), are constructed, all four of the larger tanks will serve as sludge aeration basins and the two smaller tanks can be dedicated for separate purposes; one for recirculating streams and one as an effluent equalization basin.
6.3.3.2 Extended Aeration Membrane Bioreactor
The advantages and dis-advantages of this process have been considered in other reports 1, 2 the process depends largely on the technological advances that have been made in the fine pore membrane manufacture. It does produce an exceptionally high quality effluent, even to a quality that exceeds the Title 22 requirements for the effluent that will be disposed by surface

FINAL Twentynine Palms Wastewater Master Plan Page 6-7
spreading on the ground for percolation. In addition to the stringent turbidity and coliform standards, it will also meet very low nitrogen limits as well.
However, in the past decade, the operating aspect of membrane bioreactors has raised the issue of maintenance. The membranes are submerged in the mixed liquor. Periodically, cleaning requires the membranes to be removed from the mixed liquor in the reactor basins, raised to a level where maintenance workers can physically hand clean the cassettes of membrane fibers. This procedure has been considered a negative aspect of the membrane technology. Several wastewater agencies have refused to use MBR due to this particular aspect of their use.
6.3.3.3 Modified Ludzack Ettinger
The mLE process consists of two stages of reactor basin; an anoxic zone and an oxic zone. The anoxic zone precedes the oxics zone and receives the influent wastewater together with recycled mixed liquor rich in nitrate, and return activated sludge. The nitrate is reduced to elemental nitrogen gas. The oxic zone oxidizes organic matter and the ammonia and organic nitrogen. The section below illustrates the process in a schematic format.
This technology is currently in place in many wastewater plants in southern California and provides wastewater treatment that also meets the requirements for a Title 22 effluent and will meet a nitrogen limit of between 5 mg/l and 8 mg/l. This range is typically what is permitted for inland discharges in southern California. The mLE process is a subset of the “extended aeration” process. It provides the long detention time for solids and it also provides nitrification and de-nitrification. It can be tailored to reduce total nitrogen to a concentration as low as 5 mg/l. Lower than that number, a five-stage process called the Five-Stage Bardenpho (often simply referred to as “Bardenpho”) that can reduce total nitrogen to 1 mg/l and total phosphorus as low as 0.2 mg/l.
6.3.3.4 Five Stage Bardenpho
The Bardenpho process is simply an mLE process with three added stages. It includes in sequence Anaerobic-anoxic-oxic-anoxic-oxic. The purpose of this extended version of the mLE process is to create more recirculation and further reduce not only total nitrogen but also phosphorus. It can produce nitrogen and phosphorus concentrations not feasible from the mLE process. It is only necessary to use where an mLE process is not adequate for phosphorus removal.
6.3.4 Recommended Process for Twentynine Palms Studies conducted for wastewater treatment for other regions like the High Desert favors an extended aeration MBR. For various reasons, this process was estimated to be the most attractive. However, the MLE process can provide the necessary water quality and perform at a lower capital cost and lower maintenance cost. The total process train would consist of:
● Influent screen and flow meter
● Grit tank and grit separation equipment
● Anoxic basin(s)

FINAL Twentynine Palms Wastewater Master Plan Page 6-8
● Oxic basin(s)
● Secondary clarifier(s)
● Recycle pumping (RAS and MLR)
● Tertiary filtration
● Disinfection
● Sludge aeration
● Sludge drying beds
● Effluent spreading ground

FINAL Twentynine Palms Wastewater Master Plan Page 7-1
Section 7: Capital Improvement Program (CIP)
This section includes a summary of the potential capital costs for the infrastructure of the trunk-sewer wastewater system derived to meet a build-out scenario for Twentynine Palms. The system includes the modeled system backbone, wastewater treatment facility, major laterals and lift stations as discussed in Section 5 and Section 6.
7.1 Cost Estimating Criteria Capital costs were developed for the potential build-out sewer trunk system, trunk system facilities, wastewater treatment facility based on Class 5 conceptual stage design concepts and with the guidance of recent regional project experience, vendor quotes and cost estimating reference standards. Costs presented herein are considered to be conceptual level planning costs and should not be used for design purposes. This following section summarizes the methodology used to develop the base cost criteria for developing preliminary opinions of probable capital costs for the capital improvement projects. All costs presented in this section have been adjusted to an Engineering News Record (ENR) construction cost index, which represents the average 2012 ENR cost index for the Los Angeles Area.
Total project costs include a summation of all construction materials costs, engineering, management costs, taxes and standard overhead and profit margins. Soft costs (engineer, project administration and construction management) were estimated to be 25% of the construction cost for system facilities. Taxes on materials were estimated to be 7.75% and Contractor overhead and profit were estimated to be 15%.
7.1.1 Trunk Sewer Costs Unit costs per linear footage for the various sizes for both gravity sewer and force main are presented below in Table 7-1. The pipe material for the gravity sewers was assumed to be high density polyethylene (HDPE) for small and medium diameter pipes and concrete for large diameter pipes. The material for the force mains was assumed to be polyvinyl chloride (PVC).
TABLE 7-1 SEWER TRUNK SYSTEM UNIT COSTS
Sewer Type Pipe Size (in) Unit Project Cost ($/LF) Gravity Sewer 10 218
15 262 18 281 24 349 36 696 42 859
Force Main 6 203 8 218 10 247 12 286 18 392 30 619
FINAL Twentynine Palms Wastewater Master Plan Page 7-2
Table 7-3, in the following sections, shows the summary of the total cost for both the gravity sewers and the force mains for the trunk sewer and the major laterals evaluated for the system. Detailed cost estimates are included in Appendix B.
7.1.2 Manholes Costs For the purpose of estimating on a per linear foot basis, manholes were added to the cost of the pipes. Manholes were assumed to be placed every 500 feet, as per the planning criteria, on the pipelines and for the purpose of estimating were assumed to be between 6 and 10 feet deep based on the size of the pipe. Manholes ranged in cost from $3,700/each to $10,925/each, installed, depending on the size and depth of the manhole, which is a function of the size of the pipe. Table 7-3, in the following sections, shows the summary of the trunk sewer pipeline costs which includes the total cost for the manholes evaluated.
7.1.3 Collector and Laterals Costs Generating a complete CIP also required that there be costs associated with a collector system for local areas within the city that drain to the trunk system. Due to the level of complexity and the intricacy of planning and design that go into this system it was unrealistic to estimate the quantity of collectors required. The cost for the collector and lateral pipelines was calculated on a standard 8 inch pipeline unit cost. This is shown to be a realistic estimate based on previous experience and studies in other parts of the region. Table 7-3, in the following sections, shows the summary of the total cost for the collector pipelines.
7.1.4 Trunk System Lift Stations Conceptual estimates of trunk system lift station costs were also developed based on anticipated lift station sizes and flows. Lift stations were sized to handle peak flows modeled through the section of trunk being served. Flows ranged from 300 gpm in the outlying and unincorporated areas to over 10,000 gpm at the lift stations near the head of the system leading up to the treatment plant. Lift stations were estimated based off of total estimated completion cost with phasing not taken into account.
Note that as the system was modeled for ultimate build-out flows, many of these facilities may not be needed for years because the area would not reach its build-out population. For example lift stations in earlier phases may not require that they be completed because the full flows to be served by those lift stations will not be expected for several years. Costs associated with intermediate time frame have not been evaluated as scope of this project and should be evaluated as part of a feasibility study in future. The basic purpose for the CIP cost estimation for this study is to get an idea of how much the City/District will need to spend if it looks at the option of building a wastewater collection system in accordance with its General Plan growth and land use trends and if it would be realistic to spend a huge amount of capital to construct a collection system to treat the areas wastewater.
List station costs for the area lift station facilities are provided in Table 7-2 below. Smaller lift stations (near and below 1,000 gpm) were generally assumed to be package facilities using submersible pumps (see Section 6 for more details). For the purpose of cost estimating, larger facilities were generally assumed to be vertical turbine pump (VTP) facilities including a wet

FINAL Twentynine Palms Wastewater Master Plan Page 7-3
well-dry well. These larger facilities were also assumed to require backup power generation. Detailed cost estimates are included in Appendix B.
TABLE 7-2 LIFT STATION CIP COSTS
Facility Total Cost Submersible Pump Stations $4.0 M
Sub-catchments: 1, 2, 6, 10 Vertical Turbine Pump Stations $17.2 M
Sub-catchments: 3, 9, 10
7.1.5 Wastewater Treatment Facility As discussed in Section 6, the wastewater treatment facility for Twentynine Palms is projected to initially be designed with an SBR process and then modified to a mLE process in subsequent phases to more efficiently treat additional flows. The estimated cost of this facility is approximately $150 million dollars. This cost includes the cost for earthwork, concrete, equipment for a 9.3 MGD facility.
7.2 Total CIP for Entire Area A summary of the total estimated cost for each CIP component is presented in Table 7-3, with the majority of these facilities shown graphically on Figure 7-1. The estimated capital cost for the combined CIP is approximately $290 million. The single largest cost component is for the wastewater treatment facility. The configuration of the trunk facility system was based primarily on the topography and overall drainage patterns of the Twentynine Palms service area.
TABLE 7-3 ESTIMATED CIP COSTS FOR BUILD-OUT AREA
Note: Total build-out CIP to support Twentynine Palms service area.
It should be noted that a large portion of the area modeled and planned for in this study is located outside of the City of Twentynine Palms and is known as the Unincorporated Area north of the City. A screening assessment was performed to identify the influence of this area on the total CIP cost. For this assessment, the facility sizes and flow volumes downstream of the Unincorporated Area were retained, suggesting a narrow focus on the facilities located outside of the City. In that way, a separate cost comparison could be derived. The results of this assessment are shown in Table 7-4 below. As shown, there would be a reduction of approximately $25 million by excluding the unincorporated area piping from the long-term
Facility Total Cost Million $ Trunk Sewers System $46 M Lift Station Facilities $21 M Collectors and Laterals $72 M Wastewater Treatment Facility $150 M
Total Approximate Capital Cost $290 M

FINAL Twentynine Palms Wastewater Master Plan Page 7-4
system build out cost considerations. The build-out system plan, adjusted to extract the unincorporated area, is graphically depicted in Figure 7-2.
TABLE 7-4 ESTIMATED CIP COSTS EXCLUDING NORTHERN UNINCORPORATED AREA
It is important to note that there are multiple alternative configurations and alignments that could be developed to support the potential phasing of a wastewater collection and treatment system for the Twentynine Palms area. For example, in addition to the exclusion of the large northern Unincorporated area, additional scrutiny could be provided to extract large rural areas with a prevalence of large parcels (refer to Appendix C) as sewering these areas likely provides minimal benefit to reducing septic loadings on the groundwater basin and may not be economically feasible to construct additional sewer infrastructure.
At the City’s request, one such scenario was developed to consider excluding low density residential land use parcels throughout the City. For this scenario, low density residential parcels (GP land use-RL 1-ac, RL 2.5-ac, RL 5-ac, SRF E, Tribal Land, OSR, OSR-40) with a density less than or equal to 1 DU/ac were excluded from future sewer system considerations. Excluding the 26,000 acres and approximately 8,700 potential dwelling units from future sewage system requirements, would further decrease future flows by approximately 1.7 MGD for the above areas and further reduce the capital improvement program by approximately $100 million. The results of excluding the Unincorporated area and these low density areas would suggest the need for a 6 to 6.35 MGD sewer collection and treatment system at a planning level cost of approximately $170 - $190 Million.
As exemplified from this section of the Master Plan, should sewers be needed in the Twentynine Palms area, there are a number of alternative configurations and sewering strategies that may meet that need. Therefore, as future groundwater, septic and wastewater evaluations are conducted and the need for sewers is appropriate, additional implementation programs and costs should be developed to derive a suitable sewer system phasing plan for the Twentynine Palms community.
7.3 Overview of the SNMP Findings and Influence on the CIP The following Section discusses the findings and recommendations of the SNMP and discusses how these influence the WWMP process.
7.3.1 Existing and Future Wastewater Systems As discussed earlier, the area of Twentynine Palms is currently served by septic systems. When properly designed, sited, installed, and maintained, conventional septic tanks are capable of
Facility Total Cost Million $ Difference in Cost Trunk Sewers System $39 M $7M Lift Station Facilities $18 M $3M Collectors and Laterals $57 M $15M Wastewater Treatment Facility $150M -
Total Capital Cost $265 M $25M

FINAL Twentynine Palms Wastewater Master Plan Page 7-5
approximately 65 percent removal of suspended solids, and biodegradable organic compounds. Most traditional systems rely primarily on physical, biological, and chemical processes in the septic tank and in the unsaturated soil zone below the septic tanks (commonly referred to as a leach field or drain field) to sequester, or attenuate pollutants of concern. In areas with appropriate soils and hydraulic capacities, they are designed to treat the incoming waste load to meet public health, groundwater, and surface water performance standards.
Nitrogen, phosphorus, pathogens, and other contaminants are present in significant concentrations in most wastewaters treated by onsite systems. Although most can be removed to acceptable levels some may remain in the effluent exiting the system. More recently, however, certain pollutants present in wastewater from septic systems are raising concerns in the regulatory compliance, including nutrients (e.g., nitrogen and phosphorus), pathogenic organisms, toxic organic compounds, and metals. In response to this recent increased concern for threats to groundwater quality from septic tanks, the City and the District retained Kennedy/Jenks Consultants to prepare a Salt and Nutrient Management Plan (SNMP) to assess the long-term potential impacts to groundwater quality from the use of current septic tanks in the Twentynine Palms area. This plan, being prepared under a separate cover, proposes a long-term groundwater quality monitoring plan and other appropriate wastewater management practices.
As population growth continues in the area and more lands are urbanized, groundwater pumping within the District service area is anticipated to increase. Potential effects of these changes on the water use and on the sewer loading to groundwater are important elements of a sustainable water supply for Twentynine Palms. It is for these reasons that the Ground Water Protection Plan suggests the need for additional groundwater management programs.
7.3.2 Salt and Nutrient Management Plan Overview The guidelines prepared for salt/nutrient management plans to was used to develop a comprehensive strategy to monitor and protect the groundwater resources in the area, analyzes nutrient loadings for the various groundwater basins in the area and evaluates loading reductions to balance these basins to avoid potential water quality impacts because of septic systems in the Twentynine Palms area. In addition to the objectives of the SNMP, the premise of developing the Wastewater Master Plan (WWMP) was that if the continued discharges from septic systems would unreasonably degrade the groundwater quality and result in widespread groundwater pollution and compliance issues, the need for a community wastewater collection, treatment, and disposal system would be promoted through the WWMP. This will help the District and the City make informed decisions on wastewater management while protecting groundwater resources. Collectively, the SNMP and WWMP serve as two major elements of the overall management plan developed by the City and District for assessing the potential impact on groundwater quality from the existing septic systems and anticipated future development.
Current, future (year 2035) and build out salt and nutrient loading conditions were evaluated in the SNMP using an Excel ™-based groundwater models (see SNMP for details). The analysis was based on measured historical groundwater quality data collected by the District to show the historical conditions of groundwater quality in each basin and to look for evidence of increasing trends in salt and nutrient concentrations and related effects on groundwater. Data related to septage, primarily for salt (total dissolved solids) and nutrients (nitrate) was evaluated to see if concentrations exceed or threaten to exceed water quality objectives based on the primary and

FINAL Twentynine Palms Wastewater Master Plan Page 7-6
secondary maximum contaminant levels (MCLs) for chemical constituents in drinking water. The models were developed to identify major inflows into and out of the groundwater basins underlying the Twentynine Palms area and evaluate concentrations of the salt/nutrients. The results of the models were used as the basis to quantify the volume of water contributing to each basin, including recharge from septic tanks, with the corresponding water quality of water entering the aquifer system.
Groundwater outflows were identified to evaluate the resulting mass and concentration of salt and nitrate in groundwater exiting the aquifer system. The WWMP utilizes the results of the analyses above. The need for sewer infrastructure was based on the underlying principal that if projected salt/nutrient loadings, calculated using the GW models, exceeded the assimilative capacity of the groundwater basins, then a wastewater system will be needed to manage the salt/nutrient excess loadings for a given basin. Based on the mass balances of contaminants within each groundwater basin, the areas that could be considered for sewers were identified. The above approach took into account that acceptable salt and nutrient regulatory requirements were met and did not violate the water quality requirements as specified by the Regional Water Quality Board.
7.3.3 Salt and Nutrient Management Plan Findings Because the infrastructure requirements of the WWMP are driven by the results evaluated in the SNMP, the general approach for a phasing program is based on a time-based quantitative assessment of salt and nutrient loading to the groundwater system. The Current and 2035 conditions were evaluated by analyzing both spatial distribution and temporal trends for each groundwater basin. The assessment at the basin scale accounts for spatial variations in land use, water demand, and basin hydrogeological conditions.
To demonstrate temporal trends and the potential effects of changes in land and water use, results of the Current and 2035 Scenarios were compared based on the assumption of the continued discharges from septic systems from future anticipated land use development and the increase in water demand. The primary objective of the salt and nitrate balance models is to estimate the mass loading into groundwater basins underlying the septic tanks and resulting concentration in groundwater with the mixing of septic recharge with the existing groundwater. An analysis and documentation of the regional water balance, nutrient loadings, and groundwater impact analysis was performed in the SNMP. As noted therein, these key criteria were derived based on available data.
Based on the calculated loadings, critical basins were identified and a prioritized phasing program based on specific area-wide impacts of nitrogen was established. The phasing approach looked at prioritizing and converting the septic areas to a sewer system where the groundwater quality regulations were being violated under given conditions. Areas where these requirements were not being met under current conditions were of primary concern and considered for inclusion in a Phase 1 sewering plan.
Among the four basins underlying the project area, the Mesquite Lake South basin showed the highest septic nitrogen loading (45 ton/yr), consistent with the highest population and density in this area. Under current conditions, the results of the mixed cell models showed that the northern portion of the Mesquite Lake basin is about 15 ton/yr, representing one third of the loading estimated for the southern portion. The areas overlying the Indian Cove, Fortynine
FINAL Twentynine Palms Wastewater Master Plan Page 7-7
Palms and Eastern basins are less populated; thus, nitrogen loading from septic tanks in these basins is estimated to be relatively small, ranging from 7 ton/yr to 9 ton/yr. Nitrogen contribution through exchange flows is the highest for the northern Mesquite Lake basin, as a result of groundwater flowing toward the northern Mesquite Lake basin from the southern Mesquite Lake basin as well as the three smaller basins (Indian Cove, Fortynine Palms, and the Eastern). In summary, the Mesquite basin South and the Eastern basin appear have the highest potential need for mitigation and therefore should be considered for inclusion in Phase 1 of the potential mitigation plan.
The amount of wastewater flow that should be removed from the basin (through a sewer system) is calculated to balance these basins in accordance with appropriate regulatory requirements. As such, the reduction in N loading was calculated to achieve the MCL by removing septic loading for the Current scenario under Phase 1. The Mesquite Lake and Eastern basins are both above MCL in the mixing cell model.
To reach the MCL in Eastern, septic flow needs to be reduced from 200 AFY to 83 AFY. This is a reduction of 117 AFY or 0.104 MGD. Similarly, to reach the MCL in Mesquite Lake South, the septic flow should be reduced from 1038 to 460 AFY. This is a reduction of 578 AFY or 0.516 MGD. The resulting total septic flow reduction is approximately 0.72 MGD. A Phase 1 wastewater system alignment was selected to match the reduction in flow needed and spatially cover the high density areas in the Eastern and Mesquite Lake South, where these flows get generated.
Note that, this alignment was a sub-set of the baseline alignment developed for the build out conditions. Based on topographical and watershed analysis the location of the treatment plant was selected to be in the eastern part of the projects area (near North Amboy Road and Bagdad Road). All phased alignments assumed that if critical areas were converted from septic to sewer infrastructure the flows will be treated at the selected treatment plant site. Hence, during the phasing approach the baseline alignment formed the backbone system and was divided into time-phased infrastructure required to satisfy the given reduction in the loading for each sub-basin.
7.3.4 Groundwater Protection Sensitivity Analysis and Implementation Plan for Phasing of Improvements
It is important to note that that SNMP clearly indicates the need for additional data, because loading estimates were based on various assumptions i.e. percentage septic loading removal, septic effluent concentration, etc. These assumptions were based on typical industry standards and accepted values in the vicinity areas of Twentynine Palms. As such, a sensitivity analysis was performed to evaluate the impact of increasing or decreasing these assumptions on the Phase 1 base case. A summary of the assumption adjustments and findings is show in Table 7-5 and discussed below.
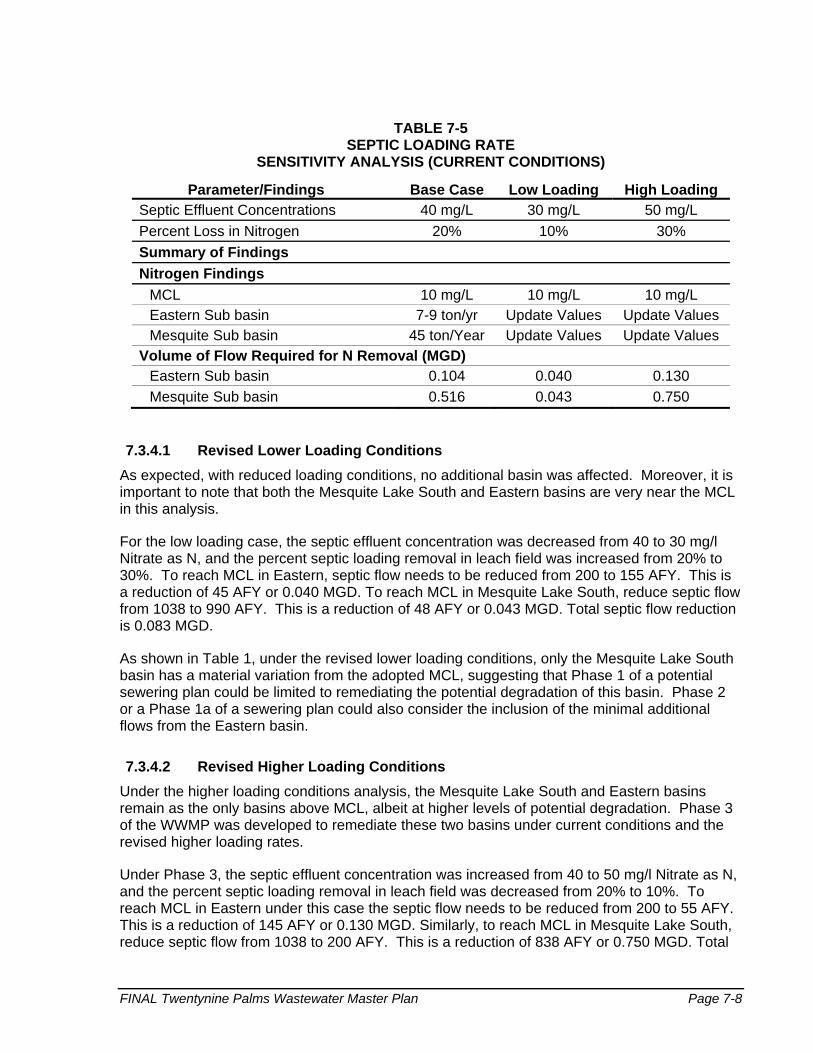
FINAL Twentynine Palms Wastewater Master Plan Page 7-8
TABLE 7-5 SEPTIC LOADING RATE
SENSITIVITY ANALYSIS (CURRENT CONDITIONS)
Parameter/Findings Base Case Low Loading High Loading Septic Effluent Concentrations 40 mg/L 30 mg/L 50 mg/L
Percent Loss in Nitrogen 20% 10% 30%
Summary of Findings
Nitrogen Findings
MCL 10 mg/L 10 mg/L 10 mg/L Eastern Sub basin 7-9 ton/yr Update Values Update Values Mesquite Sub basin 45 ton/Year Update Values Update Values
Volume of Flow Required for N Removal (MGD) Eastern Sub basin 0.104 0.040 0.130
Mesquite Sub basin 0.516 0.043 0.750
7.3.4.1 Revised Lower Loading Conditions
As expected, with reduced loading conditions, no additional basin was affected. Moreover, it is important to note that both the Mesquite Lake South and Eastern basins are very near the MCL in this analysis.
For the low loading case, the septic effluent concentration was decreased from 40 to 30 mg/l Nitrate as N, and the percent septic loading removal in leach field was increased from 20% to 30%. To reach MCL in Eastern, septic flow needs to be reduced from 200 to 155 AFY. This is a reduction of 45 AFY or 0.040 MGD. To reach MCL in Mesquite Lake South, reduce septic flow from 1038 to 990 AFY. This is a reduction of 48 AFY or 0.043 MGD. Total septic flow reduction is 0.083 MGD.
As shown in Table 1, under the revised lower loading conditions, only the Mesquite Lake South basin has a material variation from the adopted MCL, suggesting that Phase 1 of a potential sewering plan could be limited to remediating the potential degradation of this basin. Phase 2 or a Phase 1a of a sewering plan could also consider the inclusion of the minimal additional flows from the Eastern basin.
7.3.4.2 Revised Higher Loading Conditions
Under the higher loading conditions analysis, the Mesquite Lake South and Eastern basins remain as the only basins above MCL, albeit at higher levels of potential degradation. Phase 3 of the WWMP was developed to remediate these two basins under current conditions and the revised higher loading rates.
Under Phase 3, the septic effluent concentration was increased from 40 to 50 mg/l Nitrate as N, and the percent septic loading removal in leach field was decreased from 20% to 10%. To reach MCL in Eastern under this case the septic flow needs to be reduced from 200 to 55 AFY. This is a reduction of 145 AFY or 0.130 MGD. Similarly, to reach MCL in Mesquite Lake South, reduce septic flow from 1038 to 200 AFY. This is a reduction of 838 AFY or 0.750 MGD. Total

FINAL Twentynine Palms Wastewater Master Plan Page 7-9
septic flow reduction is 0.88 MGD. This flow was assumed to be removed using sewers in order to balance the groundwater basins. Phase 3 infrastructure requirements were calculated based on the above flow reductions.
The next phase, Phase 4, of the WWMP was based on the 2035 model results at the baseline loading rates. Under 2035 condition, the Mesquite Lake and Eastern basins are also above MCL in mixing cell model. To reach MCL in Eastern, reduce septic flow from 309 to 100 AFY. This is a reduction of 209 AFY or .187 MGD. To reach MCL in Mesquite Lake South, reduce septic flow from 1633 to 890 AFY. This is a reduction of 743 AFY or .663 MGD. Total septic flow reduction is .85 MGD. The wastewater system alignment will be very similar to previous phases with extensions to the south west and west part of the Twentynine Palms area.
The SNMP recommends a series of strategic tools such as the monitoring plan and BMPs to help with the management of the basin. Due to the availability of limited data during the preparation of these plans one of the critical recommendations is to consider comprehensive monitoring programs to gather useful data over the next several years. This data collection will help in the refinement of the underlying assumptions made as part of this plan and develop updates based on concrete field data. Currently, except for industry standards and values used for developing similar plans by nearby agencies, there is little data underlying these assumptions. Additional monitoring data collected, specific to the Twentynine Palms area, would be valuable in improving the accuracy of water usage, salt and nutrient loading and load reduction estimations, and would result in more reliable and efficient groundwater management plans and programs. It would also facilitate additional refinements to the groundwater basin remediation needs and the potential need for localized sewers as part of this project.
Due to the above data limitations, it is assumed that no facilities would be constructed until the SNMP recommendations have produced additional data and further analysis performed. At that time, the assumption in this master plan can be updated and, if appropriate, a sub-basin specific phasing plan derived for the remediation of potentially impacted groundwater basins.
7.3.5 Ultimate Build-Out of Wastewater Improvements While the City’s General Plan shows land use designations for the build-out, it is currently unknown how the ultimate land use development would occur in the future. In general, uncertainties associated with potential system demands and impacts increase as projections move further into the future. Based on the relatively slow historical growth rate and economic down turn conditions in recent years, the build-out of the City based on the General Plan is anticipated to take place over several decades, perhaps even a century. Given the high uncertainty and remote possibility of the ultimate build-out land development in the long-term planning horizon, qualitative discussion for the build-out scenario is included in the SNMP to highlight the uncertainties and water supply and water quality issues anticipated with the build-out. While a quantitative analysis was for these ultimate build-out conditions was not performed in the SNMP, a potential ultimate sewer infrastructure program was derived in this WWMP to provide an important perspective on the magnitude and financial consequences of such a system. It should be noted that this ultimate system was developed herein to provide a framework for long-range planning purposes and presumably would never be implemented.

FINAL Twentynine Palms Wastewater Master Plan Page 7-10
7.4 Conclusion and Recommendations As shown, the infrastructure costs associated with a sewer system for the entire area to serve its build-out population are extremely high. Moreover, it is reasonably certain that many, many years will pass before this area would reach it’s built-out population. Since the WWMP is driven by the SNMP, implementation should be based on the finding and analyses derived from future monitoring activities as an element of the SNMP. The critical features of the SNMP monitoring and protection plan include increased sampling frequency of existing district production wells, long-term monitoring well network from existing well, detailed monitoring at key locations as identified in the SNMP and conducting sampling event. Additional Sewer System Management Elements are provided in the SNMP with the goal of proactively managing the quality of local groundwater.
The focused recommendations of the SNMP are to implement measures to improve the overall groundwater monitoring and to implement a Septic System Management Program to limit further impacts to the groundwater. Since the current nitrate concentrations in the District's production wells show relatively stable concentrations, it is considered appropriate to gather more data to support the preparation of a more detailed assessment.
The SNMP also recommended that the District and City adopt a Septic System Management Program to properly manage septic tanks by limiting loading rates as part of an integrated effort to protect groundwater quality. The elements of this Program are designed to provide mechanisms to reduce loading at the source before entering the groundwater system. A Septic System Management Program is presented to outline the approach for such a program, and are contained in the accompanying SNMP.
It is anticipated that after three to five years of monitoring and implementation of the SNMP and Septic System Management Program, a comprehensive assessment will be conducted to evaluate the impacts of septic systems on the groundwater. The outcome of this evaluation can then be used to support the development of local septic system policies and update the WWMP to reconsider the need for sewer system infrastructure at that time. Proceeding in this methodical manner would provide a cost effective strategy for short-and long-term groundwater management and protection.

FINAL Twentynine Palms Wastewater Master Plan Page R-1
References
California Department of Water Resources (DWR), 1984. Twentynine Palms Ground Water Study, California Department of Water Resources, Southern District, Los Angeles, CA, 109pp.
California Department of Water Resources (DWR), 2003. California’s Groundwater, Bulletin 118, Update 2003, California Department of Water Resources, Sacramento, CA, 265pp.
California Regional Water Quality Control Board (RWQCB), 2007. Water Quality Control Plan, Colorado River Basin Region 7, June 2006.
California Regional Water Quality Control Board (RWQCB), 2011. Water Quality Control Plan Resolution/Amendment, Colorado River Basin Region 7, May 2011.
California Regional Water Quality Control Board, Colorado River Basin Region 7 (RWQCB), 2006. Order No. R7-2002-2006. Waste Discharge Requirements for United States Marine Corps Base, Owner/Operator Mainside Wastewater Treatment Plant and Wastewater Collection and Disposal Systems, Twentynine Palms – San Bernardino County.
California Regional Water Quality Control Board Colorado River Basin Region 7 (RWQCB), 2011. Staff Report in Support of a Basin Plan Amendment to Prohibit the Discharge of Wastewater into the Ground from Septic Systems in the Town of Yucca Valley. May 2011.
California Regional Water Quality Control Board Colorado River Basin Region 7 (RWQCB), 2011. Guidelines for Sewage Disposal from Land Developments, Resolution No. 79-42, March 14, 1979.
City of Twentynine Palms, 2012. Twentynine Palms Water District Water Pipelines Map, 2012. City of Twentynine Palms, Twentynine Palms, CA.
Dibblee, T.W. Jr., 1968. Geologic map of the Twentynine Palms quadrangle, San Bernardino and Riverside Counties, California, U.S. Geological Survey Miscellaneous Geologic Investigations Map I-561, U.S. Geological Survey, 1pl.
Dudek & Associates, Inc., 2006. Wastewater Feasibility Study, dated May 31, 2006, report prepared for Joshua Basin Water District.
Environmental Systems Research Institute. ArcGIS. Version 10.1. Redlands, CA: Environmental Systems Research Institute, Inc., 2010.
Environmental Systems Research Institute. World Topographical Map, 2010. Redlands, CA: Environmental Systems Research Institute, Inc., 2010.
Freckleton, J.R., 1982. Ground water in the Twenty-Nine Palms Indian Reservation and vicinity, San Bernardino, County, California, U.S. Geological Survey Water-Resources Investigations Report 82-4060, U.S. Geological Survey, Sacramento, CA, 50pp.
Freeze, R.A. and J.A. Cherry, 1979. Groundwater, Prentice Hall, Upper Saddle River, NJ, 604pp.

FINAL Twentynine Palms Wastewater Master Plan Page R-2
Haley and Aldrich, Baseline Report, 2000, Compilation of Groundwater and Wells Information within the Twentynine Palms Water District Service Area, December 2000.
Jenssen, P.D. and R.L. Siegrist (1990). Technology assessment of wastewater treatment by soil infiltration systems. Water Science & Technology, Vol. 22, No. 3-4, pp. 83-92.
Kennedy/Jenks Consultants, 2001. Final Groundwater Management Plan, report prepared for Twentynine Palms Water District, Kennedy/Jenks, Ventura, CA, 50 pp.
Kennedy/Jenks Consultants, 2005. 2005 Urban Water Management Plan Update, report prepared for Twentynine Palms Water District, Kennedy/Jenks, Ventura, CA, 131pp.
Kennedy/Jenks Consultants, 2008. Groundwater Management Plan Update, report prepared for Twentynine Palms Water District, Kennedy/Jenks, Los Angeles, CA, 126pp.
Kennedy/Jenks Consultants, 2009. Shallow Groundwater Investigation- Twentynine Palms Water Treatment Plant Revised Report of Waste Discharge, letter report prepared for Twentynine Palms Water District, dated 22 October 2009, Kennedy/Jenks, Irvine, CA, 10pp.
Kennedy/Jenks Consultants, 2010. Groundwater Study for the Mesquite Lake Subbasin, report prepared for Twentynine Palms Water District, dated March 2010, Kennedy/Jenks, San Francisco, CA, 328 pp.
Kennedy/Jenks Consultants, 2011. 2010 Urban Water Management Plan Update, report prepared for Twentynine Palms Water District, Kennedy/Jenks, Ventura, CA.
Li and Martin, 2011, Geohydrology, simulation of regional groundwater flow, and assessment of water management strategies, Twentynine Palms area, California, USGS Scientific Investigations Report: 2010-5249
Mancl, K., and B. Slater, 2001, Septic System Maintenance, the Ohio State University Extension Fact Sheet AEX-740-01, Columbus, OH. http://ohioline.osu.edu
Mayer, P.W. and W.B. DeOrea. 1999. Residential End Uses of Water. Published by the American Water Works Association Research Foundation.
Deoreo, W.B., A. Dietemann, T. Skeel, P.W. Mayer, D.M. Lewis, and J. Smith. 2001. Retrofit Realities. American Water Works Association Research Foundation.
Metcalf and Eddy, 1991, Wastewater Engineering Treatment Disposal and Reuse, 3rd Edition 1991.Metcalf and Eddy 2004. Wastewater Engineering Treatment & Reuse. 4th Edition. 2003 TDS in septigae
Miller, T.H., 2007, Septic Systems and Their Maintenance, University of Maryland Extension, http://extension.umd.edu/environment/water/files/septic.html
Mojave Water Agency (MWA), 2004. 2004 Regional Water Management Plan, Mojave Water Agency, Apple Valley, CA, 252pp.
Moyle, W.R., Jr., 1984. Bouguer anomaly map of Twentynine Palms Marine Corps Base and vicinity, California, U.S. Geological Survey Water-Resources Investigations Report 84-4005, U.S. Geological Survey, Reston, VA, 1 map.
MWH, 2009a. High-Desert Water District Sewer Master Plan Final Report. January 2009.
MWH, 2009b. High-Desert Water District Water Reclamation Facility Preliminary Design Report. Volume 1, January 2009.

FINAL Twentynine Palms Wastewater Master Plan Page R-3
NBS/Lowry Engineers & Planners, 1997. Master Plan of Drainage, report prepared for San Bernardino County Flood Control District, dated April, 1997. NBS/Lowry Engineers, San Bernardino, CA.
Riley, F.S. and J.S. Bader, 1961. Data on water wells on Marine Corps Base, Twentynine Palms, California, U.S. Geological Survey Open-File Report 61-128, U.S. Geological Survey, Long Beach, CA, 18pp.
Hogle-Ireland, Land Use Designations Map, 2012. Hogle-Ireland, Inc., Fullerton, CA 2012.
State Water Resources Control Board (SWRCB), 2012. Proposed Policy Water Quality Control Policy for Siting, Design, Operation, and Maintenance of Onsite Wastewater treatment Systems. June 5, 2012.
State Water Resources Control Board (SWRCB), 2012. Statement of Policy with Respect to Maintaining High Quality of Waters in California. October 28, 1968.
Taylor, 2003, Evaluating Groundwater Nitrates from On-Lot Septic Systems, A Guidance Model for Land Planning in Pennsylvania. Penn State Great Valley School of Graduate Professional Studies.
Thompson, D.G., 1921. Routes to desert watering places in the Mohave Desert region, California, U.S. Geological Survey Water-Supply Paper 490-B, U.S. Government Printing Office, Washington, D.C., 206pp.
Tom Dodson & Associates, 2009. Initial Study/Environmental Assessment: Hi-Desert Water District Water Reclamation Facility, Wastewater Treatment Plant and Sewer Collection System Project, report prepared for Twentynine Palms Water District, dated June 2009, Tom Dodson & Associates, San Bernardino, CA.
Twentynine Palms Water District, 2012. Twentynine Palms Water District Pipeline Map, 2012. Twentynine Palms, CA.
U.S. Census Bureau, 2009. TIGER/Line County Subdivision Map, 2009. Washington, D.C., Bureau of the Census, 2009.
U.S. Department of the Interior, 2012. National Environmental Policy Act Finding of No Significant Impact. Report No. 12-SCAO-002-FONSI, Bureau of the Interior, Temecula, CA.
Winzler & Kelly Consulting Engineers, 2008. Wastewater Treatment Plant Joint-Use Study, report prepared for NAVFAC Southwest, dated April 2008, Winzler & Kelly Consulting Engineers, San Diego, CA.
Woodward-Clyde Consultants, 1985, Twentynine Palms Groundwater Study Final Report, report prepared for Twentynine Palms Water District, dated 6 May 1985, Woodward-Clyde Consultants, Santa Ana, CA.

Figures

Twentynine PalmsSan Bernardino County, California
Site Map
K/J 1283001*00August 2012
Figure 1-1
Kennedy/Jenks Consultants
³0 1 2
Miles
Path:
Z:\P
rojec
ts\Tw
entyn
inePa
lms\E
vents
\2012
0822
_Map
s\Figu
re1-1
Site M
ap.m
xd
LegendCity Boundary
Service Area Boundary


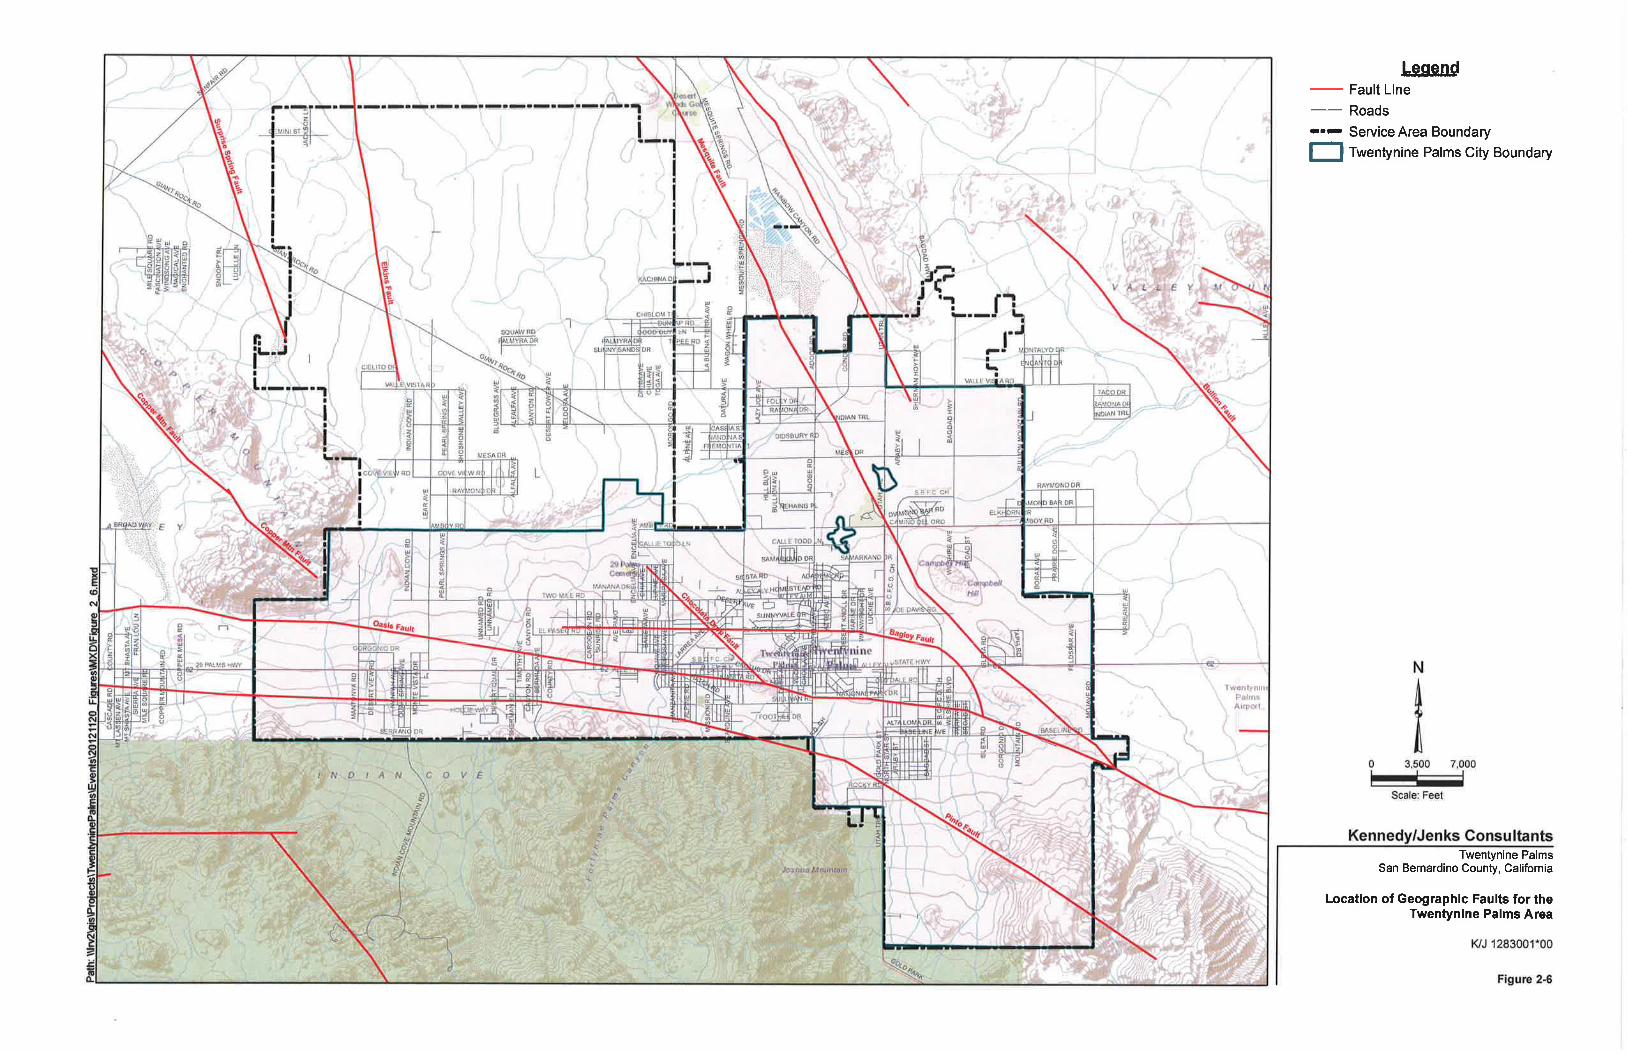


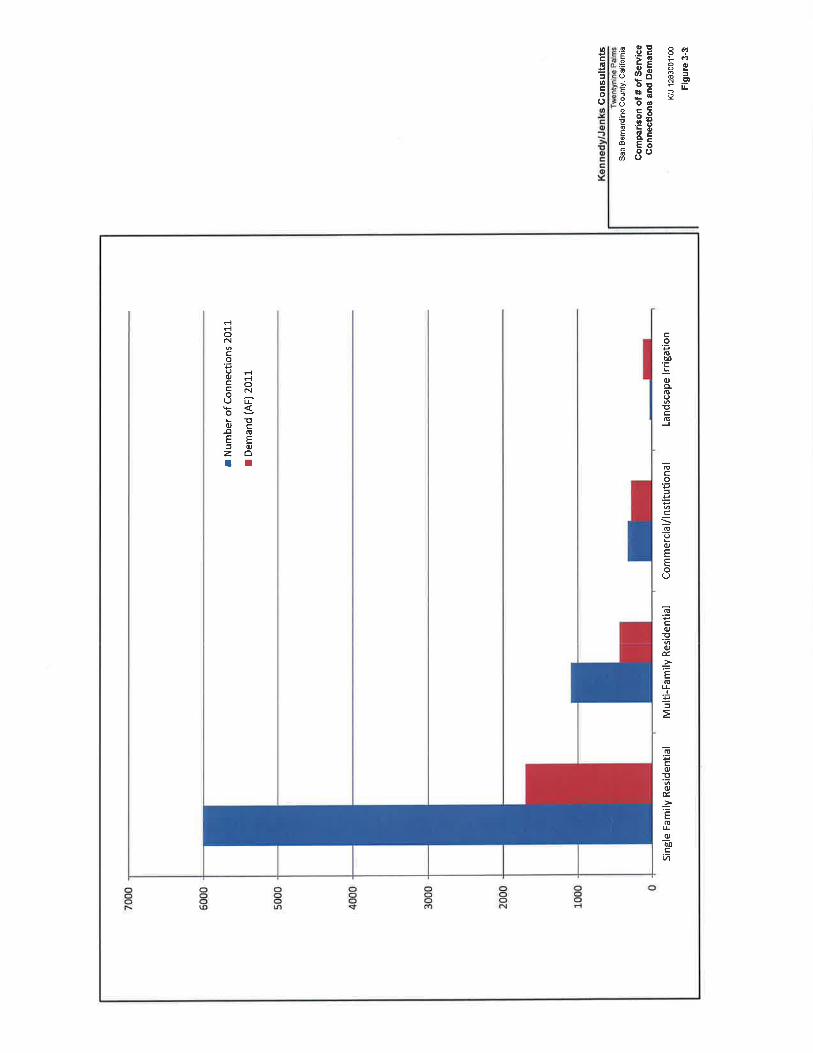

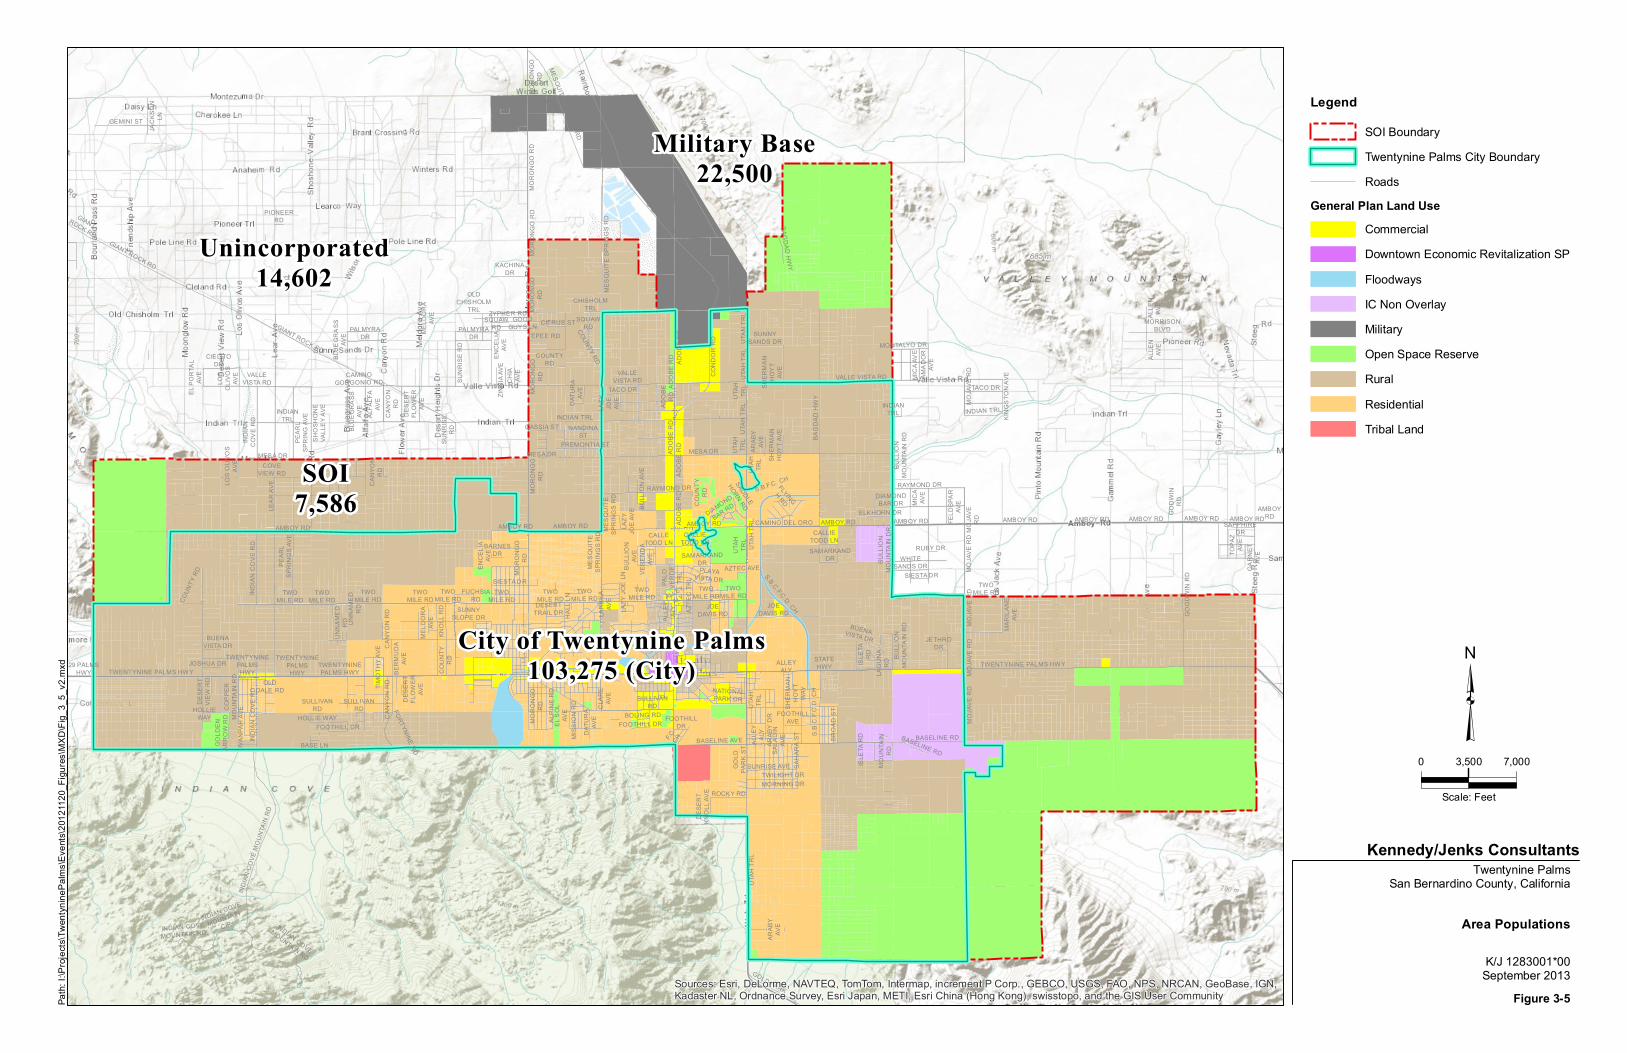
Unincorporated14,602
Military Base22,500
SOI7,586
City of Twentynine Palms103,275 (City)
INDIAN TRL
SULLIVANRD
PALO
VERD
ETR
L
MORNING DR
ALPI
NE R
D
FOOTHILLDR
BASELINE RDBASELINE AVE
CITRUS ST
CAMINO DEL ORO
LAZY
JOE
LN
TWOMILE RD
VALLEVISTA RD
MESA DR
INDIANTRL
SHER
MAN
HOYT
WAY
ARAB
Y DR
ARAB
YAV
E
MESA DR
ALLE
YAL
Y
COUN
TYRD
TACO DRVALLE
VISTA RD
GIANT ROCK RD
HOLLIEWAY
CHISHOLMTRL
KACHINADR
SUNR
ISE
RD
TWOMILE RD
INDIAN COVE
MOUNTAINCIR
ISLE
TARD
BUENAVISTA DR
UNNA
MED
RD
BERM
UDA
AVE
COUN
TYRD
HALL
LN
AMBOY RD
SADDLE
HORN RD
SHER
MAN
HOYT
AVE
S.B.F.C. CH
FORTYNINE RD
ADOD
E RD
GOLD
PARK
ST
LAGU
NARD
RAINBOW CANYON RD
UTAH
TRL
DIAMOND
BAR RDBULL
ION
AVE
GIANT ROCK RD
EL S
OLAV
E
KNOL
L RD
ARAB
YAV
E
INDI
AN C
OVE
RD
PEAR
LSP
RING
S AVE
GEMINI ST
ALLEYALY
RAYMOND DR
INDIAN TRL
GIANTROCK RD
AZTE
C TR
L
INDIAN COVE
MOUNTAIN RD
UTAH
TRL
LARR
EAAV
E
NATIONALPARK DR
SUNR
ISE
RD
ALLE
NAV
E
TWENTYNINE PALMS HWY
MORO
NGO
RD
INDIAN COVEMOUNTAIN RD
CLAR
EAV
E
STATEHWY
UTAN
TRL
ENCE
LIAAV
E
MARI
LANE
AVE
DESE
RTKN
OLL A
VE
MORRISONBLVD
SULLIVANRD
AMBOY RD AMBOY RD
WHITESANDS DR
UTAH
TRL
COUN
TY R
D
GOOD
WIN
RD
MESQ
UITE
SPRI
NGS
RD
PALMYRADR
BULL
ION
MOUN
TAIN
RD
29 PALMSHWY
BUENAVISTA DR
SQUAWRD
JETHRODR
ENCE
LIAAV
E
UTAH
TRL
PALMYRADR
BASE LN
DESERTTRAIL DR
TWOMILE RD
SHOS
HONE
VALL
EY AV
E
CALLIETODD LN
CAMINOGORGONIO RD
SIESTA DR
JOEDAVIS RD
ALLEYALY
SALA
DIN
AVE
ALLE
YAL
Y
S.B.C.F.C.D. CH
AMBOY RD
HOLLIE WAY
MOJA
VE R
D
KING
STON
AVE
BAGDAD HWY
DESE
RTFL
OWER
AVE
BAGD
AD H
WY
GOLD PARK
BASELINE RD
VERE
NDA
AVE
TWOMILE RD
SUNRISE AVE
MELD
ORA
AVE
OLDDALE RD
ALLE
NAV
E
BLUE
GRAS
SAV
E
PIONEERRD
TWOMILE RD
MONTALYO DR
SULLIVANRD
MESQ
UITE
SPR
INGS
RD
DESE
RTVI
EW R
DGO
LDEN
ARRO
W R
D
INDIANTRL
S.B.
C.F.C
.D. C
H
FOOTHILL DR MOJA
VE R
D
LAZY JOE
AVE
JACK
SON
LN
MOJA
VERDAMBOY RD
COUNTY RD
SHER
MAN
HOYT
AVE
MOJA
VE R
D
UNNA
MED
RD
ADOB
E RD
MELD
ORA
AVE
RUBY DR
ADOB
E RD
DESE
RTFL
OWER
AVE
OLDCHISHOLM
TRL ZYPHER RD
ZINNI
A AVE
GOODGUYS LN
UTAH TRL
SQUAWRD
CIELITODR
CANY
ON R
D
BLUE
GRAS
SAV
E
TWOMILE RD
MORO
NGO
RDCALLIE
TODD LN
ELKHORN DR
DIAMONDBAR DR
JOEDAVIS RD
CANY
ONRD
CALLETODD LN
TWOMILE RD
MESA DR
TWOMILE RD
TWILIGHT DR
ROCKY RD
BROA
D ST
CASSIA ST
AZTEC AVEPLAYAVISTA DRFUCHSIA
RD
BARNESDR
COND
OR R
DFOOTHILL DR
BOLING RD
IVANP
AH AV
EIND
IAN C
OVE M
OUNT
AIN R
D
SAHA
RA S
T
MICA
AVE
AMAD
ORAV
E
GARN
ETAV
ETOPA
ZAV
E
MESQ
UITE
SPRI
NGS
RD
LAZY
JOE A
VE
MOJA
VE R
D
ISLE
TA R
D
SAMARKANDDR
MISS
ION
RDDA
TURA
AVE
INDI
AN C
OVE
RD
MORO
NGO
RDMO
RONG
ORD
TWENTYNINEPALMS HWY
NANDINAST
FREMONTIA ST
TWOMILE RD
TWOMILE RD
TWOMILE RD
SAPPHIREDR
BULL
ION
MOUN
TAIN
DR
MICA AVE
FELD
SPAR
AVE
DATU
RAAV
E
LEAR
AVE
MOJA
VE R
D
BULL
ION
AVE
RAYMOND DR
ADOB
E RD
CANY
ON R
D
SUNNYSANDS DR
COUNTYRD
COVEVIEW RD
TIMOT
HY AV
E
UTAH TRL
UTAH TRL
TWENTYNINEPALMSHWYTWENTYNINE PALMS HWY
CHIA
AVE
TWENTYNINEPALMSHWY
SIESTA DR
JOSHUA DR
MOUN
TAIN
RD
MORO
NGO
RDSAMARKAND
DR
TWOMILE RD
INDI
ANCO
VE R
D
LOS
OLIV
OSAV
E
FOOTHILLAVE
LOS
OLIV
OSAV
E
EL PO
RTAL
AVE
SUNNYSLOPE DR
MORO
NGO
RD
FLYING
H RD
TEPEE RD
F.C.
CH
BULL
ION
MOUN
TAIN
RD
AMBOY RD
ADOB
ERD
AMBOYRD
VALLE VISTA RD
AMBOY RD AMBOY RD
UTAH TRL
GODW
INRD
AMBOY RD
COPP
ERMO
UNTA
IN R
D
ADOB
E RD
UTAH TRL
MORO
NGO
RDMO
RONG
O RD
AMBOY RD
PEAR
LSP
RING
AVE AL
FALF
AAV
ECA
NYON
RD
AMBOY RD
TACO DR
MESQUITE SPRINGS RD
Sources: Esri, DeLorme, NAVTEQ, TomTom, Intermap, increment P Corp., GEBCO, USGS, FAO, NPS, NRCAN, GeoBase, IGN,Kadaster NL, Ordnance Survey, Esri Japan, METI, Esri China (Hong Kong), swisstopo, and the GIS User Community
Twentynine PalmsSan Bernardino County, California
Area Populations
K/J 1283001*00September 2013
Figure 3-5
Kennedy/Jenks Consultants
³0 7,0003,500
Scale: Feet
Path:
I:\Pr
ojects
\Twen
tynine
Palm
s\Eve
nts\20
1211
20_F
igures
\MXD
\Fig_
3_5_
v2.m
xd
LegendSOI BoundaryTwentynine Palms City BoundaryRoads
General Plan Land UseCommercialDowntown Economic Revitalization SPFloodwaysIC Non OverlayMilitaryOpen Space ReserveRuralResidentialTribal Land


Appendix A
Wastewater Flow Calculations

Page 18/24/2012 version
Twentynine Palms - Population, Water Usage, and Sewer Loading Assumptions
Ref. No. Current - 2010 2035 Projections Build-out Comments and Data Sources
1 Population 18,795 30,931 102,963
2010 Population: UWMP 2010 (within the District service area)2035 Population: UWMP 2010 (within the District service area). Population outside of the District service area (approx. 1,385 acres) is unknown, but sewer loading (approx 19 AFY) was estimated for this area and accounted for in the total sewer loading. Build-out population = Total City build-out population - Marine Base population + Unincorporated population (adjusted) + SOI population outside of City boundary City's build-out = 103,275 (Source: City Staff- Matt McCleary email to K/J ); Marine Base population = 22,500 (Source: City of 29 Palms General Plan 2010); Total unincorporated area population = 1,7,253 (Source: Population calcs using the San Bernardino County land use map); Adjusted unincorporated area population = 14,602. SOI population (total) = 7,586 (City of 29 Palms General Plan 2010, Table LU-18). The total SOI population was distributed 1) within the unincorporated area within District boundary (1,887) and 2) the remaining SOI outside of City's boundary (5,699).
2 Residential - Includes single family and multi-family residential
3 Total residential acreage - within and outside District 29,862 35,010 66,756 Total residential acreage within and outside of the District service area, including the City's SOI.
4 Residential acreage within District 28,477 33,624 51,471
2010: Based on GIS analysis of current land use using aerial mapping and digitizing. 2035: Residential acreages were projected proportional to the increase in sewer loading from 2010 to 2035 relative to the total build-out sewer loading. Assumed population growth and residential land use expansion to occur within the District service area only and the residential land use outside of District to remain the same as in 2010.Build-out: Based on the City of 29 Palms General Plan land use dated Dec 22 2011.
5 Residential acreage outside of District 1,385 1,385 15,286
Sewer loading estimates below are for the areas within the District boundary but accounts for a small area of 1,385 outside of the District for 2010 and 2035 but includes the City's SOI residential land use for the build-out. 2010: Based on the current conditions, a small area of residential falls outside of the District service area (1,385 acres), but within the groundwater subbasins. 2035: Assumed the areas outside of the District service boundary (i.e., 1,385 acres) remains the same as in 2010.Build-out: Approx. 15,286 acres is outside of District, but within the City and City's SOI, based on the GIS map of the General Plan land use map (dated Dec 22, 2011).
6 Water usage (ccf) 926,307 1,388,587 4,622,323
2010: Based on current water usage records consistent with UWMP.2035: Based on the 2035 population projection, reported in the UWMP and the estimated 73.5 gpcd of sewer loading (or 92 gpcd of water usage). Build-out: Estimated based on the population and 92 gpcd. Assumed the water usage and indoor water usage to remain the same as in 2035 conditions at 73.5 gpcd. Since the build-out population includes the City's SOI population, residential water usage and sewer loading accounts for areas within the City's SOI.
7 Water usage (gal/day) 1,898,295 2,845,652 9,472,596 Calculated total residential water usage in units of gallons per day.
8 Water Usage (AFY) 2,126 3,188 10,611 Calculated total residential water usage in units of acre-feet per year.
9 Water Usage (gal/day/person) 101 92 92
2010: Calculated based on the population and water usage within District service area.2035: Calculated based on the population projection and water usage within District service area.Build-out: Assumed the same water usage per capita as in 2035 conditions.
Note: High-Desert WD has 102 gpcd based on 2007 water use data, based on an average of 2.5 persons per household.
10 Water to sewer factor 0.8 0.8 0.8
2010: Based on historical water usage data (both annual and winter), UWMP, W&K, and Hi-Desert MP.2035: Assumed water to sewer rate to remain the same as historical data.Build-out: Assumed water to sewer rate to remain the same as historical data.
Note: Yucca Valley septic nitrogen loading calculations assumed 83% water to sewer factor.High-Desert WD used 80% in its sewer master plan (MWH, 2009).
11Indoor water use (gal/day/person) (sewer loading) 80.00 73.50 73.5
2010: Estimated based on the UWMP water usage data, 2010 population, and 80% water to sewer conversion.2035: Estimated based on the 73.5 gpcd sewer loading rate, the 2035 population projection, and 80% water to sewer conversion. the 73.5 gpcd sewer loading corresponds to 92 gpcd water usage, based on the 80% water to sewer conversion.Build-out: Assumed the same sewer loading rate as in 2035.
Note: High-Desert WD has 82 gpcd of sewer flow (MWH, 2009).
12 Sewer loading (gal/day) (total) 1,518,636 2,276,522 7,578,077
14 Within District 1,501,645 2,259,530
15 Outside District 16,991 16,99116 Sewer loading (AFY) (total) 1,720 2,569 8,488
18 Within District 1,701 2,550
19 Outside District 19 1920 Sewer loading (gal/day/acre) 51 65 114 Calculated as total sewer loading in units of gallons per day divided by total acreages of the build-out.21 Sewer loading (AFY/acre) 0.06 0.07 0.13 Calculated as total sewer loading in acre-feet per year divided by total acreages of the build-out.
Assumed sewer loading to be 80% of water usage, in units of gallons per day.
7,578,0772010: Includes sewer loading within and outside of the District.2035: includes sewer loading within and outside of the DistrictBuild-out: Includes sewer loading within the District, the City and City's SOI.Assumed sewer loading to be 80% of water usage, in units of acre-feet per year.
8,488
2010: Includes sewer loading within and outside of the District.2035: Includes sewer loading within and outside of the DistrictBuild-out: Includes sewer loading within the District, the City and City's SOI.

Page 28/24/2012 version
Twentynine Palms - Population, Water Usage, and Sewer Loading Assumptions
Ref. No. Current - 2010 2035 Projections Build-out Comments and Data Sources22
23 Water usage (ccf) 122,547 247,682 1,136,28824 Water usage (gal/day) 251,137 507,579 2,328,61325 Water usage (AFY) 278 561 2,608
26 Water to sewer factor 0.8 0.8 0.8
2010: Based on historical water usage data (both annual and winter).2035: Assumed water to sewer rate to remain the same as historical data.Build-out: Assumed water to sewer rate to remain the same as historical data.
Note: High-Desert WD estimated wastewater flow at commercial land use as 80 % of water use (MWH, 2009).27 Sewer loading (AFY) (total) 222 449 2,087 Total non-residential sewer loading within the District and outside of the District, but within the City's SOI.
28 Non-residential (high density) 131 264 840
29 Non-residential (low density) 44 89 858
30 Within District 44 89 753
31 Outside District 0 0 10432 Institutional/Industrial 48 96 38933 Within District 48 96 26634 Outside District 0 0 12335 Acreage (total) 385 778 4,312
36 Non-residential (high density) (within District) 130 262 833
37 Non-residential (low density) 123 248 2,393
38 Within District 123 248 2,102
39 Outside District 0 0 291
40 Institutional/Industrial 133 268 1,086
41 Within District 133 268 742
42 Outside District 0 0 34443 Sewer loading (gal/day/acre)
44 Non-residential (high density) 900 900 900
45 Non-residential (low density) 320 320 320
46 Institutional/Industrial 320 320 32047 Sewer loading (AFY/acre)48 Non-residential (high density) 1.0 1.0 1.049 Non-residential (low density) 0.4 0.4 0.450 Institutional/Industrial 0.4 0.4 0.451 Sewer loading residential and non-residential (AFY) 1,942 3,018 10,575 Calculated as total sewer loading from residential and non-residential.
52 Within District 1,923 2,999
53 Outside District 19 1954 Loading from the Mainside WWTP evaporation ponds 0.0 0.0 0.0 Assumed zero loading, based on the review of previous studies and reports (RWQCB Region 7, WDR Order # R7-2002-0006)
10,5752010: Includes sewer loading within and outside of the District.2035: Includes sewer loading within and outside of the DistrictBuild-out: Includes sewer loading within the District, the City and City's SOI.
Non-Residential - Includes commercial, institutions, and industrial. No industrial water usage reported in the UWMP for the 2010 and 2035 conditions, but the General Plan build-out land use includes industrial land use.
2010: Based on current water usage data, consistent with UWMP.2035: Based on the 2010 UWMP (Table 2-4). Build-out: Calculated based on acreages with the same sewer loading rate as in 2010 and 2035.
2010: Assumed higher water usage and sewer loading for high density commercial and lower water usage and sewer loading for low density, institutional, and industrial. To account for the total loading of 222 AFY from the entire comm acres of 385, the lower loading rate of 320 gal/day/acre was used for the lower density comm/inst.2035: Acres of non-residential estimated for 2035 multiplied by the same sewer rate (gal/day/acre). Build-out loading: Acres from the build-out land use multiplied by the same sewer rate (gal/day/acre). Build-out includes areas of non-residential outside of the District to account for the City's SOI.
Non-residential broken down to higher and lower density and other institutional and industrial.
2010: Based on GIS analysis of current land use using aerial mapping and digitizing.2035: Acreages were projected to increase proportional to the increase in water usage and resulting sewer loading. Build-out: Based on the City of 29 Palms General Plan. General Plan shows 1,472 acres of community industrial within District and 280 acres of community industrial outside of the District compared to no industrial water usage in 2010 and 2035 based on the UWMP. In the absence of historical water use data for industrial, assumed sewer loading of 320 gal/day/acre for community industrial, similar to the rate used for the lower density commercial. For the build-out, industrial and institutional acreages (and also sewer loading) are shown together.
2010: Sewer loading was calculated based on the sewer loading for each sub-non-residential areas divided by the corresponding acreages. Assumed the same loading rate (gal/day/acre) for 2035 and build-out.Note reference commercial loading rates from other studies: Assumed the high density comm. (non-residential) loading is set to 900 gal/day/acre as the average of the High-Desert (800 gal/day/acre) and USGS (1000 gal/day/acre) value (current and Build-out) used for the Yucca Valley. High-Desert : 800 gal/day/acre. For Yucca Valley, USGS assumed 1,000 gal/day/acre for the septic N loading calculations based on a previous study (Linsley and Franzini, 1979).
Calculated as total sewer loading in acre-feet per year divided by total acreages.

Appendix B
CIP Cost Estimates

OPINION OF PROBABLE CONSTRUCTION COST KENNEDY/JENKS CONSULTANTS
Project: City of Twenty Nine Palms Wastewater Master Plan Prepared By: JLHDate Prepared: Sep-12
Building, Area: Sewer Gravity and Force Mains K/J Proj. No. 1283001*00
Current at ENREstimate Type: Conceptual Construction Escalated to ENR
Preliminary (w/o plans) Change Order Months to Midpoint of Construct
Design Development @ __________ % CompleteSpec. Item Materials Sub-contractor $/LF Incl $ Total Incl Comments
Section No. Description Qty Units $/Unit Total $/Unit Total $/Unit Total Sub-Total Markups MarkupsFORCEMAIN SEWER Pipes in Streets
Remove Paving 2,067 SY 7 14,467 14,467 6' wide, 6" thickTrenching: Excav., backfill & load spoil, compaction, remove excess spoil
3,100 LF 6.19 19,189 19,189 2' wide, 6' deep 0:1
Bedding 3,100 LF 1.60 4,960 0.81 2,511 7,471 2' wide 0:1 Trench Boxes (2) 16 DY 330.00 5,115 5,115 200 LF/DAY6" HDPE Pipe 3,100 LF 9.15 28,365 5.91 18,321 46,686 Means6" Plug Valve 2 EA 3,600.00 7,200 300.00 600 7,800 1 at each end of the linePaving 2,067 SY 75 155,000 155,000 6' wide, 6" thick1" Combination Ari/Vac Valve 2 EA 1,250.00 2,500 300.00 600 3,100 Every 1500'Traffic Control 16 DY 240.00 3,720 1,450.00 22,475 26,195
SUBTOTAL 46,745 68,811 169,467 285,023 203$ 628,410$ Remove Paving 3,200 SY 7 22,400 22,400 6' wide, 6" thickTrenching: Excav., backfill & load spoil, compaction, remove excess spoil
4,800 LF 6.19 29,712 29,712 2' wide, 6' deep 0:1
Bedding 4,800 LF 3.46 16,608 1.76 8,448 25,056 2' wide 0:1 Trench Boxes (2) 24 DY 330.00 7,920 7,920 200 LF/DAY8" HDPE Pipe 4,800 LF 12.50 60,000 7.00 33,600 93,600 Means8" Plug Valve 2 EA 4,200.00 8,400 350.00 700 9,100 1 at each end of the linePaving 3,200 SY 75 240,000 240,000 6' wide, 6" thick1" Combination Ari/Vac Valve 3 EA 1,250.00 3,750 350.00 1,050 4,800 Every 1500'Traffic Control 24 DY 240.00 5,760 1,450.00 34,800 40,560
SUBTOTAL 94,518 116,230 262,400 473,148 218$ 1,045,633$ Remove Paving 2,267 SY 7 15,867 15,867 6' wide, 6" thickTrenching: Excav., backfill & load spoil, compaction, remove excess spoil
3,400 LF 6.19 21,046 21,046 2' wide, 6' deep 0:1
Bedding 3,400 LF 3.53 12,002 1.80 6,120 18,122 2' wide 0:1 Trench Boxes (2) 23 DY 330.00 7,480 7,480 150 LF/DAY10" HDPE Pipe 3,400 LF 19.75 67,150 7.49 25,466 92,616 Means10" Plug Valve 2 EA 5,500.00 11,000 400.00 800 11,800 1 at each end of the linePaving 2,267 SY 75 170,000 170,000 6' wide, 6" thick1" Combination Ari/Vac Valve 2 EA 1,250.00 2,500 400.00 800 3,300 Every 1500'Traffic Control 23 DY 240.00 5,440 1,450.00 32,867 38,307
SUBTOTAL 98,092 94,579 185,867 378,537 247$ 839,803$ Remove Paving 2,600 SY 7 18,200 18,200 6' wide, 6" thickTrenching: Excav., backfill & load spoil, compaction, remove excess spoil
3,900 LF 6.19 24,141 24,141 2' wide, 6' deep 0:1
Bedding 3,900 LF 3.61 14,079 1.83 7,137 21,216 2' wide 0:1 Trench Boxes (2) 26 DY 330.00 8,580 8,580 150 LF/DAY
Installation
X
Sewer and PSta Estimates_Final.xlsPipe Estimate Page 1 of 4 Date Printed: 4/2/2013

Spec. Item Materials Sub-contractor $/LF Incl $ Total Incl CommentsSection No. Description Qty Units $/Unit Total $/Unit Total $/Unit Total Sub-Total Markups Markups
Installation
12" HDPE Pipe 3,900 LF 31.00 120,900 8.62 33,618 154,518 Means12" Plug Valve 4 EA 7,200.00 28,080 450.00 1,755 29,835 1 at each end of the linePaving 2,600 SY 75 195,000 195,000 6' wide, 6" thick1" Combination Ari/Vac Valve 3 EA 1,250.00 3,750 450.00 1,350 5,100 Every 1500'Traffic Control 26 DY 240.00 6,240 1,450.00 37,700 43,940
SUBTOTAL 173,049 114,281 213,200 500,530 286$ 1,116,727$ Remove Paving 14,267 SY 7 99,867 99,867 6' wide, 6" thickTrenching: Excav., backfill & load spoil, compaction, remove excess spoil
21,400 LF 13.37 286,118 286,118 4' wide, 6' deep 0:1
Bedding 21,400 LF 6.10 130,540 3.09 66,126 196,666 2' wide 0:1 Trench Boxes (2) 178 DY 330.00 58,850 58,850 120 LF/DAY18" HDPE Pipe 21,400 LF 46.50 995,100 19.10 408,740 1,403,840 Means18" Valve 21 EA 12,600.00 269,640 800.00 17,120 286,760 1 at each end of the linePaving 14,267 SY 75 1,070,000 1,070,000 6' wide, 6" thick2" Combination Ari/Vac Valve 14 EA 2,500.00 35,000 600.00 8,400 43,400 Every 1500'Traffic Control 178 DY 240.00 42,800 1,450.00 258,583 301,383
SUBTOTAL 1,473,080 1,103,937 1,169,867 3,746,884 392$ 8,385,365$ Remove Paving 1,156 SY 7 8,089 8,089 8' wide, 6" thickTrenching: Excav., backfill & load spoil, compaction, remove excess spoil
1,300 LF 18.70 24,310 24,310 4' wide, 8' deep 0:1
Bedding 1,300 LF 9.05 11,765 4.60 5,980 17,745 2' wide 0:1 Trench Boxes (2) 13 DY 330.00 4,290 4,290 100 LF/DAY30" HDPE Pipe 1,300 LF 90.00 117,000 38.75 50,375 167,375 Means30" Valve 1 EA 18,000.00 23,400 1,000.00 1,300 24,700 1 at each end of the linePaving 1,156 SY 75 86,667 86,667 8' wide, 6" thick2" Combination Ari/Vac Valve 1 EA 2,500.00 2,500 750.00 750 3,250 Every 1500'Traffic Control 13 DY 240.00 3,120 1,450.00 18,850 21,970
SUBTOTAL 157,785 105,855 94,756 358,396 619$ 804,519$ GRAVITY SEWER PIPES in Streets
Remove Paving 4,800 SY 7 33,600 33,600 6' wide, 6" thickTrenching: Excav., backfill & load spoil, compaction, remove excess spoil
7,200 LF 6.19 44,568 44,568 2' wide, 6' deep 0:1
Bedding 7,200 LF 3.53 25,416 1.80 12,960 38,376 2' wide 0:1 Trench Boxes (2) 36 DY 330.00 11,880 11,880 200 LF/DAY10" PVC Sewer Pipe 7,200 LF 12.70 91,440 3.83 27,576 119,016 MeansManholes 4' ID/ 6' deep 14 EA 2,025.00 29,160 1,675.00 24,120 53,280 every 500'Paving 4,800 SY 75 360,000 360,000 6' wide, 6" thickTraffic Control 36 DY 200.00 7,200 1,200.00 43,200 50,400
SUBTOTAL 153,216 164,304 393,600 711,120 218$ 1,573,156$ Remove Paving 13,667 SY 7 95,667 95,667 6' wide, 6" thickTrenching: Excav., backfill & load spoil, compaction, remove excess spoil
20,500 LF 13.37 274,085 274,085 4' wide, 6' deep 0:1
Bedding 20,500 LF 5.90 120,950 3.00 61,500 182,450 3' wide 0:1 Trench Boxes (2) 137 DY 330.00 45,100 45,100 150 LF/DAY15" PVC Sewer Pipe 20,500 LF 15.15 310,575 5.27 108,035 418,610 MeansManholes 4' ID/ 6' deep 51 EA 2,025.00 103,781 1,675.00 85,844 189,625 every 500'Paving 13,667 SY 75 1,025,000 1,025,000 6' wide, 6" thickTraffic Control 137 DY 200.00 27,333 1,200.00 164,000 191,333
SUBTOTAL 562,640 738,564 1,120,667 2,421,870 262$ 5,363,628$
Sewer and PSta Estimates_Final.xlsPipe Estimate Page 2 of 4 Date Printed: 4/2/2013

Spec. Item Materials Sub-contractor $/LF Incl $ Total Incl CommentsSection No. Description Qty Units $/Unit Total $/Unit Total $/Unit Total Sub-Total Markups Markups
Installation
Remove Paving 19,000 SY 7 133,000 133,000 6' wide, 6" thickTrenching: Excav., backfill & load spoil, compaction, remove excess spoil
28,500 LF 18.70 532,950 532,950 4' wide, 8' deep 0:1
Bedding 28,500 LF 6.10 173,850 3.09 88,065 261,915 3' wide 0:1 Trench Boxes (2) 190 DY 330.00 62,700 62,700 150 LF/DAY18" PVC Sewer Pipe 28,500 LF 17.35 494,475 6.31 179,835 674,310 MeansManholes 4' ID/ 6' deep 71 EA 2,025.00 144,281 1,675.00 119,344 263,625 every 500'Paving 19,000 SY 75 1,425,000 1,425,000 6' wide, 6" thickTraffic Control 190 DY 200.00 38,000 1,200.00 228,000 266,000
SUBTOTAL 850,606 1,210,894 1,558,000 3,619,500 281$ 8,017,387$ Remove Paving 21,267 SY 7 148,867 148,867 6' wide, 6" thickTrenching: Excav., backfill & load spoil, compaction, remove excess spoil
31,900 LF 18.70 596,530 596,530 4' wide, 8' deep 0:1
Bedding 31,900 LF 8.90 283,910 4.52 144,188 428,098 4' wide 0:1 Trench Boxes (2) 266 DY 330.00 87,725 87,725 120 LF/DAY24" PVC Sewer Pipe 31,900 LF 31.00 988,900 7.04 224,576 1,213,476 MeansManholes 5' ID/ 8' deep 80 EA 4,250.00 338,938 2,600.00 207,350 546,288 every 500'Paving 21,267 SY 75 1,595,000 1,595,000 6' wide, 6" thickTraffic Control 266 DY 200.00 53,167 1,200.00 319,000 372,167
SUBTOTAL 1,664,914 1,579,369 1,743,867 4,988,150 349$ 11,120,372$ Remove Paving 3,733 SY 7 26,133 26,133 8' wide, 6" thickTrenching: Excav., backfill & load spoil, compaction, remove excess spoil
4,200 LF 29.80 125,160 125,160 6' wide, 8' deep 0:1
Bedding 4,200 LF 15.90 66,780 8.05 33,810 100,590 6' wide 0:1 Trench Boxes (2) 58 DY 330.00 19,250 19,250 72 LF/DAY36" RCP w/ PVC lining 4,200 LF 99.00 415,800 39.20 164,640 580,440 MeansManholes 6' ID/ 8' deep 11 EA 5,225.00 54,863 3,400.00 35,700 90,563 every 500'Paving 3,733 SY 75 280,000 280,000 8' wide, 6" thickTraffic Control 58 DY 200.00 11,667 1,200.00 70,000 81,667
SUBTOTAL 549,109 448,560 306,133 1,303,803 696$ 2,923,143$ Remove Paving 4,356 SY 7 30,489 30,489 8' wide, 6" thickTrenching: Excav., backfill & load spoil, compaction, remove excess spoil
4,900 LF 30.25 148,225 148,225 6' wide, 10' deep 0:1
Bedding 4,900 LF 20.00 98,000 14.50 71,050 169,050 6' wide 0:1 Trench Boxes (2) 82 DY 330.00 26,950 26,950 60 LF/DAY42" RCP w/ PVC lining 4,900 LF 140.00 686,000 48.20 236,180 922,180 MeansManholes 6' ID/ 10' deep 12 EA 6,600.00 80,850 4,325.00 52,981 133,831 every 500'Paving 4,356 SY 75 326,667 326,667 8' wide, 6" thickTraffic Control 82 DY 200.00 16,333 1,200.00 98,000 114,333
SUBTOTAL 881,183 633,386 357,156 1,871,725 859$ 4,209,887$
Subtotals 13,414,643 12,762,215 15,160,962 17,525,820 46,050,675Markups Applied:Location Factor 6.1%Div 1, Mob,Demob, B&I 10%Sales Tax on Materials 7.75%OH&P 15%
Sewer and PSta Estimates_Final.xlsPipe Estimate Page 3 of 4 Date Printed: 4/2/2013

OPINION OF PROBABLE CONSTRUCTION COST KENNEDY/JENKS CONSULTANTS
Project: City of Twenty Nine Palms Wastewater Master Plan Prepared By: JAJDate Prepared: Oct-12
Building, Area: Pump Stations K/J Proj. No. 1283001*00
Current at ENREstimate Type: Conceptual Construction Escalated to ENR
Preliminary (w/o plans) Change Order Months to Midpoint of Construct
Design Development @ _________ % CompleteSpec. Item Materials Sub-contractorNo. No. Description Qty Units $/Unit Total $/Unit Total $/Unit Total Total
Submersible Pump Stations 1 1,173,874 782,582.54 782,583 1,956,456Wet Well-Dry Well Pump Stations 1 5,120,282 3,413,521.49 3,413,521 8,533,804
Subtotals 6294156.04 4196104.03 10,490,260 Division 1 Costs @ 10% 629415.60 419610.40 1,049,026 Subtotals 6923571.64 4615714.43 11,539,286 Taxes - Materials Costs @ 7.75% 536576.80 536,577 Subtotals 7460148.44 4615714.43 12,075,863 Taxes - Labor Costs @ 5.00% 230785.72 230,786 Subtotals 7460148.44 4846500.15 12,306,649 Contractor Markup for Sub @ 12% - Subtotals 7460148.44 4846500.15 12,306,649 Contractor OH&P @ 15% 1119022.27 726975.02 1,845,997 Subtotals 8579170.71 5573475.17 14,152,646 Estimate Contingency @ 50% 7,076,323 Subtotals 21,228,969 Escalate to Midpoint of Construct @ 2% - Estimated Bid Cost 21,228,969 Total Estimate 21,228,970
* See Pump Station Estimation sheet for more detailed calculations* Assumed 60% of construction costs allocated to materials* Contingency raised from 30% to 50% due to lack of detailed design criteria and to account for land acquisition costs +50% -30%
+50% Total Est. -30%$31,843,455 $21,228,970 $14,860,279
Installation
Estimate Accuracy
Estimated Range of Probable Cost
X
Sewer and PSta Estimates_Final.xlsPump Estimate 2 Page 1 of 1 Date Printed 4/2/2013

OPINION OF PROBABLE CONSTRUCTION COST KENNEDY/JENKS CONSULTANTS
Project: City of Twenty Nine Palms Sewer Master Plan Prepared By: JLHDate Prepared: 5-Sep-12
Building, Area: Sewer Collectors, Gravity K/J Proj. No. 1283001*00
Current at ENREstimate Type: Conceptual Construction Escalated to ENR
Preliminary (w/o plans) Change Order Months to Midpoint of Construct
Design Development @ % Complete
Spec. Item Materials Sub-contractor $/LF Incl $ Total Incl SourceSection No. Description Qty Units $/Unit Total $/Unit Total $/Unit Total Total Markups Markups
GRAVITY SEWER PIPES in StreetsRemove Paving 177,760 SY 7 1,244,320 1,244,320 6' wide, 6" thickTrenching: Excav., backfill & load spoil, compaction, remove excess spoil
533,280 LF 6.19 3,301,003 3,301,003 2' wide, 6' deep 0:1
Bedding 533,280 LF 3.53 1,882,478 1.80 959,904 2,842,382 2' wide 0:1 8" PVC Sewer Pipe 533,280 LF 7.85 4,186,248 2.81 1,498,517 5,684,765 MeansManholes 4' ID/ 6' deep 1,067 EA 2,025.00 2,159,784 1,675.00 1,786,488 3,946,272 every 500'Paving 177,760 SY 75 13,332,000 13,332,000 3' wide, 6" thickTraffic Control 1,778 DY 200.00 355,520 1,200.00 2,133,120 2,488,640 300' per day
SUBTOTAL 8,584,030 9,679,032 14,576,320 32,839,382Subtotals 17,168,061 19,358,064 29,152,640 137$ 72,866,497$
Markups Applied:Location Factor 6.1%Div 1, Mob,Demob, B&I 10%Sales Tax on Materials 7.75%O&HP 15%Engineering /Construction Management 25%Contingency 30%
Assumes no dewatering, utility interferences, native backfill. Escalation not included.
Installation
Assumed 80 miles of PL inside the city and 21 miles of PL outside (101 total miles)
X
Sewer and PSta Estimates_Final.xlsBy Area_Collectors Page 1 of 1 Date Printed: 4/2/2013

Appendix C
Twentynine Palms Parcel Size Map