Embed Size (px)
Citation preview
Tweed Valley Flood Study2009 Update
G:\ADMIN\B16765.G.SAW_TWEED_FS_UPDATE\R.B16765.001.01 FLOOD STUDY.DOC
Tweed Valley Flood Study
2009 Update
Prepared For: Tweed Shire Council
Prepared By: BMT WBM Pty Ltd (Member of the BMT group of companies)
OfficesBrisbaneDenver
KarrathaMelbourne
MorwellNewcastle
PerthSydney
Vancouver

G:\ADMIN\B16765.G.SAW_TWEED_FS_UPDATE\R.B16765.001.01 FLOOD STUDY.DOC
DOCUMENT CONTROL SHEET
Document :
Project Manager :
R.B16765.001.01 Flood Study.doc
Sharon Wallace
BMT WBM Pty LtdBMT WBM Pty Ltd Level 11, 490 Upper Edward Street Brisbane 4000 Queensland Australia PO Box 203 Spring Hill 4004
Tel: +61 7 3831 6744 Fax: + 61 7 3832 3627
ABN 54 010 830 421
www.wbmpl.com.au Client :
Client Contact:
Client Reference
Tweed Shire Council
Danny Rose / Ian Dinham
Title : Tweed Valley Flood Study
Author : Sharon Wallace / Cathie Barton / Greg Rogencamp / Carrie Dearnley
Synopsis : A flood study based on WBNM hydrologic model and TUFLOW 2D hydraulic model has been undertaken for the Tweed River from Murwillumbah to the Tweed River Entrance. This report is an update to the original 2005 Flood Study.
REVISION/CHECKING HISTORY
REVISION NUMBER
DATE OF ISSUE CHECKED BY ISSUED BY
0 10/02/09 DRAFT SAW
1 19/10/09 BMC SAW
DISTRIBUTION
DESTINATION REVISION 0 1 2 3
Tweed Shire Council
DECC
BMT WBM File
BMT WBM Library
PDF + 1
PDF + 1
PDF + 1
PDF + 10
PDF + 1
PDF + 1
FOREWORD I
G:\ADMIN\B16765.G.SAW_TWEED_FS_UPDATE\R.B16765.001.01 FLOOD STUDY.DOC
FOREWORD
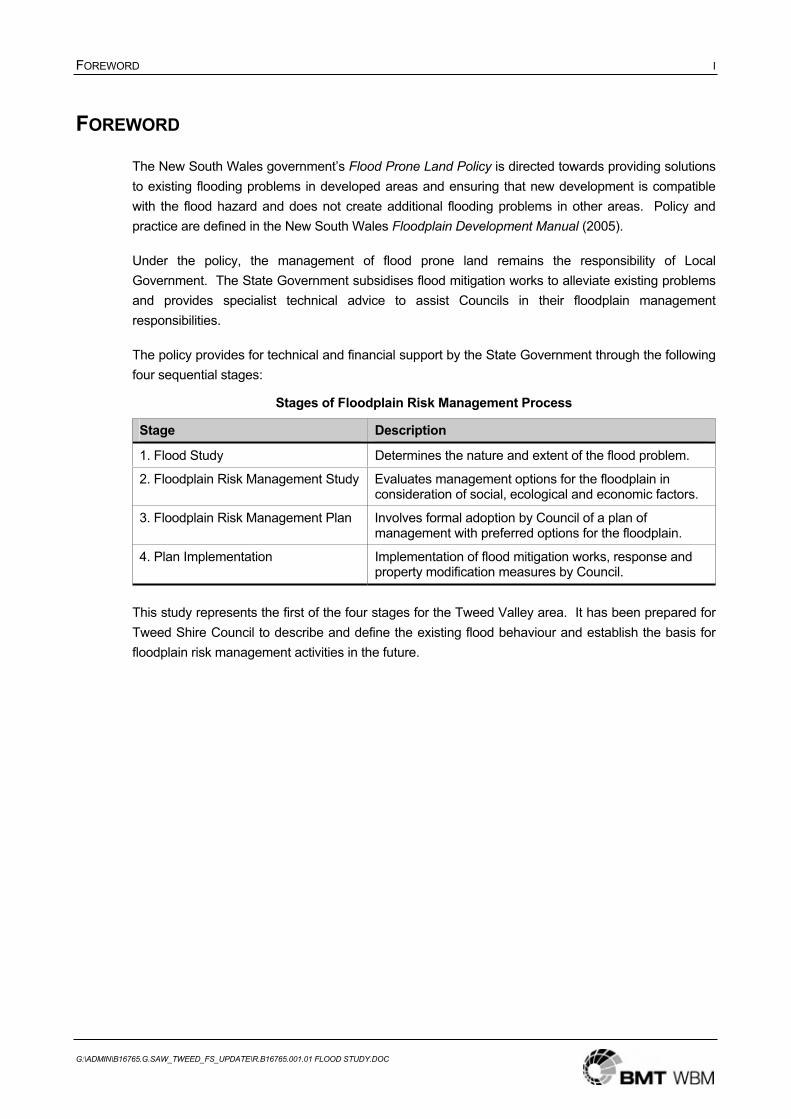
The New South Wales government’s Flood Prone Land Policy is directed towards providing solutions to existing flooding problems in developed areas and ensuring that new development is compatible with the flood hazard and does not create additional flooding problems in other areas. Policy and practice are defined in the New South Wales Floodplain Development Manual (2005).
Under the policy, the management of flood prone land remains the responsibility of Local Government. The State Government subsidises flood mitigation works to alleviate existing problems and provides specialist technical advice to assist Councils in their floodplain management responsibilities.
The policy provides for technical and financial support by the State Government through the following four sequential stages:
Stages of Floodplain Risk Management Process
Stage Description
1. Flood Study Determines the nature and extent of the flood problem.
2. Floodplain Risk Management Study Evaluates management options for the floodplain in consideration of social, ecological and economic factors.
3. Floodplain Risk Management Plan Involves formal adoption by Council of a plan of management with preferred options for the floodplain.
4. Plan Implementation Implementation of flood mitigation works, response and property modification measures by Council.
This study represents the first of the four stages for the Tweed Valley area. It has been prepared for Tweed Shire Council to describe and define the existing flood behaviour and establish the basis for floodplain risk management activities in the future.

EXECUTIVE SUMMARY II
G:\ADMIN\B16765.G.SAW_TWEED_FS_UPDATE\R.B16765.001.01 FLOOD STUDY.DOC
EXECUTIVE SUMMARY
Tweed Shire Council was one of the first Councils in New South Wales to undertake flood studies for the purposes of defining planning controls and determining the impact of potential filling and development. This Tweed Valley Flood Study is the first key stage in the floodplain risk management process as outlined in the New South Wales Floodplain Development Manual. The key outputs of the study, including a 2D hydrodynamic model and design flood levels, depths, velocities and flows across the floodplain, will form the basis for identifying and assessing floodplain management options as part of the subsequent Tweed Valley Floodplain Risk Management Study and Plan.
The main arm of the Tweed River flows for approximately 50 km in a general north-easterly direction through the towns of Murwillumbah (about 28 km upstream) and Tweed Heads (at the mouth) and past the villages of Condong, Tumbulgum, Chinderah and Fingal. The catchment comprises approximately 1100 km2 with the main tributaries including Oxley River, Rous River, Dunbible Creek and the Terranora and Cobaki Broadwaters. The river flows to the sea immediately south of Point Danger, close to the border with Queensland.
The study area covers approximately 230 km2 of the floodplain, including the Tweed River downstream of Byangum, the Rous River downstream of Boat Harbour, and the lower reaches of the Broadwater tributaries. The valley comprises a wide floodplain of alluvial sediments contained by higher ground of bedrock.
The townships of Murwillumbah, Condong, Tumbulgum, Chinderah, Tweed Heads and Tweed Heads South have frequently experienced inundation from floodwaters. The February 1954 flood, the largest flood on record, caused major inundation in all flood prone regions. Severe flooding was experienced in the areas downstream of Chinderah due to a combination of the ocean storm tide, a congested entrance, and flooding from catchment runoff.
A system of levees currently protects the main townships of Murwillumbah and Tweed Heads South from the more frequent floods. Other flood mitigation measures such as the installation of floodgates on creeks and farm drains, the raising of the natural levee bank in some areas, and the construction of drainage systems have also been undertaken.
Numerous flood studies were undertaken throughout the catchment from the late 1970s onwards, based on 1D hydraulic modelling of flood behaviour. In 2005, the first edition of the Tweed Valley Flood Study was published, which was the first study to incorporate fully 2D hydraulic modelling of the entire floodplain from Murwillumbah to Tweed Heads. This 2009 update of the Tweed Valley Flood Study was undertaken primarily to incorporate much improved catchment topography (based on 2007 ALS data). The opportunity was also taken to update both the hydrologic and hydraulic models to reflect advances in methodology and model development in the intervening four year period.
A DEM was developed for the whole catchment based on the new ALS data together with bathymetric data from the previous 2005 Flood Study. WBNM hydrologic and TUFLOW hydraulic models were developed and jointly calibrated to the March 1974 flood, and verified against the March 1978 and April 1989 floods. The models were then used to simulate a range of design events for existing catchment conditions. The 5, 20, 100 and 500 year ARI, together with an ‘extreme’ and PMF event, were simulated for a 36 hour duration storm (the critical storm duration for the Tweed River at

EXECUTIVE SUMMARY III
G:\ADMIN\B16765.G.SAW_TWEED_FS_UPDATE\R.B16765.001.01 FLOOD STUDY.DOC
Murwillumbah). Catchment inflows and runoff were combined with downstream ocean and storm surge levels adopted in consultation with DECC. The 100 year ARI design flood for the catchment was adopted based on the maximum ‘envelope’ of two scenarios:
5 year ARI rainfall + 100 year ARI storm surge; and
100 year ARI rainfall + 20 year ARI storm surge.
Both digital and hard copy maps have been generated of modelled flood levels, depths, velocities and flows across the range of design events for the future purposes of floodplain management and development planning.

CONTENTS IV
G:\ADMIN\B16765.G.SAW_TWEED_FS_UPDATE\R.B16765.001.01 FLOOD STUDY.DOC
CONTENTS
Foreword iExecutive Summary iiContents ivList of Figures viiList of Tables ixGlossary xAbbreviations xiii
1 INTRODUCTION 1-1
1.1 Study Location 1-11.2 Background 1-11.3 Floodplain Management 1-31.4 Objective 1-41.5 Methodology 1-41.6 Catchment Description 1-61.7 Flood Behaviour 1-7
1.7.1 Bray Park / Murwillumbah 1-7
1.7.2 Chinderah Village 1-7
1.7.3 Tweed Heads South / Banora Point 1-7
2 DATA COLLECTION 2-1
2.1 Previous Studies 2-12.1.1 Tweed Valley Flood Study (WBM, 2005) 2-1
2.1.2 Other Studies 2-1
2.2 Topographic Data 2-22.2.1 ALS Data 2-2
2.2.2 Levees 2-2
2.2.3 Anecdotal Data 2-4
2.3 Bathymetric Data 2-42.3.1 TRESBP – 2000 & 2002 2-4
2.3.2 PWD – 1979 2-4
2.4 Hydraulic Structures 2-42.5 Calibration Data 2-4
CONTENTS V
G:\ADMIN\B16765.G.SAW_TWEED_FS_UPDATE\R.B16765.001.01 FLOOD STUDY.DOC
3 MODEL DEVELOPMENT 3-1
3.1 Introduction 3-13.2 Hydrologic Model 3-3
3.2.1 Background 3-3
3.2.2 WBNM Model 3-33.2.2.1 Lag Parameter 3-3
3.2.2.2 Losses 3-4
3.3 Hydraulic Model 3-43.3.1 Background 3-4
3.3.2 TUFLOW Model 3-4
3.3.3 Model Geometry 3-53.3.3.1 Bed Scour and Dune Breach (PMF) 3-5
3.3.4 Land Use 3-8
3.3.5 Historical Conditions 3-8
3.3.6 Boundaries 3-8
4 HISTORICAL FLOODS 4-1
4.1 Calibration and Verification Process 4-14.2 March 1974 4-1
4.2.1 Recorded and Modelled Data 4-1
4.2.2 Discussion 4-11
4.3 March 1978 4-124.3.1 Recorded and Modelled Data 4-12
4.3.2 Discussion 4-12
4.4 April 1989 4-224.4.1 Recorded and Modelled Data 4-22
4.4.2 Discussion 4-22
5 DESIGN FLOODS 5-1
5.1 Introduction 5-15.2 Rainfall 5-2
5.2.1 Medium to Large Floods 5-25.2.1.1 Rainfall Depths 5-2
5.2.1.2 Temporal Distribution 5-3
5.2.1.3 Spatial Distribution 5-3
5.2.2 Rare to Extreme Floods 5-3
5.2.3 Probable Maximum Flood 5-5
CONTENTS VI
G:\ADMIN\B16765.G.SAW_TWEED_FS_UPDATE\R.B16765.001.01 FLOOD STUDY.DOC
5.2.3.1 Rainfall Depths 5-5
5.2.3.2 Temporal Distribution 5-5
5.2.3.3 Spatial Distribution 5-5
5.3 Inflows 5-65.4 Ocean Levels 5-7
6 DESIGN FLOOD BEHAVIOUR 6-1
6.1 Interpretation of Results 6-16.1.1 General Issues 6-1
6.1.2 Uncertainty 6-1
6.1.3 Definition of ‘Peak’ 6-1
6.2 Reporting Locations 6-26.3 Flood Profiles 6-26.4 Floodplain Mapping 6-26.5 Flood Behaviour 6-34
6.5.1 Murwillumbah 6-34
6.5.2 South Murwillumbah 6-34
6.5.3 Condong 6-34
6.5.4 Tumbulgum 6-34
6.5.5 Chinderah 6-35
6.5.6 West Kingscliff 6-35
6.5.7 Fingal Head 6-35
6.5.8 Banora Point 6-35
6.5.9 Tweed Heads South 6-35
6.5.10 Tweed Heads 6-36
6.5.11 Tweed Heads West 6-36
6.5.12 Cobaki 6-36
6.5.13 General Tweed 6-36
6.6 Comparison with Historical Floods 6-376.7 1954 Flood Event 6-406.8 Flood Frequency Analysis 6-41
7 REFERENCES 7-1
APPENDIX A: FLOOD FREQUENCY ANALYSIS A-1
APPENDIX B: KEY CHANGES FROM 2005 FLOOD STUDY B-1

LIST OF FIGURES VII
G:\ADMIN\B16765.G.SAW_TWEED_FS_UPDATE\R.B16765.001.01 FLOOD STUDY.DOC
LIST OF FIGURES
Figure 1-1 Tweed River and Surrounds 1-2
Figure 1-2 Study Approach 1-5
Figure 2-1 Tweed Catchment DEM 2-3
Figure 3-1 Hydraulic Model Development Process 3-2
Figure 3-2 TUFLOW Hydraulic Model Geometry 3-6
Figure 3-3 Dune Break and Bed Scour Locations 3-7
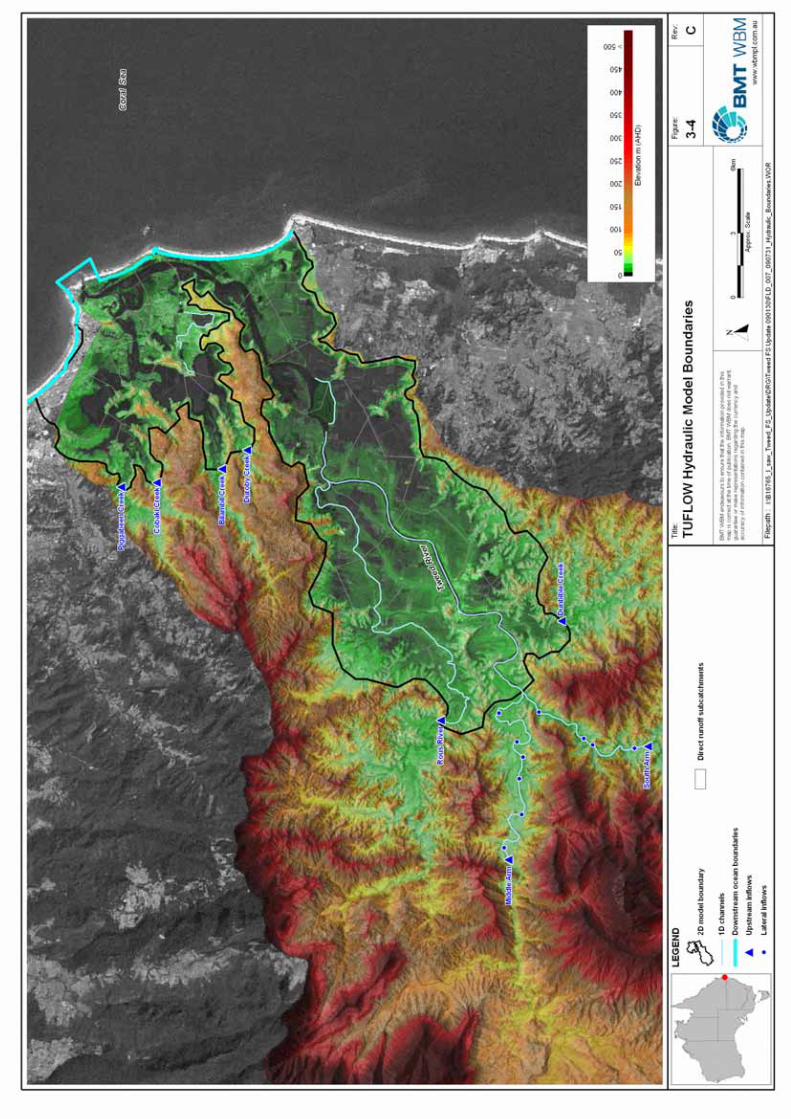
Figure 3-4 TUFLOW Hydraulic Model Boundaries 3-10
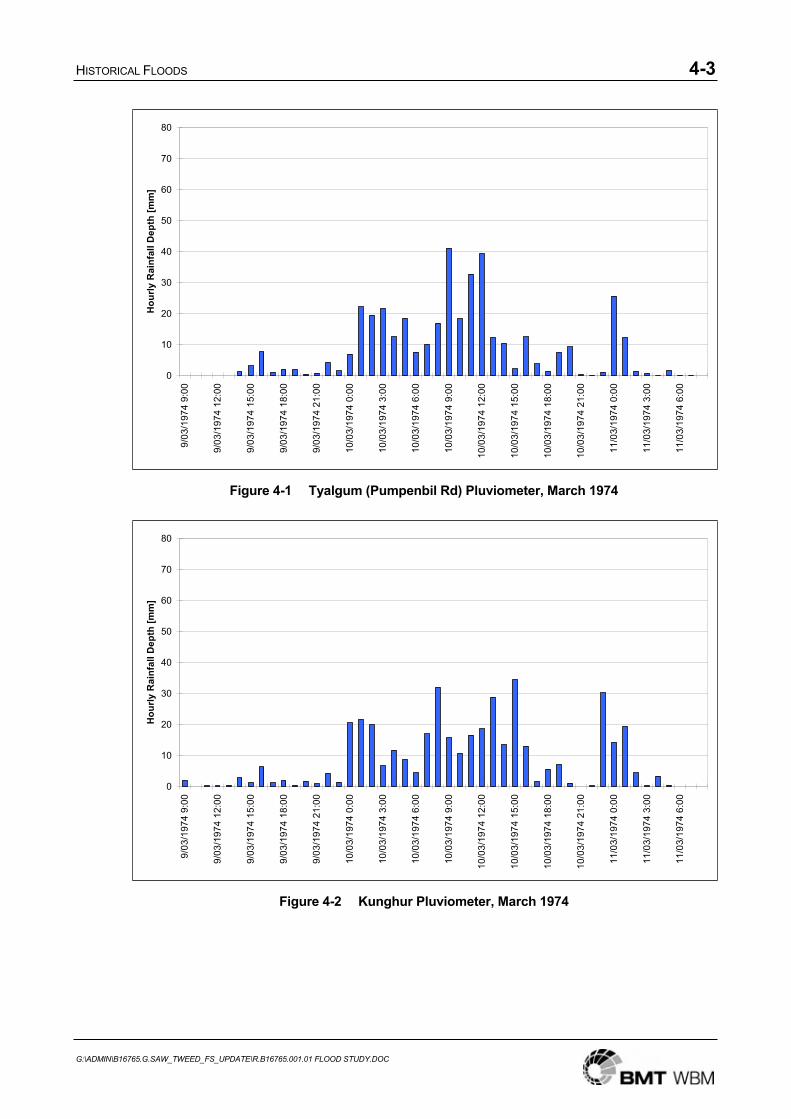
Figure 4-1 Tyalgum (Pumpenbil Rd) Pluviometer, March 1974 4-3
Figure 4-2 Kunghur Pluviometer, March 1974 4-3
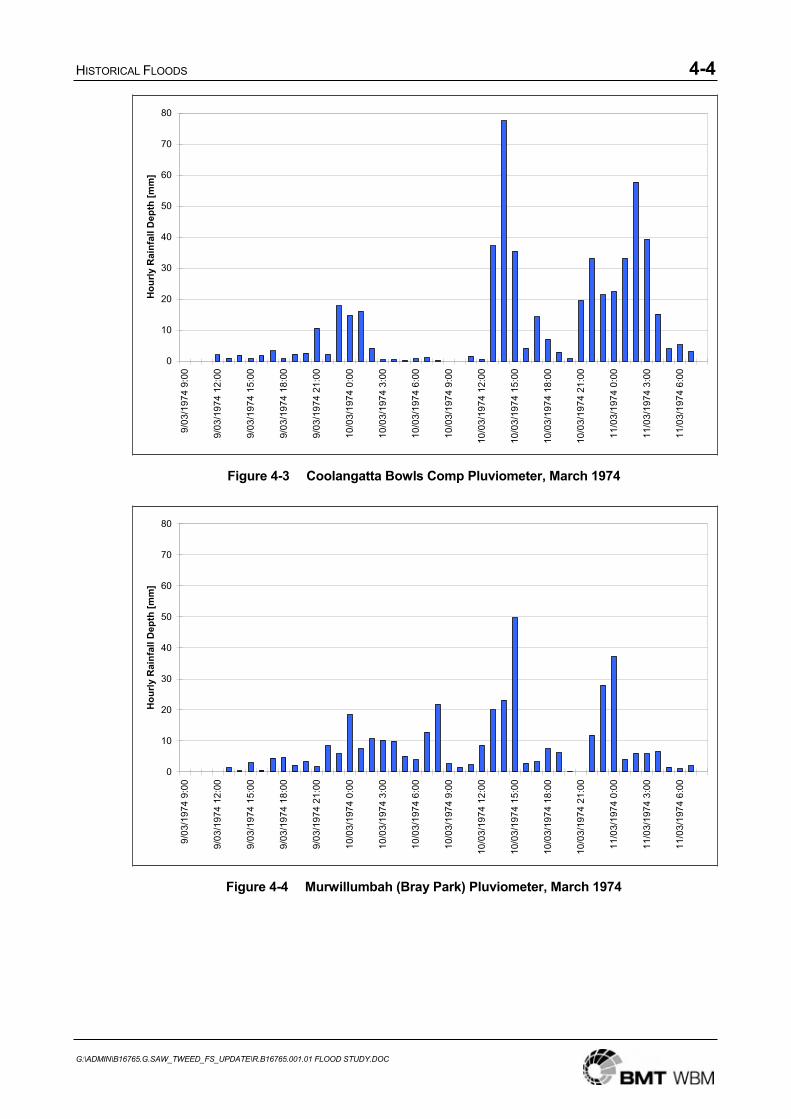
Figure 4-3 Coolangatta Bowls Comp Pluviometer, March 1974 4-4
Figure 4-4 Murwillumbah (Bray Park) Pluviometer, March 1974 4-4
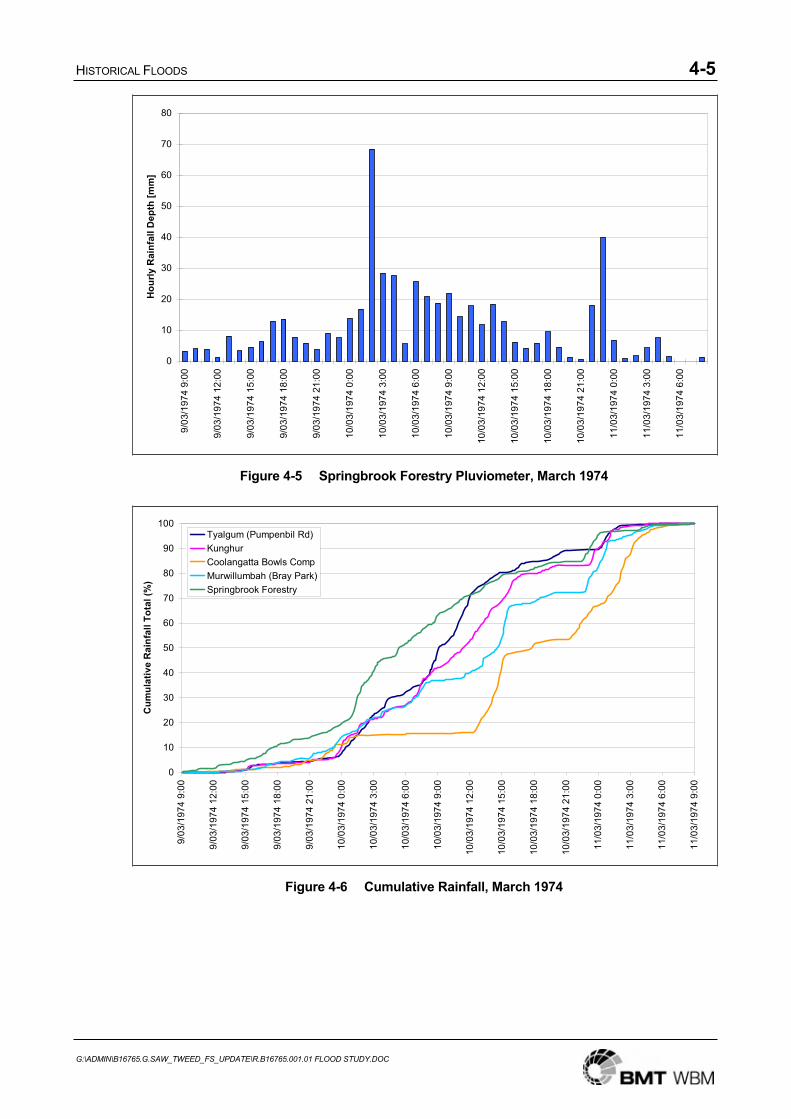
Figure 4-5 Springbrook Forestry Pluviometer, March 1974 4-5
Figure 4-6 Cumulative Rainfall, March 1974 4-5
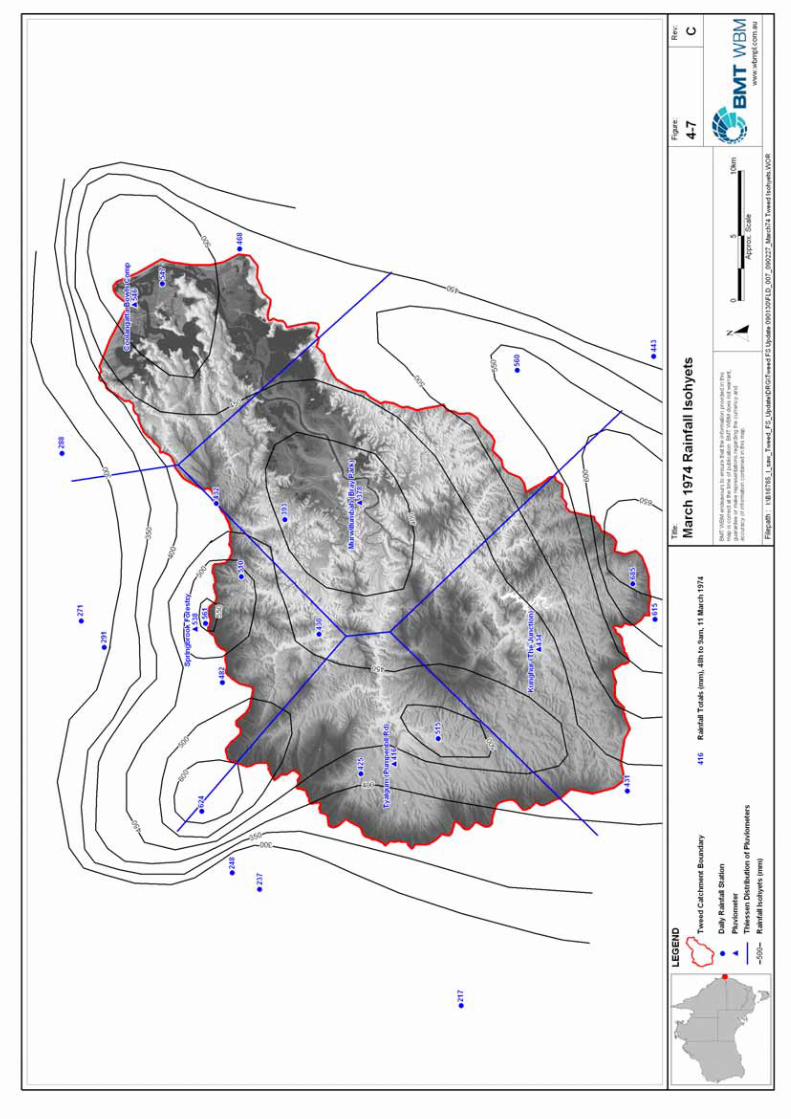
Figure 4-7 March 1974 Rainfall Isohyets 4-6
Figure 4-8 Modelled Hydrographs, Lower Tweed, March 1974 4-7
Figure 4-9 Modelled Hydrographs, Upper Tweed, March 1974 4-7
Figure 4-10 Recorded and Modelled Flood Levels, March 1974 4-8
Figure 4-11 Recorded and Modelled Flood Levels, Murwillumbah, March 1974 4-9
Figure 4-12 Recorded and Modelled Flood Levels, Chinderah, March 1974 4-10
Figure 4-13 Coolangatta Bowls Comp Pluviometer, March 1978 4-14
Figure 4-14 Murwillumbah (Bray Park) Pluviometer, March 1978 4-14
Figure 4-15 Springbrook Forestry Pluviometer, March 1978 4-15
Figure 4-16 Tyalgum (Pumpenbil Rd) Pluviometer, March 1978 4-15
Figure 4-17 Kunghur Pluviometer, March 1978 4-16
Figure 4-18 Eungella Pluviometer, March 1978 4-16
Figure 4-19 Cumulative Totals, March 1978 4-17
Figure 4-20 March 1978 Rainfall Isohyets 4-18
Figure 4-21 Modelled Hydrographs, Lower Tweed, March 1978 4-19
Figure 4-22 Modelled Hydrographs, Upper Tweed, March 1978 4-19
Figure 4-23 Recorded and Modelled Flood Levels, Upper Tweed, March 1978 4-20
Figure 4-24 Recorded and Modelled Flood Levels, Lower Tweed, March 1978 4-21
Figure 4-25 Tyalgum (Pumpenbil Rd) Pluviometer, April 1989 4-24
Figure 4-26 Green Pigeon Pluviometer, April 1989 4-24
Figure 4-27 Kunghur Pluviometer, April 1989 4-25
Figure 4-28 Elanora Water Treat Pluviometer, April 1989 4-25
Figure 4-29 Murwillumbah (Bray Park) Pluviometer, April 1989 4-26
Figure 4-30 Springbrook Forestry Pluviometer, April 1989 4-26
Figure 4-31 Eungella Pluviometer, April 1989 4-27
LIST OF FIGURES VIII
G:\ADMIN\B16765.G.SAW_TWEED_FS_UPDATE\R.B16765.001.01 FLOOD STUDY.DOC
Figure 4-32 Cumulative Totals, April 1989 4-27
Figure 4-33 April 1989 Rainfall Isohyets 4-28
Figure 4-34 Modelled Hydrographs, Lower Tweed, April 1989 4-29
Figure 4-35 Modelled Hydrographs, Upper Tweed, April 1989 4-29
Figure 4-36 Recorded and Modelled Flood Levels, Upper Tweed, April 1989 4-30
Figure 4-37 Recorded and Modelled Flood Levels, Lower Tweed, April 1989 4-31
Figure 5-1 100 Year ARI Design Rainfall Isohyets 5-4
Figure 5-2 Design Rainfall Depths, 36 Hour Storm 5-5
Figure 5-3 PMP Temporal Distribution, 36 Hour Storm 5-6
Figure 6-1 Reporting Locations 6-4
Figure 6-2 Flood Level Profiles and Chainages 6-5
Figure 6-3 Design Flood Profile, Tweed River 6-6
Figure 6-4 Design Flood Profile, Rous River 6-7
Figure 6-5 Design Flood Levels - 5 Year ARI 6-8
Figure 6-6 Design Flood Levels - 20 Year ARI 6-9
Figure 6-7 Design Flood Levels - 100 Year ARI 6-10
Figure 6-8 Design Flood Levels - 100 Year ARI - Murwillumbah 6-11
Figure 6-9 Design Flood Levels - 100 Year ARI - Mid River 6-12
Figure 6-10 Design Flood Levels - 100 Year ARI - Chinderah / Kingscliff 6-13
Figure 6-11 Design Flood Levels - 100 Year ARI - Lower Tweed 6-14
Figure 6-12 Design Flood Levels - 500 Year ARI 6-15
Figure 6-13 Design Flood Levels - Extreme Event 6-16
Figure 6-14 Design Flood Levels - PMF 6-17
Figure 6-15 Design Flood Depths - 5 Year ARI 6-18
Figure 6-16 Design Flood Depths - 20 Year ARI 6-19
Figure 6-17 Design Flood Depths - 100 Year ARI 6-20
Figure 6-18 Design Flood Depths - 500 Year ARI 6-21
Figure 6-19 Design Flood Depths - Extreme Event 6-22
Figure 6-20 Design Flood Depths - PMF 6-23
Figure 6-21 Design Flood Velocity-Depth Product - 5 Year ARI 6-24
Figure 6-22 Design Flood Velocity-Depth Product - 20 Year ARI 6-25
Figure 6-23 Design Flood Velocity-Depth Product - 100 Year ARI 6-26
Figure 6-24 Design Flood Velocity-Depth Product - 100 Year ARI - Murwillumbah 6-27
Figure 6-25 Design Flood Velocity-Depth Product - 100 Year ARI - Mid River 6-28
Figure 6-26 Design Flood Velocity-Depth Product - 100 Year ARI - Chinderah / Kingscliff 6-29
Figure 6-27 Design Flood Velocity-Depth Product - 100 Year ARI - Lower Tweed 6-30
Figure 6-28 Design Flood Velocity-Depth Product - 500 Year ARI 6-31
Figure 6-29 Design Flood Velocity-Depth Product - Extreme Event 6-32
Figure 6-30 Design Flood Velocity-Depth Product - PMF 6-33

LIST OF TABLES IX
G:\ADMIN\B16765.G.SAW_TWEED_FS_UPDATE\R.B16765.001.01 FLOOD STUDY.DOC
Figure 6-31 Design and Historical Flood Profiles for the Tweed River 6-38
Figure 6-32 Design and Historical Flood Profiles for the Rous River 6-39
Figure 6-33 Murwillumbah 1954 6-40
Figure 6-34 Chinderah 1954 6-40
Figure A-1 Rating Curves A-5
Figure A-2 Flood Frequency Analysis results A-8
Figure B-1 Change in 100 Year ARI Design Flood Levels B-3
Figure B-2 Change in PMF Design Flood Levels B-4
LIST OF TABLES
Table 2-1 Levee Data Summary 2-2
Table 3-1 WBNM Model Parameters 3-3
Table 3-2 Dune Breach Parameters 3-5
Table 3-3 Adopted Manning’s ‘n’ Values 3-8
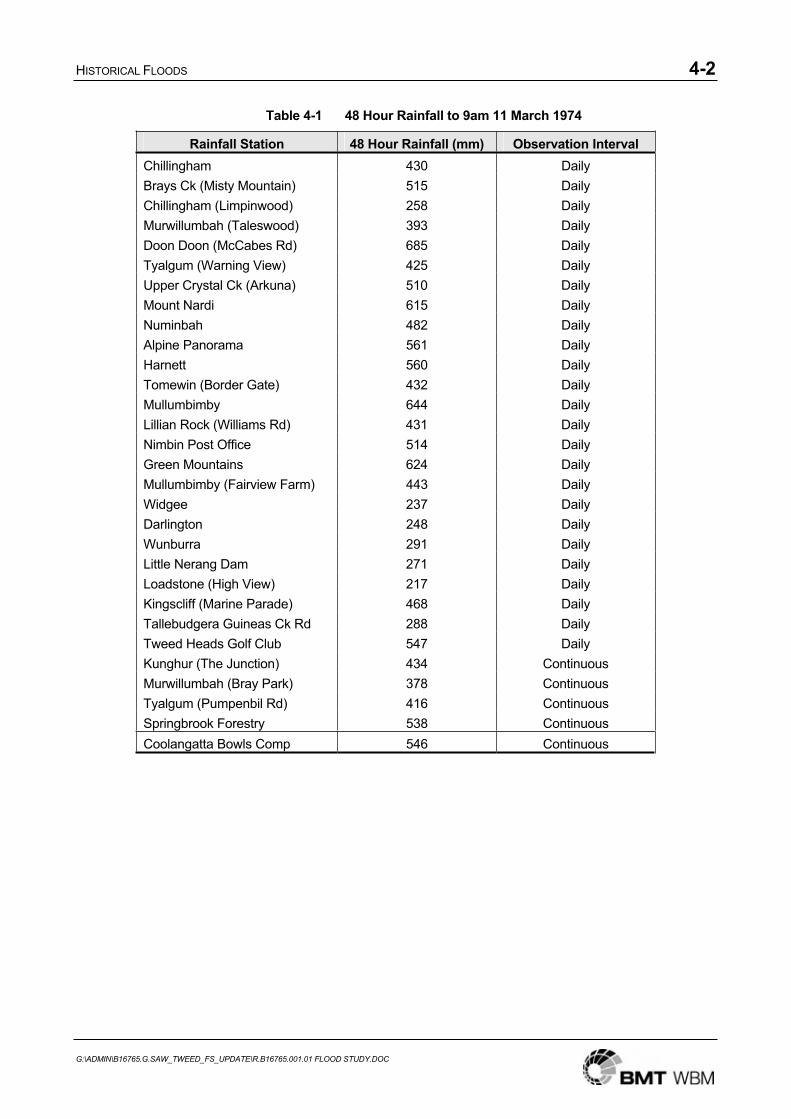
Table 4-1 48 Hour Rainfall to 9am 11 March 1974 4-2
Table 4-2 48 Hour Rainfall to 9am 19 March 1978 4-13
Table 4-3 72 Hour Rainfall to 9am 3 April 1989 4-23
Table 5-1 Terminology for Design Flood Events 5-1
Table 5-2 Catchment Average Design Rainfall Depths 5-2
Table 5-3 Design Rainfall Depths 5-3
Table 5-4 Peak Design Inflows 5-6
Table 5-5 Peak Storm Surge Levels 5-7
Table 5-6 Design Combination of Rainfall and Storm Surge Events 5-7
Table 6-1 Peak Design Flood Levels at Selected Locations 6-3
Table 6-2 Peak Design Flood Flows at Selected Locations 6-3
Table A-1 Gauge Level Classifications Provided by Council / DIPNR A-1
Table A-2 Historical Flood Record Compilation for the Tweed River, Murwillumbah Gauge A-2
Table A-3 Calculated Flows from Derived Rating Curve A-6
Table A-4 Comparison of FFA results: 1982 study to current study A-8
Table A-5 FFA 100y Flow Results A-8
Table A-6 HydroFreq results (Assigned Gap Flow Q = 880 m3/s) A-9
Table A-7 Cunnane Plotting Position for the 1954 Flood for Various Periods of Data A-10
Table A-8 Cunnane Plotting Position for the 1954 Flood for Various Periods of Data A-10

GLOSSARY X
G:\ADMIN\B16765.G.SAW_TWEED_FS_UPDATE\R.B16765.001.01 FLOOD STUDY.DOC
GLOSSARYAnnual Exceedance Probability (AEP)
The chance of a flood of a given size (or larger) occurring in any one year, usually expressed as a percentage. For example, if a peak flood discharge of 500 m3/s has an AEP of 5%, it means that there is a 5% chance (i.e. a 1 in 20 chance) of a peak discharge of 500 m3/s (or larger) occurring in any one year (see also Average Recurrence Interval).
Australian Height Datum (AHD)
Common national survey datum corresponding approximately to mean sea level.
Average Recurrence Interval (ARI)
The long-term average number of years between the occurrence of a flood as big as (or larger than) the selected event. For example, floods with a discharge as great as (or greater than) the 20yr ARI design flood will occur on average once every 20 years. ARI is another way of expressing the likelihood of occurrence of a flood event (see also Annual Exceedance Probability).
Catchment The area of land draining through the main stream (as well as tributary streams) to a particular site. It always relates to an area upstream of a specific location.
Depth The height or the elevation of floodwaters above ground level (in metres). Not to be confused with water level, which is the height of the water relative to a datum (not ground level).
Design flood A hypothetical flood representing a specific likelihood of occurrence (for example the 100 year ARI or 1% AEP flood).
Flood Relatively high river, creek, estuary, lake or dam flows, which overtop the natural or artificial banks, and inundate floodplains, and/or local overland flooding associated with drainage before entering a watercourse, and/or coastal inundation resulting from super elevated sea levels and/or waves overtopping coastline defences excluding tsunami.
Flood behaviour The pattern, characteristics and nature of a flood.
Flood fringe areas Flood prone land that is not designated as floodway or flood storage areas.
Flood level The height or elevation of floodwaters relative to a datum (typically the Australian Height Datum). Also referred to as “stage”.
Flood liable land Land susceptible to flooding by the PMF event (see also Flood Prone Land). Flood liable land covers the whole floodplain, not just that part below the flood planning levels.
Flood Planning Levels (FPL) Combination of flood levels derived from historical flood events or floods of specific AEPs plus freeboard selected for floodplain risk management purposes, as determined in management studies and incorporated in floodplain risk management plans. Selection of these levels should be based on an understanding of the full range of flood behaviour and the associated flood risk. It should also take into account the social, economic and ecological consequences associated with floods of different severities. Different FPLs may be appropriate for different categories of landuse and for different flood plans, e.g. 100 year ARI plus 500 mm for habitable floor level etc.
GLOSSARY XI
G:\ADMIN\B16765.G.SAW_TWEED_FS_UPDATE\R.B16765.001.01 FLOOD STUDY.DOC
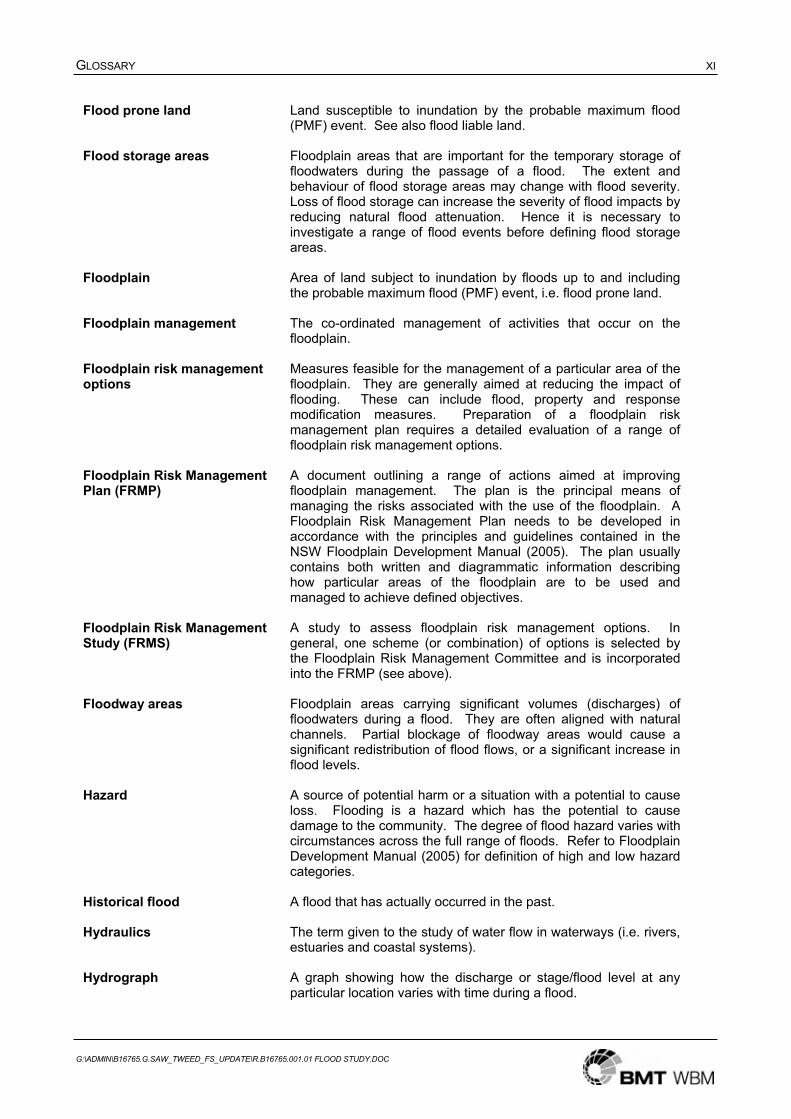
Flood prone land Land susceptible to inundation by the probable maximum flood (PMF) event. See also flood liable land.
Flood storage areas Floodplain areas that are important for the temporary storage of floodwaters during the passage of a flood. The extent and behaviour of flood storage areas may change with flood severity. Loss of flood storage can increase the severity of flood impacts by reducing natural flood attenuation. Hence it is necessary to investigate a range of flood events before defining flood storage areas.
Floodplain Area of land subject to inundation by floods up to and including the probable maximum flood (PMF) event, i.e. flood prone land.
Floodplain management The co-ordinated management of activities that occur on the floodplain.
Floodplain risk management options
Measures feasible for the management of a particular area of the floodplain. They are generally aimed at reducing the impact of flooding. These can include flood, property and response modification measures. Preparation of a floodplain risk management plan requires a detailed evaluation of a range of floodplain risk management options.
Floodplain Risk Management Plan (FRMP)
A document outlining a range of actions aimed at improving floodplain management. The plan is the principal means of managing the risks associated with the use of the floodplain. A Floodplain Risk Management Plan needs to be developed in accordance with the principles and guidelines contained in the NSW Floodplain Development Manual (2005). The plan usually contains both written and diagrammatic information describing how particular areas of the floodplain are to be used and managed to achieve defined objectives.
Floodplain Risk Management Study (FRMS)
A study to assess floodplain risk management options. In general, one scheme (or combination) of options is selected by the Floodplain Risk Management Committee and is incorporated into the FRMP (see above).
Floodway areas Floodplain areas carrying significant volumes (discharges) of floodwaters during a flood. They are often aligned with natural channels. Partial blockage of floodway areas would cause a significant redistribution of flood flows, or a significant increase in flood levels.
Hazard A source of potential harm or a situation with a potential to cause loss. Flooding is a hazard which has the potential to cause damage to the community. The degree of flood hazard varies with circumstances across the full range of floods. Refer to Floodplain Development Manual (2005) for definition of high and low hazard categories.
Historical flood A flood that has actually occurred in the past.
Hydraulics The term given to the study of water flow in waterways (i.e. rivers, estuaries and coastal systems).
Hydrograph A graph showing how the discharge or stage/flood level at any particular location varies with time during a flood.

GLOSSARY XII
G:\ADMIN\B16765.G.SAW_TWEED_FS_UPDATE\R.B16765.001.01 FLOOD STUDY.DOC
Hydrology The term given to the study of the rainfall-runoff processes in catchments.
Peak flood level, flow or velocity
The maximum flood level, flow (i.e. discharge) or velocity that occurs during a flood event.
Probable Maximum Flood (PMF)
An extreme flood deemed to be the largest flood that could conceivably occur at a specific location. It is generally not physically or economically possible to provide complete protection against this flood event, but should be considered for emergency response etc. The PMF defines the extent of flood prone land (i.e. the floodplain).
Probability A statistical measure of the likely frequency or occurrence of flooding. See also AEP.
Risk The chance of something happening that will have an impact, usually measured in terms of both the likelihood of something happening, as well as the consequences of that thing happening.
RORB A hydrologic model (software) used to simulate the catchment rainfall-runoff process, including the amount of runoff from rainfall, and the attenuation of the flood wave as it travels down a catchment.
Runoff The amount of rainfall from a catchment that actually ends up as flowing water in the river or creek, also known as rainfall excess.
Stage Equivalent to water level. See flood level.
Stage hydrograph A graph showing the evolution of water level at a particular location over time during a flood.
TUFLOW 1D and 2D hydraulic model (software). It simulates the complex hydrodynamics of floods and tides using the full 1D St Venant equations and the full 2D free-surface shallow water equations.
Velocity The speed at which floodwaters are moving (in metres per second). A flood velocity predicted by a 2D computer flood model is quoted as the depth averaged velocity, i.e. the average velocity throughout the depth of the water column. A flood velocity predicted by a 1D or quasi-2D computer flood model is quoted as the depth and width averaged velocity, i.e. the average velocity across the whole river or creek section.
Velocity-depth product The velocity of floodwaters multiplied by the depth (in metres squared per second). Also equivalent to the flow per unit width.
Water level See flood level.
WBNM (Watershed Bounded Network Model)
A hydrologic model (software) used to simulate the catchment rainfall-runoff process, including the amount of runoff from rainfall, and the attenuation of the flood wave as it travels down a catchment.
ABBREVIATIONS XIII
G:\ADMIN\B16765.G.SAW_TWEED_FS_UPDATE\R.B16765.001.01 FLOOD STUDY.DOC
ABBREVIATIONS1D / 2D One dimensional / two dimensional
AEP Annual Exceedance Probability
AHD Australian Height Datum
ALS Airborne Laser Scanning
ARI Average Recurrence Interval
AR&R Australian Rainfall and Runoff (1997)
BoM Bureau of Meteorology
DECC Department of Environment and Climate Change
DEM Digital Elevation Model
DIPNR Department of Infrastructure, Planning and Natural Resources
DLWC Department of Land and Water Conservation
DTM Digital Terrain Model
GIS Geographic Information System
GTSMR Generalised Tropical Storm Method (Revised)
km Kilometre
m Metre
m3/s Cubic metres per second
mAHD Elevation in metres relative to the Australian Height Datum
PMP Probable Maximum Precipitation
PMF Probable Maximum Flood
PWD Public Works Department (now Department of Commerce)
TIN Triangulated Irregular Network
TRESBP Tweed River Entrance Sand Bypassing Project
TSC Tweed Shire Council
V x D Velocity-depth product

INTRODUCTION 1-1
G:\ADMIN\B16765.G.SAW_TWEED_FS_UPDATE\R.B16765.001.01 FLOOD STUDY.DOC
1 INTRODUCTION
1.1 Study Location
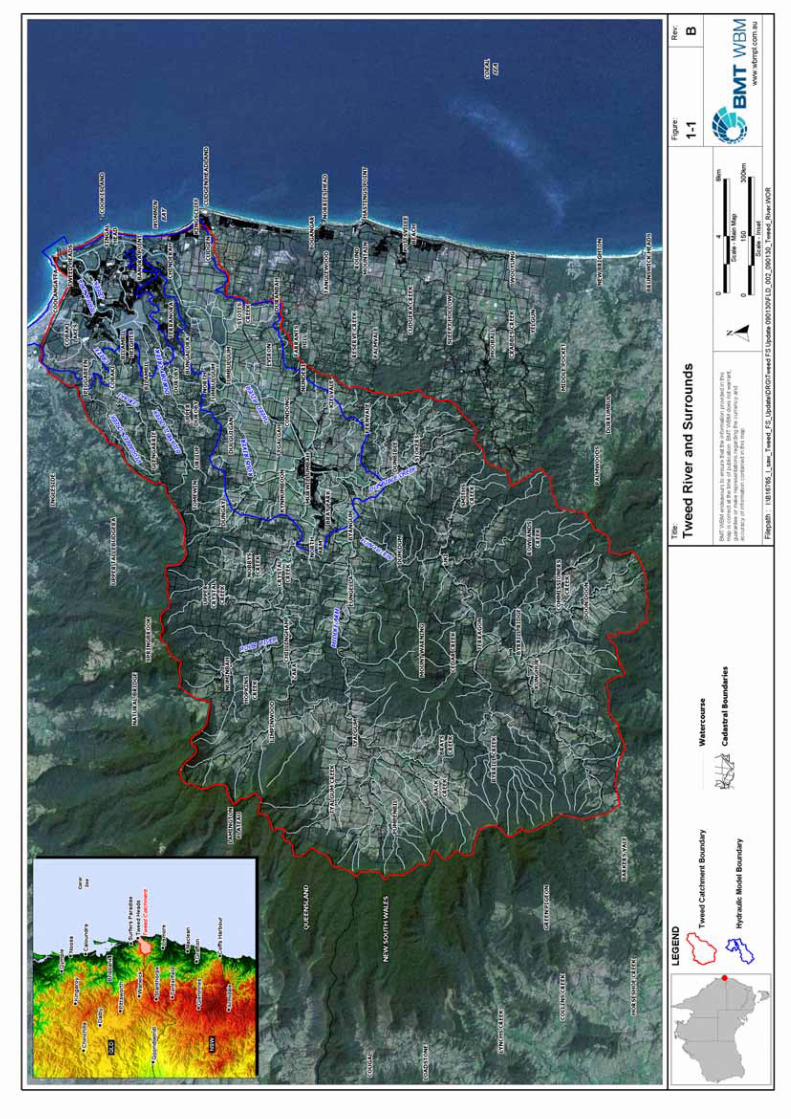
The Tweed River is located in Tweed Shire, the northern-most coastal region of New South Wales (see Figure 1-1). The main arm of the river has a length of about 50 km and a catchment area of about 1100 km2 including its various tributary systems. The main arm of the river flows in a general north-easterly direction through the towns of Murwillumbah (about 28 km upstream) and Tweed Heads (at the mouth) and past the villages of Condong, Tumbulgum, Chinderah and Fingal. The main tributaries include Oxley River, Rous River, Dunbible Creek and the Terranora and Cobaki Broadwaters. The river flows to the sea immediately south of Point Danger, close to the border with Queensland.
The key outputs of the Flood Study (namely design flood levels, depths and high flow areas) have been derived for approximately 230 km2 of the Tweed River catchment (as shown by the hydraulic model boundary in Figure 1-1). This area includes the floodplain of the Tweed River downstream from approximately Byangum, the Rous River downstream from Boat Harbour, and the lower reaches of the Broadwater tributaries.
1.2 Background
Tweed Shire Council was one of the first Councils in New South Wales to undertake flood studies for the purposes of defining planning controls and determining the impact of potential filling and development. Numerous studies were undertaken throughout the catchment from the late 1970s onwards, based on 1D hydraulic modelling of flood behaviour. In 2005, the first edition of the Tweed Valley Flood Study was published, which was the first study to incorporate fully 2D hydraulic modelling of the entire floodplain.
This 2009 update of the Tweed Valley Flood Study has been undertaken primarily to incorporate much improved topographic data of the catchment, obtained from Airborne Laser Scanning (ALS) data collected in July 2007. The opportunity was also taken to update both the hydrologic and hydraulic models to reflect advances in methodology and model development in the intervening four year period.
INTRODUCTION 1-3
G:\ADMIN\B16765.G.SAW_TWEED_FS_UPDATE\R.B16765.001.01 FLOOD STUDY.DOC
1.3 Floodplain Management
Floodplain management in NSW generally follows the guidelines described in the Floodplain Development Manual (2005). It states that the implementation of the flood policy requires a floodplain management plan that ensures:
The use of flood prone land is planned and managed in a manner compatible with the assessed frequency and severity of flooding;
Flood prone lands are managed having regard to social, economic and ecological costs and benefits, to individuals as well as the community;
Floodplain management matters are dealt with having regard to community safety, health and welfare requirements;
Information on the nature of possible future flooding is available to the public;
All reasonable measures are taken to alleviate the hazard and damage potential resulting from development on floodplains;
There is no significant growth in hazard and damage potential resulting from new development on floodplains; and
Appropriate and effective flood warning systems exist, and emergency services are available for future flooding.
The steps involved in formulating a Floodplain Risk Management Plan are outlined in the Manual, and include:
1 Establish a Floodplain Risk Management Committee
2 Data Collection
3 Flood Study
4 Floodplain Risk Management Study
5 Floodplain Risk Management Plan
6 Implementation of Plan
Community consultation is a strong element through the entire process.
It is noted that the flood study should also address the possible impacts of climate change (e.g. increases in ocean levels, altered weather patterns including increases in rainfall) on flooding behaviour, so that it can be considered further in the management study. This has been reported in a separate document.
This report covers Steps 2 and 3 above.
INTRODUCTION 1-4
G:\ADMIN\B16765.G.SAW_TWEED_FS_UPDATE\R.B16765.001.01 FLOOD STUDY.DOC
1.4 Objective
The primary objective of the Tweed Valley Flood Study is to examine and define the flood behaviour of the lower Tweed River floodplain, including its main tributaries. The findings will form the basis for the subsequent Floodplain Risk Management Study and Plan.
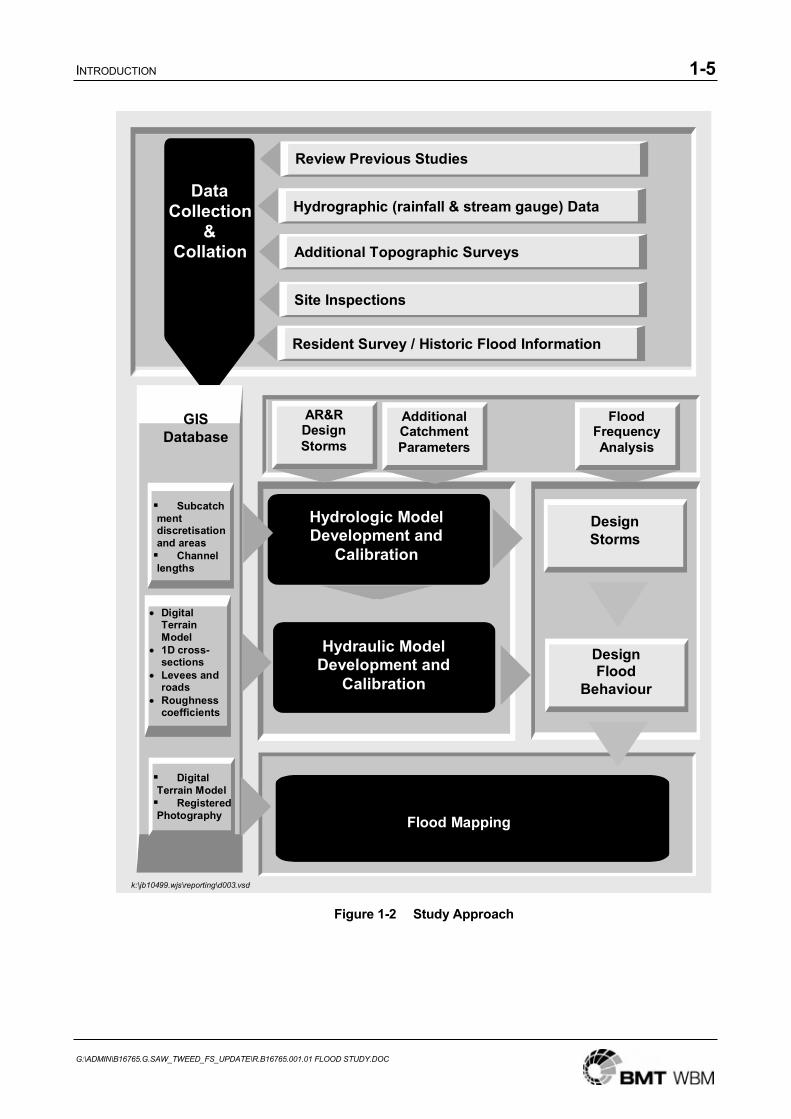
1.5 Methodology
The general approach and methodology employed to achieve the study objectives involve the following steps (as shown in Figure 1-2):
Compilation and review of available information;
Acquisition of additional data to determine nature and extent of historical flooding;
Development of hydrological and hydraulic models;
Calibration and verification of models;
Modelling of design events under existing conditions; and
Reporting and mapping.
The above tasks are described in detail in the following sections, together with presentation of the results.
INTRODUCTION 1-5
G:\ADMIN\B16765.G.SAW_TWEED_FS_UPDATE\R.B16765.001.01 FLOOD STUDY.DOC
k:\jb10499.wjs\reporting\d003.vsd
DataCollection
&Collation
Review Previous Studies
Flood Mapping
Hydrographic (rainfall & stream gauge) Data
Additional Topographic Surveys
Site Inspections
Resident Survey / Historic Flood Information
AR&RDesign Storms
AdditionalCatchmentParameters
Flood FrequencyAnalysis
Hydrologic ModelDevelopment and
Calibration
Hydraulic ModelDevelopment and
Calibration
Design Storms
Design Flood
Behaviour
GIS Database
Digital Terrain Model
Registered Photography
Digital Terrain Model
1D cross-sections
Levees and roads
Roughness coefficients
Subcatchment discretisation and areas
Channel lengths
Figure 1-2 Study Approach
INTRODUCTION 1-6
G:\ADMIN\B16765.G.SAW_TWEED_FS_UPDATE\R.B16765.001.01 FLOOD STUDY.DOC
1.6 Catchment Description
The main arm of the Tweed River has a length of about 50 km and a catchment area of about 1100 km2. The main tributary systems include:
Oxley River which joins at Byangum, about 5 km upstream of Murwillumbah;
Dunbible Creek which joins just upstream of Murwillumbah;
Rous River which joins at Tumbulgum; and
Terranora and Cobaki systems that join the river 2 km upstream of the mouth at Tweed Heads via Terranora Inlet and Ukerebagh Passage.
The Tweed River is tidal to just upstream of Murwillumbah, a total distance of about 30 kilometres. It occupies a broad open valley through which it meanders. The valley is flat floodplain land of alluvial sediments, surrounded by higher ground of bedrock.
Revetments near the mouth of the river control the width of the river to about 200 to 250 metres and up to 8 metres deep. The river is wider at Fingal and Chinderah, becoming progressively narrower with distance upstream. Near Murwillumbah the river is typically 120 to 140 metres wide and the depth is generally less than 2 to 3 metres, except in local areas of the town reach where flow and associated scour patterns cause deeper water.
The greatest expanse of floodplain occurs between Murwillumbah and Stotts Island, over which sugarcane is the predominant crop. A second area of lesser extent occurs between Stotts Island and Chinderah on the southern bank of the river. There are numerous other flood storage areas of significance including Bray Park, Wardrop Valley, Dunbible Creek, and the Terranora and Cobaki Broadwaters.
Breakwaters were constructed at the mouth of the river between 1962 and 1964 to control the entrance. In this region, a strong longshore movement of beach sand influence the river characteristics and associated hydraulic behaviour. Historically, the sand formed a bar at the mouth of the river as it bypassed to the north. A proportion entered the downstream reach of the river under the combined action of tidal currents and waves. River dredging and entrance works have affected the movement in the past. In 2001, the Tweed River Entrance Sand Bypassing system was implemented. A jetty was constructed to the south of the Tweed River entrance extending seaward from the beach. Jet pumps along the jetty pump sand via pipeline under the river to the beaches of the southern Gold Coast. During floods, sand tends to be moved out of the river to the bar and beach system.
INTRODUCTION 1-7
G:\ADMIN\B16765.G.SAW_TWEED_FS_UPDATE\R.B16765.001.01 FLOOD STUDY.DOC
1.7 Flood Behaviour
The Tweed River is well known for its floods. Townships of Murwillumbah, Condong, Tumbulgum, Chinderah, Tweed Heads and Tweed Heads South have frequently experienced inundation from floodwaters. A system of levees currently protects the main townships of Murwillumbah and Tweed Heads South from the more frequent floods. Other flood mitigation measures such as the installation of floodgates on creeks and farm drains, the raising of the natural levee bank in some areas, and the construction of drainage systems have also been undertaken.
The February 1954 flood, the largest flood on record, caused major inundation in all flood prone regions. Severe flooding was experienced in the areas downstream of Chinderah due to a combination of the ocean storm tide, a congested entrance, and flooding from catchment runoff. There is further discussion of other historical floods in Section 4. The following sections provide a brief summary of flood behaviour in particular areas of the Valley.
1.7.1 Bray Park / Murwillumbah
The village of Bray Park lies on the Tweed River directly upstream of Murwillumbah (see Figure 1-1). Bray Park acts as both a storage basin and, once full, as a major flowpath with floodwaters entering at the western end and returning to the Tweed River across Commercial Road immediately upstream of the township levee. In the March 1978 flood, the basin was still in the process of being filled when the floodwaters started to recede, while in the March 1974 flood, Bray Park became a major flowpath after the basin had filled. At Murwillumbah, the 1974 flood was a significantly larger flood than the 1978 event. In the April 1989 flood, the Bray Park area filled and operated for a short period as a flowpath.
1.7.2 Chinderah Village
Chinderah village is adjacent to a fast flowing section of the Tweed River. The flood flows through the village are generally in a south to north direction and are relatively small but have significant depth. Floodwaters enter the floodplain at Stotts Island and are forced to return to the river at Chinderah.
1.7.3 Tweed Heads South / Banora Point
Flooding of this area can occur due to either runoff from the local catchments or by backwater flows from Terranora Broadwater or the Tweed River. Steep urbanised development towards Terranora makes these areas susceptible to local flash flooding as seen in June 2005. This Flood Study considers the long duration (i.e. 36 hour) regional flood only, not the shorter duration flash flooding events due to local runoff.
DATA COLLECTION 2-1
G:\ADMIN\B16765.G.SAW_TWEED_FS_UPDATE\R.B16765.001.01 FLOOD STUDY.DOC
2 DATA COLLECTION
2.1 Previous Studies
2.1.1 Tweed Valley Flood Study (WBM, 2005)
The 2005 Tweed Valley Flood Study was the first study to be undertaken using a fully 2D hydraulic model of the entire floodplain from Murwillumbah to Tweed Heads. The TUFLOW model used hydrology outputs from a RORB model developed by PWD in 1989, and information from a number of previously developed 1D hydraulic models, together with some new datasets. A DEM was derived from a large number of topographic and bathymetric datasets of varying sources and accuracy. The TUFLOW model was calibrated and verified against the March 1974, March 1978 and April 1989 historical flood events, and used to simulate the 5, 20, 100 and 500 year ARI, and ‘extreme’ design floods. The key outputs of the study were maps of design flood levels, depths, extents, and high and low flow areas across the entire floodplain. A summary of the key changes between the 2005 and 2009 Flood Study is included in Appendix B.
2.1.2 Other Studies
A large number of preceding flood studies and hydraulic modelling also existed in the Tweed River catchment, including the following:
Tweed River Flood Mitigation Report (H. J. Lipping, PWD, 1956)
Flooding Investigation Dodds Island (WBM, 1974)
Tweed River Dynamics Study (PWD, 1979)
Tweed River Flooding Investigation, Kingscliff/Chinderah (WBM, 1979)
Terranora/Tweed Heads Flooding Investigation (WBM, 1980a)
South Tweed Heads/Banora Point Flooding & Drainage Study (WBM, 1980b)
Murwillumbah Flooding Investigation (WBM, 1981)
Kingscliff/Chinderah Flooding Investigations (WBM, 1982a)
Murwillumbah Flooding Investigations Stage II (WBM, 1982b)
Chinderah Floodway Investigations (WBM, 1983b)
Tweed River Flood Warning System (WBM, 1984)
Murwillumbah Flooding Investigation Stage III (WBM, 1986)
Tweed River Flood Hydrology (PWD, 1989)
Tweed River Entrance Feasibility Study, Fluvial Dynamics (WBM, 1989b)
Murwillumbah Flooding Investigations Stage IV (WBM, 1990b)
Chinderah Flooding Investigations (WBM, 1991a)
Tweed River Hydrodynamics Study, Summary Report (WBM, 1991b)
DATA COLLECTION 2-2
G:\ADMIN\B16765.G.SAW_TWEED_FS_UPDATE\R.B16765.001.01 FLOOD STUDY.DOC
River Management Plan, Lower Tweed Estuary, Preliminary Concepts (WBM, 1991)
River Management Plan, Upper Tweed Estuary (PWD, 1992)
River Management Plan, Lower Tweed Estuary EIS Sand Extraction - Area 5 (PWD, 1993)
River Management Plan, Lower Tweed Estuary EIS Sand Extraction - Area 5 (PWD, 1995)
Banora Point/South Tweed Stormwater Management Plan (WBM, 1997)
A summary of each of the above reports from the 1970s onwards can be found in the 2005 Flood Study report.
2.2 Topographic Data
2.2.1 ALS Data
ALS data was collected over the entire study area by FUGRO Spatial Solutions in July 2007. This data was subsequently used by FUGRO to develop a 5 metre gridded DEM and 0.5 metre interval contours on 1:5,000 mapsheet tiles. Typical vertical accuracy of this data is claimed to be +/- 0.25m at 90% confidence. ALS cannot obtain ground levels in areas of thick vegetation such as canefields, and so these ‘gaps’ in the DEM were infilled via interpolation of adjacent ALS levels. ALS also cannot penetrate waterbodies, requiring additional bathymetric survey (see Section 2.2.3). The resultant DEM for the Tweed catchment is shown in Figure 2-1.
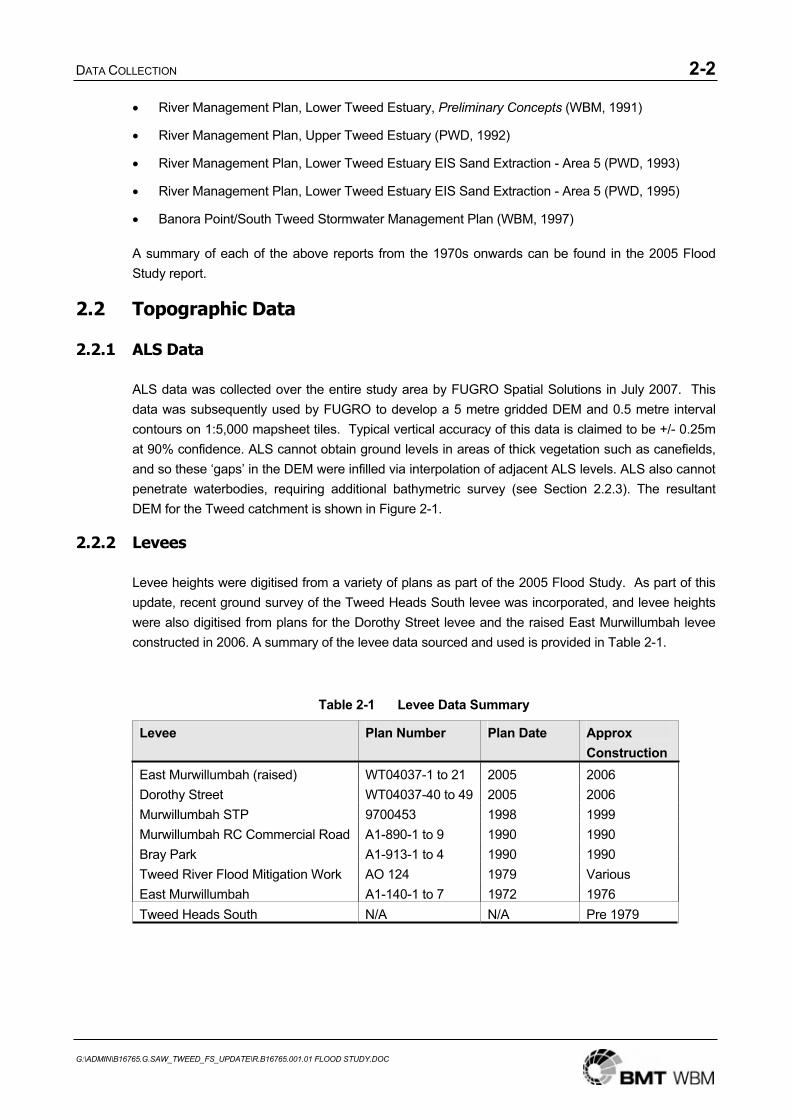
2.2.2 Levees
Levee heights were digitised from a variety of plans as part of the 2005 Flood Study. As part of this update, recent ground survey of the Tweed Heads South levee was incorporated, and levee heights were also digitised from plans for the Dorothy Street levee and the raised East Murwillumbah levee constructed in 2006. A summary of the levee data sourced and used is provided in Table 2-1.
Table 2-1 Levee Data Summary
Levee Plan Number Plan Date ApproxConstruction
East Murwillumbah (raised) WT04037-1 to 21 2005 2006 Dorothy Street WT04037-40 to 49 2005 2006 Murwillumbah STP 9700453 1998 1999 Murwillumbah RC Commercial Road A1-890-1 to 9 1990 1990 Bray Park A1-913-1 to 4 1990 1990 Tweed River Flood Mitigation Work AO 124 1979 Various East Murwillumbah A1-140-1 to 7 1972 1976 Tweed Heads South N/A N/A Pre 1979

DATA COLLECTION 2-4
G:\ADMIN\B16765.G.SAW_TWEED_FS_UPDATE\R.B16765.001.01 FLOOD STUDY.DOC
2.2.3 Anecdotal Data
The levels of the banks at Bray Park and Condong Creek were based on anecdotal evidence from historical flood events. During the 1974 flood event, it was observed that the levees at Condong Creek and Bray Park overtopped when the flood level at the Murwillumbah gauge was at approximately 4.0 and 4.5 mAHD respectively. Based on this information, during the calibration phase the levees at these locations were set at 3.7 and 4.85 mAHD respectively.
2.3 Bathymetric Data
2.3.1 TRESBP – 2000 & 2002
The Tweed River Entrance Sand Bypassing Project (TRESBP) supplied bathymetric data for the Tweed River from the mouth upstream to Tumbulgum. This survey was undertaken in February 2000. The TRESBP also supplied a smaller bathymetric dataset from the mouth upstream to Barneys Point. This data is collected regularly, and the March 2002 survey was incorporated into the model bathymetry, taking precedence over the 2000 dataset where there was overlap. Should this data be used for any purpose other than for this Flood Study, prior approval should be sought from TRESBP.
2.3.2 PWD – 1979
Cross-sections of the river were collected by PWD in 1979 from the mouth to upstream of Murwillumbah. These cross-section details are contained on PWD plans Tweed River Flood Mitigation. No plan numbers were available on the plans held by BMT WBM. The Department of Public Works and Services provided cross-sections in chainage-elevation digital format in 2002. These were converted into XYZ format and incorporated into the model bathymetry, with the TRESBP data (see Section 2.3.1) taking precedence where there was overlap.
2.4 Hydraulic Structures
Details of the configuration, size and levels of hydraulic structures including bridges, culverts, weirs, flapgates etc, were obtained from a variety of sources. Most structures were already included in previously developed 1D hydraulic models and were directly incorporated as 1D structures in the TUFLOW 2D/1D model developed for the 2005 Flood Study. The Murwillumbah, Condong and Tumbulgum bridges were also updated for the 2005 Flood Study based on plans provided by Tweed Shire Council. As part of this 2009 update, the drainage structures under the Pacific Highway were refined and updated based on RTA design drawings of the Chinderah Bypass and Yelgun to Chinderah Upgrade.
2.5 Calibration Data
Data on the March 1974, March 1978 and April 1989 flood events was obtained from a variety of sources for the purpose of calibration and verification of the hydrologic and hydraulic models.
Rainfall data (daily and pluviograph) was obtained from the Bureau of Meteorology for the new hydrologic model developed as part of this 2009 update;

DATA COLLECTION 2-5
G:\ADMIN\B16765.G.SAW_TWEED_FS_UPDATE\R.B16765.001.01 FLOOD STUDY.DOC
Streamflow data was obtained from Tweed Shire Council as part of previous flood studies undertaken in the catchment;
Flood level data was obtained from DIPNR as part of previous flood studies undertaken in the catchment.

MODEL DEVELOPMENT 3-1
G:\ADMIN\B16765.G.SAW_TWEED_FS_UPDATE\R.B16765.001.01 FLOOD STUDY.DOC
3 MODEL DEVELOPMENT
3.1 Introduction
Two types of models were used to simulate flooding behaviour in the Tweed River floodplain:
A hydrologic model of the entire catchment including tributaries; and
A 2D/1D hydraulic model extending from upstream of Murwillumbah to the ocean.
The hydrologic model simulates the catchment rainfall-runoff processes, producing the river / creek flows and catchment runoff which are input to the hydraulic model.
The hydraulic model simulates the behaviour of flow in the watercourses and across the floodplains, including flood levels, flow discharges and flow velocities.
Information on the topography, bathymetry and characteristics of the catchments, rivers, creeks and floodplains are built into the models. For each historic flood, data on rainfall, flood levels and river flows are used to simulate and validate (calibrate and verify) the events. The models produce as output, flood levels, flows (discharges) and flow velocities.
Development of a computer model follows a relatively standard procedure:
Discretisation of the catchment, river, floodplain, etc (see discussion below).
Incorporation of physical characteristics (catchment areas, river cross-sections, etc).
Setting up of hydrographic databases (rainfall, river flows, flood levels) for historic events.
Calibration to one or more historic floods (calibration is the adjustment of parameters within acceptable limits to reach agreement between modelled and measured values).
Verification to one or more other historic floods (verification is a check on the model’s performance without adjustment of parameters).
Once the model’s development is complete, it may then be used for a variety of purposes, for example:
Establishing design flood conditions;
Determining levels for planning control; and
Assessing the hydraulic impacts of various floodplain management measures.
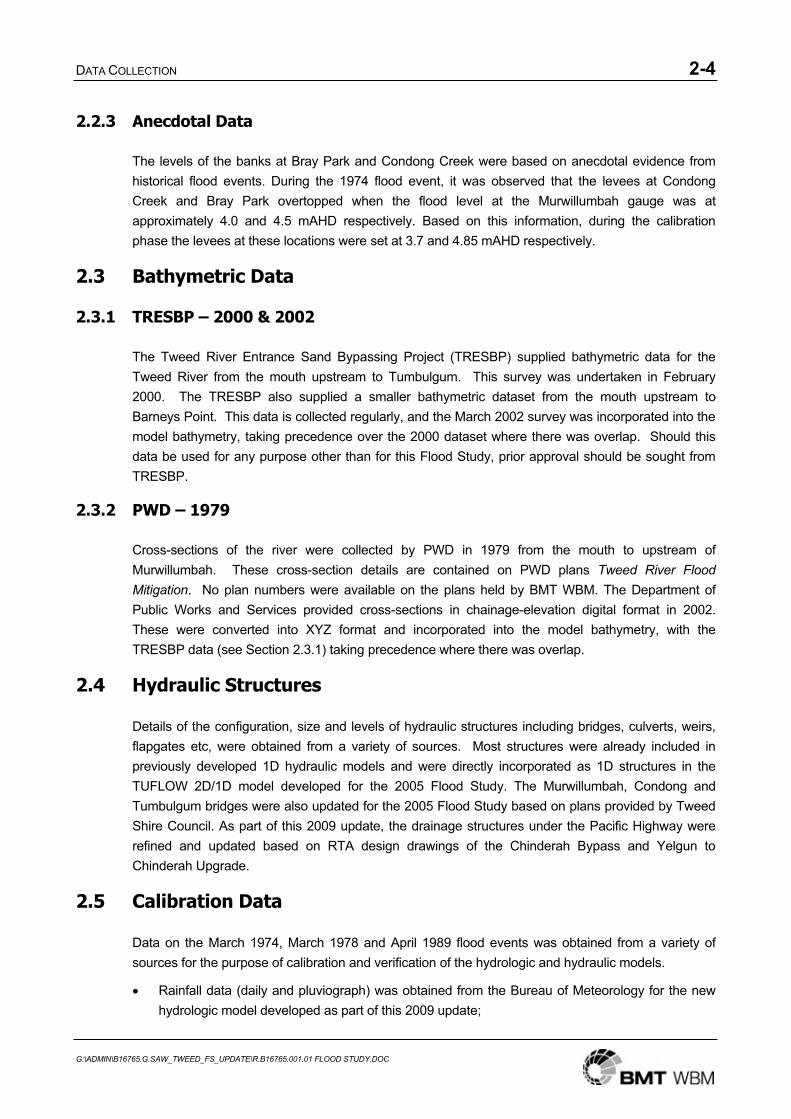
The integration of all of these data and the role of the models are demonstrated in Figure 3-1.
MODEL DEVELOPMENT 3-2
G:\ADMIN\B16765.G.SAW_TWEED_FS_UPDATE\R.B16765.001.01 FLOOD STUDY.DOC
k:\jb10499.wjs\reporting\d003.vsd
Site Inspections
Historic FloodInformation Survey
Review StudiesCollate Data
Additional TopographicSurveys
DataCollection
&Collation
GISDatabase
Historic Flood LevelsDigital Terrain Model
HydraulicModel Catchment Runoff
(Hydrologic) Model
River, Floodplain, Levee& Road Topography
Flood Control StructuresRoughness Coefficients
HistoricFlood Levels
RainfallCatchment DetailsMeasured Flows
HistoricFlood Patterns
AR&R DesignStorms
Flood Mapping
Design Floods
HydraulicModel
Calibration
Flood FrequencyAnalysis
HydrologicModel
DesignFloodFlows
CalibratedHydraulic
Model
Figure 3-1 Hydraulic Model Development Process
MODEL DEVELOPMENT 3-3
G:\ADMIN\B16765.G.SAW_TWEED_FS_UPDATE\R.B16765.001.01 FLOOD STUDY.DOC
3.2 Hydrologic Model
3.2.1 Background
A hydrologic model simulates the rate of storm runoff from the catchment. The amount of runoff from the rainfall, and the attenuation of the flood wave as it travels down the river, is dependent on:
The catchment’s slope, area, vegetation and other characteristics;
Variations in the distribution, intensity and amount of rainfall; and
The antecedent conditions of the catchment.
3.2.2 WBNM Model
As part of the 2009 update, WBNM was chosen to model the catchment rainfall-runoff process. A WBNM model was developed specifically for this study with a total of 207 subcatchments delineated to represent the Tweed catchment. These are delineated and shown overlain on the DEM in Figure 2-1 in the previous section.
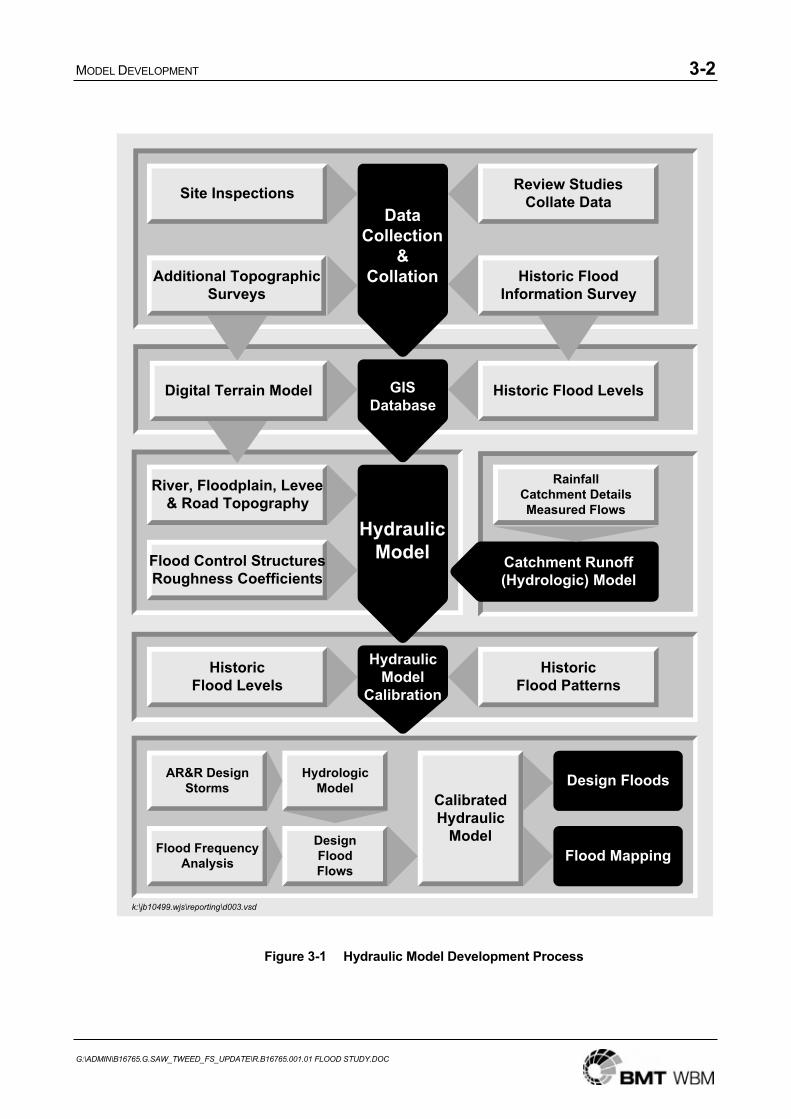
Principal parameters used in the construction and calibration of the WBNM model include the Lag Parameter and initial and continuing losses (discussed further below). Stream Lag and parameters were set at recommended values. Table 3-1 summarises the adopted parameters.
Table 3-1 WBNM Model Parameters
Parameter Historical Events Design Events Lag Parameter 1.8 1.8 Stream Lag 1 1
0.23 0.23 Initial loss 10 mm 0 mm Continuing loss 2.5 mm/h 2.5 mm/h
3.2.2.1 Lag Parameter
WBNM uses a Lag Parameter (sometimes called the C value) to calculate the catchment response time for runoff. The formula used by WBNM (2003) is:
Overland Flow Lag Time = Lag Parameter . A 0.57 . Q -0.23
The Lag Parameter is important in determining the timing of runoff from a catchment and thus the shape of the runoff hydrograph. The parameter is determined via calibration to recorded hydrographs. In general, the smaller the Lag Parameter, the less attenuated the runoff hydrograph.
The Lag Parameter selected for the Tweed catchment was 1.8. This value is consistent with the results of Boyd and Cordery (1989), which determined an average Lag Parameter of 1.8 in a study of 36 catchments in eastern and inland NSW (WBNM, 2003).
MODEL DEVELOPMENT 3-4
G:\ADMIN\B16765.G.SAW_TWEED_FS_UPDATE\R.B16765.001.01 FLOOD STUDY.DOC
3.2.2.2 Losses
A Uniform Continuing Loss Model was used for this study. The initial loss (mm) is the depth of rainfall that is intercepted and infiltrates into the soil, and does not contribute to runoff in the initial stages of the rainfall event. It is a function of the initial ‘wetness’ of the catchment prior to the flood-producing rain: the wetter the catchment, the lower the initial loss. Thus, the initial loss is event specific.
The continuing loss (mm/h) is the rainfall that infiltrates throughout the event, and does not contribute to runoff. In theory, this is a constant function of the catchment. That is, the continuing loss is not event specific but catchment specific, and should therefore be the same across all events.
The initial loss and continuing loss rates for the hydrologic model were determined during the calibration process. The initial loss was set at 10 mm for the 3 historical events and 0 mm for design events. A continuing loss of 2.5 mm/h was adopted for the catchment. These parameters are in line with recommendations in AR&R for eastern NSW, and the 1989 RORB model of the catchment developed by PWD.
3.3 Hydraulic Model
3.3.1 Background
The hydraulic model simulates the dynamic flooding behaviour along the Tweed River, minor creeks and the floodplains. The rate of travel and attenuation (dampening) of a flood wave is dependent on the shape, size and vegetation or surface characteristics of the creeks, river and floodplains. For example, the larger the floodplain, the greater the flood wave attenuation, and the ‘rougher’ the surface and denser the vegetation, the slower the rate of travel.
Man-made structures and modification of the floodplains also affect how the flood wave propagates down the river. Some structures will hold back flood waters, typically causing a higher flood level upstream and / or diverting flood waters elsewhere.
Under normal flow conditions (i.e. within the creek banks), 1D hydraulic modelling is typically used. However, when water levels rise above the creek banks, water starts to flow laterally onto the floodplain. Flow patterns when flooding occurs are typically more complex, and the modelling assumptions of uniform channel flow associated with 1D representation of creek systems are no longer valid. 2D hydraulic models are then used to capture the complexity of the flow patterns within the floodplain and the interaction between the creek systems and the floodplain.
3.3.2 TUFLOW Model
A hydrodynamic, dynamically-linked 2D / 1D TUFLOW hydraulic model was developed for the 2005 Flood Study and updated in 2009. Flows across the floodplain and in the wider, lower reaches of the Tweed River are modelled in 2D. Hydraulic flows through large culverts and bridges are also modelled in 2D, and include the effects of bridge decks and submerged culvert flow. Flow over roads, levees, bunds etc is modelled using the broad-crested weir formula when the flow is upstream controlled. The more narrow reaches, and smaller hydraulic structures such as pipes, are embedded as 1D elements dynamically linked to the 2D domain.
MODEL DEVELOPMENT 3-5
G:\ADMIN\B16765.G.SAW_TWEED_FS_UPDATE\R.B16765.001.01 FLOOD STUDY.DOC
The model comprises the following features:
Approximately 300,000 x 40 m x 40 m grid cells and 9 bridges under the Pacific Highway in the 2D domain;
Approximately 160 channels including 35 culverts, 9 bridges and 14 weirs in the 1D domain;
Approximately 50 breaklines representing both topographic ‘ridges’ (e.g. levees, banks, roads, railways etc) and ‘gullies’ (e.g. minor watercourses, drains, underpasses etc);
Manning’s ‘n’ values for all 1D elements and 2D grid cells based on land use;
Approximately 60 boundary conditions representing upstream and lateral inflows, rainfall runoff and downstream ocean levels.
3.3.3 Model Geometry
The source of the topographic, bathymetric and structure data incorporated into the model geometry is summarised in Sections 2.2 to 2.4. Some additional breaklines were also delineated from ALS data to better represent the top of banks, roads and highways, as well as minor flowpaths. Figure 3-2 shows the location of the 1D and 2D components of the TUFLOW hydraulic model.
3.3.3.1 Bed Scour and Dune Breach (PMF)
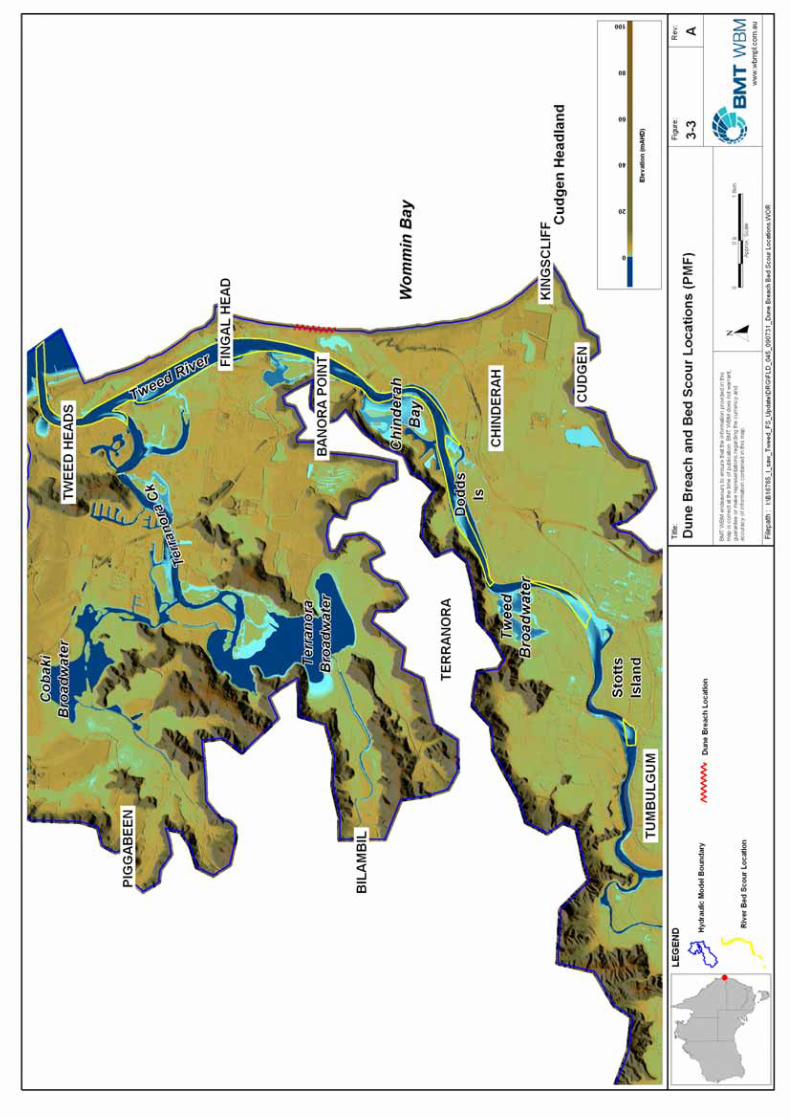
The hydraulic model developed for the Tweed Valley Flood Study does not include dynamic morphological modelling (i.e. sediment transport). This is considered conservative and appropriate for most of the flood events modelled in this study. However, in a probable maximum flood (PMF) event (see Section 5.2.3) it is predicted that there will be very high velocities in the channel, and overtopping of the coastal dunes in some locations. It is therefore reasonable to expect some scouring of the river bed and breaching of the dunes in such an event, and so additional morphological changes were included in the PMF model geometry to represent these likely impacts.
To account for potential effects of bed scour, river bed levels between Stotts Island and the mouth were nominally lowered to -5 mAHD in areas where PMF velocities exceed 1 m/s. A section of coastal dunes at Fingal Heads was also identified as the most likely location for a potential dune breach, based on an assessment of the local topography and the extent of overtopping in a PMF event. The locations of the bed scour and dune breach adopted for the PMF scenario are shown in Figure 3-3. The dune breach was incorporated into the PMF model geometry based on the parameters in Table 3-2.
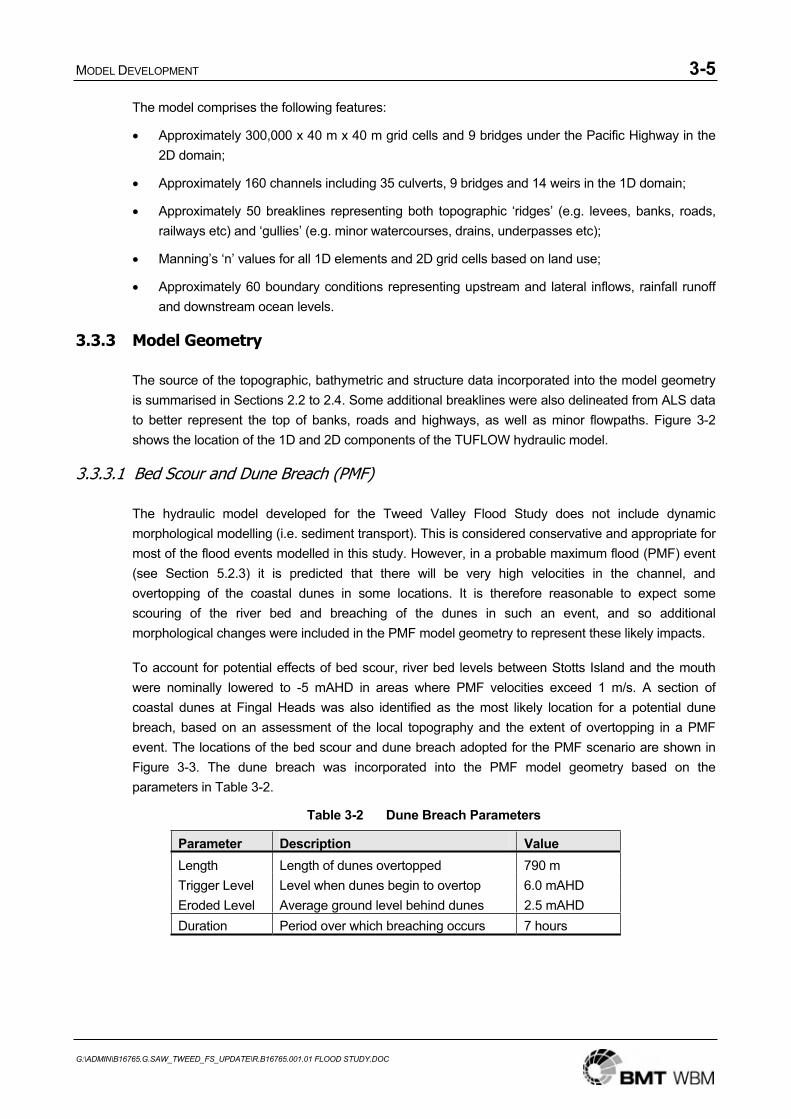
Table 3-2 Dune Breach Parameters
Parameter Description ValueLength Length of dunes overtopped 790 m Trigger Level Level when dunes begin to overtop 6.0 mAHD Eroded Level Average ground level behind dunes 2.5 mAHD Duration Period over which breaching occurs 7 hours

MODEL DEVELOPMENT 3-8
G:\ADMIN\B16765.G.SAW_TWEED_FS_UPDATE\R.B16765.001.01 FLOOD STUDY.DOC
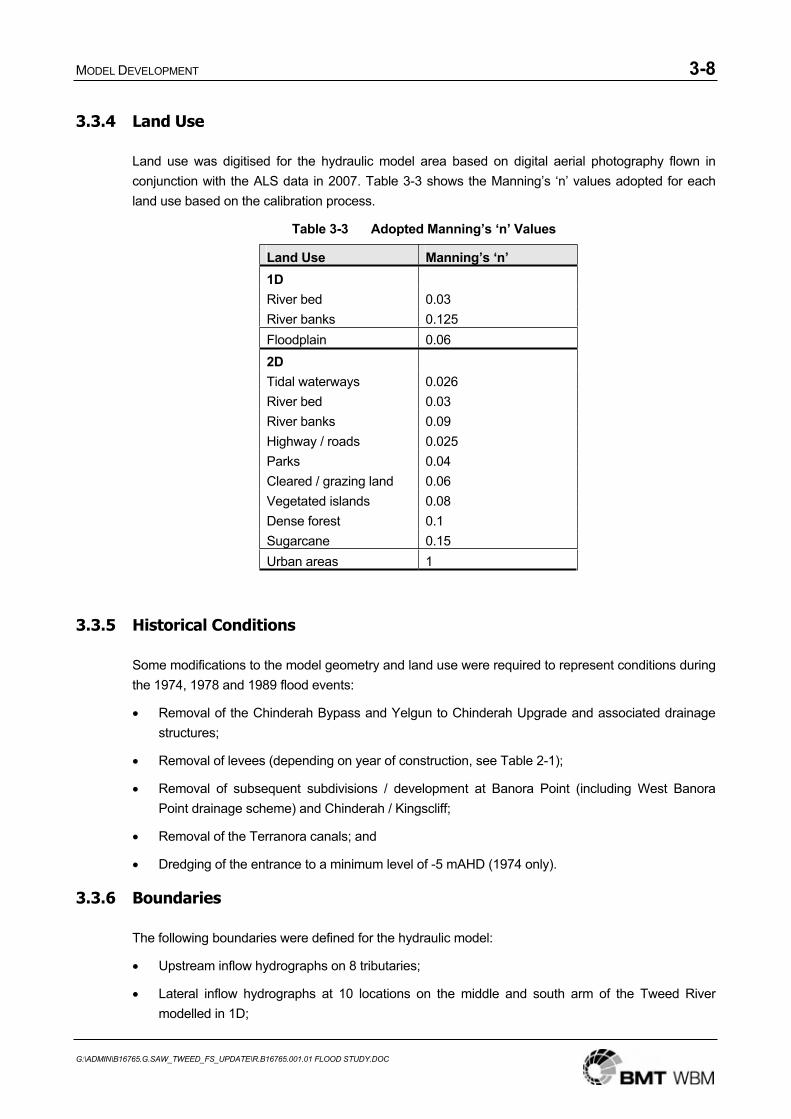
3.3.4 Land Use
Land use was digitised for the hydraulic model area based on digital aerial photography flown in conjunction with the ALS data in 2007. Table 3-3 shows the Manning’s ‘n’ values adopted for each land use based on the calibration process.
Table 3-3 Adopted Manning’s ‘n’ Values
3.3.5 Historical Conditions
Some modifications to the model geometry and land use were required to represent conditions during the 1974, 1978 and 1989 flood events:
Removal of the Chinderah Bypass and Yelgun to Chinderah Upgrade and associated drainage structures;
Removal of levees (depending on year of construction, see Table 2-1);
Removal of subsequent subdivisions / development at Banora Point (including West Banora Point drainage scheme) and Chinderah / Kingscliff;
Removal of the Terranora canals; and
Dredging of the entrance to a minimum level of -5 mAHD (1974 only).
3.3.6 Boundaries
The following boundaries were defined for the hydraulic model:
Upstream inflow hydrographs on 8 tributaries;
Lateral inflow hydrographs at 10 locations on the middle and south arm of the Tweed River modelled in 1D;
Land Use Manning’s ‘n’ 1DRiver bed 0.03 River banks 0.125 Floodplain 0.06 2DTidal waterways 0.026 River bed 0.03 River banks 0.09 Highway / roads 0.025 Parks 0.04 Cleared / grazing land 0.06 Vegetated islands 0.08 Dense forest 0.1 Sugarcane 0.15 Urban areas 1

MODEL DEVELOPMENT 3-9
G:\ADMIN\B16765.G.SAW_TWEED_FS_UPDATE\R.B16765.001.01 FLOOD STUDY.DOC
Rainfall runoff hydrographs for 43 subcatchments modelled in 2D;
Downstream ocean level hydrograph with storm surge.
The inflow and runoff hydrographs were based on outputs from the WBNM hydrologic models for both historical and design events. The ocean levels were based on predicted tide levels for the historical flood events, and design storm surge levels for the design events. Figure 3-4 shows the locations of the model boundaries.
HISTORICAL FLOODS 4-1
G:\ADMIN\B16765.G.SAW_TWEED_FS_UPDATE\R.B16765.001.01 FLOOD STUDY.DOC
4 HISTORICAL FLOODS
4.1 Calibration and Verification Process
Calibration of hydrologic and hydraulic models is an iterative and complex process. It requires the investigation of many combinations of calibration parameters to achieve a suitable representation of historical flood events in the catchment.
Joint calibration of the Tweed catchment WBNM hydrologic model and Tweed Valley TUFLOW hydraulic model was undertaken based on flows and flood levels recorded for the March 1974 flood. This was then verified against recorded data for the March 1978 and April 1989 floods. The choice of these flood events for calibration was largely dictated by the availability of recorded data. The 1954 flood was the largest on record. However, insufficient rainfall data meant it was not possible to model this event. Since the 1989 event, no larger flood has occurred on the Tweed River.
For each historical event, rainfall temporal patterns were assigned to the WBNM subcatchments based on a Thiessen distribution of recorded pluviometer data. The spatial distribution of the rainfall across the subcatchments was based on isohyets derived from the total event rainfall recorded in and near the catchment at both pluviometer and daily rainfall stations.
Inflows and runoff hydrographs were then extracted from the WBNM model outputs and input to the TUFLOW hydraulic model, together with predicted tide levels for each event, to simulate the flow behaviour in the floodplain. Modelled and recorded flood levels were compared at various gauge locations, and the hydrologic and hydraulic input parameters (see Sections 3.2.2 and 3.3.4) were iteratively refined to best replicate observed flood behaviour.
The following sections detail the recorded rainfall data, modelled inflows and a comparison of modelled and recorded levels for each of the three historical flood events simulated.
4.2 March 1974
4.2.1 Recorded and Modelled Data
Table 4-1 summarises the rainfall data for the 48 hour period to 9am 11 March 1974, measured at 25 daily stations and 5 pluviometers. Figure 4-1 to Figure 4-6 show the temporal patterns from the pluviometers (hourly and cumulative) and Figure 4-7 shows the spatial distribution of the recorded rainfall. The modelled inflows from WBNM are shown in Figure 4-8 and Figure 4-9 for the lower and upper Tweed tributaries respectively.
Figure 4-10 shows plots of modelled and recorded flood levels at the Murwillumbah, Condong and Chinderah gauges. Figure 4-11 and Figure 4-12 compare modelled levels with peak flood levels recorded in the floodplain at Murwillumbah and Chinderah for the 1974 event.
HISTORICAL FLOODS 4-2
G:\ADMIN\B16765.G.SAW_TWEED_FS_UPDATE\R.B16765.001.01 FLOOD STUDY.DOC
Table 4-1 48 Hour Rainfall to 9am 11 March 1974
Rainfall Station 48 Hour Rainfall (mm) Observation Interval Chillingham 430 Daily Brays Ck (Misty Mountain) 515 Daily Chillingham (Limpinwood) 258 Daily Murwillumbah (Taleswood) 393 Daily Doon Doon (McCabes Rd) 685 Daily Tyalgum (Warning View) 425 Daily Upper Crystal Ck (Arkuna) 510 Daily Mount Nardi 615 Daily Numinbah 482 Daily Alpine Panorama 561 Daily Harnett 560 Daily Tomewin (Border Gate) 432 Daily Mullumbimby 644 Daily Lillian Rock (Williams Rd) 431 Daily Nimbin Post Office 514 Daily Green Mountains 624 Daily Mullumbimby (Fairview Farm) 443 Daily Widgee 237 Daily Darlington 248 Daily Wunburra 291 Daily Little Nerang Dam 271 Daily Loadstone (High View) 217 Daily Kingscliff (Marine Parade) 468 Daily Tallebudgera Guineas Ck Rd 288 Daily Tweed Heads Golf Club 547 Daily Kunghur (The Junction) 434 Continuous Murwillumbah (Bray Park) 378 Continuous Tyalgum (Pumpenbil Rd) 416 Continuous Springbrook Forestry 538 Continuous Coolangatta Bowls Comp 546 Continuous
HISTORICAL FLOODS 4-3
G:\ADMIN\B16765.G.SAW_TWEED_FS_UPDATE\R.B16765.001.01 FLOOD STUDY.DOC
0
10
20
30
40
50
60
70
80
9/03
/197
4 9:
00
9/03
/197
4 12
:00
9/03
/197
4 15
:00
9/03
/197
4 18
:00
9/03
/197
4 21
:00
10/0
3/19
74 0
:00
10/0
3/19
74 3
:00
10/0
3/19
74 6
:00
10/0
3/19
74 9
:00
10/0
3/19
74 1
2:00
10/0
3/19
74 1
5:00
10/0
3/19
74 1
8:00
10/0
3/19
74 2
1:00
11/0
3/19
74 0
:00
11/0
3/19
74 3
:00
11/0
3/19
74 6
:00
Hou
rly R
ainf
all D
epth
[mm
]
Figure 4-1 Tyalgum (Pumpenbil Rd) Pluviometer, March 1974
0
10
20
30
40
50
60
70
80
9/03
/197
4 9:
00
9/03
/197
4 12
:00
9/03
/197
4 15
:00
9/03
/197
4 18
:00
9/03
/197
4 21
:00
10/0
3/19
74 0
:00
10/0
3/19
74 3
:00
10/0
3/19
74 6
:00
10/0
3/19
74 9
:00
10/0
3/19
74 1
2:00
10/0
3/19
74 1
5:00
10/0
3/19
74 1
8:00
10/0
3/19
74 2
1:00
11/0
3/19
74 0
:00
11/0
3/19
74 3
:00
11/0
3/19
74 6
:00
Hou
rly R
ainf
all D
epth
[mm
]
Figure 4-2 Kunghur Pluviometer, March 1974
HISTORICAL FLOODS 4-4
G:\ADMIN\B16765.G.SAW_TWEED_FS_UPDATE\R.B16765.001.01 FLOOD STUDY.DOC
0
10
20
30
40
50
60
70
80
9/03
/197
4 9:
00
9/03
/197
4 12
:00
9/03
/197
4 15
:00
9/03
/197
4 18
:00
9/03
/197
4 21
:00
10/0
3/19
74 0
:00
10/0
3/19
74 3
:00
10/0
3/19
74 6
:00
10/0
3/19
74 9
:00
10/0
3/19
74 1
2:00
10/0
3/19
74 1
5:00
10/0
3/19
74 1
8:00
10/0
3/19
74 2
1:00
11/0
3/19
74 0
:00
11/0
3/19
74 3
:00
11/0
3/19
74 6
:00
Hou
rly R
ainf
all D
epth
[mm
]
Figure 4-3 Coolangatta Bowls Comp Pluviometer, March 1974
0
10
20
30
40
50
60
70
80
9/03
/197
4 9:
00
9/03
/197
4 12
:00
9/03
/197
4 15
:00
9/03
/197
4 18
:00
9/03
/197
4 21
:00
10/0
3/19
74 0
:00
10/0
3/19
74 3
:00
10/0
3/19
74 6
:00
10/0
3/19
74 9
:00
10/0
3/19
74 1
2:00
10/0
3/19
74 1
5:00
10/0
3/19
74 1
8:00
10/0
3/19
74 2
1:00
11/0
3/19
74 0
:00
11/0
3/19
74 3
:00
11/0
3/19
74 6
:00
Hou
rly R
ainf
all D
epth
[mm
]
Figure 4-4 Murwillumbah (Bray Park) Pluviometer, March 1974
HISTORICAL FLOODS 4-5
G:\ADMIN\B16765.G.SAW_TWEED_FS_UPDATE\R.B16765.001.01 FLOOD STUDY.DOC
0
10
20
30
40
50
60
70
80
9/03
/197
4 9:
00
9/03
/197
4 12
:00
9/03
/197
4 15
:00
9/03
/197
4 18
:00
9/03
/197
4 21
:00
10/0
3/19
74 0
:00
10/0
3/19
74 3
:00
10/0
3/19
74 6
:00
10/0
3/19
74 9
:00
10/0
3/19
74 1
2:00
10/0
3/19
74 1
5:00
10/0
3/19
74 1
8:00
10/0
3/19
74 2
1:00
11/0
3/19
74 0
:00
11/0
3/19
74 3
:00
11/0
3/19
74 6
:00
Hou
rly R
ainf
all D
epth
[mm
]
Figure 4-5 Springbrook Forestry Pluviometer, March 1974
0
10
20
30
40
50
60
70
80
90
100
9/03
/197
4 9:
00
9/03
/197
4 12
:00
9/03
/197
4 15
:00
9/03
/197
4 18
:00
9/03
/197
4 21
:00
10/0
3/19
74 0
:00
10/0
3/19
74 3
:00
10/0
3/19
74 6
:00
10/0
3/19
74 9
:00
10/0
3/19
74 1
2:00
10/0
3/19
74 1
5:00
10/0
3/19
74 1
8:00
10/0
3/19
74 2
1:00
11/0
3/19
74 0
:00
11/0
3/19
74 3
:00
11/0
3/19
74 6
:00
11/0
3/19
74 9
:00
Cum
ulat
ive
Rai
nfal
l Tot
al (%
)
Tyalgum (Pumpenbil Rd) KunghurCoolangatta Bowls CompMurwillumbah (Bray Park)Springbrook Forestry
Figure 4-6 Cumulative Rainfall, March 1974

HISTORICAL FLOODS 4-7
G:\ADMIN\B16765.G.SAW_TWEED_FS_UPDATE\R.B16765.001.01 FLOOD STUDY.DOC
0
20
40
60
80
100
120
140
9/03
/197
4 9:
00
9/03
/197
4 12
:00
9/03
/197
4 15
:00
9/03
/197
4 18
:00
9/03
/197
4 21
:00
10/0
3/19
74 0
:00
10/0
3/19
74 3
:00
10/0
3/19
74 6
:00
10/0
3/19
74 9
:00
10/0
3/19
74 1
2:00
10/0
3/19
74 1
5:00
10/0
3/19
74 1
8:00
10/0
3/19
74 2
1:00
11/0
3/19
74 0
:00
11/0
3/19
74 3
:00
11/0
3/19
74 6
:00
11/0
3/19
74 9
:00
11/0
3/19
74 1
2:00
Pred
icte
d Fl
ow [c
umec
s]PigabeenCobakiBilambilDuroby
Figure 4-8 Modelled Hydrographs, Lower Tweed, March 1974
0
200
400
600
800
1000
1200
1400
1600
1800
2000
9/03
/197
4 9:
00
9/03
/197
4 12
:00
9/03
/197
4 15
:00
9/03
/197
4 18
:00
9/03
/197
4 21
:00
10/0
3/19
74 0
:00
10/0
3/19
74 3
:00
10/0
3/19
74 6
:00
10/0
3/19
74 9
:00
10/0
3/19
74 1
2:00
10/0
3/19
74 1
5:00
10/0
3/19
74 1
8:00
10/0
3/19
74 2
1:00
11/0
3/19
74 0
:00
11/0
3/19
74 3
:00
11/0
3/19
74 6
:00
11/0
3/19
74 9
:00
11/0
3/19
74 1
2:00
11/0
3/19
74 1
5:00
11/0
3/19
74 1
8:00
Pred
icte
d Fl
ow [c
umec
s]
DunbibleRous RiverMiddle ArmSouth Arm
Figure 4-9 Modelled Hydrographs, Upper Tweed, March 1974

HIS
TOR
ICAL
FLO
OD
S4-
8
G:\A
DM
IN\B
1676
5.G
.SAW
_TW
EED
_FS_
UPD
ATE\
R.B
1676
5.00
1.01
FLO
OD
STU
DY.
DO
C
01234567 12:0
009
/03/
7418
:00
09/0
3/74
00:0
010
/03/
7406
:00
10/0
3/74
12:0
010
/03/
7418
:00
10/0
3/74
00:0
011
/03/
7406
:00
11/0
3/74
12:0
011
/03/
7418
:00
11/0
3/74
00:0
012
/03/
74
Dat
e / T
ime
Flood Level (mAHD)M
urw
illum
bah
- Rec
orde
dC
ondo
ng -
Rec
orde
dC
hind
erah
- R
ecor
ded
Mur
will
umba
h - M
odel
led
Con
dong
- M
odel
led
Chi
nder
ah -
Mod
elle
d
Figu
re 4
-10
Rec
orde
d an
d M
odel
led
Floo
d Le
vels
, Mar
ch 1
974


HISTORICAL FLOODS 4-11
G:\ADMIN\B16765.G.SAW_TWEED_FS_UPDATE\R.B16765.001.01 FLOOD STUDY.DOC
4.2.2 Discussion
The March 1974 flood event was the largest of the three calibration / verification flood events. The following comments are made in relation to the model’s replication of observed flood behaviour for this flood event:
The replication of the gauge levels at Murwillumbah (see Figure 4-10) indicates the model adequately represents the flooding behaviour at Murwillumbah. The timing is well replicated although the peak and rise are slightly over predicted and the recession slightly under predicted. This is potentially due to discrepancies in rainfall patterns which are limited by the availability of data.
Dynamic output from the model confirms anecdotal information on the behaviour of the March 1974 flood, including:
Floodwaters enter Condong Creek and Blacks Drain before Bray Park.
Bray Park is overtopped when the flood level at the Murwillumbah gauge is between 4.5m and 4.8 mAHD.
Peak floodplain levels in Murwillumbah town and south (see Figure 4-11) are generally well represented. The southern most level of 5.69 mAHD is poorly represented, possibly due to the limitations of representing the structures and topography in this area on a 40 metre grid.
Levels at Condong and Chinderah gauges are reasonably well replicated, particularly at the peak of the flood.
Peak modelled levels at Chinderah are higher in the model by an average of about 0.2 metre (see Figure 4-12). This is possibly due to the uncertainty of the bathymetry in the river mouth at the time of the flood. The model base bathymetry is derived from hydro-survey from 2000. At this time, the shoals in the river mouth (especially on the inside of the bend) are expected to be at their highest level in recent history. At the time of the March 1974 flood, the entrance bathymetry was very different and considerably deeper due to:
- Major dredging operations in 1973 / 1974; and
- The January 1974 flood event.
To account for the assumed differences in bathymetry in the river mouth at the time of the March 1974 flood event, the dredged areas were lowered to -5.0 mAHD (except where surveyed levels indicated existing depths lower than -5.0 mAHD). These areas could have been dredged lower than this level and possibly as low as -8.0 mAHD as discussed in the Tweed Entrance Feasibility Study: Phase II Estuarine Investigation (WBM, 1990).
Floodwaters can be seen to rapidly break out across Terranora Broadwater to Tweed Heads South. The depth of breakout water across this area is very shallow.
In general, it is concluded that the model adequately represents the flood behaviour observed in the March 1974 flood event.
HISTORICAL FLOODS 4-12
G:\ADMIN\B16765.G.SAW_TWEED_FS_UPDATE\R.B16765.001.01 FLOOD STUDY.DOC
4.3 March 1978
4.3.1 Recorded and Modelled Data
Table 4-2 summarises the rainfall data for the 48 hour period to 9am 19 March 1978, measured at 23 daily stations and 6 pluviometers. Figure 4-13 to Figure 4-19 show the temporal patterns from the pluviometers (hourly and cumulative) and Figure 4-20 shows the spatial distribution of the recorded rainfall. The modelled inflows from WBNM are shown in Figure 4-21 and Figure 4-22 for the lower and upper Tweed tributaries respectively.
Figure 4-23 shows plots of modelled and recorded flood levels at the Murwillumbah and Condong gauges. Figure 4-24 shows the same plots at the Lower Tweed and Broadwater gauges.
4.3.2 Discussion
The following comments are made in relation to the model’s replication of observed flood behaviour for the March 1978 flood event:
The replication of the gauge levels at Murwillumbah and Condong (see Figure 4-23) indicates the model adequately represents the flooding behaviour at Murwillumbah. The peak of the flood is under predicted. However, as this is not a consistent issue with the other historical events, it is thought this is due to inaccurate rainfall patterns adopted for this event, which is limited by the rainfall data available.
Terranora and Cobaki gauges are reasonably replicated (see Figure 4-24).
Barneys Point and Letitia gauges are not well represented. It is thought that this may be due to uncertainties in the entrance bathymetry as discussed in relation to the March 1974 flood (see Section 4.2.2.
In general, it is concluded that the model adequately represents the flood behaviour observed in the March 1978 flood event.
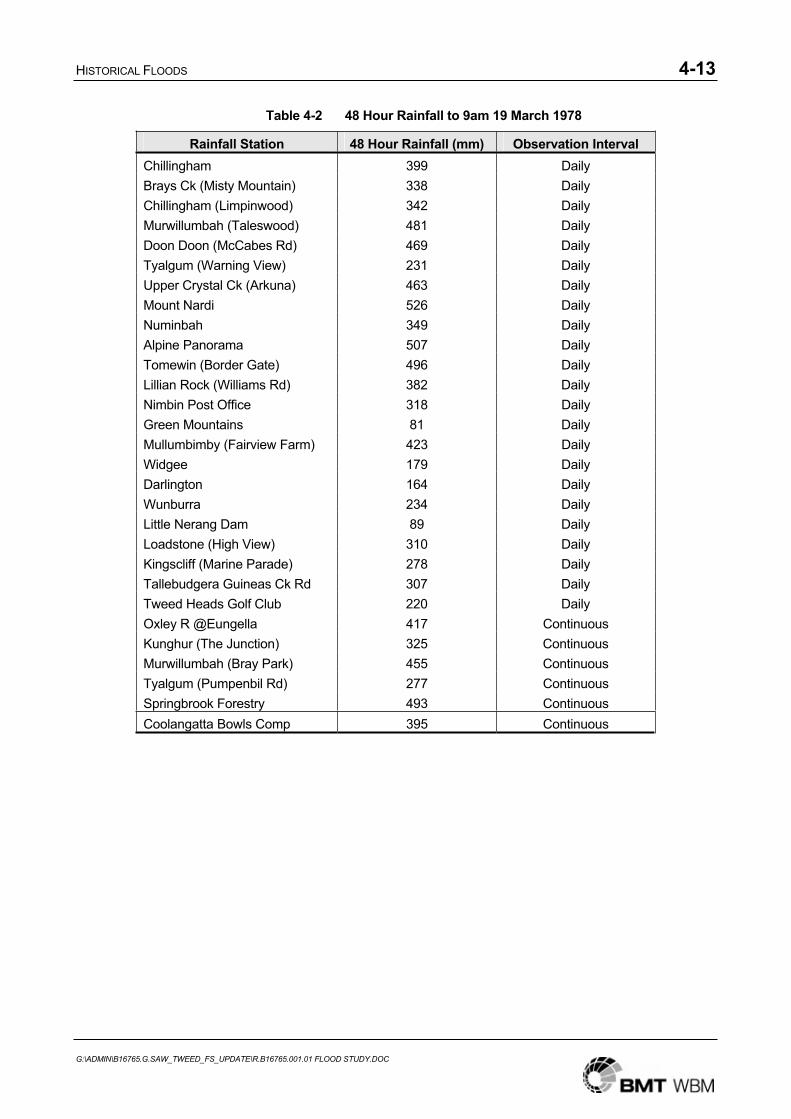
HISTORICAL FLOODS 4-13
G:\ADMIN\B16765.G.SAW_TWEED_FS_UPDATE\R.B16765.001.01 FLOOD STUDY.DOC
Table 4-2 48 Hour Rainfall to 9am 19 March 1978
Rainfall Station 48 Hour Rainfall (mm) Observation Interval Chillingham 399 Daily Brays Ck (Misty Mountain) 338 Daily Chillingham (Limpinwood) 342 Daily Murwillumbah (Taleswood) 481 Daily Doon Doon (McCabes Rd) 469 Daily Tyalgum (Warning View) 231 Daily Upper Crystal Ck (Arkuna) 463 Daily Mount Nardi 526 Daily Numinbah 349 Daily Alpine Panorama 507 Daily Tomewin (Border Gate) 496 Daily Lillian Rock (Williams Rd) 382 Daily Nimbin Post Office 318 Daily Green Mountains 81 Daily Mullumbimby (Fairview Farm) 423 Daily Widgee 179 Daily Darlington 164 Daily Wunburra 234 Daily Little Nerang Dam 89 Daily Loadstone (High View) 310 Daily Kingscliff (Marine Parade) 278 Daily Tallebudgera Guineas Ck Rd 307 Daily Tweed Heads Golf Club 220 Daily Oxley R @Eungella 417 Continuous Kunghur (The Junction) 325 Continuous Murwillumbah (Bray Park) 455 Continuous Tyalgum (Pumpenbil Rd) 277 Continuous Springbrook Forestry 493 Continuous Coolangatta Bowls Comp 395 Continuous

HISTORICAL FLOODS 4-14
G:\ADMIN\B16765.G.SAW_TWEED_FS_UPDATE\R.B16765.001.01 FLOOD STUDY.DOC
0
10
20
30
40
50
60
70
17/0
3/19
78 9
:00
17/0
3/19
78 1
2:00
17/0
3/19
78 1
5:00
17/0
3/19
78 1
8:00
17/0
3/19
78 2
1:00
18/0
3/19
78 0
:00
18/0
3/19
78 3
:00
18/0
3/19
78 6
:00
18/0
3/19
78 9
:00
18/0
3/19
78 1
2:00
18/0
3/19
78 1
5:00
18/0
3/19
78 1
8:00
18/0
3/19
78 2
1:00
19/0
3/19
78 0
:00
19/0
3/19
78 3
:00
19/0
3/19
78 6
:00
19/0
3/19
78 9
:00
Hou
rly R
ainf
all D
epth
[mm
]
Figure 4-13 Coolangatta Bowls Comp Pluviometer, March 1978
0
10
20
30
40
50
60
70
17/0
3/19
78 9
:00
17/0
3/19
78 1
2:00
17/0
3/19
78 1
5:00
17/0
3/19
78 1
8:00
17/0
3/19
78 2
1:00
18/0
3/19
78 0
:00
18/0
3/19
78 3
:00
18/0
3/19
78 6
:00
18/0
3/19
78 9
:00
18/0
3/19
78 1
2:00
18/0
3/19
78 1
5:00
18/0
3/19
78 1
8:00
18/0
3/19
78 2
1:00
19/0
3/19
78 0
:00
19/0
3/19
78 3
:00
19/0
3/19
78 6
:00
19/0
3/19
78 9
:00
Hou
rly R
ainf
all D
epth
[mm
]
Figure 4-14 Murwillumbah (Bray Park) Pluviometer, March 1978
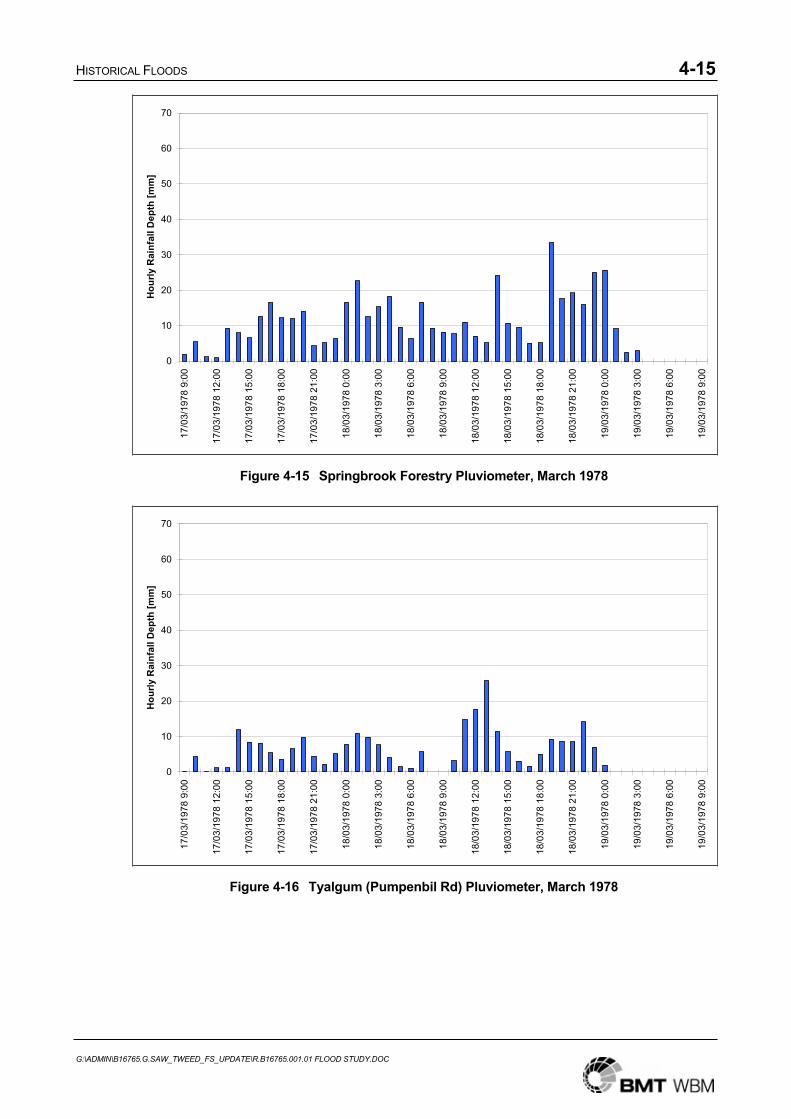
HISTORICAL FLOODS 4-15
G:\ADMIN\B16765.G.SAW_TWEED_FS_UPDATE\R.B16765.001.01 FLOOD STUDY.DOC
0
10
20
30
40
50
60
70
17/0
3/19
78 9
:00
17/0
3/19
78 1
2:00
17/0
3/19
78 1
5:00
17/0
3/19
78 1
8:00
17/0
3/19
78 2
1:00
18/0
3/19
78 0
:00
18/0
3/19
78 3
:00
18/0
3/19
78 6
:00
18/0
3/19
78 9
:00
18/0
3/19
78 1
2:00
18/0
3/19
78 1
5:00
18/0
3/19
78 1
8:00
18/0
3/19
78 2
1:00
19/0
3/19
78 0
:00
19/0
3/19
78 3
:00
19/0
3/19
78 6
:00
19/0
3/19
78 9
:00
Hou
rly R
ainf
all D
epth
[mm
]
Figure 4-15 Springbrook Forestry Pluviometer, March 1978
0
10
20
30
40
50
60
70
17/0
3/19
78 9
:00
17/0
3/19
78 1
2:00
17/0
3/19
78 1
5:00
17/0
3/19
78 1
8:00
17/0
3/19
78 2
1:00
18/0
3/19
78 0
:00
18/0
3/19
78 3
:00
18/0
3/19
78 6
:00
18/0
3/19
78 9
:00
18/0
3/19
78 1
2:00
18/0
3/19
78 1
5:00
18/0
3/19
78 1
8:00
18/0
3/19
78 2
1:00
19/0
3/19
78 0
:00
19/0
3/19
78 3
:00
19/0
3/19
78 6
:00
19/0
3/19
78 9
:00
Hou
rly R
ainf
all D
epth
[mm
]
Figure 4-16 Tyalgum (Pumpenbil Rd) Pluviometer, March 1978
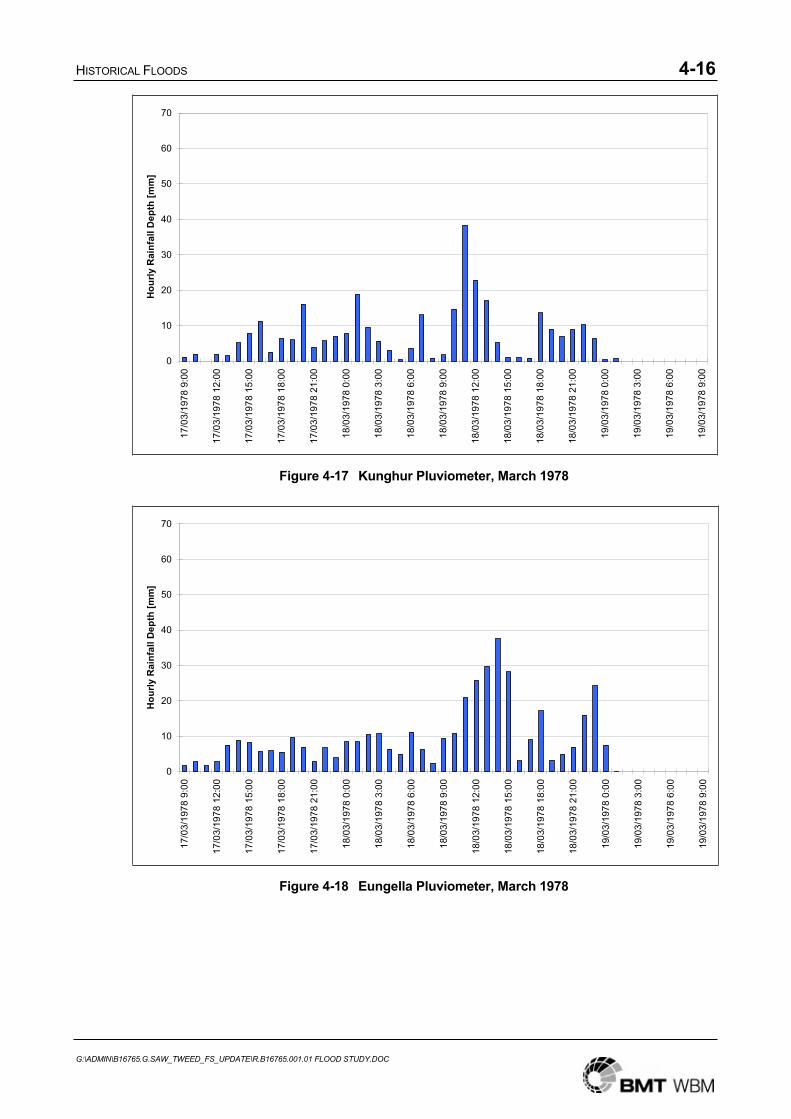
HISTORICAL FLOODS 4-16
G:\ADMIN\B16765.G.SAW_TWEED_FS_UPDATE\R.B16765.001.01 FLOOD STUDY.DOC
0
10
20
30
40
50
60
70
17/0
3/19
78 9
:00
17/0
3/19
78 1
2:00
17/0
3/19
78 1
5:00
17/0
3/19
78 1
8:00
17/0
3/19
78 2
1:00
18/0
3/19
78 0
:00
18/0
3/19
78 3
:00
18/0
3/19
78 6
:00
18/0
3/19
78 9
:00
18/0
3/19
78 1
2:00
18/0
3/19
78 1
5:00
18/0
3/19
78 1
8:00
18/0
3/19
78 2
1:00
19/0
3/19
78 0
:00
19/0
3/19
78 3
:00
19/0
3/19
78 6
:00
19/0
3/19
78 9
:00
Hou
rly R
ainf
all D
epth
[mm
]
Figure 4-17 Kunghur Pluviometer, March 1978
0
10
20
30
40
50
60
70
17/0
3/19
78 9
:00
17/0
3/19
78 1
2:00
17/0
3/19
78 1
5:00
17/0
3/19
78 1
8:00
17/0
3/19
78 2
1:00
18/0
3/19
78 0
:00
18/0
3/19
78 3
:00
18/0
3/19
78 6
:00
18/0
3/19
78 9
:00
18/0
3/19
78 1
2:00
18/0
3/19
78 1
5:00
18/0
3/19
78 1
8:00
18/0
3/19
78 2
1:00
19/0
3/19
78 0
:00
19/0
3/19
78 3
:00
19/0
3/19
78 6
:00
19/0
3/19
78 9
:00
Hou
rly R
ainf
all D
epth
[mm
]
Figure 4-18 Eungella Pluviometer, March 1978
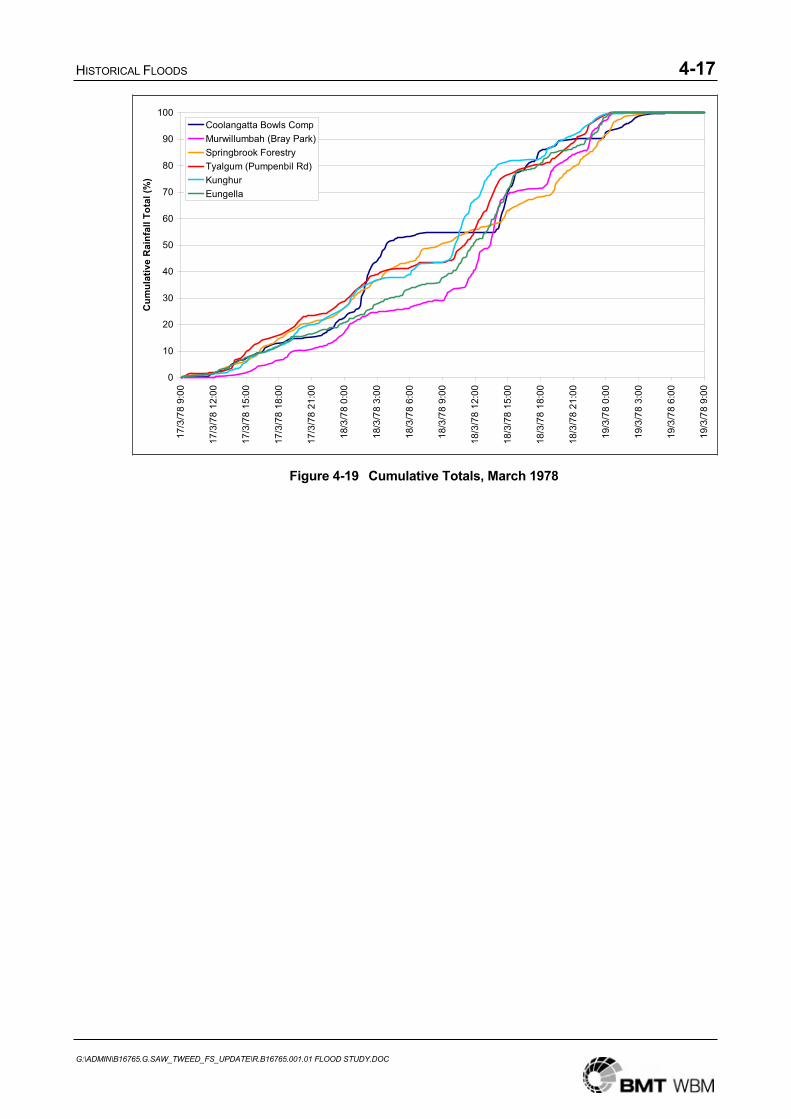
HISTORICAL FLOODS 4-17
G:\ADMIN\B16765.G.SAW_TWEED_FS_UPDATE\R.B16765.001.01 FLOOD STUDY.DOC
0
10
20
30
40
50
60
70
80
90
100
17/3
/78
9:00
17/3
/78
12:0
0
17/3
/78
15:0
0
17/3
/78
18:0
0
17/3
/78
21:0
0
18/3
/78
0:00
18/3
/78
3:00
18/3
/78
6:00
18/3
/78
9:00
18/3
/78
12:0
0
18/3
/78
15:0
0
18/3
/78
18:0
0
18/3
/78
21:0
0
19/3
/78
0:00
19/3
/78
3:00
19/3
/78
6:00
19/3
/78
9:00
Cum
ulat
ive
Rai
nfal
l Tot
al (%
)
Coolangatta Bowls CompMurwillumbah (Bray Park)Springbrook ForestryTyalgum (Pumpenbil Rd)KunghurEungella
Figure 4-19 Cumulative Totals, March 1978
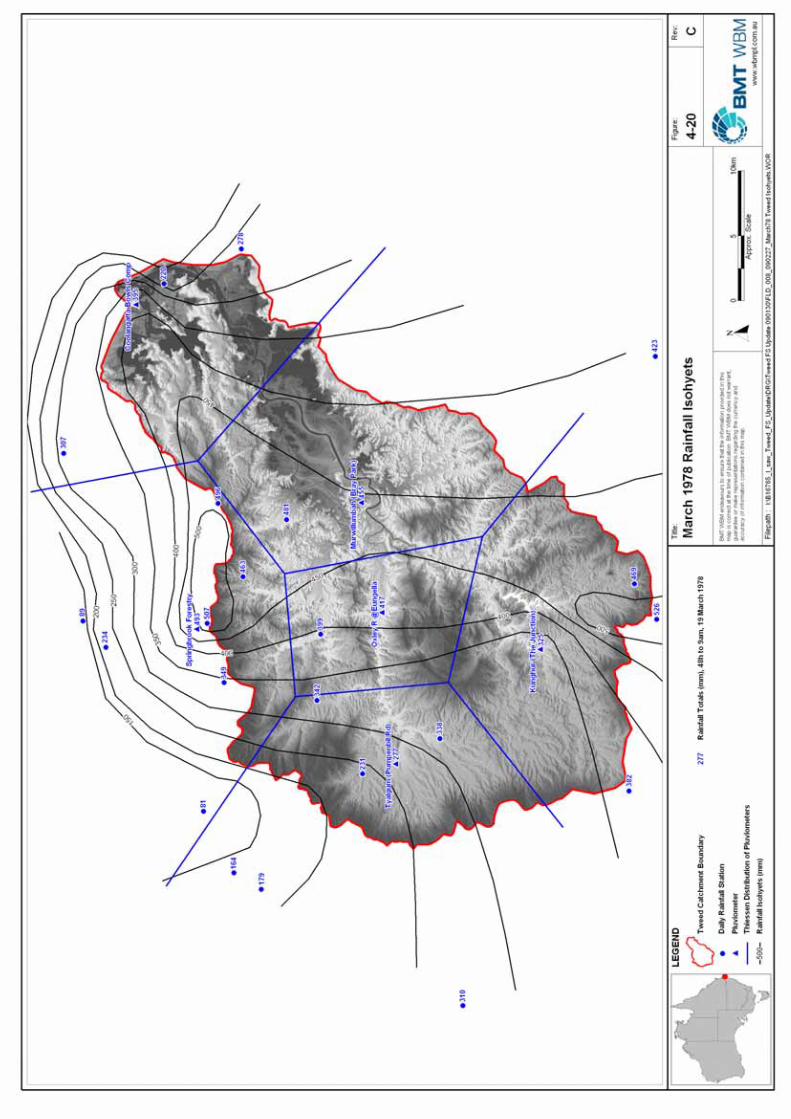

HISTORICAL FLOODS 4-19
G:\ADMIN\B16765.G.SAW_TWEED_FS_UPDATE\R.B16765.001.01 FLOOD STUDY.DOC
0
25
50
75
100
125
150
175
200
225
17/0
3/19
78 9
:00
17/0
3/19
78 1
5:00
17/0
3/19
78 2
1:00
18/0
3/19
78 3
:00
18/0
3/19
78 9
:00
18/0
3/19
78 1
5:00
18/0
3/19
78 2
1:00
19/0
3/19
78 3
:00
19/0
3/19
78 9
:00
Pred
icte
d Fl
ow [c
umec
s]PigabeenCobakiBilambilDuroby
Figure 4-21 Modelled Hydrographs, Lower Tweed, March 1978
0
200
400
600
800
1000
1200
1400
1600
1800
2000
17/0
3/19
78 9
:00
17/0
3/19
78 1
2:00
17/0
3/19
78 1
5:00
17/0
3/19
78 1
8:00
17/0
3/19
78 2
1:00
18/0
3/19
78 0
:00
18/0
3/19
78 3
:00
18/0
3/19
78 6
:00
18/0
3/19
78 9
:00
18/0
3/19
78 1
2:00
18/0
3/19
78 1
5:00
18/0
3/19
78 1
8:00
18/0
3/19
78 2
1:00
19/0
3/19
78 0
:00
19/0
3/19
78 3
:00
19/0
3/19
78 6
:00
19/0
3/19
78 9
:00
19/0
3/19
78 1
2:00
Pred
icte
d Fl
ow [c
umec
s]
DunbibleRous RiverMiddle ArmSouth Arm
Figure 4-22 Modelled Hydrographs, Upper Tweed, March 1978
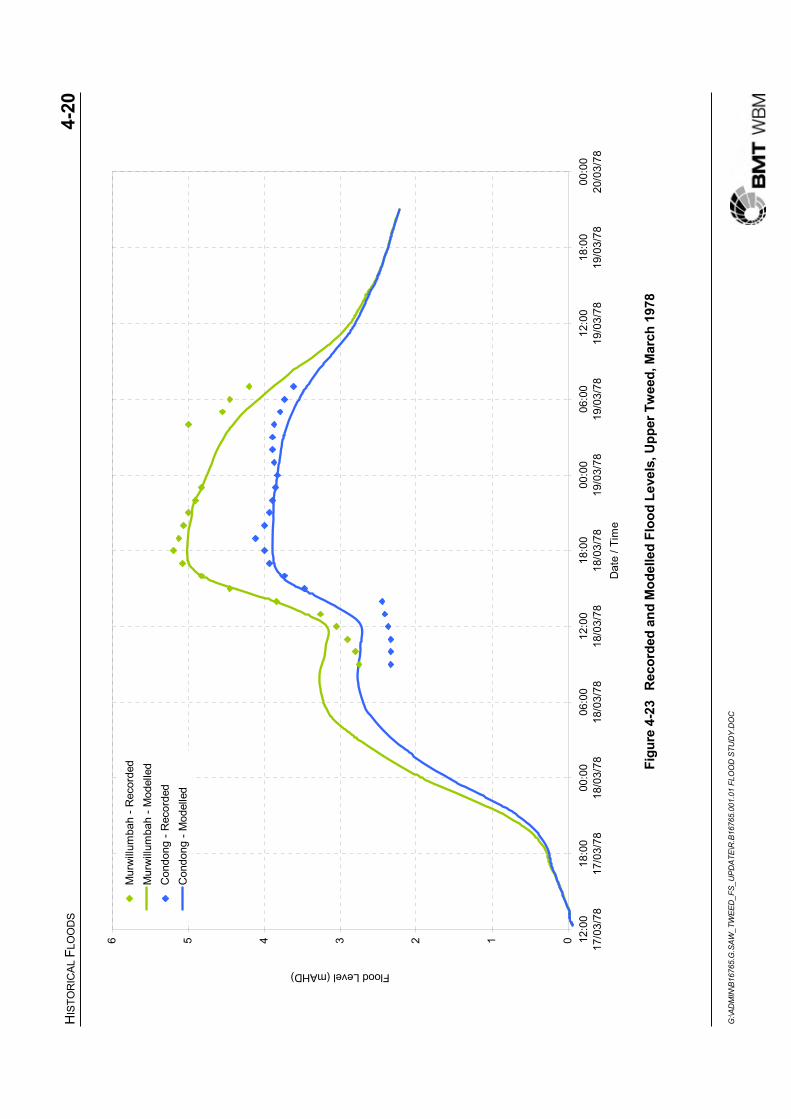
HIS
TOR
ICAL
FLO
OD
S4-
20
G:\A
DM
IN\B
1676
5.G
.SAW
_TW
EED
_FS_
UPD
ATE\
R.B
1676
5.00
1.01
FLO
OD
STU
DY.
DO
C
0123456 12:0
017
/03/
7818
:00
17/0
3/78
00:0
018
/03/
7806
:00
18/0
3/78
12:0
018
/03/
7818
:00
18/0
3/78
00:0
019
/03/
7806
:00
19/0
3/78
12:0
019
/03/
7818
:00
19/0
3/78
00:0
020
/03/
78D
ate
/ Tim
e
Flood Level (mAHD)M
urw
illum
bah
- Rec
orde
dM
urw
illum
bah
- Mod
elle
dC
ondo
ng -
Rec
orde
dC
ondo
ng -
Mod
elle
d
Figu
re 4
-23
Rec
orde
d an
d M
odel
led
Floo
d Le
vels
, Upp
er T
wee
d, M
arch
197
8

HIS
TOR
ICAL
FLO
OD
S4-
21
G:\A
DM
IN\B
1676
5.G
.SAW
_TW
EED
_FS_
UPD
ATE\
R.B
1676
5.00
1.01
FLO
OD
STU
DY.
DO
C
-101234 12:0
017
/03/
7818
:00
17/0
3/78
00:0
018
/03/
7806
:00
18/0
3/78
12:0
018
/03/
7818
:00
18/0
3/78
00:0
019
/03/
7806
:00
19/0
3/78
12:0
019
/03/
7818
:00
19/0
3/78
00:0
020
/03/
78
Dat
e / T
ime
Flood Level (mAHD)
Barn
eys
Poin
t - R
ecor
ded
Barn
eys
Poin
t - M
odel
led
Cob
aki -
Rec
orde
d
Cob
aki -
Mod
elle
dTe
rran
ora
- Rec
orde
d
Terr
anor
a - M
odel
led
Letit
ia 2
A - R
ecor
ded
Letit
ia 2
A - M
odel
led
Figu
re 4
-24
Rec
orde
d an
d M
odel
led
Floo
d Le
vels
, Low
er T
wee
d, M
arch
197
8
HISTORICAL FLOODS 4-22
G:\ADMIN\B16765.G.SAW_TWEED_FS_UPDATE\R.B16765.001.01 FLOOD STUDY.DOC
4.4 April 1989
4.4.1 Recorded and Modelled Data
Table 4-3 summarises the rainfall data for the 72 hour period to 9am 3 April 1989, measured at 25 daily stations and 7 pluviometers. Figure 4-25 to Figure 4-32 show the temporal patterns from the pluviometers (hourly and cumulative) and Figure 4-33 shows the spatial distribution of the recorded rainfall. The modelled inflows from WBNM are shown in Figure 4-34 and Figure 4-35 for the lower and upper Tweed tributaries respectively.
Figure 4-36 shows plots of modelled and recorded flood levels at the Murwillumbah and Tumbulgum gauges. Figure 4-37 shows the same plots at the Lower Tweed and Broadwater gauges.
4.4.2 Discussion
The following comments are made in relation to the model’s replication of observed flood behaviour for the April 1989 flood event:
The replication of the gauge levels at Murwillumbah (see Figure 4-36) indicates the model adequately represents the flooding behaviour at Murwillumbah. The peak level in the model is higher than the recorded level. The over prediction at Murwillumbah is thought to be possibly due to inaccurate representation of the local levee / bank heights of the day, as it appears that some overtopping may have occurred when the gauge was at approximately 5.6 mAHD that may not be represented in the model.
The Tumbulgum Gauge is well replicated, particularly the rise and peak.
Cobaki and Terranora gauges are reasonably well replicated (with slight over prediction of the high tide on the evening of the 2nd.
Letitia and Barneys Point are over predicting the peak on the evening of the 2nd. Given the observations at the Broadwaters above, this is likely due to discrepancies in the actual tide levels and the predicted tide levels that were adopted for the downstream ocean level boundary.
In general, it is concluded that the model adequately represents the flood behaviour observed in the April 1989 flood event.
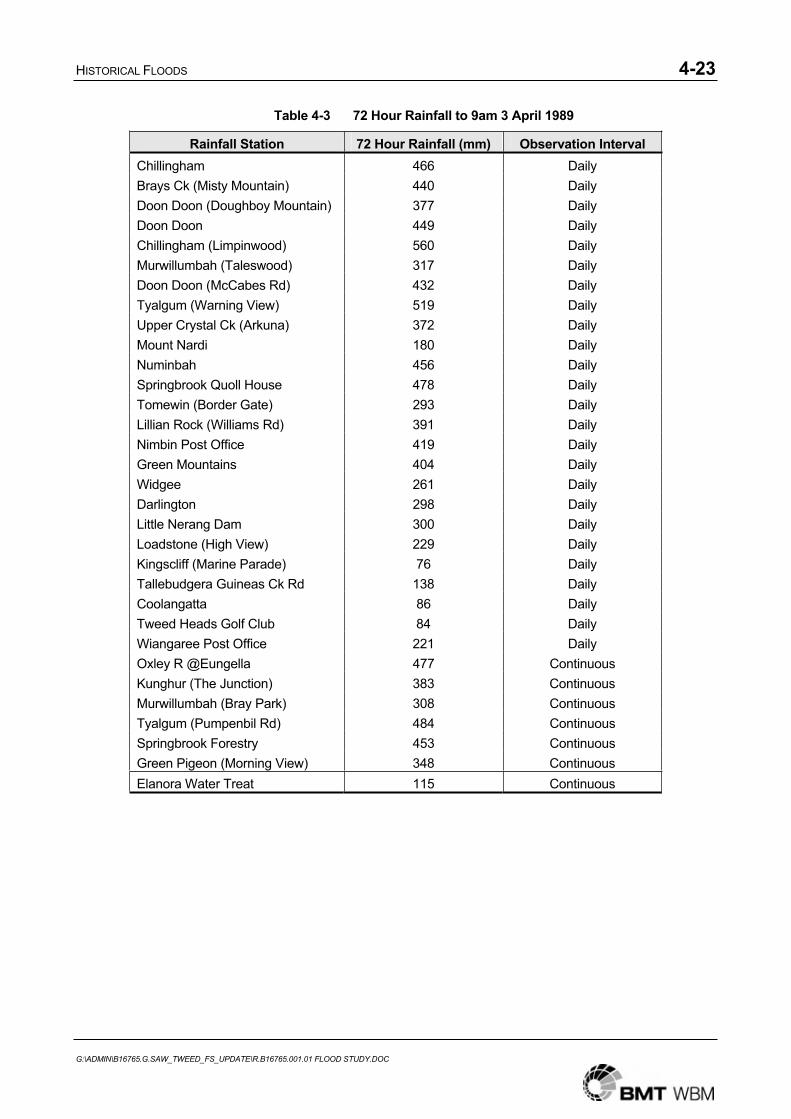
HISTORICAL FLOODS 4-23
G:\ADMIN\B16765.G.SAW_TWEED_FS_UPDATE\R.B16765.001.01 FLOOD STUDY.DOC
Table 4-3 72 Hour Rainfall to 9am 3 April 1989
Rainfall Station 72 Hour Rainfall (mm) Observation Interval Chillingham 466 Daily Brays Ck (Misty Mountain) 440 Daily Doon Doon (Doughboy Mountain) 377 Daily Doon Doon 449 Daily Chillingham (Limpinwood) 560 Daily Murwillumbah (Taleswood) 317 Daily Doon Doon (McCabes Rd) 432 Daily Tyalgum (Warning View) 519 Daily Upper Crystal Ck (Arkuna) 372 Daily Mount Nardi 180 Daily Numinbah 456 Daily Springbrook Quoll House 478 Daily Tomewin (Border Gate) 293 Daily Lillian Rock (Williams Rd) 391 Daily Nimbin Post Office 419 Daily Green Mountains 404 Daily Widgee 261 Daily Darlington 298 Daily Little Nerang Dam 300 Daily Loadstone (High View) 229 Daily Kingscliff (Marine Parade) 76 Daily Tallebudgera Guineas Ck Rd 138 Daily Coolangatta 86 Daily Tweed Heads Golf Club 84 Daily Wiangaree Post Office 221 Daily Oxley R @Eungella 477 Continuous Kunghur (The Junction) 383 Continuous Murwillumbah (Bray Park) 308 Continuous Tyalgum (Pumpenbil Rd) 484 Continuous Springbrook Forestry 453 Continuous Green Pigeon (Morning View) 348 Continuous Elanora Water Treat 115 Continuous
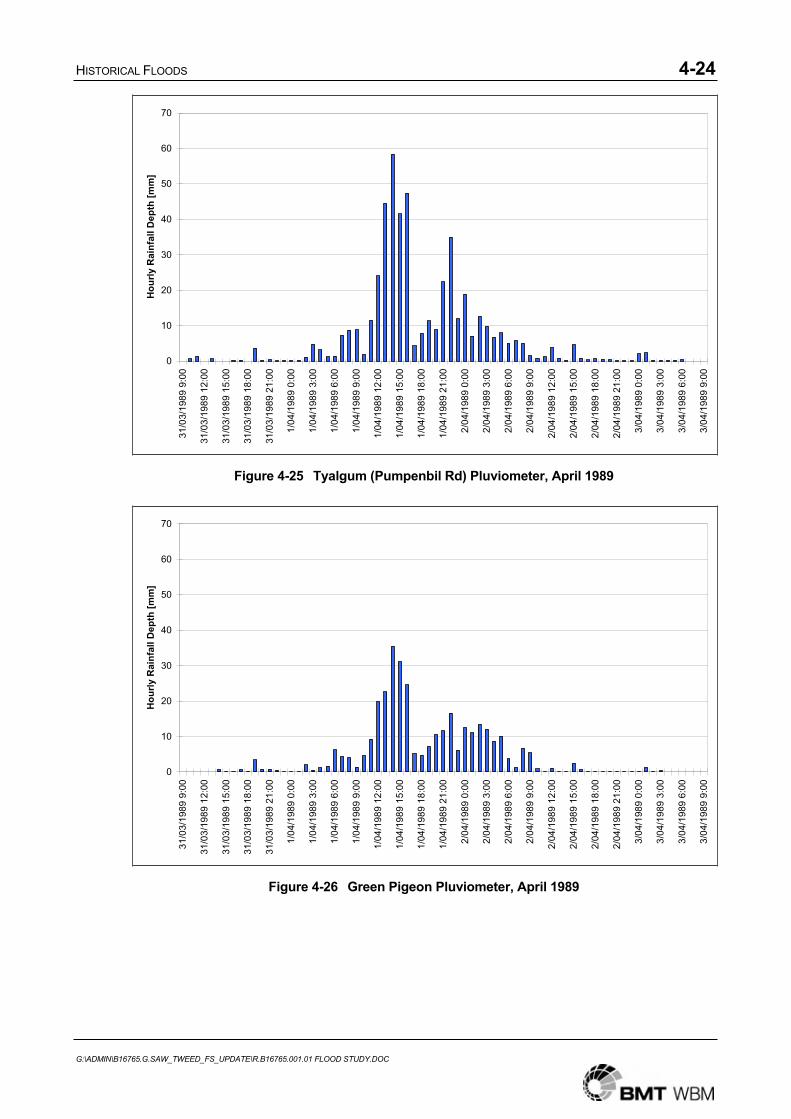
HISTORICAL FLOODS 4-24
G:\ADMIN\B16765.G.SAW_TWEED_FS_UPDATE\R.B16765.001.01 FLOOD STUDY.DOC
0
10
20
30
40
50
60
70
31/0
3/19
89 9
:00
31/0
3/19
89 1
2:00
31/0
3/19
89 1
5:00
31/0
3/19
89 1
8:00
31/0
3/19
89 2
1:00
1/04
/198
9 0:
00
1/04
/198
9 3:
00
1/04
/198
9 6:
00
1/04
/198
9 9:
00
1/04
/198
9 12
:00
1/04
/198
9 15
:00
1/04
/198
9 18
:00
1/04
/198
9 21
:00
2/04
/198
9 0:
00
2/04
/198
9 3:
00
2/04
/198
9 6:
00
2/04
/198
9 9:
00
2/04
/198
9 12
:00
2/04
/198
9 15
:00
2/04
/198
9 18
:00
2/04
/198
9 21
:00
3/04
/198
9 0:
00
3/04
/198
9 3:
00
3/04
/198
9 6:
00
3/04
/198
9 9:
00
Hou
rly R
ainf
all D
epth
[mm
]
Figure 4-25 Tyalgum (Pumpenbil Rd) Pluviometer, April 1989
0
10
20
30
40
50
60
70
31/0
3/19
89 9
:00
31/0
3/19
89 1
2:00
31/0
3/19
89 1
5:00
31/0
3/19
89 1
8:00
31/0
3/19
89 2
1:00
1/04
/198
9 0:
00
1/04
/198
9 3:
00
1/04
/198
9 6:
00
1/04
/198
9 9:
00
1/04
/198
9 12
:00
1/04
/198
9 15
:00
1/04
/198
9 18
:00
1/04
/198
9 21
:00
2/04
/198
9 0:
00
2/04
/198
9 3:
00
2/04
/198
9 6:
00
2/04
/198
9 9:
00
2/04
/198
9 12
:00
2/04
/198
9 15
:00
2/04
/198
9 18
:00
2/04
/198
9 21
:00
3/04
/198
9 0:
00
3/04
/198
9 3:
00
3/04
/198
9 6:
00
3/04
/198
9 9:
00
Hou
rly R
ainf
all D
epth
[mm
]
Figure 4-26 Green Pigeon Pluviometer, April 1989
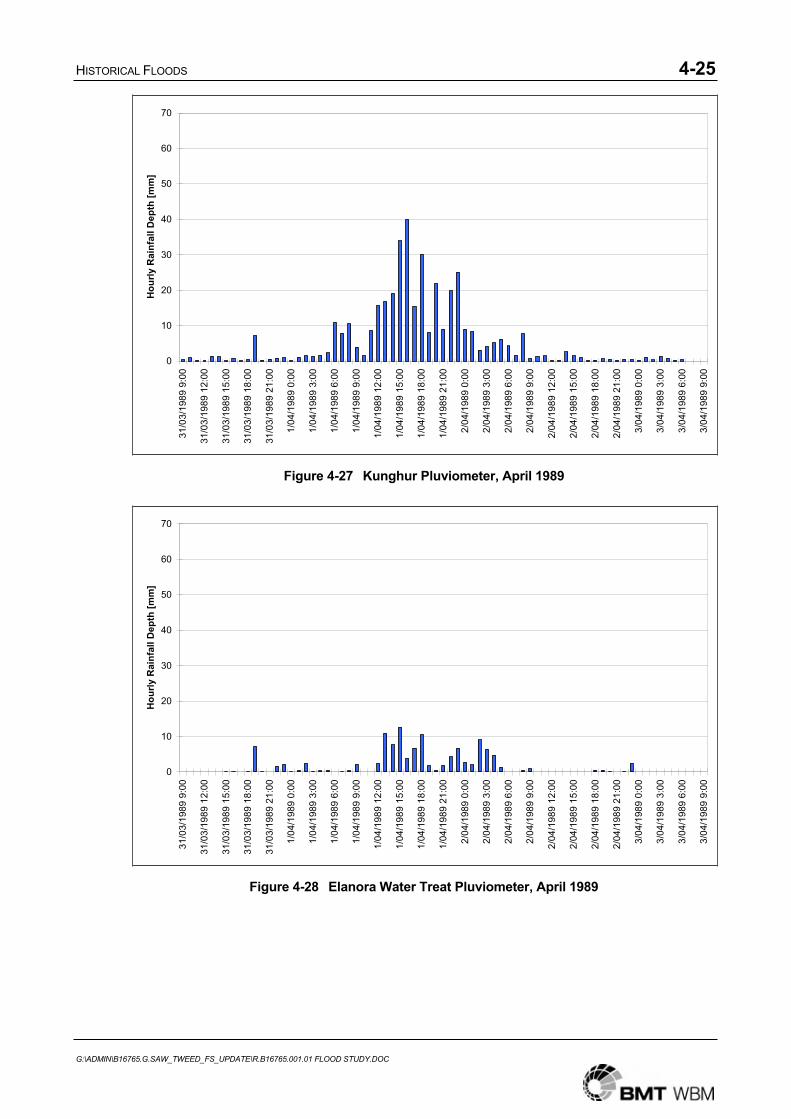
HISTORICAL FLOODS 4-25
G:\ADMIN\B16765.G.SAW_TWEED_FS_UPDATE\R.B16765.001.01 FLOOD STUDY.DOC
0
10
20
30
40
50
60
70
31/0
3/19
89 9
:00
31/0
3/19
89 1
2:00
31/0
3/19
89 1
5:00
31/0
3/19
89 1
8:00
31/0
3/19
89 2
1:00
1/04
/198
9 0:
00
1/04
/198
9 3:
00
1/04
/198
9 6:
00
1/04
/198
9 9:
00
1/04
/198
9 12
:00
1/04
/198
9 15
:00
1/04
/198
9 18
:00
1/04
/198
9 21
:00
2/04
/198
9 0:
00
2/04
/198
9 3:
00
2/04
/198
9 6:
00
2/04
/198
9 9:
00
2/04
/198
9 12
:00
2/04
/198
9 15
:00
2/04
/198
9 18
:00
2/04
/198
9 21
:00
3/04
/198
9 0:
00
3/04
/198
9 3:
00
3/04
/198
9 6:
00
3/04
/198
9 9:
00
Hou
rly R
ainf
all D
epth
[mm
]
Figure 4-27 Kunghur Pluviometer, April 1989
0
10
20
30
40
50
60
70
31/0
3/19
89 9
:00
31/0
3/19
89 1
2:00
31/0
3/19
89 1
5:00
31/0
3/19
89 1
8:00
31/0
3/19
89 2
1:00
1/04
/198
9 0:
00
1/04
/198
9 3:
00
1/04
/198
9 6:
00
1/04
/198
9 9:
00
1/04
/198
9 12
:00
1/04
/198
9 15
:00
1/04
/198
9 18
:00
1/04
/198
9 21
:00
2/04
/198
9 0:
00
2/04
/198
9 3:
00
2/04
/198
9 6:
00
2/04
/198
9 9:
00
2/04
/198
9 12
:00
2/04
/198
9 15
:00
2/04
/198
9 18
:00
2/04
/198
9 21
:00
3/04
/198
9 0:
00
3/04
/198
9 3:
00
3/04
/198
9 6:
00
3/04
/198
9 9:
00
Hou
rly R
ainf
all D
epth
[mm
]
Figure 4-28 Elanora Water Treat Pluviometer, April 1989
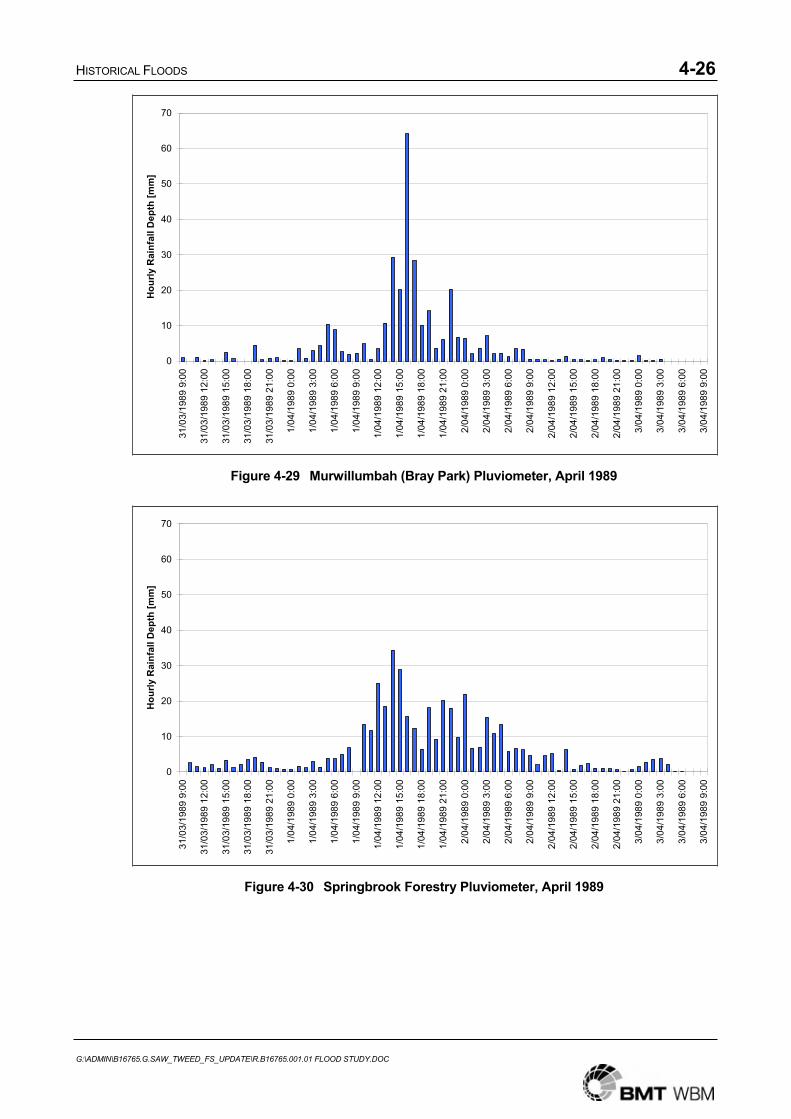
HISTORICAL FLOODS 4-26
G:\ADMIN\B16765.G.SAW_TWEED_FS_UPDATE\R.B16765.001.01 FLOOD STUDY.DOC
0
10
20
30
40
50
60
70
31/0
3/19
89 9
:00
31/0
3/19
89 1
2:00
31/0
3/19
89 1
5:00
31/0
3/19
89 1
8:00
31/0
3/19
89 2
1:00
1/04
/198
9 0:
00
1/04
/198
9 3:
00
1/04
/198
9 6:
00
1/04
/198
9 9:
00
1/04
/198
9 12
:00
1/04
/198
9 15
:00
1/04
/198
9 18
:00
1/04
/198
9 21
:00
2/04
/198
9 0:
00
2/04
/198
9 3:
00
2/04
/198
9 6:
00
2/04
/198
9 9:
00
2/04
/198
9 12
:00
2/04
/198
9 15
:00
2/04
/198
9 18
:00
2/04
/198
9 21
:00
3/04
/198
9 0:
00
3/04
/198
9 3:
00
3/04
/198
9 6:
00
3/04
/198
9 9:
00
Hou
rly R
ainf
all D
epth
[mm
]
Figure 4-29 Murwillumbah (Bray Park) Pluviometer, April 1989
0
10
20
30
40
50
60
70
31/0
3/19
89 9
:00
31/0
3/19
89 1
2:00
31/0
3/19
89 1
5:00
31/0
3/19
89 1
8:00
31/0
3/19
89 2
1:00
1/04
/198
9 0:
00
1/04
/198
9 3:
00
1/04
/198
9 6:
00
1/04
/198
9 9:
00
1/04
/198
9 12
:00
1/04
/198
9 15
:00
1/04
/198
9 18
:00
1/04
/198
9 21
:00
2/04
/198
9 0:
00
2/04
/198
9 3:
00
2/04
/198
9 6:
00
2/04
/198
9 9:
00
2/04
/198
9 12
:00
2/04
/198
9 15
:00
2/04
/198
9 18
:00
2/04
/198
9 21
:00
3/04
/198
9 0:
00
3/04
/198
9 3:
00
3/04
/198
9 6:
00
3/04
/198
9 9:
00
Hou
rly R
ainf
all D
epth
[mm
]
Figure 4-30 Springbrook Forestry Pluviometer, April 1989

HISTORICAL FLOODS 4-27
G:\ADMIN\B16765.G.SAW_TWEED_FS_UPDATE\R.B16765.001.01 FLOOD STUDY.DOC
0
10
20
30
40
50
60
70
31/0
3/19
89 9
:00
31/0
3/19
89 1
2:00
31/0
3/19
89 1
5:00
31/0
3/19
89 1
8:00
31/0
3/19
89 2
1:00
1/04
/198
9 0:
00
1/04
/198
9 3:
00
1/04
/198
9 6:
00
1/04
/198
9 9:
00
1/04
/198
9 12
:00
1/04
/198
9 15
:00
1/04
/198
9 18
:00
1/04
/198
9 21
:00
2/04
/198
9 0:
00
2/04
/198
9 3:
00
2/04
/198
9 6:
00
2/04
/198
9 9:
00
2/04
/198
9 12
:00
2/04
/198
9 15
:00
2/04
/198
9 18
:00
2/04
/198
9 21
:00
3/04
/198
9 0:
00
3/04
/198
9 3:
00
3/04
/198
9 6:
00
3/04
/198
9 9:
00
Hou
rly R
ainf
all D
epth
[mm
]
Figure 4-31 Eungella Pluviometer, April 1989
0
10
20
30
40
50
60
70
80
90
100
31/3
/198
9 9:
00
31/3
/198
9 12
:00
31/3
/198
9 15
:00
31/3
/198
9 18
:00
31/3
/198
9 21
:00
1/4/
1989
0:0
0
1/4/
1989
3:0
0
1/4/
1989
6:0
0
1/4/
1989
9:0
0
1/4/
1989
12:
00
1/4/
1989
15:
00
1/4/
1989
18:
00
1/4/
1989
21:
00
2/4/
1989
0:0
0
2/4/
1989
3:0
0
2/4/
1989
6:0
0
2/4/
1989
9:0
0
2/4/
1989
12:
00
2/4/
1989
15:
00
2/4/
1989
18:
00
2/4/
1989
21:
00
3/4/
1989
0:0
0
3/4/
1989
3:0
0
3/4/
1989
6:0
0
3/4/
1989
9:0
0
Cum
ulat
ive
Rai
nfal
l Tot
al(%
)
Tyalgum KerrsGreen PigeonKunghurElanora Water TreatMurwillumbah (Bray Park)Springbrook ForestryEungella
Figure 4-32 Cumulative Totals, April 1989
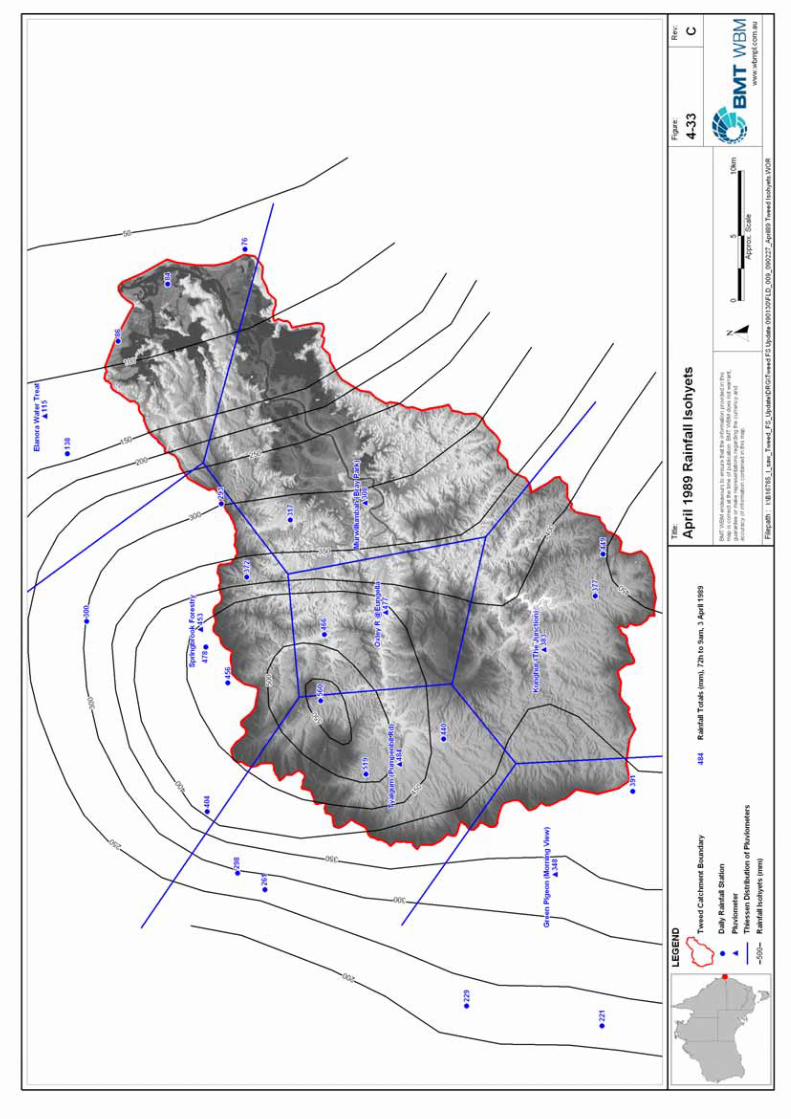
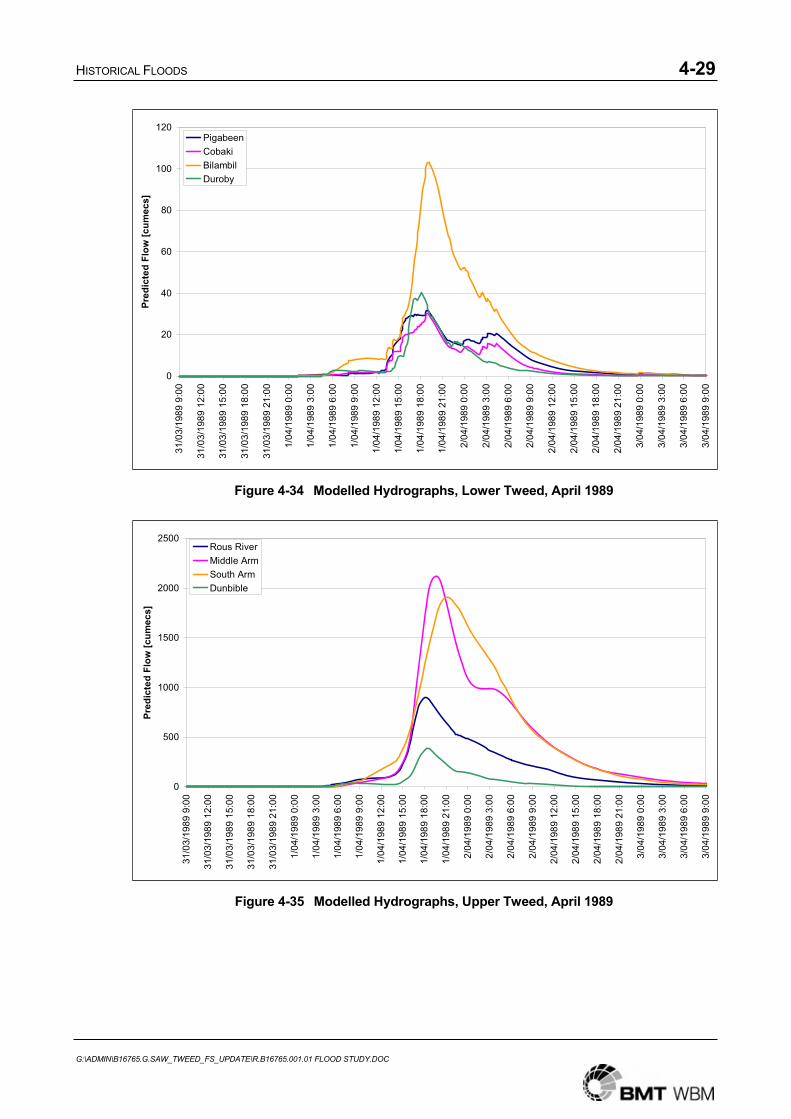
HISTORICAL FLOODS 4-29
G:\ADMIN\B16765.G.SAW_TWEED_FS_UPDATE\R.B16765.001.01 FLOOD STUDY.DOC
0
20
40
60
80
100
120
31/0
3/19
89 9
:00
31/0
3/19
89 1
2:00
31/0
3/19
89 1
5:00
31/0
3/19
89 1
8:00
31/0
3/19
89 2
1:00
1/04
/198
9 0:
00
1/04
/198
9 3:
00
1/04
/198
9 6:
00
1/04
/198
9 9:
00
1/04
/198
9 12
:00
1/04
/198
9 15
:00
1/04
/198
9 18
:00
1/04
/198
9 21
:00
2/04
/198
9 0:
00
2/04
/198
9 3:
00
2/04
/198
9 6:
00
2/04
/198
9 9:
00
2/04
/198
9 12
:00
2/04
/198
9 15
:00
2/04
/198
9 18
:00
2/04
/198
9 21
:00
3/04
/198
9 0:
00
3/04
/198
9 3:
00
3/04
/198
9 6:
00
3/04
/198
9 9:
00
Pred
icte
d Fl
ow [c
umec
s]PigabeenCobakiBilambilDuroby
Figure 4-34 Modelled Hydrographs, Lower Tweed, April 1989
0
500
1000
1500
2000
2500
31/0
3/19
89 9
:00
31/0
3/19
89 1
2:00
31/0
3/19
89 1
5:00
31/0
3/19
89 1
8:00
31/0
3/19
89 2
1:00
1/04
/198
9 0:
00
1/04
/198
9 3:
00
1/04
/198
9 6:
00
1/04
/198
9 9:
00
1/04
/198
9 12
:00
1/04
/198
9 15
:00
1/04
/198
9 18
:00
1/04
/198
9 21
:00
2/04
/198
9 0:
00
2/04
/198
9 3:
00
2/04
/198
9 6:
00
2/04
/198
9 9:
00
2/04
/198
9 12
:00
2/04
/198
9 15
:00
2/04
/198
9 18
:00
2/04
/198
9 21
:00
3/04
/198
9 0:
00
3/04
/198
9 3:
00
3/04
/198
9 6:
00
3/04
/198
9 9:
00
Pred
icte
d Fl
ow [c
umec
s]
Rous RiverMiddle ArmSouth ArmDunbible
Figure 4-35 Modelled Hydrographs, Upper Tweed, April 1989
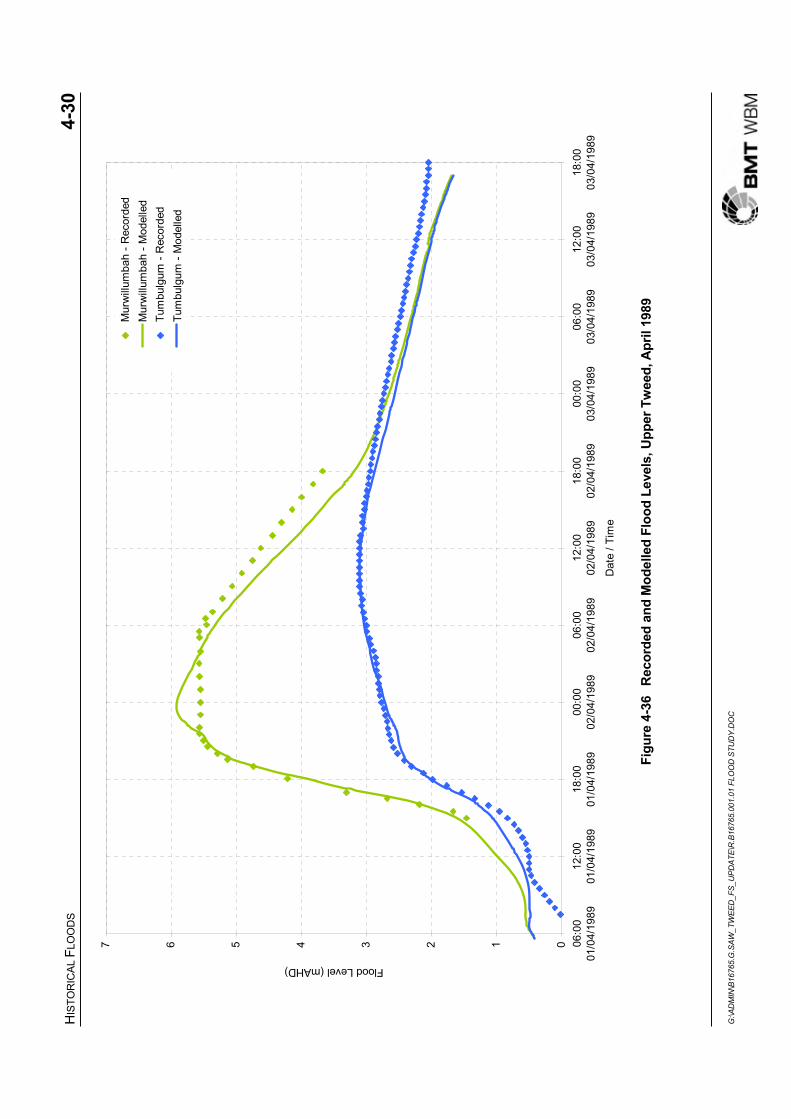
HIS
TOR
ICAL
FLO
OD
S4-
30
G:\A
DM
IN\B
1676
5.G
.SAW
_TW
EED
_FS_
UPD
ATE\
R.B
1676
5.00
1.01
FLO
OD
STU
DY.
DO
C
01234567 06:0
001
/04/
1989
12:0
001
/04/
1989
18:0
001
/04/
1989
00:0
002
/04/
1989
06:0
002
/04/
1989
12:0
002
/04/
1989
18:0
002
/04/
1989
00:0
003
/04/
1989
06:0
003
/04/
1989
12:0
003
/04/
1989
18:0
003
/04/
1989
Dat
e / T
ime
Flood Level (mAHD)
Mur
will
umba
h - R
ecor
ded
Mur
will
umba
h - M
odel
led
Tum
bulg
um -
Rec
orde
dTu
mbu
lgum
- M
odel
led
Figu
re 4
-36
Rec
orde
d an
d M
odel
led
Floo
d Le
vels
, Upp
er T
wee
d, A
pril
1989
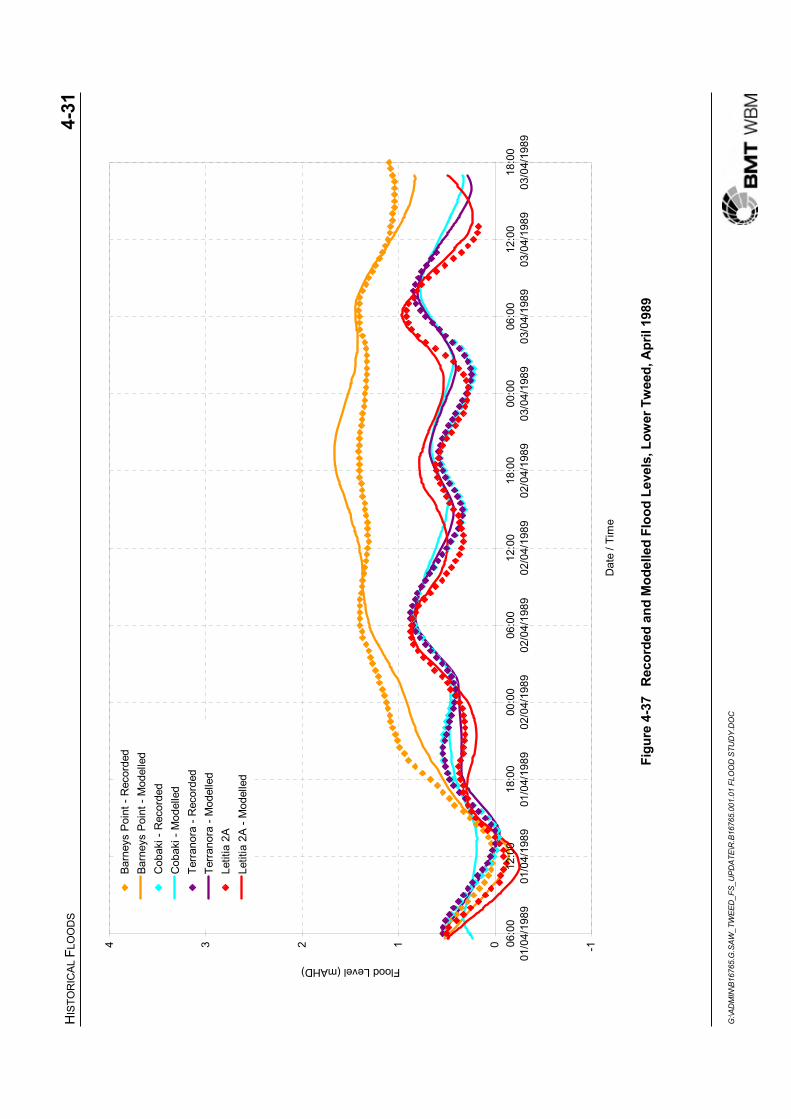
HIS
TOR
ICAL
FLO
OD
S4-
31
G:\A
DM
IN\B
1676
5.G
.SAW
_TW
EED
_FS_
UPD
ATE\
R.B
1676
5.00
1.01
FLO
OD
STU
DY.
DO
C
-101234 06:0
001
/04/
1989
12:0
001
/04/
1989
18:0
001
/04/
1989
00:0
002
/04/
1989
06:0
002
/04/
1989
12:0
002
/04/
1989
18:0
002
/04/
1989
00:0
003
/04/
1989
06:0
003
/04/
1989
12:0
003
/04/
1989
18:0
003
/04/
1989
Dat
e / T
ime
Flood Level (mAHD)
Barn
eys
Poin
t - R
ecor
ded
Barn
eys
Poin
t - M
odel
led
Cob
aki -
Rec
orde
dC
obak
i - M
odel
led
Terr
anor
a - R
ecor
ded
Terr
anor
a - M
odel
led
Letit
ia 2
ALe
titia
2A
- Mod
elle
d
Figu
re 4
-37
Rec
orde
d an
d M
odel
led
Floo
d Le
vels
, Low
er T
wee
d, A
pril
1989
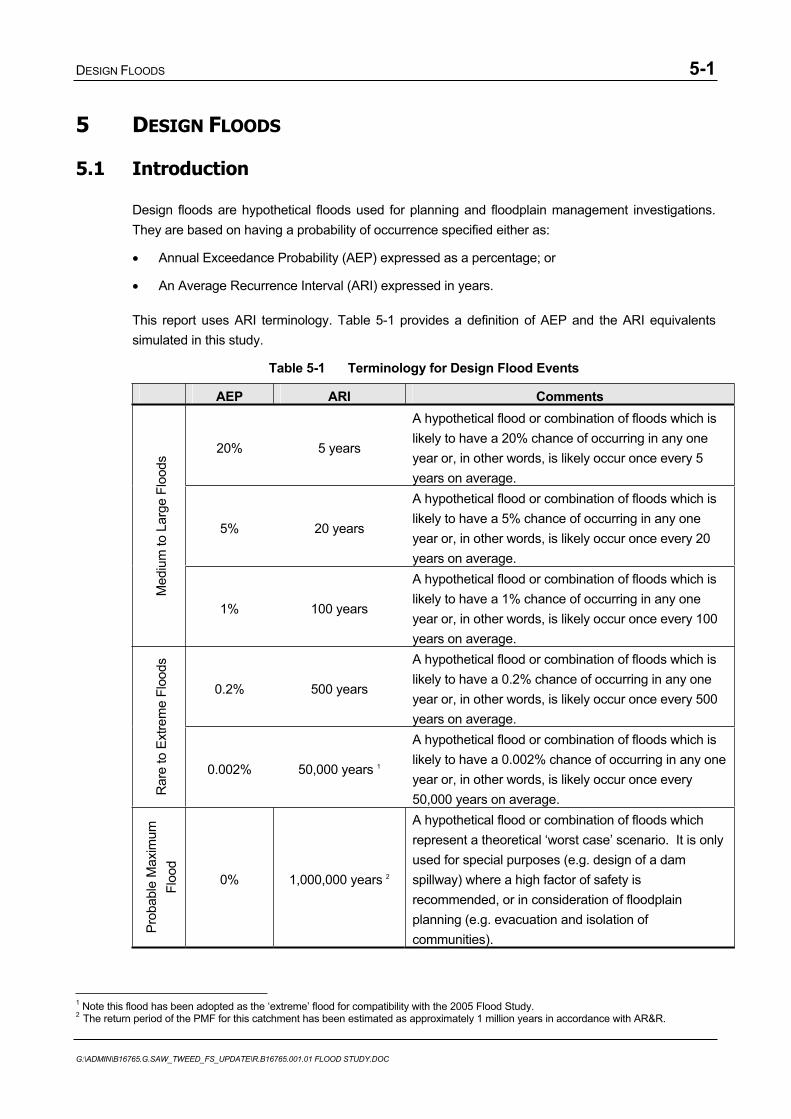
DESIGN FLOODS 5-1
G:\ADMIN\B16765.G.SAW_TWEED_FS_UPDATE\R.B16765.001.01 FLOOD STUDY.DOC
5 DESIGN FLOODS
5.1 Introduction
Design floods are hypothetical floods used for planning and floodplain management investigations. They are based on having a probability of occurrence specified either as:
Annual Exceedance Probability (AEP) expressed as a percentage; or
An Average Recurrence Interval (ARI) expressed in years.
This report uses ARI terminology. Table 5-1 provides a definition of AEP and the ARI equivalents simulated in this study.
Table 5-1 Terminology for Design Flood Events
AEP ARI Comments
20% 5 years
A hypothetical flood or combination of floods which is likely to have a 20% chance of occurring in any one year or, in other words, is likely occur once every 5 years on average.
5% 20 years
A hypothetical flood or combination of floods which is likely to have a 5% chance of occurring in any one year or, in other words, is likely occur once every 20 years on average.
Med
ium
to L
arge
Flo
ods
1% 100 years
A hypothetical flood or combination of floods which is likely to have a 1% chance of occurring in any one year or, in other words, is likely occur once every 100 years on average.
0.2% 500 years
A hypothetical flood or combination of floods which is likely to have a 0.2% chance of occurring in any one year or, in other words, is likely occur once every 500 years on average.
Rar
e to
Ext
rem
e Fl
oods
0.002% 50,000 years 1
A hypothetical flood or combination of floods which is likely to have a 0.002% chance of occurring in any one year or, in other words, is likely occur once every 50,000 years on average.
Prob
able
Max
imum
Fl
ood
0% 1,000,000 years 2
A hypothetical flood or combination of floods which represent a theoretical ‘worst case’ scenario. It is only used for special purposes (e.g. design of a dam spillway) where a high factor of safety is recommended, or in consideration of floodplain planning (e.g. evacuation and isolation of communities).
1 Note this flood has been adopted as the ‘extreme’ flood for compatibility with the 2005 Flood Study. 2 The return period of the PMF for this catchment has been estimated as approximately 1 million years in accordance with AR&R.
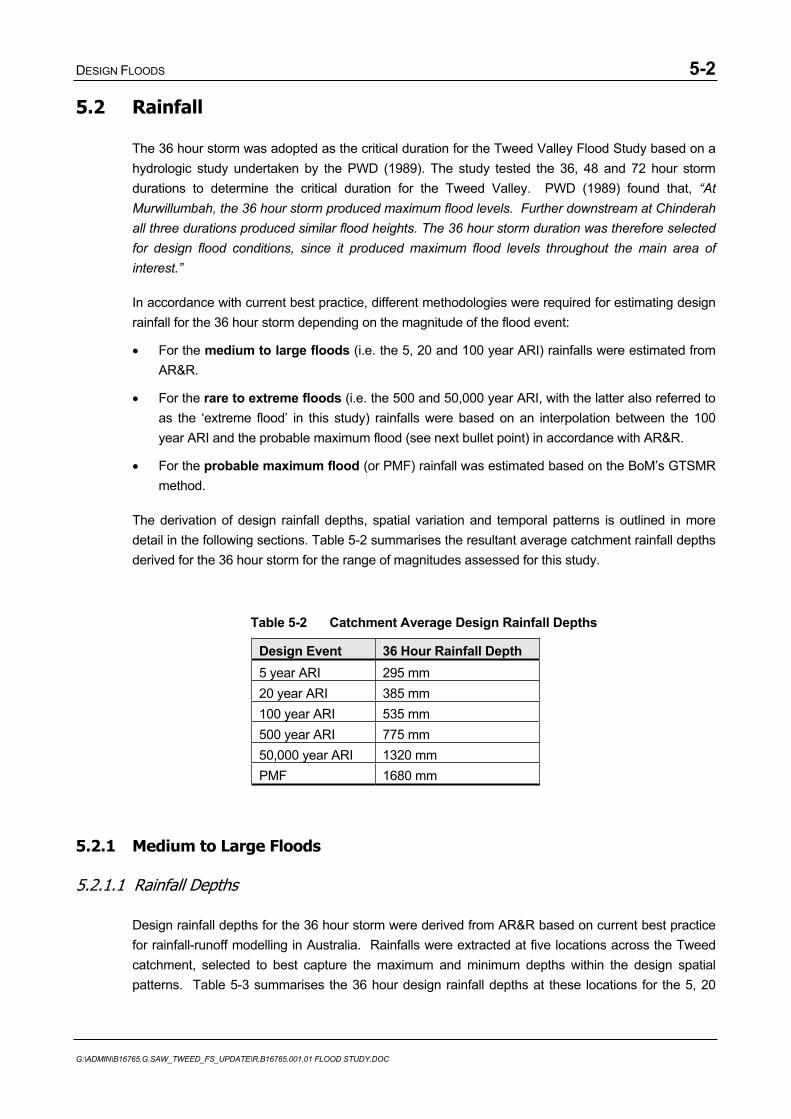
DESIGN FLOODS 5-2
G:\ADMIN\B16765.G.SAW_TWEED_FS_UPDATE\R.B16765.001.01 FLOOD STUDY.DOC
5.2 Rainfall
The 36 hour storm was adopted as the critical duration for the Tweed Valley Flood Study based on a hydrologic study undertaken by the PWD (1989). The study tested the 36, 48 and 72 hour storm durations to determine the critical duration for the Tweed Valley. PWD (1989) found that, “AtMurwillumbah, the 36 hour storm produced maximum flood levels. Further downstream at Chinderah all three durations produced similar flood heights. The 36 hour storm duration was therefore selected for design flood conditions, since it produced maximum flood levels throughout the main area of interest.”
In accordance with current best practice, different methodologies were required for estimating design rainfall for the 36 hour storm depending on the magnitude of the flood event:
For the medium to large floods (i.e. the 5, 20 and 100 year ARI) rainfalls were estimated from AR&R.
For the rare to extreme floods (i.e. the 500 and 50,000 year ARI, with the latter also referred to as the ‘extreme flood’ in this study) rainfalls were based on an interpolation between the 100 year ARI and the probable maximum flood (see next bullet point) in accordance with AR&R.
For the probable maximum flood (or PMF) rainfall was estimated based on the BoM’s GTSMR method.
The derivation of design rainfall depths, spatial variation and temporal patterns is outlined in more detail in the following sections. Table 5-2 summarises the resultant average catchment rainfall depths derived for the 36 hour storm for the range of magnitudes assessed for this study.
Table 5-2 Catchment Average Design Rainfall Depths
Design Event 36 Hour Rainfall Depth 5 year ARI 295 mm 20 year ARI 385 mm 100 year ARI 535 mm 500 year ARI 775 mm 50,000 year ARI 1320 mm PMF 1680 mm
5.2.1 Medium to Large Floods
5.2.1.1 Rainfall Depths
Design rainfall depths for the 36 hour storm were derived from AR&R based on current best practice for rainfall-runoff modelling in Australia. Rainfalls were extracted at five locations across the Tweed catchment, selected to best capture the maximum and minimum depths within the design spatial patterns. Table 5-3 summarises the 36 hour design rainfall depths at these locations for the 5, 20

DESIGN FLOODS 5-3
G:\ADMIN\B16765.G.SAW_TWEED_FS_UPDATE\R.B16765.001.01 FLOOD STUDY.DOC
and 100 year ARI events. Figure 5-1 shows the design rainfall isohyets for the 100 year ARI rainfall event. This rainfall was then factored by an areal reduction factor of 95% in accordance with AR&R.
Table 5-3 Design Rainfall Depths
Design Rainfall Depth (mm) Location
5 year ARI 20 year ARI 100 year ARI Murwillumbah 291 403 558 Tomewin 348 497 706 Jerusalem Mt 371 511 695 Tyalgum 262 347 461 Fingal 245 324 428
5.2.1.2 Temporal Distribution
The temporal pattern adopted for this study is based on a combination of the Zone 1 and Zone 3 temporal patterns from AR&R in line with the previous 2005 Flood Study and 1989 PWD study. A combined pattern has been adopted due to the proximity of the catchment to the boundary of Zone 1 and Zone 3, and the significant difference between the temporal patterns for each zone. Zone 1 patterns contain one rainfall burst in the middle of the event and Zone 3 contains two rainfall bursts (one at the beginning and one towards the end). As the peak values do not coincide direct averaging is considered unsuitable. The Zone 1 peak was therefore offset by 10 hours to align with the second peak in Zone 3. Further information is provided in PWD (1989).
5.2.1.3 Spatial Distribution
The spatial distribution of design rainfall is derived in the same manner as for the calibration events. Isohyets and corresponding rainfall surfaces were generated from design rainfall depths (see Figure 5-1) to determine the rainfall depth to be applied to each subcatchment.
5.2.2 Rare to Extreme Floods
Estimation of rare to extreme rainfall was based on interpolation between the 100 year ARI and the PMP (see Section 5.2.3) in line with the recommended AR&R methodology. This procedure is considered to produce conservatively high estimates.
Design rainfall depths for ARIs of 2,000 and 50,000 years were estimated for the catchment based on AR&R. Figure 5-2 plots the large to PMP design rainfall depths for the 36 hour duration storm.
The 500 year ARI and an ‘extreme’ event based on the 50,000 year ARI were selected for simulation as part of this Flood Study. Based on interpolation from the above plot, the design rainfall depths for the 500 year ARI and extreme event are estimated to be 775 and 1320 mm respectively.
These events use the PMP temporal and spatial patterns.


DESIGN FLOODS 5-5
G:\ADMIN\B16765.G.SAW_TWEED_FS_UPDATE\R.B16765.001.01 FLOOD STUDY.DOC
0
200
400
600
800
1000
1200
1400
1600
1800
1 10 100 1000 10000 100000 1000000
Recurrence Interval [yrs]
Rai
nfal
l dep
th [m
m/3
6h)
Figure 5-2 Design Rainfall Depths, 36 Hour Storm
5.2.3 Probable Maximum Flood
5.2.3.1 Rainfall Depths
The PMF is the largest flood that could reasonably be expected to occur in a catchment based on the Probable Maximum Precipitation (PMP). The theoretical definition of the PMP is the greatest depth of precipitation for a given duration meteorologically possible for a given size storm area at a particular location at a particular time of year (WMO, 1986).
To estimate the 36 hour duration PMP for the Tweed catchment, AR&R recommends the use of BoM’s GTSMR method for the coastal region. The ‘summer’ scenario has been adopted as it generates a larger PMP. The GTSMR method provides an initial PMP depth estimate for each zone which is modified by a number of catchment factors to determine a catchment-specific PMP. The catchment-average PMP was estimated to be 1680 mm.
5.2.3.2 Temporal Distribution
The temporal distribution of the PMP derived from the GTSMR method for a 36 hour duration storm is shown in Figure 5-3.
5.2.3.3 Spatial Distribution
The catchment-average PMP was spatially varied across the subcatchments via region specific grids defined by the GTSMR approach.
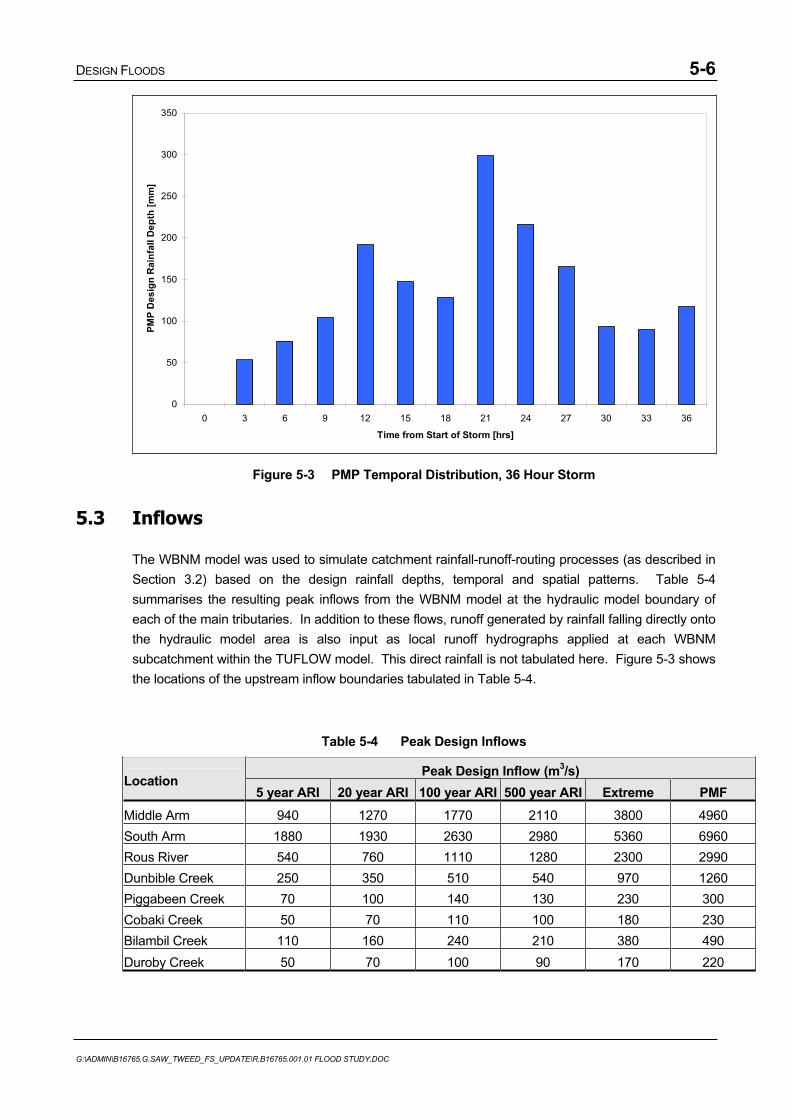
DESIGN FLOODS 5-6
G:\ADMIN\B16765.G.SAW_TWEED_FS_UPDATE\R.B16765.001.01 FLOOD STUDY.DOC
0
50
100
150
200
250
300
350
0 3 6 9 12 15 18 21 24 27 30 33 36
Time from Start of Storm [hrs]
PMP
Des
ign
Rai
nfal
l Dep
th [m
m]
Figure 5-3 PMP Temporal Distribution, 36 Hour Storm
5.3 Inflows
The WBNM model was used to simulate catchment rainfall-runoff-routing processes (as described in Section 3.2) based on the design rainfall depths, temporal and spatial patterns. Table 5-4 summarises the resulting peak inflows from the WBNM model at the hydraulic model boundary of each of the main tributaries. In addition to these flows, runoff generated by rainfall falling directly onto the hydraulic model area is also input as local runoff hydrographs applied at each WBNM subcatchment within the TUFLOW model. This direct rainfall is not tabulated here. Figure 5-3 shows the locations of the upstream inflow boundaries tabulated in Table 5-4.
Table 5-4 Peak Design Inflows
Peak Design Inflow (m3/s)Location
5 year ARI 20 year ARI 100 year ARI 500 year ARI Extreme PMFMiddle Arm 940 1270 1770 2110 3800 4960 South Arm 1880 1930 2630 2980 5360 6960 Rous River 540 760 1110 1280 2300 2990 Dunbible Creek 250 350 510 540 970 1260 Piggabeen Creek 70 100 140 130 230 300 Cobaki Creek 50 70 110 100 180 230 Bilambil Creek 110 160 240 210 380 490 Duroby Creek 50 70 100 90 170 220
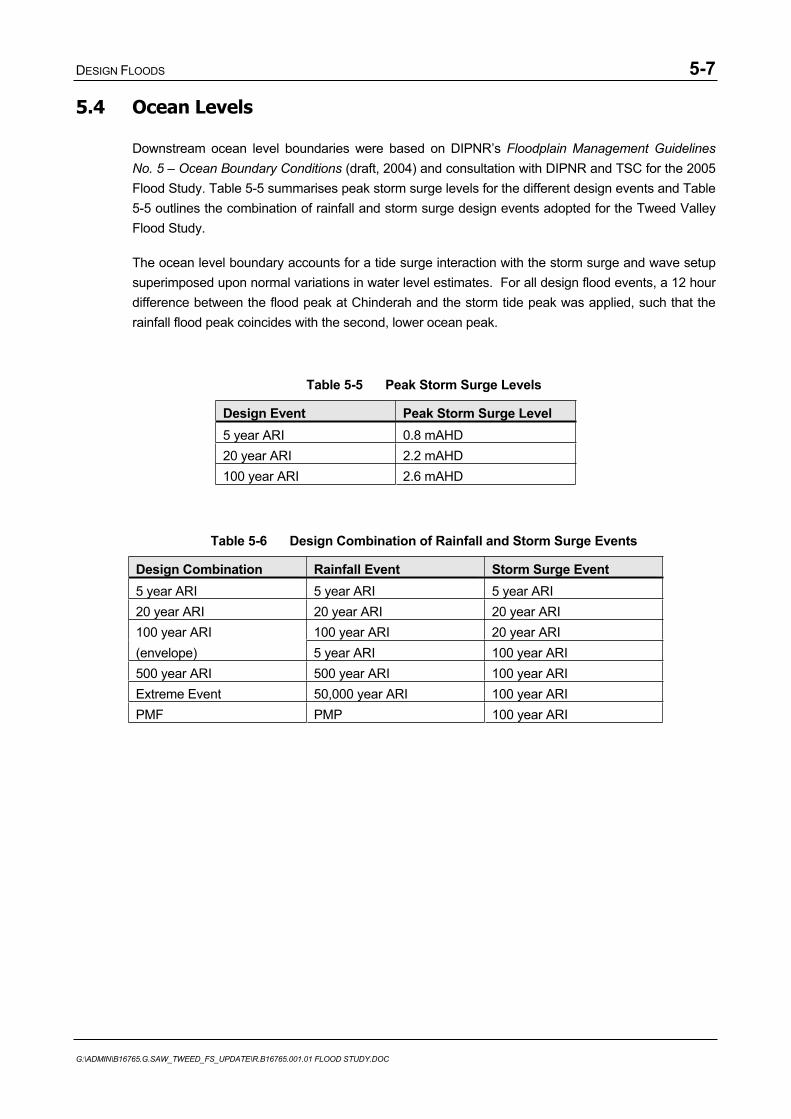
DESIGN FLOODS 5-7
G:\ADMIN\B16765.G.SAW_TWEED_FS_UPDATE\R.B16765.001.01 FLOOD STUDY.DOC
5.4 Ocean Levels
Downstream ocean level boundaries were based on DIPNR’s Floodplain Management Guidelines No. 5 – Ocean Boundary Conditions (draft, 2004) and consultation with DIPNR and TSC for the 2005 Flood Study. Table 5-5 summarises peak storm surge levels for the different design events and Table 5-5 outlines the combination of rainfall and storm surge design events adopted for the Tweed Valley Flood Study.
The ocean level boundary accounts for a tide surge interaction with the storm surge and wave setup superimposed upon normal variations in water level estimates. For all design flood events, a 12 hour difference between the flood peak at Chinderah and the storm tide peak was applied, such that the rainfall flood peak coincides with the second, lower ocean peak.
Table 5-5 Peak Storm Surge Levels
Design Event Peak Storm Surge Level 5 year ARI 0.8 mAHD 20 year ARI 2.2 mAHD 100 year ARI 2.6 mAHD
Table 5-6 Design Combination of Rainfall and Storm Surge Events
Design Combination Rainfall Event Storm Surge Event 5 year ARI 5 year ARI 5 year ARI 20 year ARI 20 year ARI 20 year ARI 100 year ARI 100 year ARI 20 year ARI (envelope) 5 year ARI 100 year ARI 500 year ARI 500 year ARI 100 year ARI Extreme Event 50,000 year ARI 100 year ARI PMF PMP 100 year ARI
DESIGN FLOOD BEHAVIOUR 6-1
G:\ADMIN\B16765.G.SAW_TWEED_FS_UPDATE\R.B16765.001.01 FLOOD STUDY.DOC
6 DESIGN FLOOD BEHAVIOUR
6.1 Interpretation of Results
6.1.1 General Issues
The interpretation of the maps and other presentations in this report should be done so with an appreciation of any limitations in their accuracy. While the points below highlight these limitations, it is important to note that the results presented provide an up-to-date reliable and accurate prediction of design flood behaviour. Points to remember are:
Recognition that no two floods behave in exactly the same manner;
Design floods are a best estimate of an ‘average’ flood for their probability of occurrence;
The DEM has been generated from ALS data with a reported vertical accuracy of +/- 0.25 metre and interpolated in areas of dense vegetation such as sugarcane (see Section 2.2.1). As flood depths and flood extents are determined using the DEM, their accuracy should be interpreted accordingly.
6.1.2 Uncertainty
All design floods are based on statistical analyses of recorded rainfall data. The longer the period of recordings, the greater the certainty. For example, derivation of the 100 year ARI rainfall from 5 years of recordings would have a much greater error margin than from 100 years of recordings.
Similarly, the accuracy of the hydrologic and hydraulic computer models is dependent on the amount and range of reliable rainfall and flood level recordings for model calibration. An uncalibrated model’s results have a greater error margin than a calibrated model.
The error margin in this study is regarded as low to moderate due to:
A reasonable amount of rainfall and flood level data, including daily rainfall records dating back to the 1880s, and recorded flood levels at a number of gauges and locations in the catchment for the 1974, 1978 and 1989 flood events;
Calibration and verification of the flood models to three historical events;
The length of time that has elapsed since the last modelled historical event and the Flood Study;
The model parameters being generally typical of those used elsewhere; and
The vertical accuracy of the ALS data used to develop the DEM.
6.1.3 Definition of ‘Peak’
Unless otherwise stated, presentations in this report are based on peak values of flood level and flow. Therefore, using flood levels as an example, the peak level does not occur everywhere at the same time and, therefore, the values presented are based on taking the maximum which occurred at each computational point in the model during the entire flood. Hence, a presentation of peak levels does
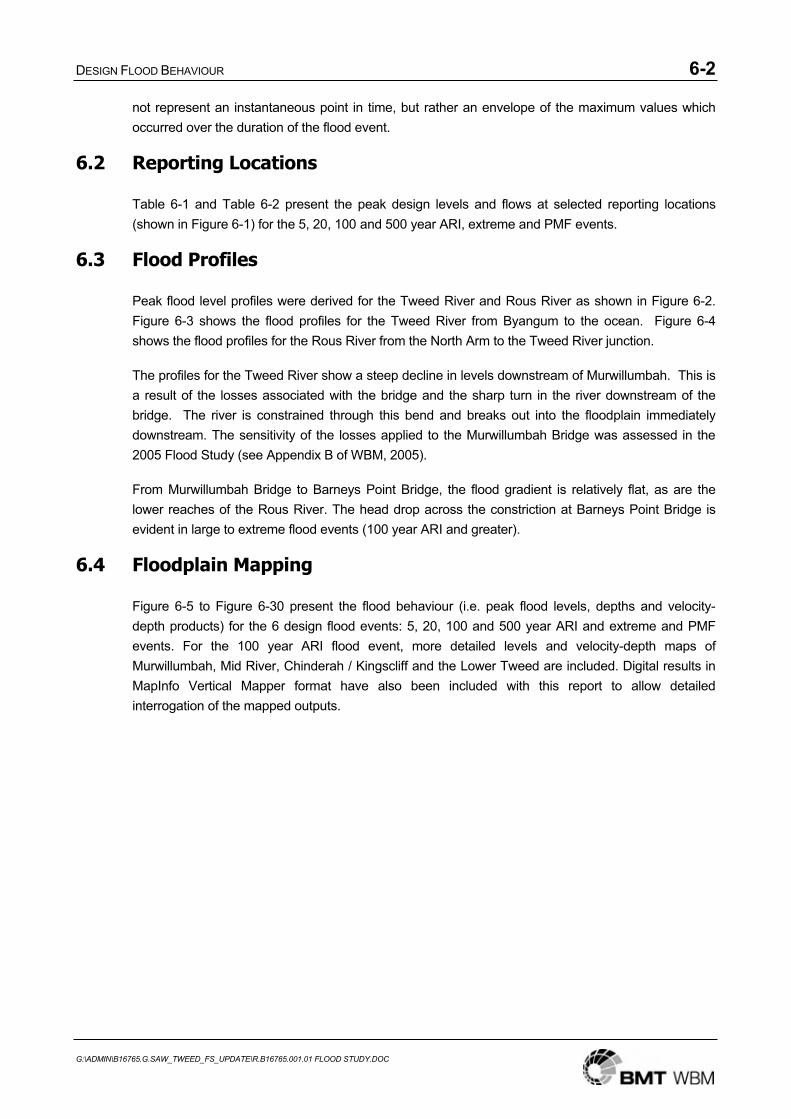
DESIGN FLOOD BEHAVIOUR 6-2
G:\ADMIN\B16765.G.SAW_TWEED_FS_UPDATE\R.B16765.001.01 FLOOD STUDY.DOC
not represent an instantaneous point in time, but rather an envelope of the maximum values which occurred over the duration of the flood event.
6.2 Reporting Locations
Table 6-1 and Table 6-2 present the peak design levels and flows at selected reporting locations (shown in Figure 6-1) for the 5, 20, 100 and 500 year ARI, extreme and PMF events.
6.3 Flood Profiles
Peak flood level profiles were derived for the Tweed River and Rous River as shown in Figure 6-2. Figure 6-3 shows the flood profiles for the Tweed River from Byangum to the ocean. Figure 6-4 shows the flood profiles for the Rous River from the North Arm to the Tweed River junction.
The profiles for the Tweed River show a steep decline in levels downstream of Murwillumbah. This is a result of the losses associated with the bridge and the sharp turn in the river downstream of the bridge. The river is constrained through this bend and breaks out into the floodplain immediately downstream. The sensitivity of the losses applied to the Murwillumbah Bridge was assessed in the 2005 Flood Study (see Appendix B of WBM, 2005).
From Murwillumbah Bridge to Barneys Point Bridge, the flood gradient is relatively flat, as are the lower reaches of the Rous River. The head drop across the constriction at Barneys Point Bridge is evident in large to extreme flood events (100 year ARI and greater).
6.4 Floodplain Mapping
Figure 6-5 to Figure 6-30 present the flood behaviour (i.e. peak flood levels, depths and velocity-depth products) for the 6 design flood events: 5, 20, 100 and 500 year ARI and extreme and PMF events. For the 100 year ARI flood event, more detailed levels and velocity-depth maps of Murwillumbah, Mid River, Chinderah / Kingscliff and the Lower Tweed are included. Digital results in MapInfo Vertical Mapper format have also been included with this report to allow detailed interrogation of the mapped outputs.
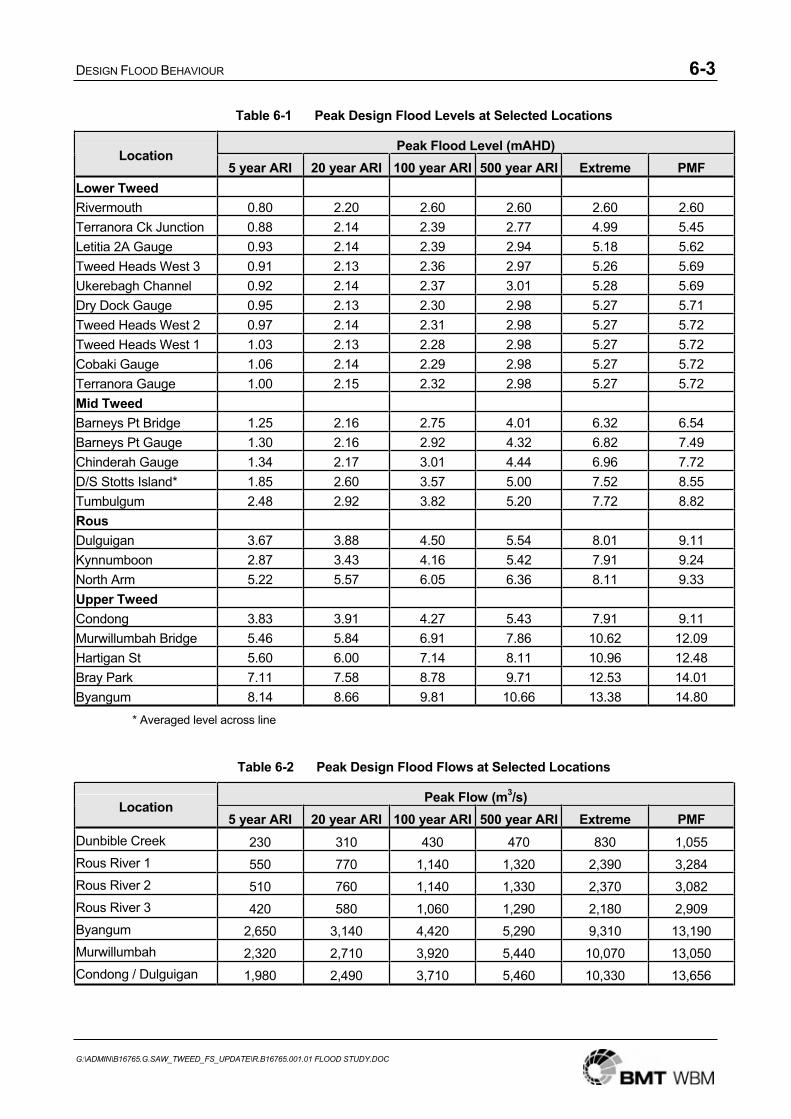
DESIGN FLOOD BEHAVIOUR 6-3
G:\ADMIN\B16765.G.SAW_TWEED_FS_UPDATE\R.B16765.001.01 FLOOD STUDY.DOC
Table 6-1 Peak Design Flood Levels at Selected Locations
Peak Flood Level (mAHD) Location
5 year ARI 20 year ARI 100 year ARI 500 year ARI Extreme PMFLower Tweed Rivermouth 0.80 2.20 2.60 2.60 2.60 2.60 Terranora Ck Junction 0.88 2.14 2.39 2.77 4.99 5.45 Letitia 2A Gauge 0.93 2.14 2.39 2.94 5.18 5.62 Tweed Heads West 3 0.91 2.13 2.36 2.97 5.26 5.69 Ukerebagh Channel 0.92 2.14 2.37 3.01 5.28 5.69 Dry Dock Gauge 0.95 2.13 2.30 2.98 5.27 5.71 Tweed Heads West 2 0.97 2.14 2.31 2.98 5.27 5.72 Tweed Heads West 1 1.03 2.13 2.28 2.98 5.27 5.72 Cobaki Gauge 1.06 2.14 2.29 2.98 5.27 5.72 Terranora Gauge 1.00 2.15 2.32 2.98 5.27 5.72 Mid Tweed Barneys Pt Bridge 1.25 2.16 2.75 4.01 6.32 6.54 Barneys Pt Gauge 1.30 2.16 2.92 4.32 6.82 7.49 Chinderah Gauge 1.34 2.17 3.01 4.44 6.96 7.72 D/S Stotts Island* 1.85 2.60 3.57 5.00 7.52 8.55 Tumbulgum 2.48 2.92 3.82 5.20 7.72 8.82 Rous Dulguigan 3.67 3.88 4.50 5.54 8.01 9.11 Kynnumboon 2.87 3.43 4.16 5.42 7.91 9.24 North Arm 5.22 5.57 6.05 6.36 8.11 9.33 Upper Tweed Condong 3.83 3.91 4.27 5.43 7.91 9.11 Murwillumbah Bridge 5.46 5.84 6.91 7.86 10.62 12.09 Hartigan St 5.60 6.00 7.14 8.11 10.96 12.48 Bray Park 7.11 7.58 8.78 9.71 12.53 14.01 Byangum 8.14 8.66 9.81 10.66 13.38 14.80
* Averaged level across line
Table 6-2 Peak Design Flood Flows at Selected Locations
Peak Flow (m3/s)Location
5 year ARI 20 year ARI 100 year ARI 500 year ARI Extreme PMFDunbible Creek 230 310 430 470 830 1,055 Rous River 1 550 770 1,140 1,320 2,390 3,284 Rous River 2 510 760 1,140 1,330 2,370 3,082 Rous River 3 420 580 1,060 1,290 2,180 2,909 Byangum 2,650 3,140 4,420 5,290 9,310 13,190 Murwillumbah 2,320 2,710 3,920 5,440 10,070 13,050 Condong / Dulguigan 1,980 2,490 3,710 5,460 10,330 13,656
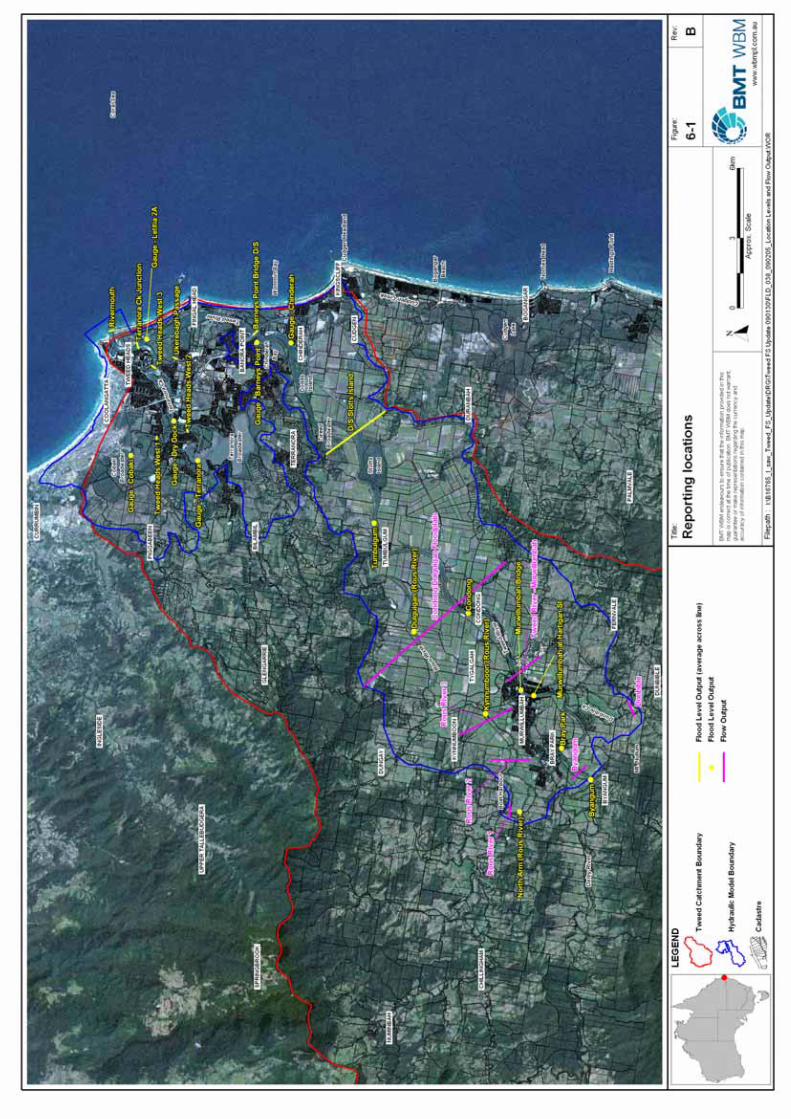
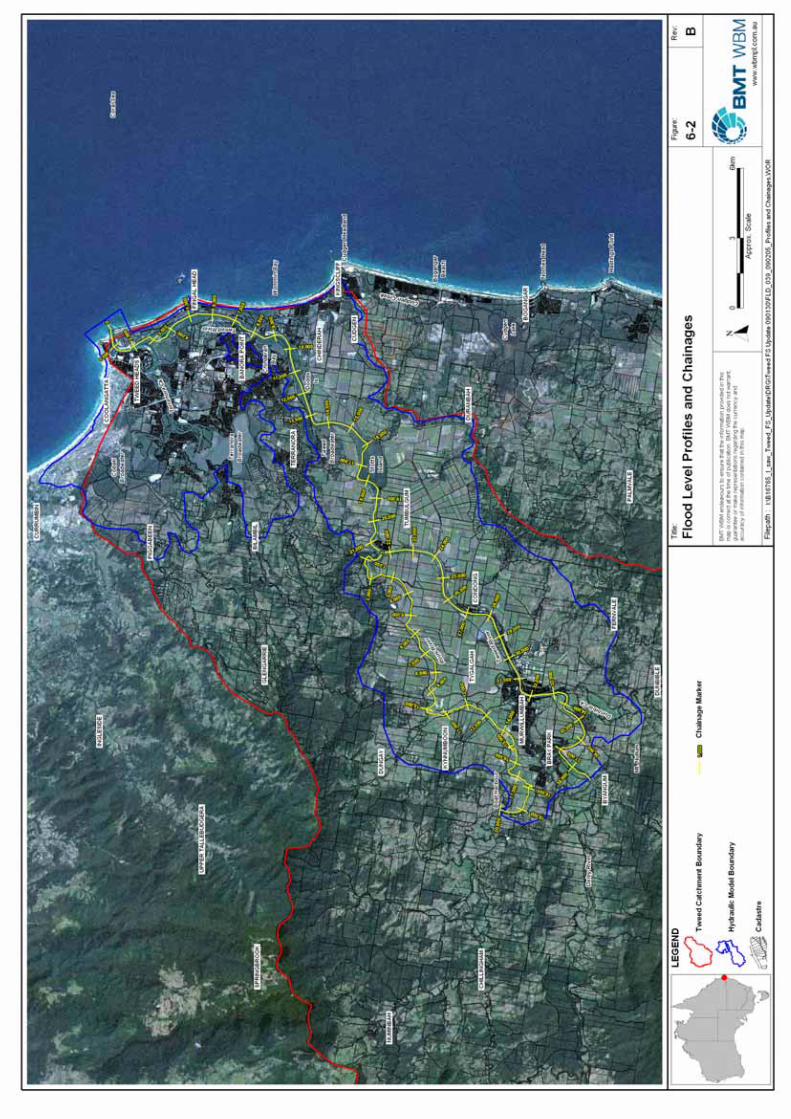
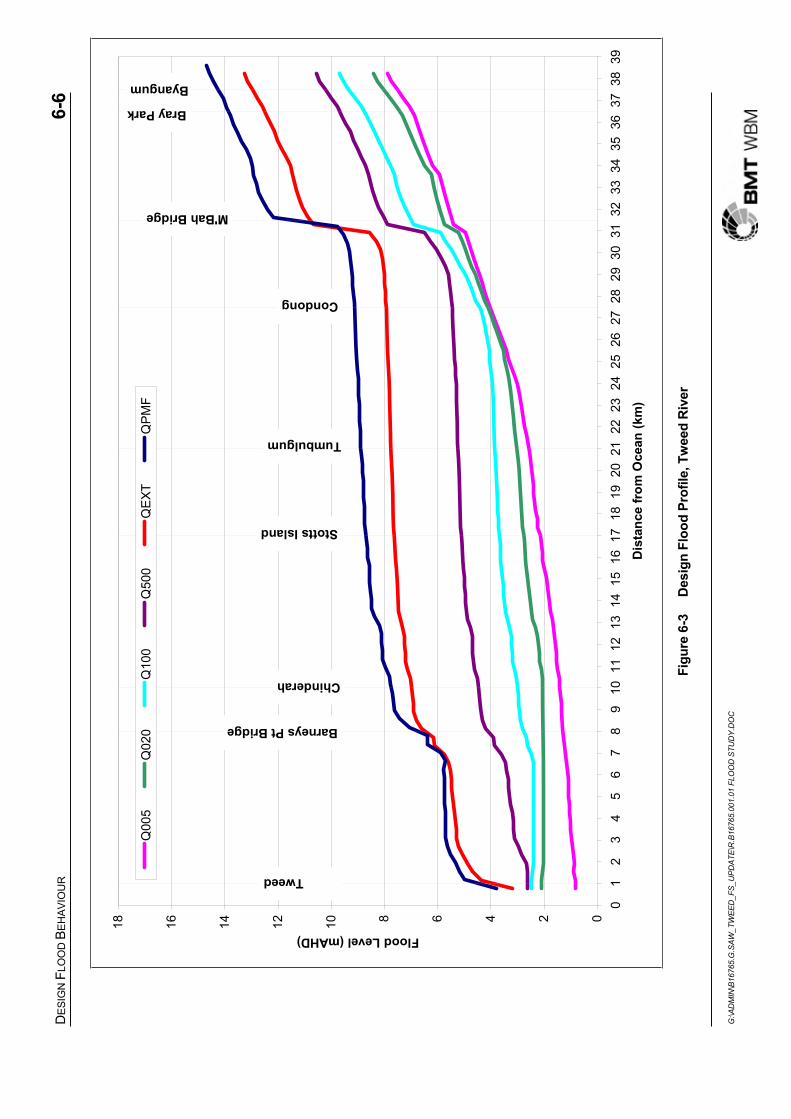
DES
IGN
FLO
OD
BEH
AVIO
UR
6-6
G:\A
DM
IN\B
1676
5.G
.SAW
_TW
EED
_FS_
UPD
ATE\
R.B
1676
5.00
1.01
FLO
OD
STU
DY.
DO
C
024681012141618
01
23
45
67
89
1011
1213
1415
1617
1819
2021
2223
2425
2627
2829
3031
3233
3435
3637
3839
Dis
tanc
e fr
om O
cean
(km
)
Flood Level (mAHD)
Q00
5Q
020
Q10
0Q
500
QE
XTQ
PMF
Tweed
Barneys Pt Bridge
Chinderah
Stotts Island
Tumbulgum
Condong
M'Bah Bridge
Bray Park
Byangum
Figu
re 6
-3
Des
ign
Floo
d Pr
ofile
, Tw
eed
Riv
er
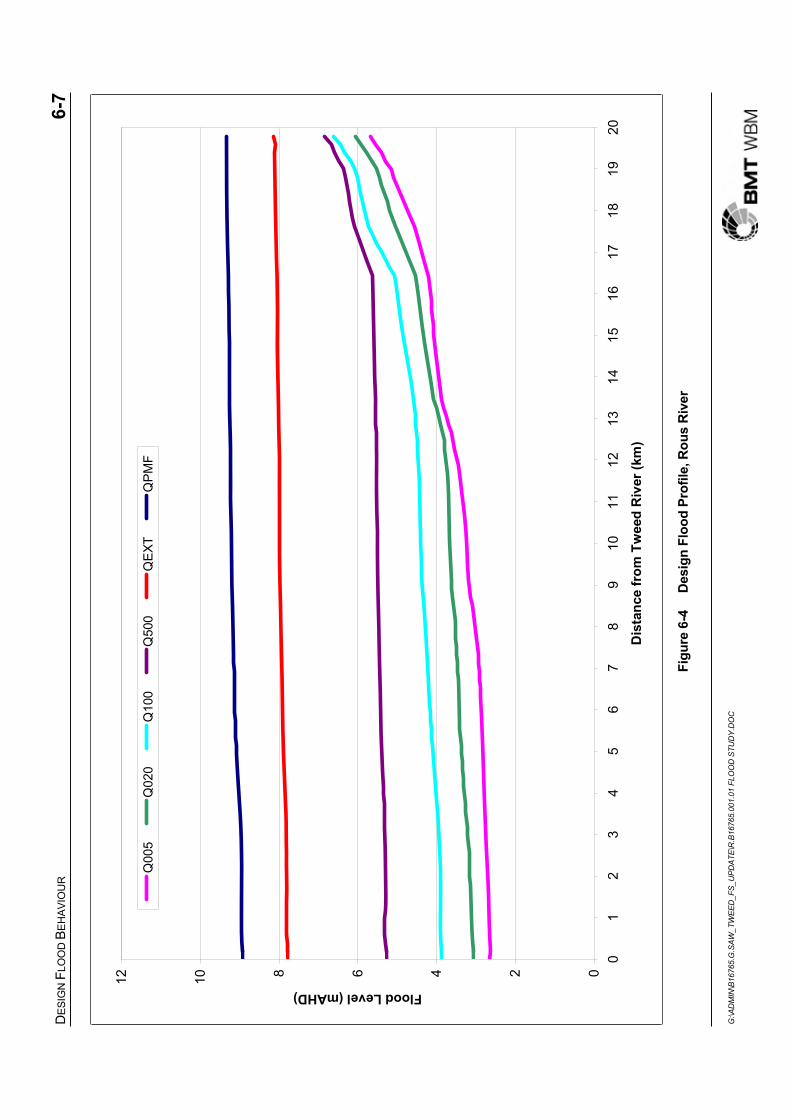
DES
IGN
FLO
OD
BEH
AVIO
UR
6-7
G:\A
DM
IN\B
1676
5.G
.SAW
_TW
EED
_FS_
UPD
ATE\
R.B
1676
5.00
1.01
FLO
OD
STU
DY.
DO
C
024681012
01
23
45
67
89
1011
1213
1415
1617
1819
20
Dis
tanc
e fr
om T
wee
d R
iver
(km
)
Flood Level (mAHD)
Q00
5Q
020
Q10
0Q
500
QE
XTQ
PM
F
Figu
re 6
-4
Des
ign
Floo
d Pr
ofile
, Rou
s R
iver


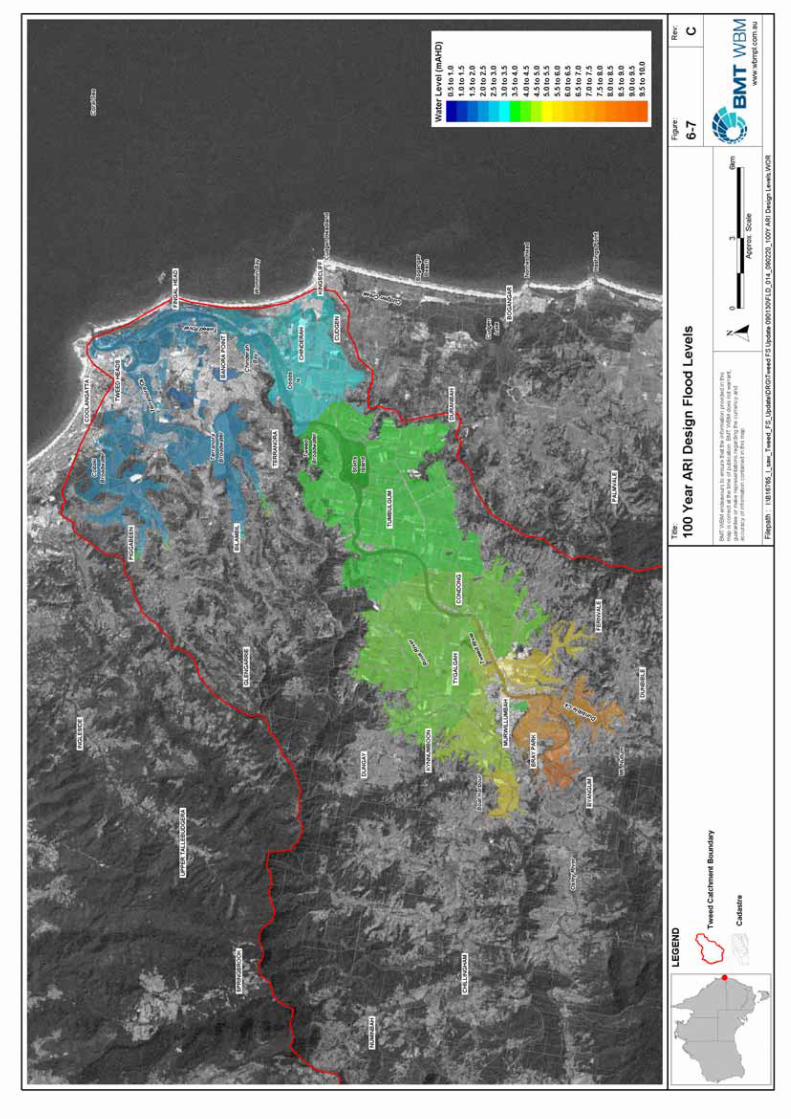
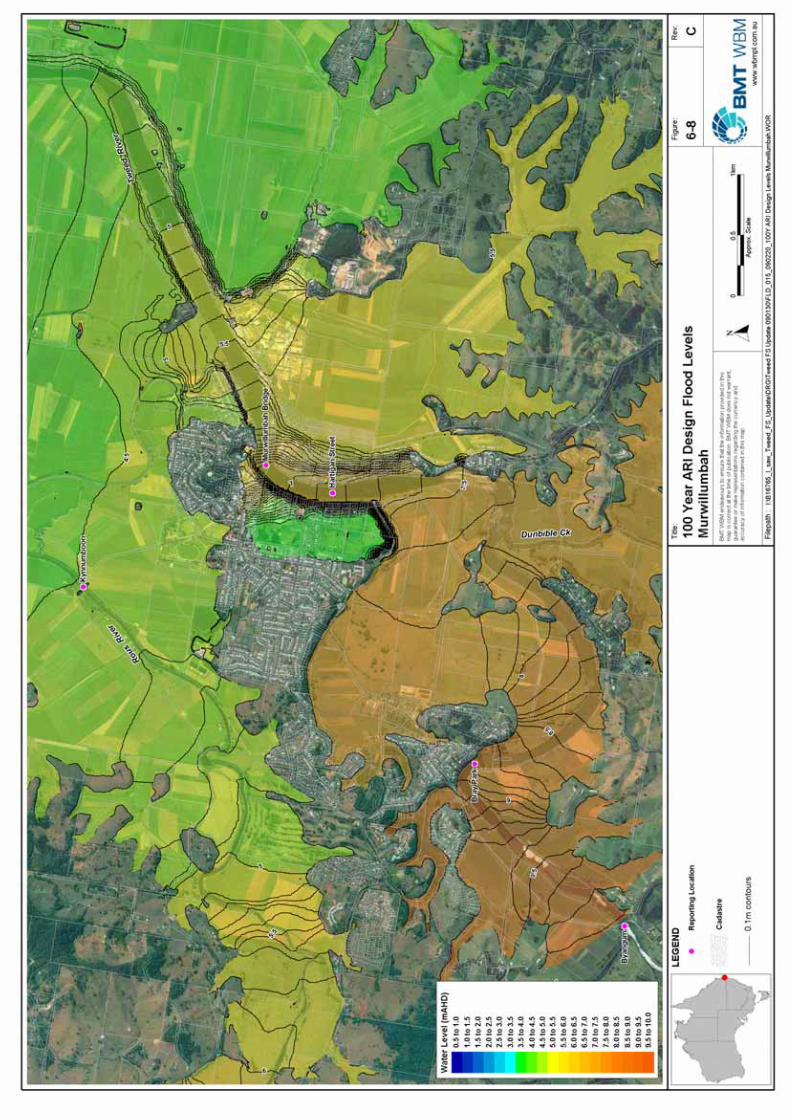

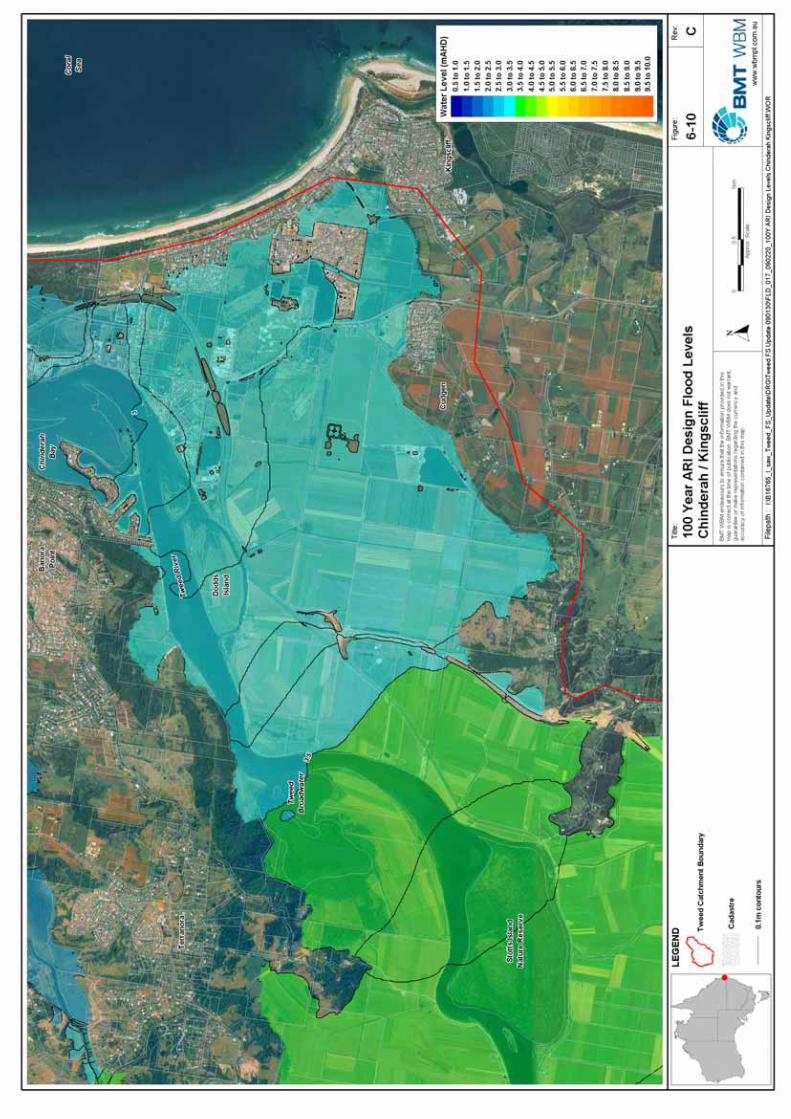
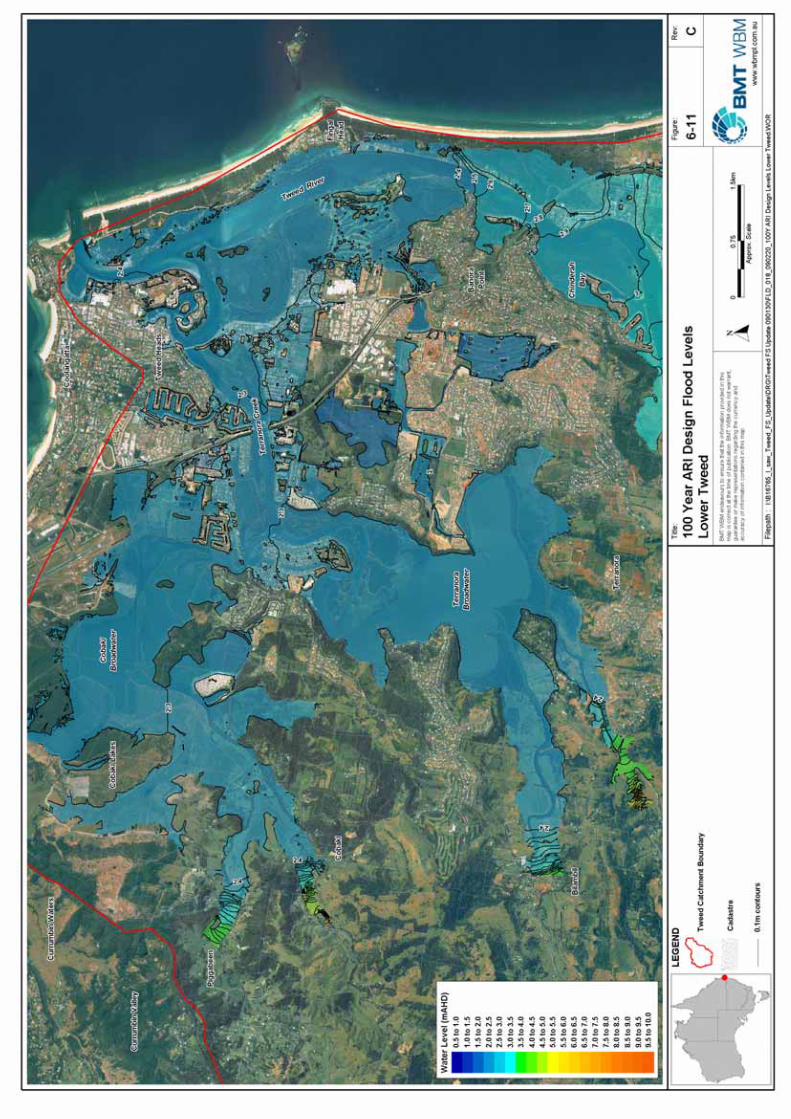
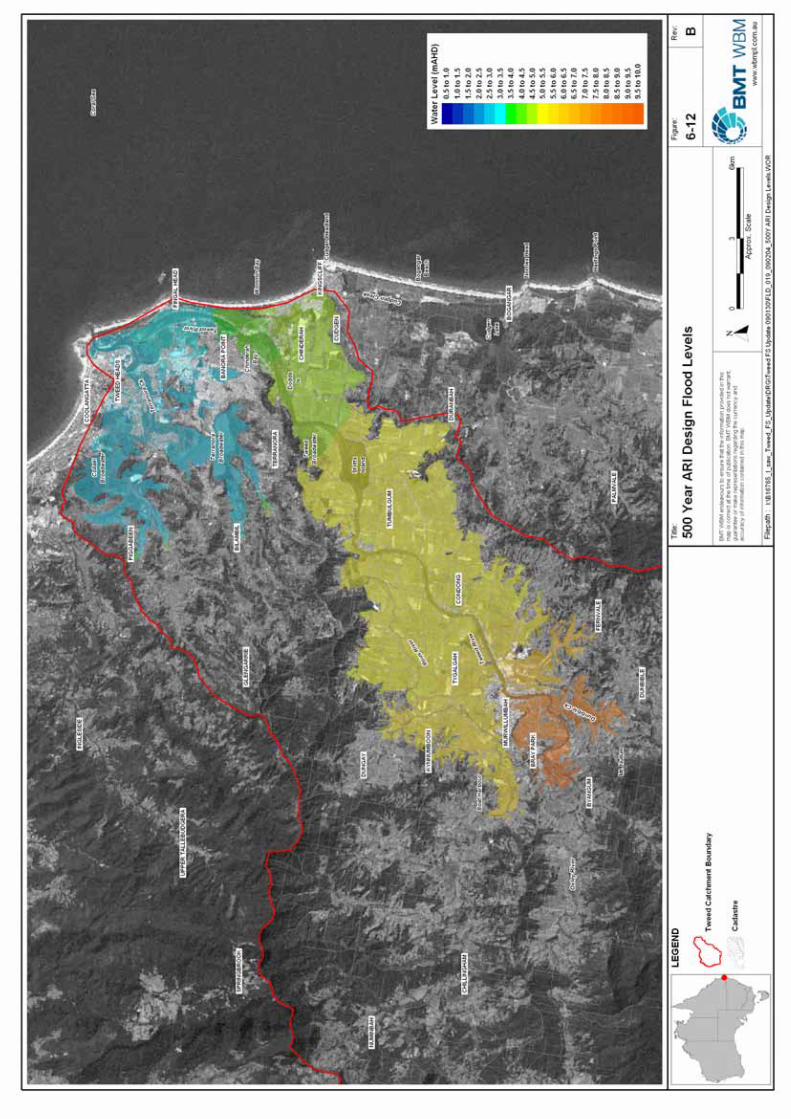
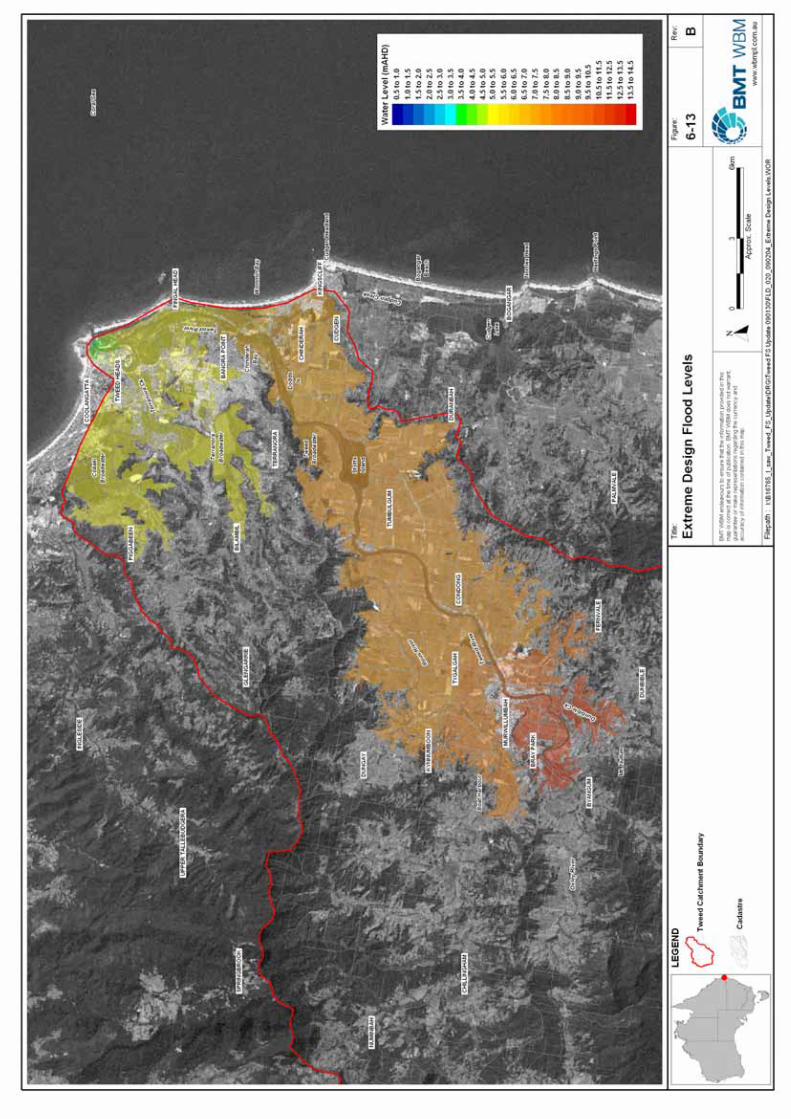
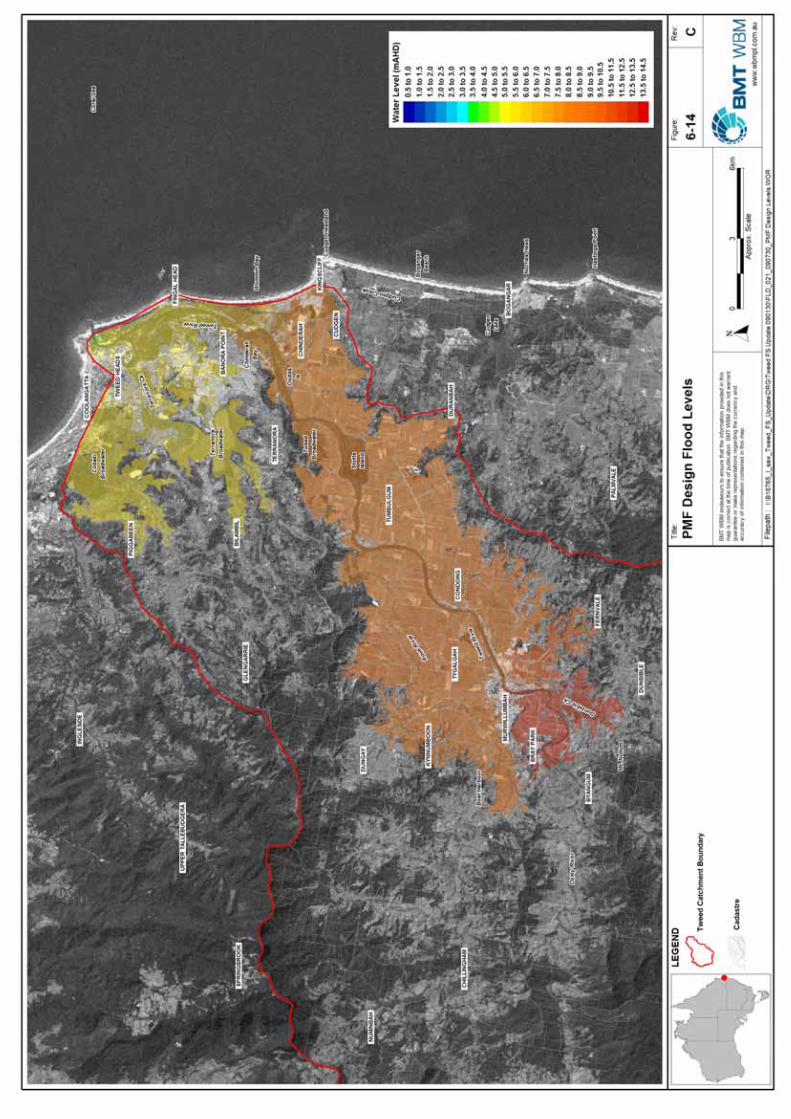


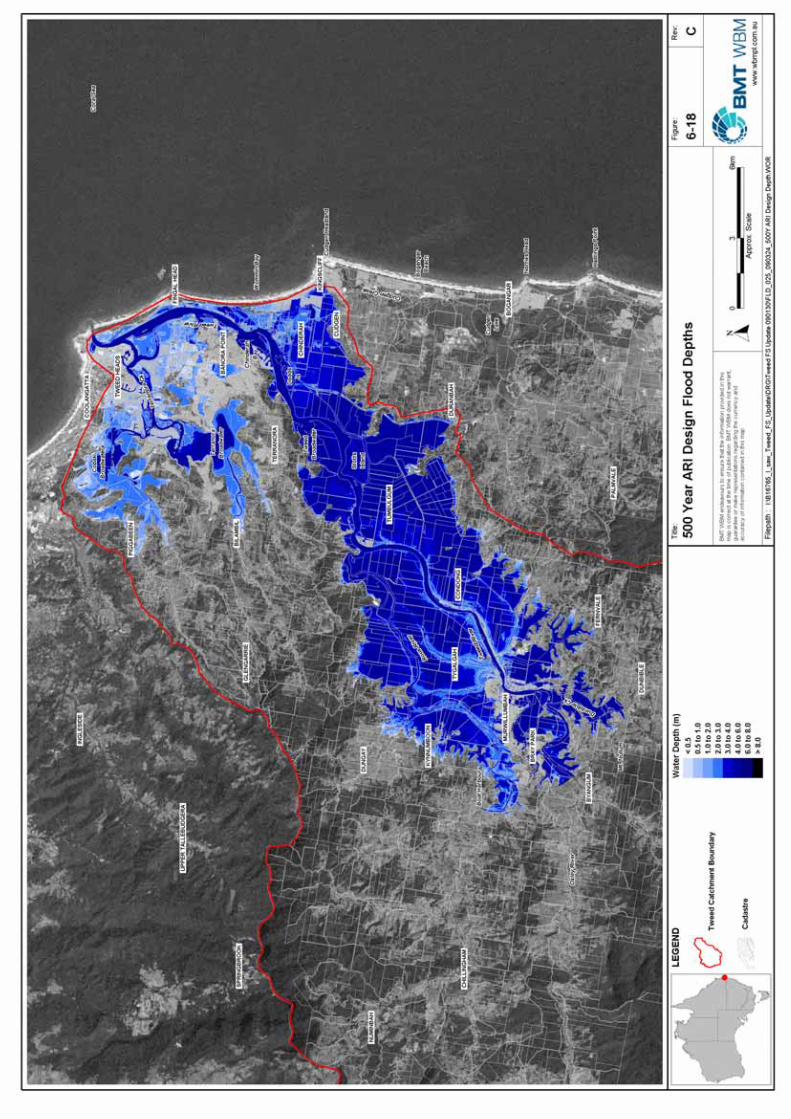
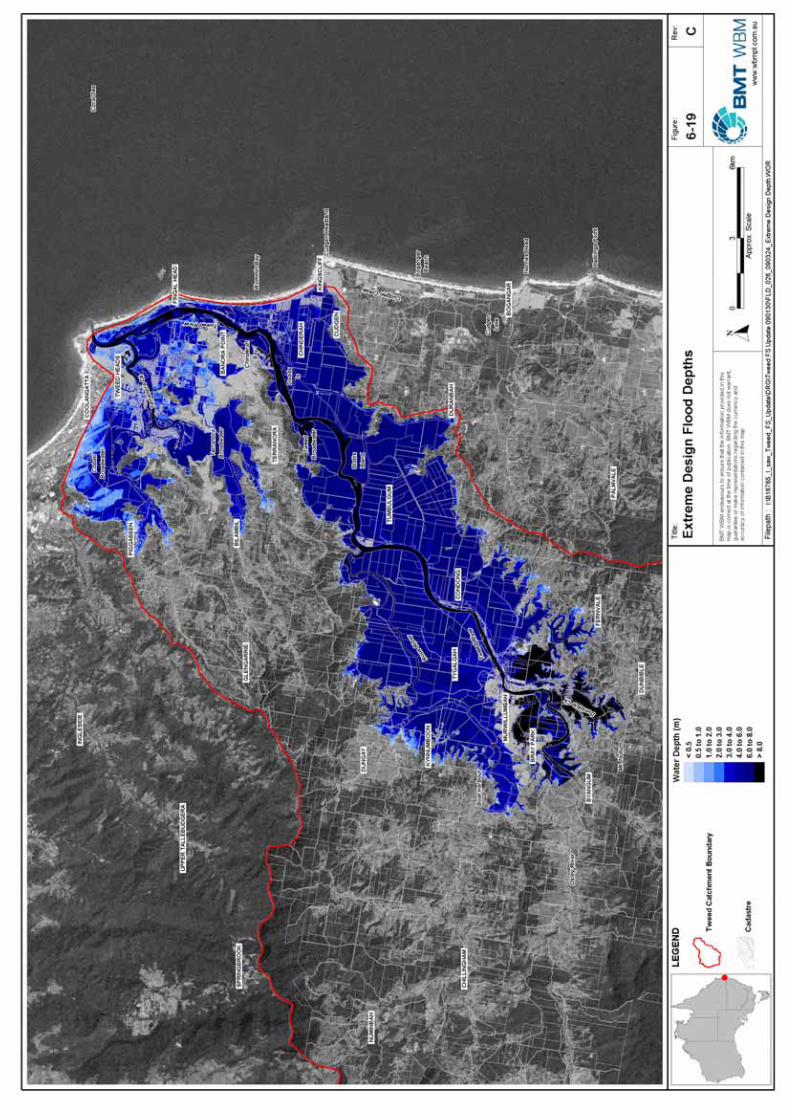
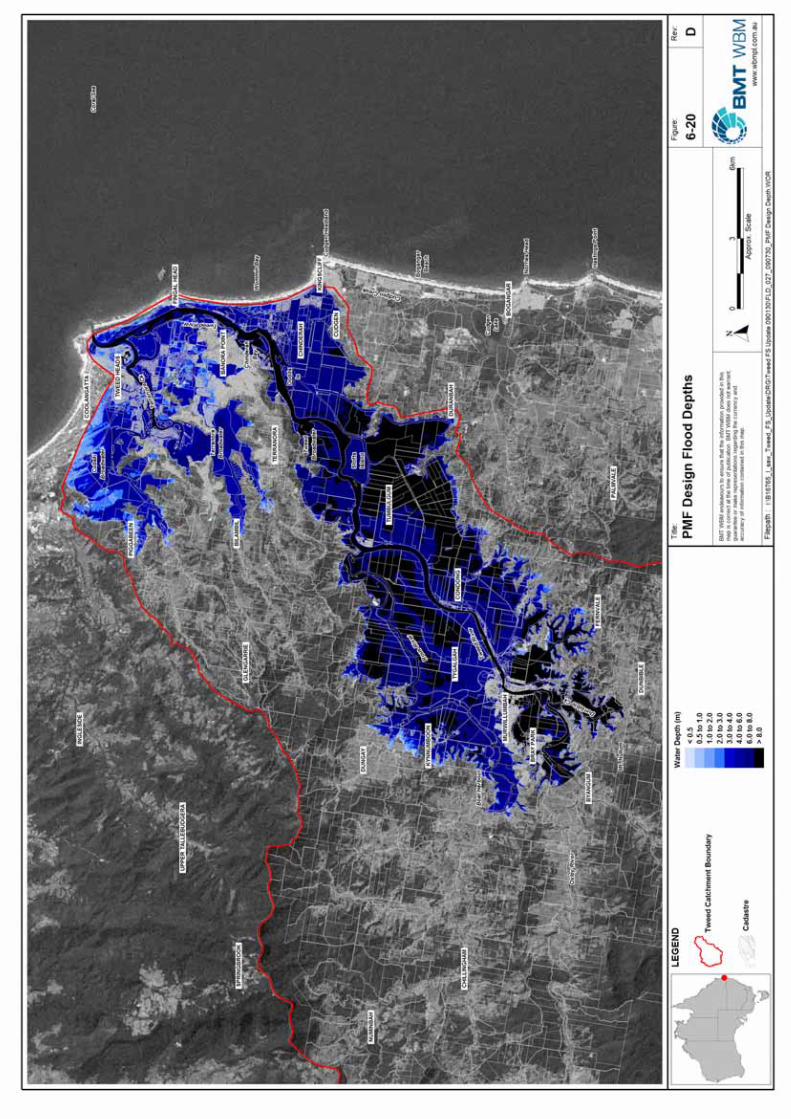
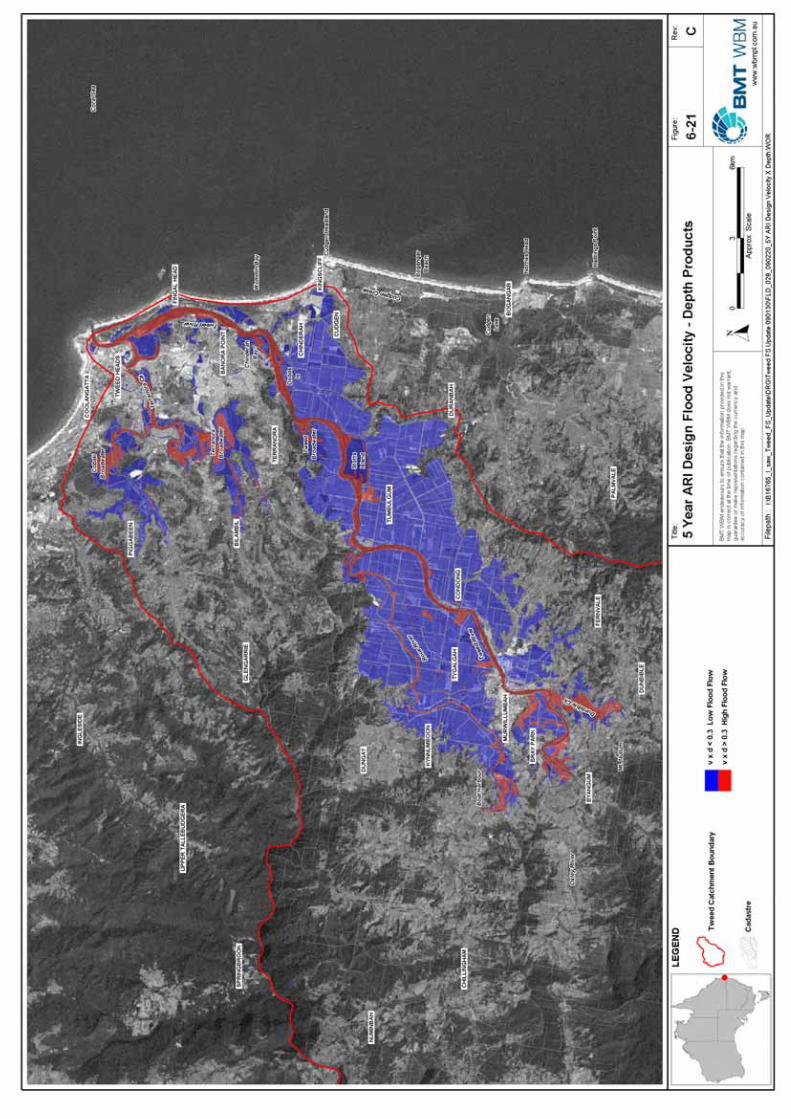

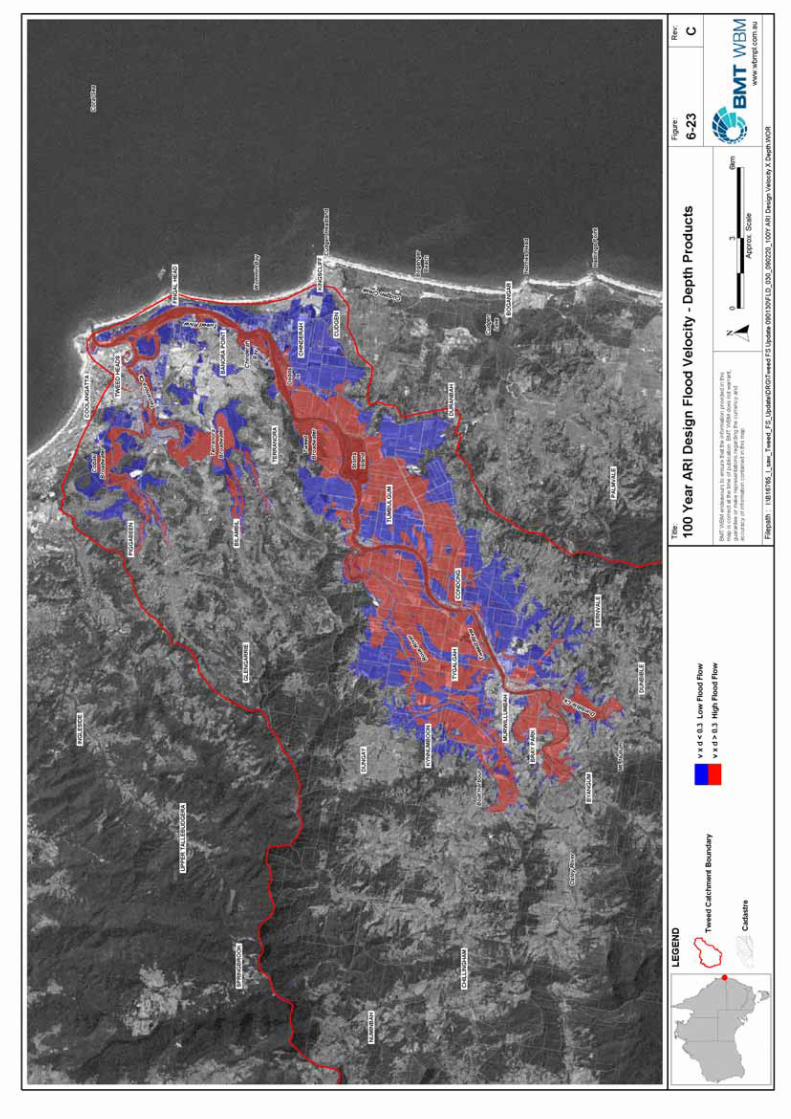


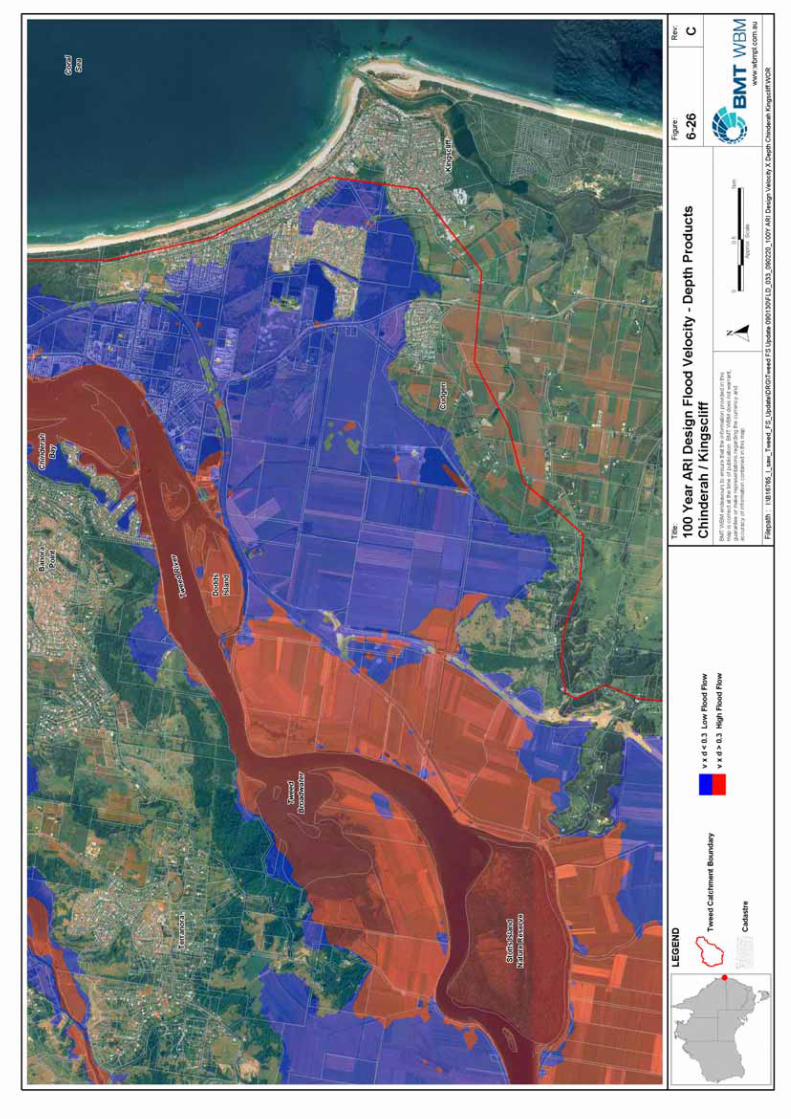
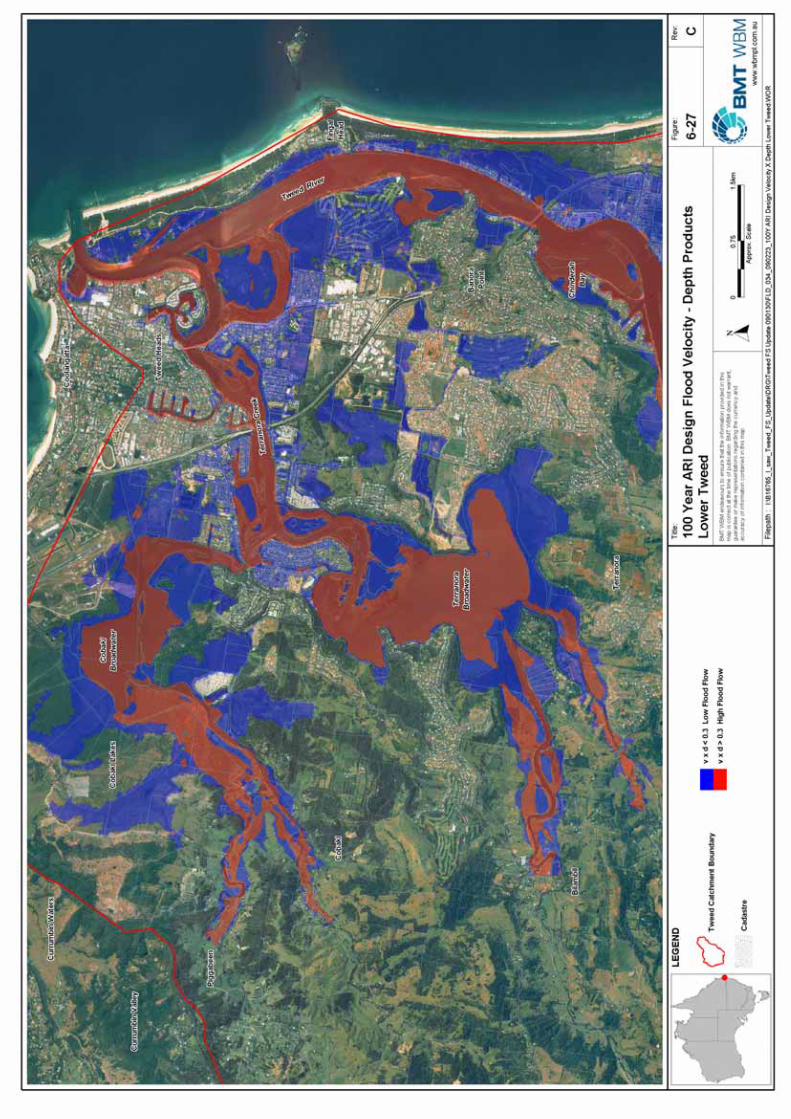


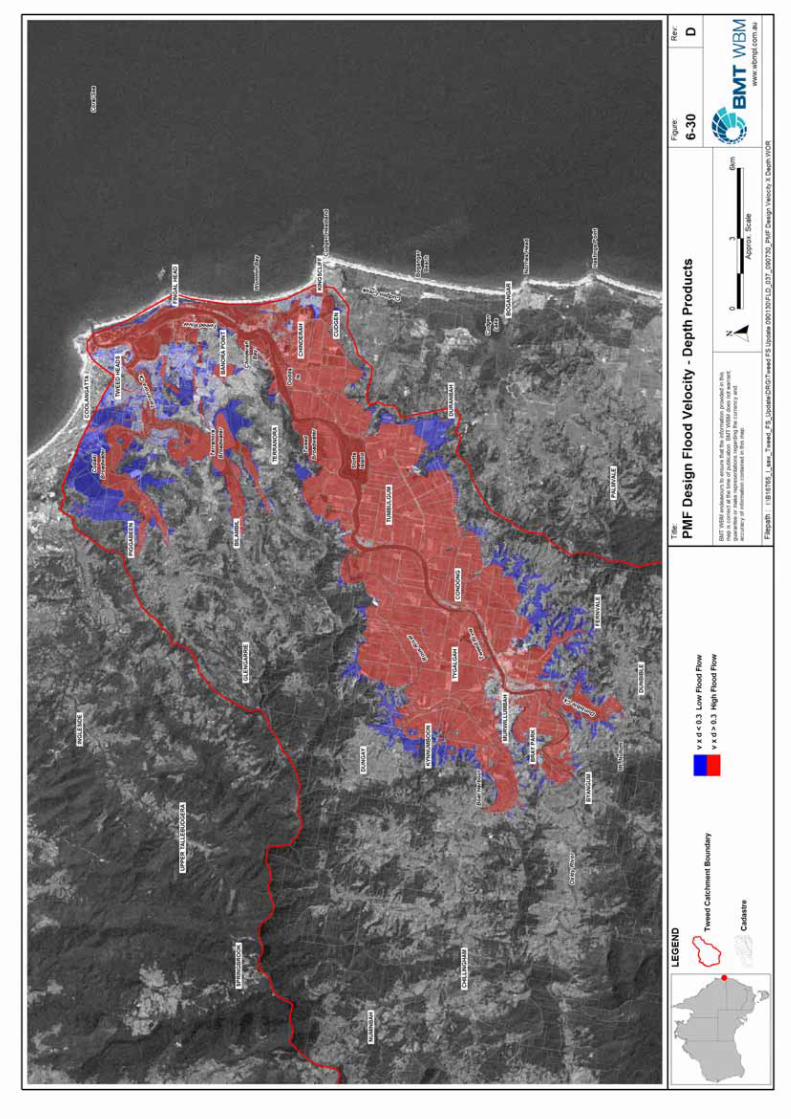
DESIGN FLOOD BEHAVIOUR 6-34
G:\ADMIN\B16765.G.SAW_TWEED_FS_UPDATE\R.B16765.001.01 FLOOD STUDY.DOC
6.5 Flood Behaviour
6.5.1 Murwillumbah
In Murwillumbah, the effects of flooding are varied. The Murwillumbah Township is protected by flooding from a river levee, which provides immunity above a 20 year ARI event, but begins to overtop in the 100 year ARI flood event. Overtopping first occurs at the Murwillumbah Bridge when levels in the river reach approximately 6.8 mAHD. A detailed overtopping assessment of the levee and flooding in the Murwillumbah Township was undertaken in the 2005 Flood Study and was presented in Appendix C of that report.
At the peak of the 100 year ARI flood event, inundation in Murwillumbah extends west to approximately Nullum Street and north to Wharf Street (see Figure 6-8) with depths up to 1.5 metres in some areas of Knox Park and the sports fields, and up to 2.5 metres at the eastern (river) end of Wharf Street. Velocities through Murwillumbah are generally low (less than 0.1 m/s).
Bray Park acts as a flow path in flood events including the 5 year ARI flood and larger (see Figure 6-24) with depths up to 6 metres and velocities up to 0.5 m/s in the 100 year ARI flood event.
6.5.2 South Murwillumbah
South Murwillumbah is affected by flooding in small events with depths up to 4 metres in some low lying areas (between Wardrop Street and Tweed Valley Way, and River Street) in the 5 year ARI flood. The South Murwillumbah levee provides some protection but begins to overtop when levels at the Murwillumbah Bridge reach approximately 4.8 mAHD.
South Murwillumbah is predicted to be fully inundated during the 100 year ARI event (see Figure 6-8) from both Tweed River breakout and local runoff. Peak depths are up to 5 metres in low lying areas, and up to 1.5 metres over Tweed Valley Way (Bray Street).
The airport acts as the major flow path from South Murwillumbah to Condong Creek during flood events (see Figure 6-24). Velocity-depth products are greater than 0.3 m2/s across much of South Murwillumbah during the 100 year ARI flood event.
6.5.3 Condong
Some areas of Condong are predicted to be inundated in small events including the 5 year ARI flood. In the 100 year ARI flood, most of Condong is inundated apart from a small isolated area at the northern end of town (Maria and Carmen Place) (see Figure 6-9). Peak depths are up to 2 metres in low lying areas, and up to approximately 1 metre over Tweed Valley Way in the 100 year ARI flood. Most buildings are located on the higher ground along Tweed Valley Way where depths are lower.
6.5.4 Tumbulgum
Tumbulgum is also predicted to be inundated by small flood events including the 5 year ARI flood. At the peak of the 5 year ARI flood event, most of the town is inundated apart from small areas of higher ground, with depths up to 1.5 metres in low lying areas. During the 100 year ARI flood event, the

DESIGN FLOOD BEHAVIOUR 6-35
G:\ADMIN\B16765.G.SAW_TWEED_FS_UPDATE\R.B16765.001.01 FLOOD STUDY.DOC
whole town is inundated, with depths up to 3 metres in low lying areas (see Figure 6-9). Velocities through town are small (less than 0.05 m/s). In events larger than the 100 year ARI flood event, Tweed Valley Way and the floodplain to the south become high flow areas with velocity-depth products above 0.3 m2/s (see Figure 6-28).
6.5.5 Chinderah
Large areas of Chinderah experience flooding in the 20 year ARI event with depths up to 1.5 metres in low lying areas adjacent to the Kingscliff drain. In the 100 year ARI event, most of Chinderah is inundated (see Figure 6-10) with depths up to 2.5 metres. Velocities are generally low (less than 0.1 m/s in most areas) and velocity-depth products (see Figure 6-26) are also generally low (less than 0.3 m2/s) in the 100 year ARI flood event.
6.5.6 West Kingscliff
The western edge of Kingscliff, extending approximately halfway from Sand Street to Kingscliff Street, is inundated in the 100 year ARI flood event (see Figure 6-10) with depths up to approximately 1 metre in the lots, and 1.5 metres in the streets. Velocities are generally less than 0.01 m/s and velocity-depth products are less than 0.1 m2/s in the 100 year ARI event in this area (see Figure 6-26).
6.5.7 Fingal Head
The main centre of Fingal Head is not affected by flooding up to the 500 year ARI flood event. However, the Letitia Road to the north (including some adjacent properties) and Fingal Road leading into Fingal Head from the south (also including some adjacent properties) are predicted to be inundated in the 20 year ARI event. The depth of inundation over Fingal Road is up to 1.5 metres near Wommin Lake in the 100 year ARI.
6.5.8 Banora Point
Banora Point is expected to be mostly flood free in the 100 year ARI flood (see Figure 6-11) with the exception of the Kirkwood Road area which is inundated from Terranora Creek in the 20 year ARI flood and larger. Velocity-depth products are less than 0.3 m2/s in the 100 year ARI event (see Figure 6-27). The Banora Point Golf Course provides flood storage in events larger than the 5 year ARI, with depths between 1.5 and 2 metres in the 100 year ARI event.
No inundation of developed areas is expected in Flame Tree Park in the 100 year ARI event with the exception of some streets. Note however, that this is only based on flooding from either storm surge or a catchment flood (i.e. a 36 hour rainfall event over the whole Tweed River catchment). It does not include areas inundated by stormwater flooding, usually caused by shorter-duration, higher-intensity local rainfall events, such as that which occurred in June 2005.
6.5.9 Tweed Heads South
The Tweed Heads South levee was designed to provide immunity for a 20 year ARI flood. However, based on 2008 survey of the levee, there are some sections of the levee that are overtopping in the
DESIGN FLOOD BEHAVIOUR 6-36
G:\ADMIN\B16765.G.SAW_TWEED_FS_UPDATE\R.B16765.001.01 FLOOD STUDY.DOC
20 year ARI event, including several locations along both the Dry Dock Road and Minjungbal Drive sections of the levee. The levee is overtopped by up to 0.3 metre near the South Tweed Bowls Club.
Depth of inundation in the northern residential areas are mostly between 0.5 and 1 metre in the 100 year ARI event (see Figure 6-11). Velocity-depth products are less than 0.3 m2/s in the 100 year ARI event (see Figure 6-27).
Most of the southern commercial area is flood free in the 100 year ARI event with the exception of some of the northern streets including Minjungbal Drive north of Machinery Drive.
6.5.10 Tweed Heads
Most of the developed areas of Tweed Heads are flood free in the 100 year ARI event with the exception of a few properties along Endeavour Parade in the north and Margaret Street near the canals (see Figure 6-11). Some streets are also inundated in this event, including sections of Kennedy Drive up to 1 metre, Ducat Street up to 1 metre and Keith Compton Drive up to 0.5 metre near the Tweed Heads District Hospital.
6.5.11 Tweed Heads West
Low lying areas of Tweed Heads West are expected to be inundated in the 20 year ARI event and larger. Widespread inundation occurs in the 100 year ARI event (see Figure 6-11) including most properties along Kennedy Drive, Gray Street, Rose Street, Blue Waters Crescent and Wyuna Road. Depths are typically 1 to 1.5 metres in this event.
Approximately two-thirds of Seagulls Estate and all of the streets are inundated in the 100 year ARI flood, with depths up to 1.5 metres along Sunset Boulevard.
6.5.12 Cobaki
During the 100 year ARI event, depths of over 2 metres and velocity-depth products of over 0.3 m2/s are predicted in some low-lying areas of Cobaki and Cobaki Lakes (see Figure 6-11 and Figure 6-27).
6.5.13 General Tweed
As summarised in Table 5-5, two 100 year ARI flood events were modelled; a 100 year ARI catchment rainfall event and a 100 year ARI storm surge event. The catchment rainfall flood dominates (i.e. produces higher peak flood levels) along the Tweed River floodplain downstream to Shallow Bay, as well as the Cobaki / Piggabeen floodplains down to Terranora Creek. The storm surge flood dominates along the lower Tweed River floodplain from Shallow Bay to the mouth, and the Terranora Creek floodplain from the lower Bilambil / Duroby floodplains down to Tweed Heads. As discussed in Section 6.5.8, stormwater flood events (i.e. from localised short-duration, high-intensity storm events) has not been assessed as part of this Tweed Valley catchment study.
In the 100 year ARI event (see Figure 6-23), the main high flow areas in the upper Tweed include the Bray Park flowpath upstream of Murwillumbah and the flowpath from Blacks Drain to Condong Creek via the Murwillumbah airport. In the mid Tweed, there are large areas of floodplain conveying high flow between the Tweed and Rous Rivers, as well as from Condong to Stotts Island. In the lower
DESIGN FLOOD BEHAVIOUR 6-37
G:\ADMIN\B16765.G.SAW_TWEED_FS_UPDATE\R.B16765.001.01 FLOOD STUDY.DOC
Tweed, the valleys of the Broadwater tributaries (Cobaki, Piggabeen, Bilambil and Duroby Creeks) all convey high flows.
With respect to the interactions of the Tweed and Rous Rivers, during smaller flood events, water is predicted to flow from the Rous River to the Tweed River via Mayal Creek. As the floodwaters rise the Tweed River becomes the dominant flow and floodwater flows from the Tweed River to the Rous River. Most of the floodplain between the Tweed and Rous Rivers becomes a ‘high flow area’ (see Figure 6-23) in the 100 year ARI flood event.
The Tweed Valley is generally quite wide and flat with few structures that significantly control the hydraulics of the floodplain. Low natural and man-made banks and levees are present along much of the Rous and Tweed Rivers but are generally exceeded in small flood events. One exception is the constriction at Murwillumbah created by the town levees, the Murwillumbah Bridge and the sharp bend of the river immediately downstream of the bridge. In the lower Tweed, the embankment and drainage structures of the Pacific Highway influence flood behaviour in large events. In the extreme and PMF events, flood levels in the lower Tweed area are controlled by the constriction at the rivermouth / entrance and the dunes between Kingscliff and Fingal Head.
Much of the floodplain is presently covered by sugar cane farms. Due to the dense vegetation of this crop, these areas have been represented in the hydraulic model as areas of high ‘roughness’ or resistance to flow (see Table 3-3). This means that flooding behaviour could differ if it occurred, for example, after harvesting, or if there is a significant change in land use in the floodplain. A decrease in the ‘roughness’ of the floodplain could result in a decrease in flood levels in these areas, coupled with an increase in downstream flood levels due to the quicker conveyance of floodwaters down the valley.
6.6 Comparison with Historical Floods
Historical flood profiles have been compared with the design floods. Figure 6-31 and Figure 6-32 show the historical and design peak flood level profiles for the Tweed River and Rous River respectively.
The 1974 profile indicates the event was higher than the 20 year ARI design flood along most of the Tweed River and the lower Rous River, though less than a 20 year ARI on the upper Rous River.
The 1978 profile indicates the event was less than a 5 year ARI in the upper reaches of the Tweed and Rous Rivers. Downstream of Condong, the event is somewhere between the 5 and 20 year ARI design flood. This may be in part due to the initial flooding produced from significant rainfall south of Stotts Creek.
The 1989 profile is similar to the 1974 event in the upper Tweed River (slightly larger than the 20 year ARI design flood). However, downstream of Condong it is more similar in magnitude to the 1978 event (between the 5 and 20 year ARI design flood). The 1989 flood on the Rous River was similar in profile to the 20 year ARI design flood (higher in the upper reaches).
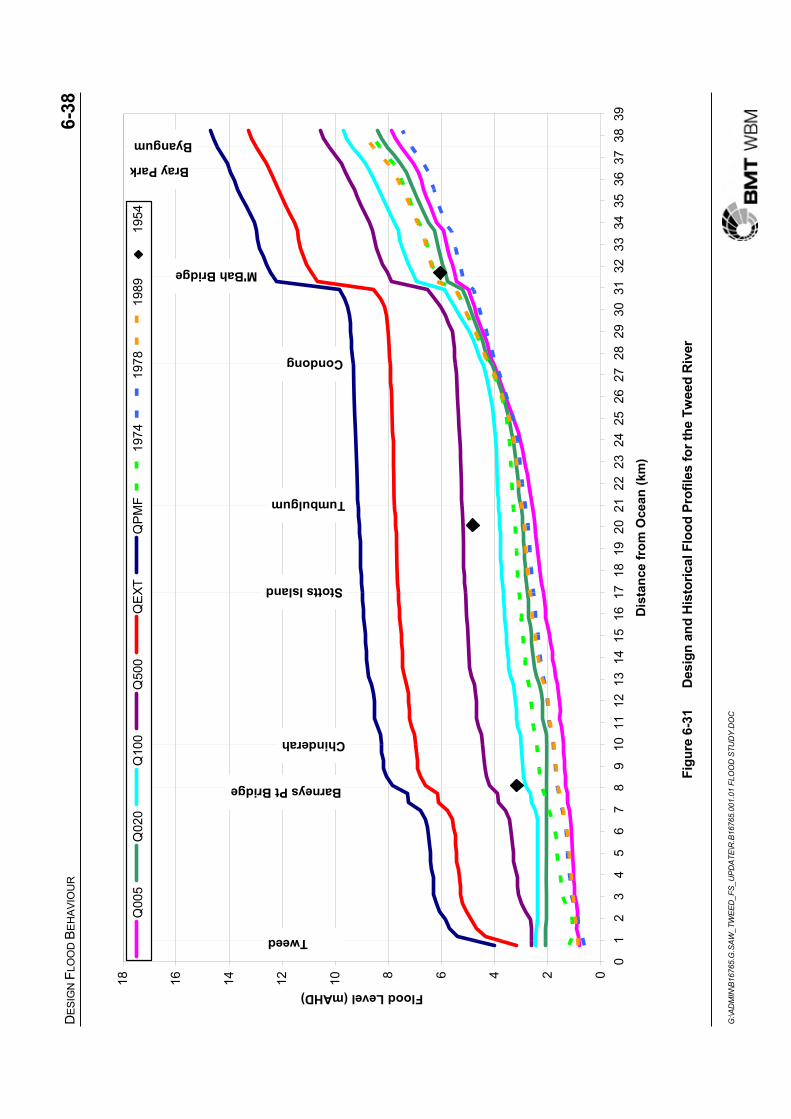
DES
IGN
FLO
OD
BEH
AVIO
UR
6-38
G:\A
DM
IN\B
1676
5.G
.SAW
_TW
EED
_FS_
UPD
ATE\
R.B
1676
5.00
1.01
FLO
OD
STU
DY.
DO
C
024681012141618
01
23
45
67
89
1011
1213
1415
1617
1819
2021
2223
2425
2627
2829
3031
3233
3435
3637
3839
Dis
tanc
e fr
om O
cean
(km
)
Flood Level (mAHD)Q
005
Q02
0Q
100
Q50
0Q
EXT
QP
MF
1974
1978
1989
1954
Tweed
Barneys Pt Bridge
Chinderah
Stotts Island
Tumbulgum
Condong
M'Bah Bridge
Bray Park
Byangum
Figu
re 6
-31
Des
ign
and
His
toric
al F
lood
Pro
files
for t
he T
wee
d R
iver

DES
IGN
FLO
OD
BEH
AVIO
UR
6-39
G:\A
DM
IN\B
1676
5.G
.SAW
_TW
EED
_FS_
UPD
ATE\
R.B
1676
5.00
1.01
FLO
OD
STU
DY.
DO
C
024681012
01
23
45
67
89
1011
1213
1415
1617
1819
20
Dis
tanc
e fr
om T
wee
d R
iver
(km
)
Flood Level (mAHD)Q
005
Q02
0Q
100
Q50
0Q
EXT
QP
MF
1974
1978
1989
Figu
re 6
-32
Des
ign
and
His
toric
al F
lood
Pro
files
for t
he R
ous
Riv
er
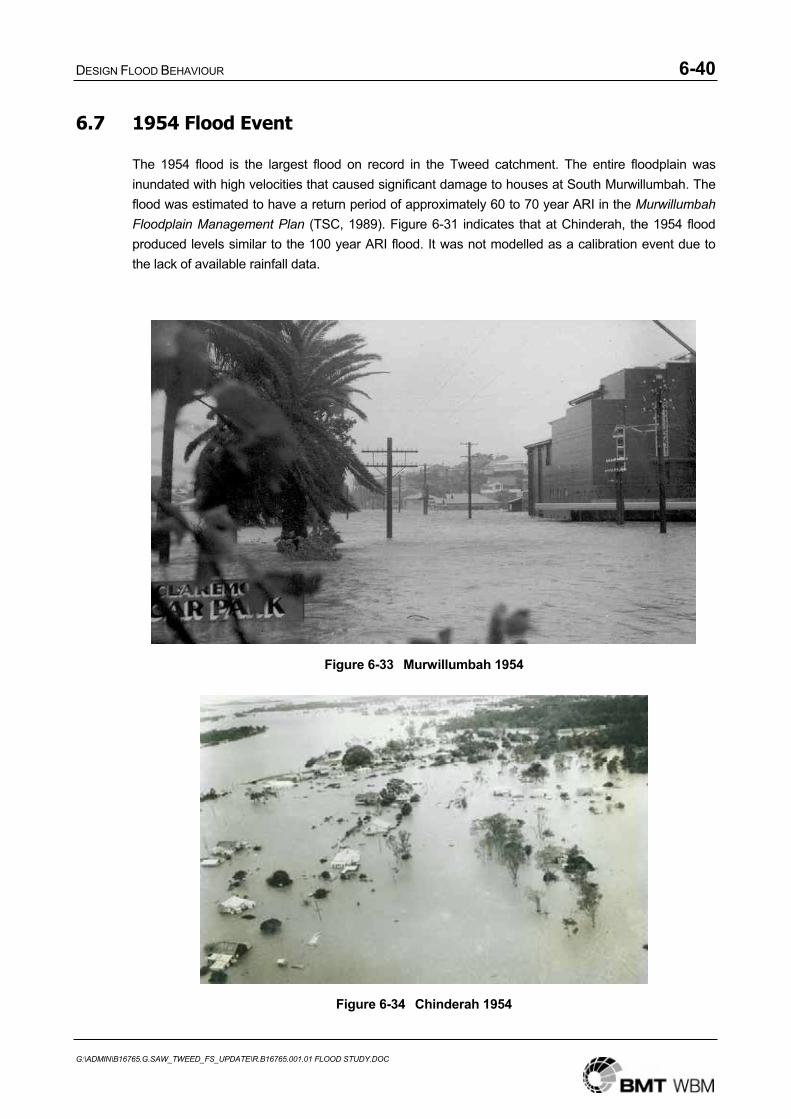
DESIGN FLOOD BEHAVIOUR 6-40
G:\ADMIN\B16765.G.SAW_TWEED_FS_UPDATE\R.B16765.001.01 FLOOD STUDY.DOC
6.7 1954 Flood Event
The 1954 flood is the largest flood on record in the Tweed catchment. The entire floodplain was inundated with high velocities that caused significant damage to houses at South Murwillumbah. The flood was estimated to have a return period of approximately 60 to 70 year ARI in the Murwillumbah Floodplain Management Plan (TSC, 1989). Figure 6-31 indicates that at Chinderah, the 1954 flood produced levels similar to the 100 year ARI flood. It was not modelled as a calibration event due to the lack of available rainfall data.
Figure 6-33 Murwillumbah 1954
Figure 6-34 Chinderah 1954
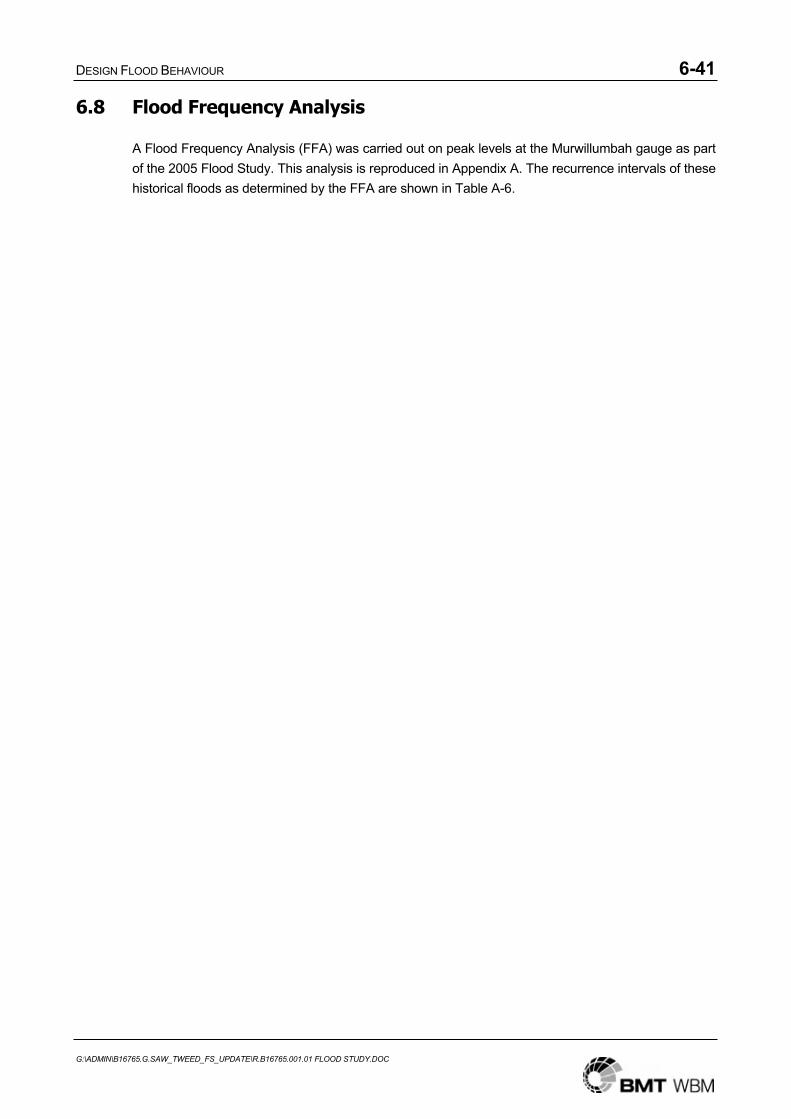
DESIGN FLOOD BEHAVIOUR 6-41
G:\ADMIN\B16765.G.SAW_TWEED_FS_UPDATE\R.B16765.001.01 FLOOD STUDY.DOC
6.8 Flood Frequency Analysis
A Flood Frequency Analysis (FFA) was carried out on peak levels at the Murwillumbah gauge as part of the 2005 Flood Study. This analysis is reproduced in Appendix A. The recurrence intervals of these historical floods as determined by the FFA are shown in Table A-6.

REFERENCES 7-1
G:\ADMIN\B16765.G.SAW_TWEED_FS_UPDATE\R.B16765.001.01 FLOOD STUDY.DOC
7 REFERENCES
AR&R (1997), “Australian Rainfall and Runoff”, Engineers Australia, Australia, 1997.
BoM (2003), “Revision of the Generalised Tropical Storm Method for Estimating Probable Maximum Precipitation”, Commonwealth Bureau of Meteorology, August 2003.
PWD (1956), “Tweed River Flood Mitigation Report”, prepared by E. Harrison and H. Lipping for NSW Public Works Department, December 1956.
PWD (1979), “Tweed River Dynamics Study”, Report 78009, Public Works Department of NSW, January, 1979.
PWD (1989), “Tweed River Flood Hydrology”, Public Works Department of NSW, December 1989.
PWD (1990), “Reviving the Tweed, Feasibility Study Final Report”, Public Works Department of NSW, 1990.
PWD (1991), “River Management Plan, Lower Tweed Estuary”, Preliminary Concepts, NSW Public Works Department, Technical Report No. 10, PWD 91065, September 1991.
PWD (1992), “River Management Plan, Lower Tweed Estuary”, Hydrodynamic and Water Quality Assessments, WBM Oceanics Australia for NSW Public Works Department, July 1992.
PWD (1993), “Lower Tweed Estuary River Management Plan: Environmental Impact Statement”, Sand Extraction – Area 5, WBM Oceanics Australia for Public Works Department of NSW, December 1993.
PWD (1995), “Lower Tweed Estuary River Management Plan: Environmental Impact Statement”, Sand Extraction – Area 5, WBM Oceanics Australia for Public Works Department of NSW, January 1995.
WBM (1974), “Flooding Investigation Dodds Island”, Oceanics Australia Pty Ltd for Geoffrey Burchill & Partners Pty Ltd, August 1974.
WBM (1979), “Tweed River Flooding Investigation, Kingscliff/Chinderah”, Oceanics Australia Pty Ltd for Tweed Shire Council, December 1979.
WBM (1980a), “Terranora/Tweed Heads Flooding Investigation”, Oceanics Australia Pty Ltd for Tweed Shire Council, July 1980.
WBM (1980b), “South Tweed Heads/Banora Point Flooding and Drainage Study”, Oceanics Australia Pty Ltd for Tweed Shire Council, December 1980.
WBM (1981a), “Murwillumbah Flooding Investigation”, Oceanics Australia Pty Ltd for Tweed Shire Council, May 1981.
WBM (1981b), “Proposed Development of Greenbank Island. Tidal Hydraulics, Sediment Transport and Water Quality”, Oceanics Australia Pty Ltd for Lend Lease Corporation Ltd, July 1981.
REFERENCES 7-2
G:\ADMIN\B16765.G.SAW_TWEED_FS_UPDATE\R.B16765.001.01 FLOOD STUDY.DOC
WBM (1982a), “Kingscliff/Chinderah Flooding Investigations”, Oceanics Australia Pty Ltd for NSW Public Works Department, May 1982.
WBM (1982b), “Murwillumbah Flooding Investigations Stage II”, Oceanics Australia Pty Ltd for Tweed Shire Council, November 1982.
WBM (1983a), “Tidal Flow, Floodway and Siltation Aspects – Proposed Lake Development, Cobaki”, Oceanics Australia Pty Ltd for Cameron McNamara Pty Ltd, January 1983.
WBM (1983b), “Chinderah Floodway Investigations”, Vols I & II, Oceanics Australia Pty Ltd for Tweed Shire Council and Tweed River Flood Mitigation Committee, December 1983.
WBM (1986), “Murwillumbah Flooding Investigation Stage III”, Oceanics Australia Pty Ltd for Tweed Shire Council and Tweed River Flood Mitigation Committee, March 1986.
WBM (1989a), “Tweed Entrance Feasibility Study”, Estuarine Dynamics Parts 1 to 3, Final Drafts submitted to NSW Public Works Department, November 1989.
WBM (1989b), “Tweed Entrance Feasibility Study”, Fluvial Dynamics – Technical Investigations,Final Draft submitted to NSW Public Works Department, November 1989.
WBM (1990a), “Tweed Entrance Feasibility Study”, Phase II Estuarine Investigations, Final Draft submitted to NSW Public Works Department, January 1990.
WBM (1990b), “Murwillumbah Flooding Investigations Stage IV”, Oceanics Australia Pty Ltd for Tweed Shire Council, June 1990.
WBM (1991a), “Chinderah Flooding Investigations”, WBM Pty Ltd for Tweed Shire Council, January 1991.
WBM (1991b), “Tweed River Hydrodynamics Study, Summary Report”, WBM Pty Ltd for Public Works Department, June 1991.
WBM (1997), “Banora Point/South Tweed Stormwater Management Plan”, WBM Oceanics Australia for Tweed Shire Council, 1997.
WBM (2005). “Tweed Valley Flood Study”, WBM Pty Ltd for Tweed Shire Council, 2005.
FLOOD FREQUENCY ANALYSIS A-1
G:\ADMIN\B16765.G.SAW_TWEED_FS_UPDATE\R.B16765.001.01 FLOOD STUDY.DOC
APPENDIX A: FLOOD FREQUENCY ANALYSIS
(Undertaken as part of the 2005 Flood Study.)
A.1 INTRODUCTION
An analytical flood frequency analysis (FFA) was carried out to define the magnitude of historical floods in the Tweed River. The FFA was carried out at the Murwillumbah gauge where sufficient river height data exists. The process undertaken is outlined below and discussed in the following sections:
Compilation of historical flood level records for the Murwillumbah gauges;
Development of historical rating curves;
Comparison of rating curves;
Calculation of a representative rating curve;
Comparison of the rating curve to past studies; and
Completion of Flood frequency analysis.
A.2 HISTORICAL FLOOD RECORDS
Over the last 118 years, there has been a gauge in operation at Murwillumbah. Gauge records commenced in 1887. Water level information was available from the following sources:
Tweed Shire Council;
Bureau of Meteorology; and
Manly Hydraulics Laboratory.
All available data for the period of 1887 to 2004 has been compiled and is shown in Table A-2. Note that this data does not represent an annual maximum data set, or a complete raw dataset. Problems relating to the incomplete nature of this dataset are discussed in Section A.2.4.1. Flows presented in Table A-2 are derived as described in Section A.3.2. Classifications are shown in Table A-1 and have been applied to the gauge level recordings in Table A-2.
Table A-1 Gauge Level Classifications Provided by Council / DIPNR
Gauge Height (mAHD) Classification < 3 no flood ( - )
3 to < 4.8 flood < 4.8 major flood
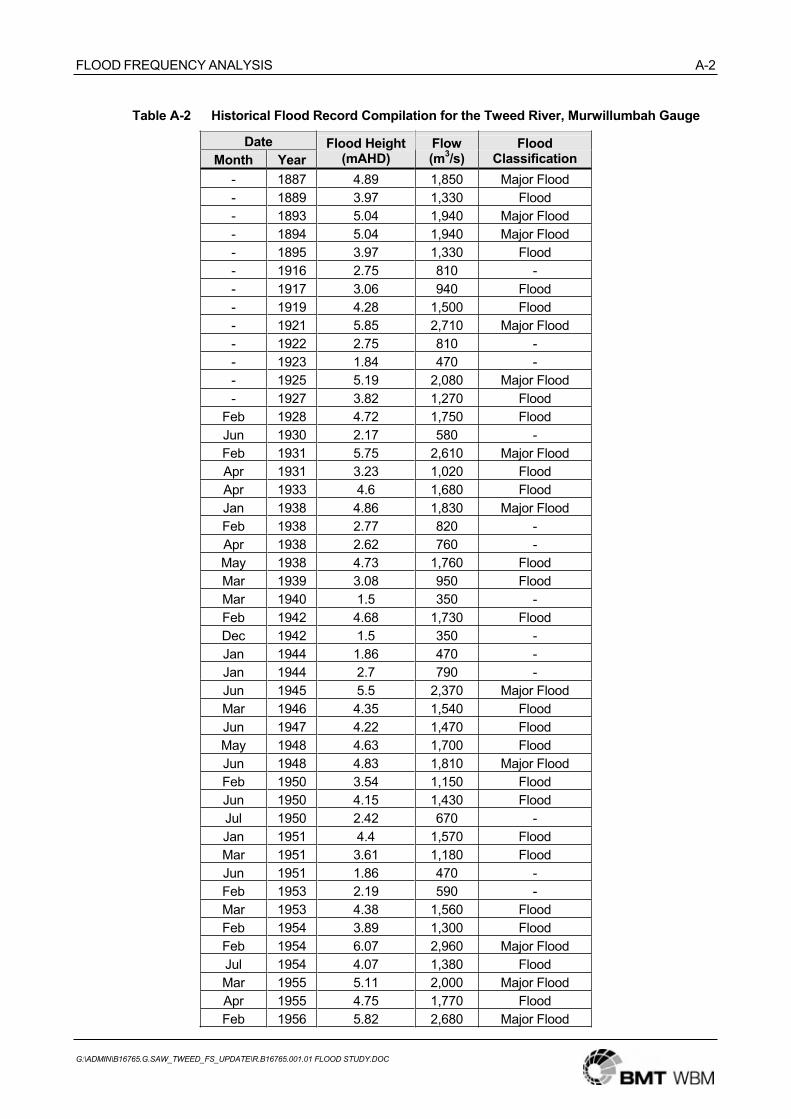
FLOOD FREQUENCY ANALYSIS A-2
G:\ADMIN\B16765.G.SAW_TWEED_FS_UPDATE\R.B16765.001.01 FLOOD STUDY.DOC
Table A-2 Historical Flood Record Compilation for the Tweed River, Murwillumbah Gauge
DateMonth Year
Flood Height (mAHD)
Flow (m3/s)
Flood Classification
- 1887 4.89 1,850 Major Flood - 1889 3.97 1,330 Flood - 1893 5.04 1,940 Major Flood - 1894 5.04 1,940 Major Flood - 1895 3.97 1,330 Flood - 1916 2.75 810 - - 1917 3.06 940 Flood - 1919 4.28 1,500 Flood - 1921 5.85 2,710 Major Flood - 1922 2.75 810 - - 1923 1.84 470 - - 1925 5.19 2,080 Major Flood - 1927 3.82 1,270 Flood
Feb 1928 4.72 1,750 Flood Jun 1930 2.17 580 - Feb 1931 5.75 2,610 Major Flood Apr 1931 3.23 1,020 Flood Apr 1933 4.6 1,680 Flood Jan 1938 4.86 1,830 Major Flood Feb 1938 2.77 820 - Apr 1938 2.62 760 - May 1938 4.73 1,760 Flood Mar 1939 3.08 950 Flood Mar 1940 1.5 350 - Feb 1942 4.68 1,730 Flood Dec 1942 1.5 350 - Jan 1944 1.86 470 - Jan 1944 2.7 790 - Jun 1945 5.5 2,370 Major Flood Mar 1946 4.35 1,540 Flood Jun 1947 4.22 1,470 Flood May 1948 4.63 1,700 Flood Jun 1948 4.83 1,810 Major Flood Feb 1950 3.54 1,150 Flood Jun 1950 4.15 1,430 Flood Jul 1950 2.42 670 - Jan 1951 4.4 1,570 Flood Mar 1951 3.61 1,180 Flood Jun 1951 1.86 470 - Feb 1953 2.19 590 - Mar 1953 4.38 1,560 Flood Feb 1954 3.89 1,300 Flood Feb 1954 6.07 2,960 Major Flood Jul 1954 4.07 1,380 Flood Mar 1955 5.11 2,000 Major Flood Apr 1955 4.75 1,770 Flood Feb 1956 5.82 2,680 Major Flood

FLOOD FREQUENCY ANALYSIS A-3
G:\ADMIN\B16765.G.SAW_TWEED_FS_UPDATE\R.B16765.001.01 FLOOD STUDY.DOC
DateMonth Year
Flood Height (mAHD)
Flow (m3/s)
Flood Classification
May 1956 3.74 1,230 Flood Jun 1958 3 920 Flood Feb 1959 4.22 1,470 Flood Mar 1959 3.23 1,020 Flood Feb 1961 4.55 1,650 Flood Jan 1962 3.08 950 Flood Jul 1962 3.13 970 Flood Jul 1962 4.24 1,480 Flood Jan 1963 3.05 940 Flood Mar 1963 3.92 1,310 Flood May 1963 5.21 2,100 Major Flood Jul 1965 3.94 1,320 Flood Jan 1967 1.5 350 - Mar 1967 3.08 950 Flood Jun 1967 2.42 670 - Jun 1967 5.01 1,910 Major Flood Jun 1967 3.51 1,140 Flood Jun 1967 2.29 620 - Jun 1967 2.32 630 - Jan 1968 2.6 750 - Dec 1970 3.71 1,220 Flood Feb 1971 2.4 660 - Feb 1972 4.91 1,860 Major Flood Apr 1972 4.6 1,680 Flood Oct 1972 4.63 1,700 Flood Oct 1972 3.47 1,120 Flood Feb 1973 4.75 1,770 Flood Jan 1974 5.42 2,300 Major Flood Mar 1974 5.9 2,750 Major Flood Jan 1976 2.24 610 - Feb 1976 5.01 1,910 Major Flood Feb 1976 2.6 750 - Mar 1978 5.2 2,090 Major Flood May 1980 4.35 1,540 Flood Jun 1983 3.53 1,140 Flood Apr 1984 4.53 1,640 Flood Mar 1987 4.18 1,450 Flood May 1987 5.26 2,150 Major Flood May 1987 3.21 1,010 Flood April 1988 4.35 1,540 Flood April 1988 4.41 1,580 Flood April 1988 3.76 1,240 Flood April 1989 5.6 2,470 Major Flood April 1989 5.6 2,470 Major Flood Feb 1990 4.11 1,410 Flood Dec 1991 4.52 1,640 Flood Feb 1995 2.43 680 - Feb 1995 2.67 780 - May 1996 3.78 1,250 Flood
FLOOD FREQUENCY ANALYSIS A-4
G:\ADMIN\B16765.G.SAW_TWEED_FS_UPDATE\R.B16765.001.01 FLOOD STUDY.DOC
DateMonth Year
Flood Height (mAHD)
Flow (m3/s)
Flood Classification
May 1996 3.9 1,300 Flood Dec 1998 2.51 710 - Mar 1999 1.02 190 - Mar 1999 1.19 240 - Mar 1999 1.35 290 - Mar 1999 1.55 360 - Feb 2001 4.85 1,820 Major Flood Feb 2001 4.1 1,400 Flood Mar 2001 1.84 470 - Mar 2004 4.04 1,370 Flood Jan 2008 4.87 1,840 Major Flood
A.3 RATING CURVES
A.3.1 Historical Rating Curves
To convert historical flood levels to flows, a rating curve is required. In the absence of a gauged rating curve at the gauge site, a model rating curve is derived using the Tweed River hydraulic flood model. The model rating curves are required to represent three historical floodplain states. These floodplain states are chosen based on review of historical changes in the floodplain, including the Murwillumbah Levee, over the period of analysis. The three states are post-1974, post-1989 and post-1990 (present case model). These cases are used in the hydraulic flood model with 500 year ARI flows to produce rating curves at the Murwillumbah gauge. These rating curves are shown in Figure A-1.
A.3.2 Representative Rating Curve
As shown in Figure A-1, rating curves have a rising, and a falling limb due to hysteresis. If the flows were determined from a rating curve with hysteresis, there would be two different flows read for each level. Where historical rating curves differ significantly, the flow corresponding to a gauge level will also be different. Therefore a representative rating curve is developed that incorporates characteristics such as changes to the floodplain and hysteresis effects in flow behaviour into a single rating curve. To develop a representative rating curve, the historical rating curves are graphed as in Figure A-1and a curve is manually assigned to best represent the historical data. As shown in Figure A-1, the rating curves for each of the three floodplain states are very similar. Thus, it is possible to use the design (present case) model results for the 5 year and 100 year ARI floods to assist in deriving the representative rating curve to be used to determine historical flows at the gauge. These too are shown in Figure A-1. The representative rating curve is shown, plotted with the other rating curves in Figure A-1. The representative rating curve is used to calculate the flows corresponding to the recorded levels at the gauge. Calculated flows are shown in Table A-2.
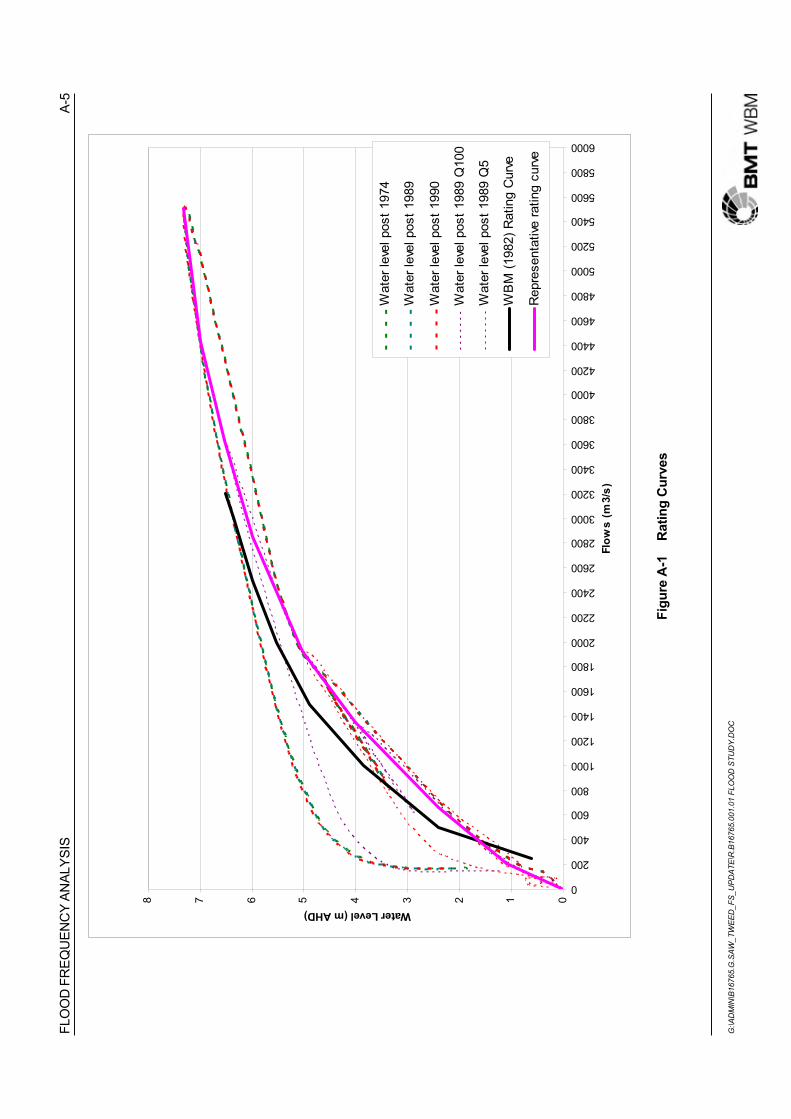
FLO
OD
FREQ
UEN
CY
ANAL
YSIS
A-
5
G:\A
DM
IN\B
1676
5.G
.SAW
_TW
EED
_FS_
UPD
ATE\
R.B
1676
5.00
1.01
FLO
OD
STU
DY.
DO
C
012345678
0
200
400
600
800
1000
1200
1400
1600
1800
2000
2200
2400
2600
2800
3000
3200
3400
3600
3800
4000
4200
4400
4600
4800
5000
5200
5400
5600
5800
6000
Flow
s (m
3/s)
Water Level (m AHD)
Wat
er le
vel p
ost 1
974
Wat
er le
vel p
ost 1
989
Wat
er le
vel p
ost 1
990
Wat
er le
vel p
ost 1
989
Q10
0
Wat
er le
vel p
ost 1
989
Q5
WB
M (1
982)
Rat
ing
Cur
ve
Rep
rese
ntat
ive ra
ting
curv
e
Figu
re A
-1
Rat
ing
Cur
ves
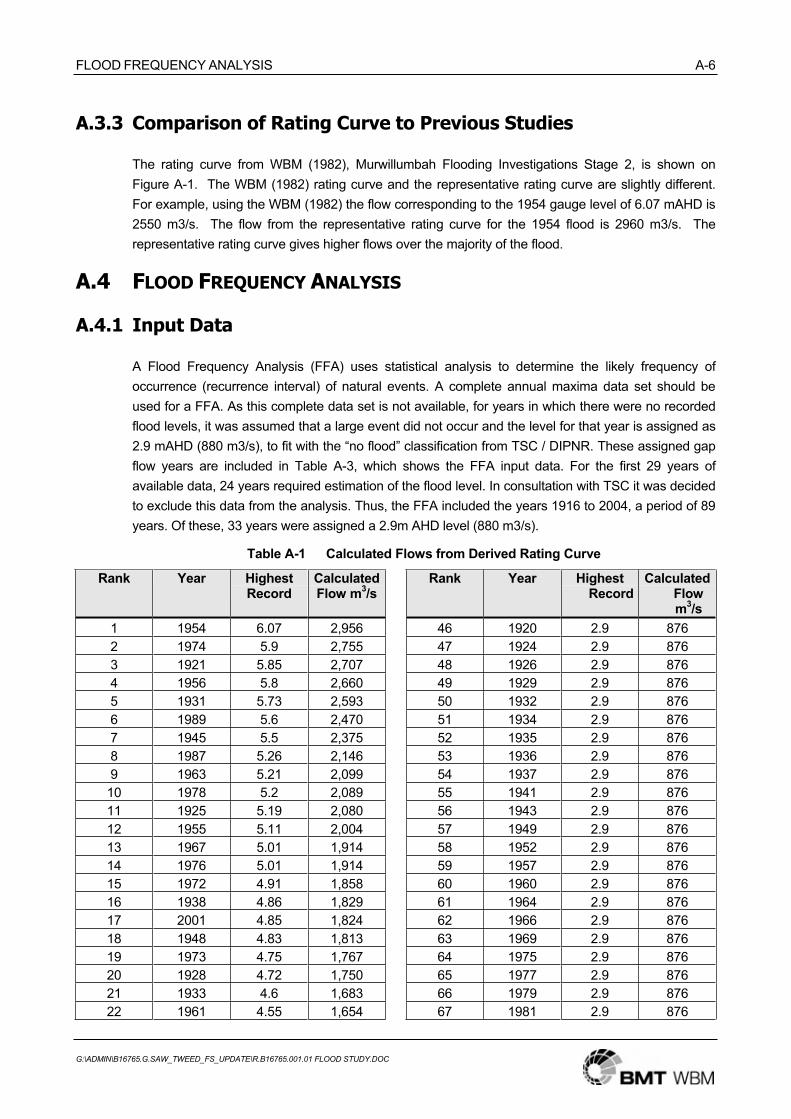
FLOOD FREQUENCY ANALYSIS A-6
G:\ADMIN\B16765.G.SAW_TWEED_FS_UPDATE\R.B16765.001.01 FLOOD STUDY.DOC
A.3.3 Comparison of Rating Curve to Previous Studies
The rating curve from WBM (1982), Murwillumbah Flooding Investigations Stage 2, is shown on Figure A-1. The WBM (1982) rating curve and the representative rating curve are slightly different. For example, using the WBM (1982) the flow corresponding to the 1954 gauge level of 6.07 mAHD is 2550 m3/s. The flow from the representative rating curve for the 1954 flood is 2960 m3/s. The representative rating curve gives higher flows over the majority of the flood.
A.4 FLOOD FREQUENCY ANALYSIS
A.4.1 Input Data
A Flood Frequency Analysis (FFA) uses statistical analysis to determine the likely frequency of occurrence (recurrence interval) of natural events. A complete annual maxima data set should be used for a FFA. As this complete data set is not available, for years in which there were no recorded flood levels, it was assumed that a large event did not occur and the level for that year is assigned as 2.9 mAHD (880 m3/s), to fit with the “no flood” classification from TSC / DIPNR. These assigned gap flow years are included in Table A-3, which shows the FFA input data. For the first 29 years of available data, 24 years required estimation of the flood level. In consultation with TSC it was decided to exclude this data from the analysis. Thus, the FFA included the years 1916 to 2004, a period of 89 years. Of these, 33 years were assigned a 2.9m AHD level (880 m3/s).
Table A-1 Calculated Flows from Derived Rating Curve
Rank Year HighestRecord
Calculated Flow m3/s
Rank Year HighestRecord
Calculated Flow m3/s
1 1954 6.07 2,956 46 1920 2.9 876 2 1974 5.9 2,755 47 1924 2.9 876 3 1921 5.85 2,707 48 1926 2.9 876 4 1956 5.8 2,660 49 1929 2.9 876 5 1931 5.73 2,593 50 1932 2.9 876 6 1989 5.6 2,470 51 1934 2.9 876 7 1945 5.5 2,375 52 1935 2.9 876 8 1987 5.26 2,146 53 1936 2.9 876 9 1963 5.21 2,099 54 1937 2.9 876 10 1978 5.2 2,089 55 1941 2.9 876 11 1925 5.19 2,080 56 1943 2.9 876 12 1955 5.11 2,004 57 1949 2.9 876 13 1967 5.01 1,914 58 1952 2.9 876 14 1976 5.01 1,914 59 1957 2.9 876 15 1972 4.91 1,858 60 1960 2.9 876 16 1938 4.86 1,829 61 1964 2.9 876 17 2001 4.85 1,824 62 1966 2.9 876 18 1948 4.83 1,813 63 1969 2.9 876 19 1973 4.75 1,767 64 1975 2.9 876 20 1928 4.72 1,750 65 1977 2.9 876 21 1933 4.6 1,683 66 1979 2.9 876 22 1961 4.55 1,654 67 1981 2.9 876
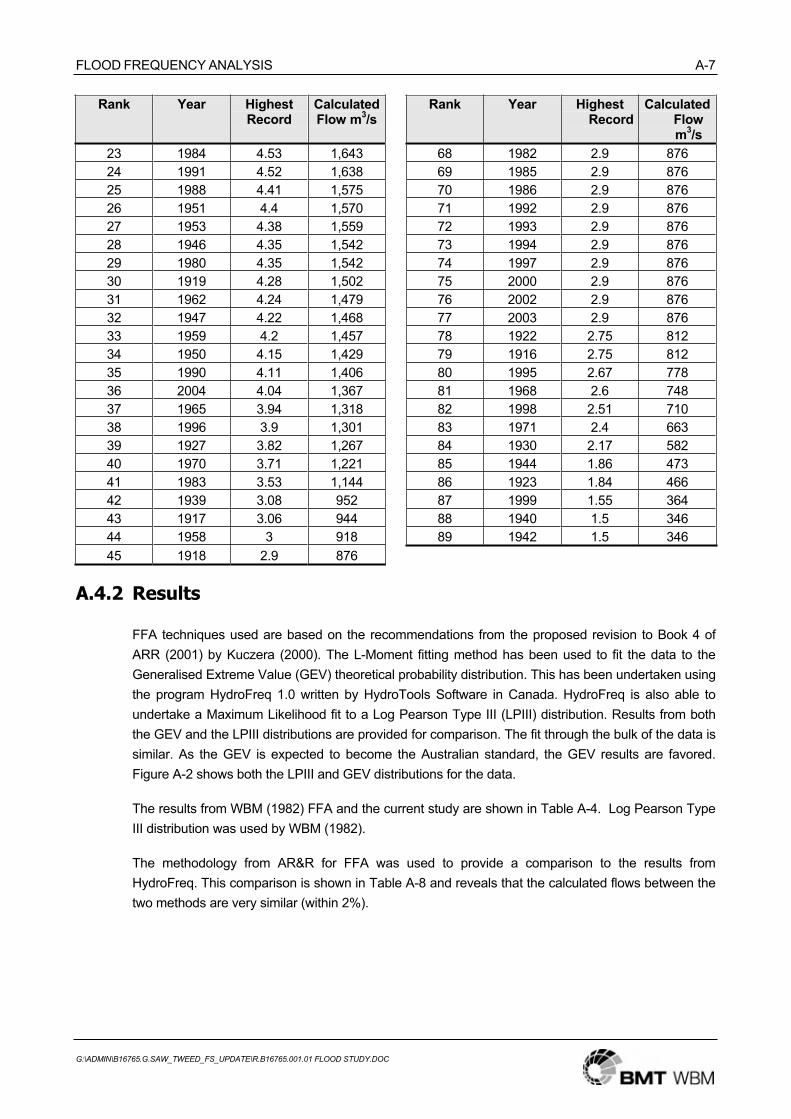
FLOOD FREQUENCY ANALYSIS A-7
G:\ADMIN\B16765.G.SAW_TWEED_FS_UPDATE\R.B16765.001.01 FLOOD STUDY.DOC
Rank Year HighestRecord
Calculated Flow m3/s
Rank Year HighestRecord
Calculated Flow m3/s
23 1984 4.53 1,643 68 1982 2.9 876 24 1991 4.52 1,638 69 1985 2.9 876 25 1988 4.41 1,575 70 1986 2.9 876 26 1951 4.4 1,570 71 1992 2.9 876 27 1953 4.38 1,559 72 1993 2.9 876 28 1946 4.35 1,542 73 1994 2.9 876 29 1980 4.35 1,542 74 1997 2.9 876 30 1919 4.28 1,502 75 2000 2.9 876 31 1962 4.24 1,479 76 2002 2.9 876 32 1947 4.22 1,468 77 2003 2.9 876 33 1959 4.2 1,457 78 1922 2.75 812 34 1950 4.15 1,429 79 1916 2.75 812 35 1990 4.11 1,406 80 1995 2.67 778 36 2004 4.04 1,367 81 1968 2.6 748 37 1965 3.94 1,318 82 1998 2.51 710 38 1996 3.9 1,301 83 1971 2.4 663 39 1927 3.82 1,267 84 1930 2.17 582 40 1970 3.71 1,221 85 1944 1.86 473 41 1983 3.53 1,144 86 1923 1.84 466 42 1939 3.08 952 87 1999 1.55 364 43 1917 3.06 944 88 1940 1.5 346 44 1958 3 918 89 1942 1.5 346 45 1918 2.9 876
A.4.2 Results
FFA techniques used are based on the recommendations from the proposed revision to Book 4 of ARR (2001) by Kuczera (2000). The L-Moment fitting method has been used to fit the data to the Generalised Extreme Value (GEV) theoretical probability distribution. This has been undertaken using the program HydroFreq 1.0 written by HydroTools Software in Canada. HydroFreq is also able to undertake a Maximum Likelihood fit to a Log Pearson Type III (LPIII) distribution. Results from both the GEV and the LPIII distributions are provided for comparison. The fit through the bulk of the data is similar. As the GEV is expected to become the Australian standard, the GEV results are favored. Figure A-2 shows both the LPIII and GEV distributions for the data.
The results from WBM (1982) FFA and the current study are shown in Table A-4. Log Pearson Type III distribution was used by WBM (1982).
The methodology from AR&R for FFA was used to provide a comparison to the results from HydroFreq. This comparison is shown in Table A-8 and reveals that the calculated flows between the two methods are very similar (within 2%).
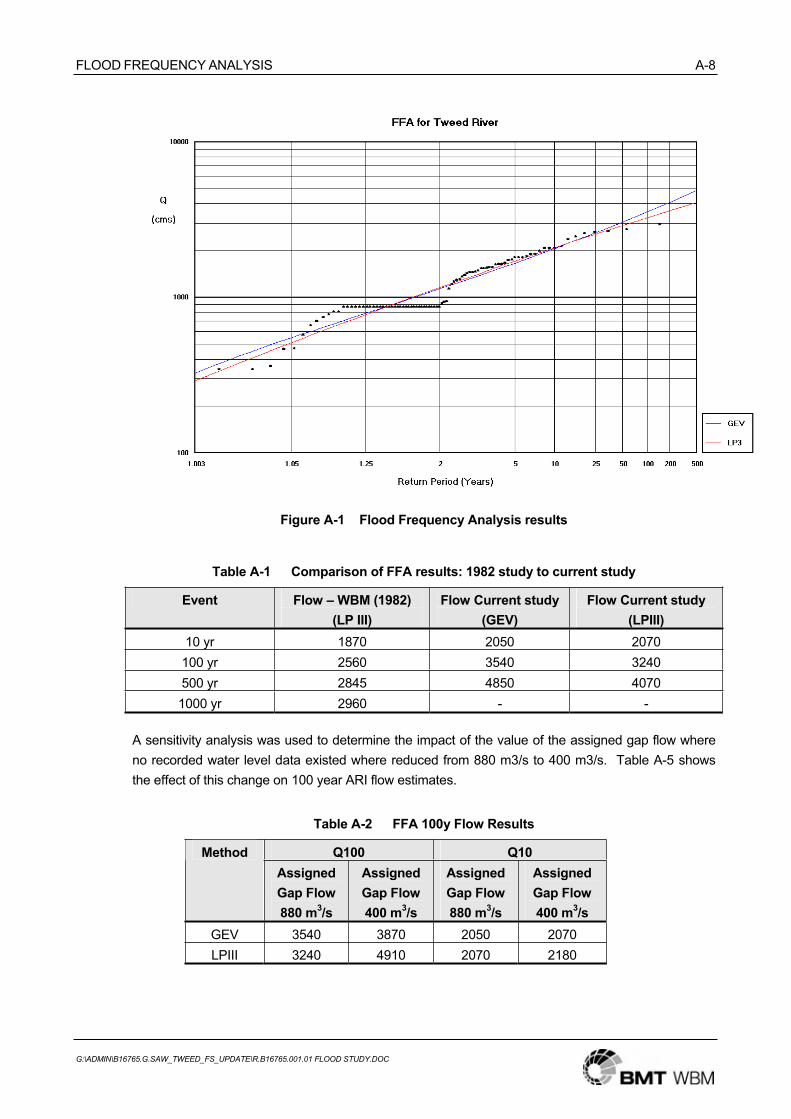
FLOOD FREQUENCY ANALYSIS A-8
G:\ADMIN\B16765.G.SAW_TWEED_FS_UPDATE\R.B16765.001.01 FLOOD STUDY.DOC
Figure A-1 Flood Frequency Analysis results
Table A-1 Comparison of FFA results: 1982 study to current study
Event Flow – WBM (1982) (LP III)
Flow Current study (GEV)
Flow Current study (LPIII)
10 yr 1870 2050 2070 100 yr 2560 3540 3240 500 yr 2845 4850 4070 1000 yr 2960 - -
A sensitivity analysis was used to determine the impact of the value of the assigned gap flow where no recorded water level data existed where reduced from 880 m3/s to 400 m3/s. Table A-5 shows the effect of this change on 100 year ARI flow estimates.
Table A-2 FFA 100y Flow Results
Q100 Q10MethodAssignedGap Flow 880 m3/s
AssignedGap Flow 400 m3/s
AssignedGap Flow 880 m3/s
AssignedGap Flow 400 m3/s
GEV 3540 3870 2050 2070 LPIII 3240 4910 2070 2180
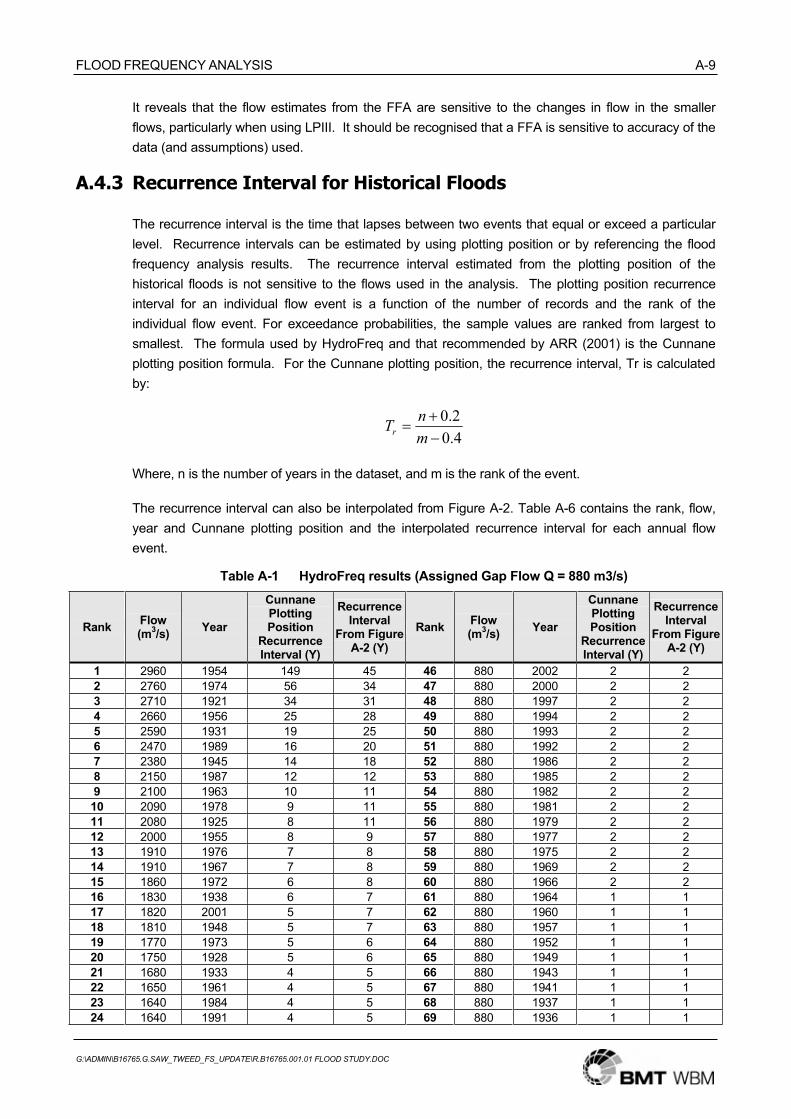
FLOOD FREQUENCY ANALYSIS A-9
G:\ADMIN\B16765.G.SAW_TWEED_FS_UPDATE\R.B16765.001.01 FLOOD STUDY.DOC
It reveals that the flow estimates from the FFA are sensitive to the changes in flow in the smaller flows, particularly when using LPIII. It should be recognised that a FFA is sensitive to accuracy of the data (and assumptions) used.
A.4.3 Recurrence Interval for Historical Floods
The recurrence interval is the time that lapses between two events that equal or exceed a particular level. Recurrence intervals can be estimated by using plotting position or by referencing the flood frequency analysis results. The recurrence interval estimated from the plotting position of the historical floods is not sensitive to the flows used in the analysis. The plotting position recurrence interval for an individual flow event is a function of the number of records and the rank of the individual flow event. For exceedance probabilities, the sample values are ranked from largest to smallest. The formula used by HydroFreq and that recommended by ARR (2001) is the Cunnane plotting position formula. For the Cunnane plotting position, the recurrence interval, Tr is calculated by:
4.02.0
mnTr
Where, n is the number of years in the dataset, and m is the rank of the event.
The recurrence interval can also be interpolated from Figure A-2. Table A-6 contains the rank, flow, year and Cunnane plotting position and the interpolated recurrence interval for each annual flow event.
Table A-1 HydroFreq results (Assigned Gap Flow Q = 880 m3/s)
Rank Flow (m3/s) Year
Cunnane PlottingPosition
Recurrence Interval (Y)
Recurrence Interval
From Figure A-2 (Y)
Rank Flow (m3/s) Year
Cunnane PlottingPosition
Recurrence Interval (Y)
Recurrence Interval
From Figure A-2 (Y)
1 2960 1954 149 45 46 880 2002 2 2 2 2760 1974 56 34 47 880 2000 2 2 3 2710 1921 34 31 48 880 1997 2 2 4 2660 1956 25 28 49 880 1994 2 2 5 2590 1931 19 25 50 880 1993 2 2 6 2470 1989 16 20 51 880 1992 2 2 7 2380 1945 14 18 52 880 1986 2 2 8 2150 1987 12 12 53 880 1985 2 2 9 2100 1963 10 11 54 880 1982 2 2 10 2090 1978 9 11 55 880 1981 2 2 11 2080 1925 8 11 56 880 1979 2 2 12 2000 1955 8 9 57 880 1977 2 2 13 1910 1976 7 8 58 880 1975 2 2 14 1910 1967 7 8 59 880 1969 2 2 15 1860 1972 6 8 60 880 1966 2 2 16 1830 1938 6 7 61 880 1964 1 1 17 1820 2001 5 7 62 880 1960 1 1 18 1810 1948 5 7 63 880 1957 1 1 19 1770 1973 5 6 64 880 1952 1 1 20 1750 1928 5 6 65 880 1949 1 1 21 1680 1933 4 5 66 880 1943 1 1 22 1650 1961 4 5 67 880 1941 1 1 23 1640 1984 4 5 68 880 1937 1 1 24 1640 1991 4 5 69 880 1936 1 1

FLOOD FREQUENCY ANALYSIS A-10
G:\ADMIN\B16765.G.SAW_TWEED_FS_UPDATE\R.B16765.001.01 FLOOD STUDY.DOC
Rank Flow (m3/s) Year
Cunnane PlottingPosition
Recurrence Interval (Y)
Recurrence Interval
From Figure A-2 (Y)
Rank Flow (m3/s) Year
Cunnane PlottingPosition
Recurrence Interval (Y)
Recurrence Interval
From Figure A-2 (Y)
25 1580 1988 4 5 70 880 1935 1 1 26 1570 1951 3 5 71 880 1934 1 1 27 1560 1953 3 4 72 880 1932 1 1 28 1540 1980 3 4 73 880 1929 1 1 29 1540 1946 3 4 74 880 1926 1 1 30 1500 1919 3 4 75 880 1924 1 1 31 1480 1962 3 4 76 880 1920 1 1 32 1470 1947 3 4 77 880 1918 1 1 33 1460 1959 3 4 78 810 1916 1 1 34 1430 1950 3 4 79 810 1922 1 1 35 1410 1990 3 4 80 780 1995 1 1 36 1370 2004 3 3 81 750 1968 1 1 37 1320 1965 2 3 82 710 1998 1 1 38 1300 1996 2 3 83 660 1971 1 1 39 1270 1927 2 3 84 580 1930 1 1 40 1220 1970 2 3 85 470 1944 1 1 41 1140 1983 2 2 86 470 1923 1 1 42 950 1939 2 2 87 360 1999 1 1 43 940 1917 2 2 88 350 1942 1 1 44 920 1958 2 2 89 350 1940 1 1 45 880 2003 2
The plotting position or recurrence interval is highly sensitive to the number of years in a data set. Table A-7 shows three FFA scenarios and the corresponding Cunnane plotting position, for the 1954 flood event at Murwillumbah.
Table A-2 Cunnane Plotting Position for the 1954 Flood for Various Periods of Data
Period No. of years in FFA Estimate Included for Gap Years?
Cunnane Plotting Position (Y)
1917-2004 88 Y 149 1887-2004 58 N 97 1887-1980 45 N 75*
*As determined by the WBM (1982) study
Table A-3 Cunnane Plotting Position for the 1954 Flood for Various Periods of Data
Calculated Flows (m3/s)ARILPIII – HydroFreq LPIII – AR&R *
2 1160 1150 5 1700 1700 10 2070 2080 20 2430 2450 50 2890 2940 100 3240 3320 200 3600 3720 500 4070 4210
*Comparison with AR&R design event flows
FLOOD FREQUENCY ANALYSIS A-11
G:\ADMIN\B16765.G.SAW_TWEED_FS_UPDATE\R.B16765.001.01 FLOOD STUDY.DOC
A.5 DISCUSSION
As described in Section A.4.2, there are a number of analysis techniques that may be used to undertake a FFA. In this case, the GEV distribution has been used in conjunction with the LMoments fitting method. However, the LPIII distribution is also available. It is used is conjunction with the Maximum Likelihood fitting technique as a sensitivity check, and the results included. The LPIII distribution predicts significantly lower flows in the larger flood events (up to 20%). In the smaller events (10 year ARI) there are only minor differences (1%).
Reducing the estimated flows from 880 m3/s to 400 m3/s had significant impacts on the FFA. This is particularly evident in the LPIII distribution and affects the higher flows (larger events) more than the smaller events.
Including the major historical floods also has a significant impact on the FFA results. Although these are a rough estimate, the general trend is that the FFA curve shifts upwards with the inclusion of these major events.

KEY CHANGES FROM 2005 FLOOD STUDY B-1
APPENDIX B: KEY CHANGES FROM 2005 FLOOD STUDY
B.1 Data and Methodology
The key differences in input data and methodology between the 2005 and 2009 Flood Study are as follows:
DEM: The primary purpose of the 2009 update was to incorporate much improved topographic data of the catchment, obtained from ALS data collected in July 2007. On average, the new 2009 DEM ground levels were approximately 200 mm lower than the 2005 DEM ground levels across the 100 year ARI floodplain.
Levees: Additional levee data was included based on new survey of the Tweed Heads South levee and design drawings for the new Dorothy Street and East Murwillumbah levees constructed in 2006.
Rainfall: Historical and design rainfall data was updated to reflect improved GIS techniques for the spatial distribution of rainfall. For historical and medium to large design rainfall events (i.e. up to the 100 year ARI) this rainfall was comparable to that used in the 2005 study. For the rare to extreme design rainfall events (i.e. 500 year ARI to PMP) the methodology was updated to incorporate the current standard for estimating PMP (i.e. BoM’s GTSMR method, see Section 5.2.3). The PMP estimated by this method (1680 mm) was approximately 35% more than that estimated for the 2005 study (1250 mm).
Hydrologic model: A new WBNM hydrology model was developed to reflect improved GIS techniques for delineating subcatchments and applying spatial distribution of rainfall, as well as to incorporate the updated rare to extreme design rainfall (see above).
Hydraulic model: A number of updates were made to the TUFLOW hydraulic model:
The software was updated to the latest 2008 version of TUFLOW;
The projection was updated to the current standard geographic projection (i.e. Map Grid of Australia 1994);
During the calibration process, the model was extended approximately 10 kilometres upstream along the middle and south arms of the Tweed River in 1D to better represent the storage effects of these reaches;
The topography was updated to reflect the new DEM and topographic data (see above);
The land use was updated to reflect the new 2007 aerial photography;
The inflows and runoff were updated based on the new hydrologic model (see above); and
Dune breaches and bed scour were included in the PMF to represent morphological changes likely to occur in an event of this magnitude.
KEY CHANGES FROM 2005 FLOOD STUDY B-2
B.2 Design Flood Levels
As a result of the above updates and changes in input data and methodology, Figure B-1 and Figure B-2 show the change in the 100 year ARI and PMF design flood levels from the 2005 Flood Study. The following general observations are made:
100 year ARI design flood levels are broadly:
0.1 to 0.2 metres higher at the Bray Park breakout;
Within approximately 0.1 metre at the river mouth, Cobaki, Terranora, Chinderah, West Kingscliff, and along the Tweed River at Murwillumbah;
0.1 to 0.2 metres lower along most of the Tweed River from Stotts Island to Letitia;
0.2 to 0.5 metres lower along the Rous River and the Tweed River from Condong to Stotts Island;
0.5 to 1 metre lower in the Condong Creek floodplain; and
More than 1 metre lower in Murwillumbah township (behind the levee).
PMF design flood levels are broadly:
1 to 1.5 metres higher from Byangum to Stotts Island, and in the lower Tweed; and
1.5 to 2 metres higher from Stotts Island to Barneys Point.
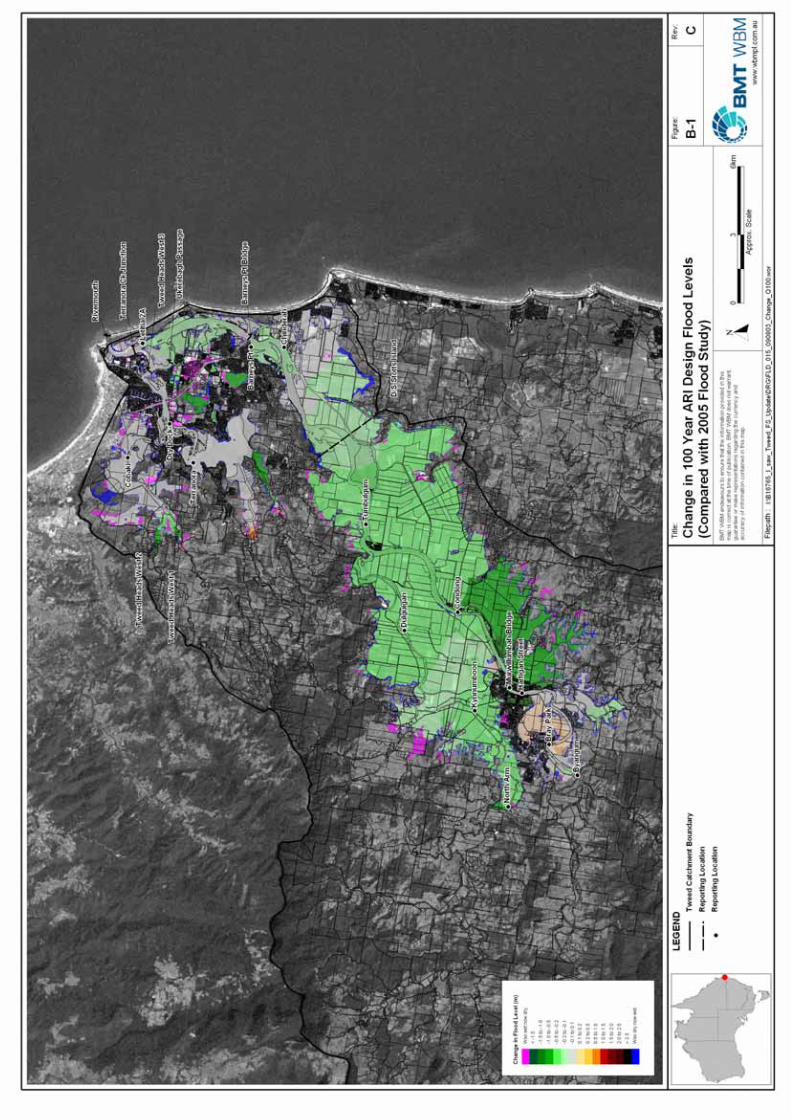
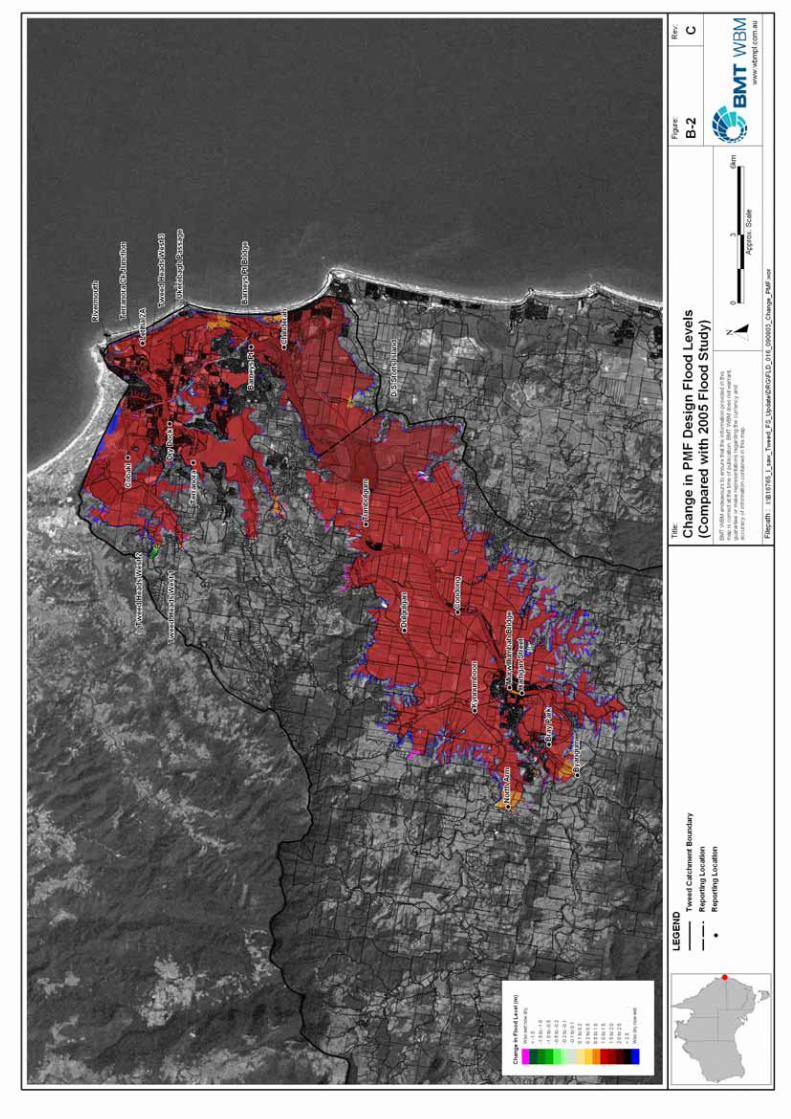
BMT WBM Brisbane Level 11, 490 Upper Edward Street Brisbane 4000 PO Box 203 Spring Hill QLD 4004 Tel +61 7 3831 6744 Fax +61 7 3832 3627 Email [email protected] Web www.wbmpl.com.au
BMT WBM Denver 14 Inverness Drive East, #B132 Englewood Denver Colorado 80112 USA Tel +1 303 792 9814 Fax +1 303 792 9742 Email [email protected] Web www.wbmpl.com.au
BMT WBM Melbourne Level 5, 99 King Street Melbourne 3000 PO Box 604 Collins Street West VIC 8007 Tel +61 3 8620 6100 Fax +61 3 8620 6105 Email [email protected] Web www.wbmpl.com.au
BMT WBM Morwell Cnr Hazelwood Drive & Miners Way Morwell 3840 PO Box 888 Morwell VIC 3840 Tel +61 3 5135 3400 Fax +61 3 5135 3444 Email [email protected] Web www.wbmpl.com.au
BMT WBM Newcastle 126 Belford Street Broadmeadow 2292 PO Box 266 Broadmeadow NSW 2292 Tel +61 2 4940 8882 Fax +61 2 4940 8887 Email [email protected] Web www.wbmpl.com.au
BMT WBM Perth 1 Brodie Hall Drive Technology Park Bentley 6102 Tel +61 8 9328 2029 Fax +61 8 9486 7588 Email [email protected] Web www.wbmpl.com.au
BMT WBM Sydney Suite 206, 118 Great North Road Five Dock 2046 PO Box 129 Five Dock NSW 2046 Tel +61 2 9713 4836 Fax +61 2 9713 4890 Email [email protected] Web www.wbmpl.com.au
BMT WBM Vancouver 1190 Melville Street #700 Vancouver British Columbia V6E 3W1 Canada Tel +1 604 683 5777 Fax +1 604 608 3232 Email [email protected] Web www.wbmpl.com.au