Embed Size (px)
Citation preview
Tweed Shire
Community Greenhouse Gas
Profile Report

www.realaction.com.au
Tweed Shire Council Greenhouse Gas Profile Report Page 2 of 28
Prepared for
Tweed Shire Council
Version Author Date Description of changes
V0a - b Nick Cody 30/10/2017 First draft
V1a Hannah Snape 10/11/2017 Final draft
V1b - d Nick Cody 14/02/2018 Final report after feedback from Council
Prepared by
Ironbark Sustainability
Suite 8, 70-80 Wellington St, Collingwood 3066
ABN: 51 127 566 090
Ph: 1300 288 262 | [email protected] | www.realaction.com.au
© 2017 Ironbark Group Pty. Ltd.
The information contained in this document produced by Ironbark Group Pty. Ltd is solely for the use of
the client identified on this page for the purpose for which it has been prepared and Ironbark Group Pty.
Ironbark undertakes no duty to or accepts any responsibility to any third party who may rely upon this
document. All rights reserved. No section or element of this document may be removed from this
document, reproduced, electronically stored or transmitted in any form without the written permission of
Ironbark Group Pty. Ltd.
About Ironbark Sustainability
Ironbark Sustainability is a specialist consultancy that works with government and business around
Australia by assisting them to reduce energy and water usage through sustainable asset and data
management and on-the-ground implementation.
Ironbark has been operating since 2005 and brings together a wealth of technical and financial analysis,
maintenance and implementation experience in the areas of building energy and water efficiency, public
lighting and data management. We pride ourselves on supporting our clients to achieve real action
regarding the sustainable management of their operations.
Our Mission
The Ironbark mission is to achieve real action on sustainability for councils and their communities.

www.realaction.com.au
Tweed Shire Council Greenhouse Gas Profile Report Page 3 of 28
Contents
Abbreviations and Definitions 5
1. Executive Summary 7
2. Introduction 9
2.1 Background ...................................................................................................... 9
2.2 Council Community Profile ................................................................................. 9
2.3 Use of this Profile ............................................................................................. 10
3. Methodology and GPC Compliance 11
3.1 Disclaimer ....................................................................................................... 13
3.2 IPCC Greenhouse Gas System Boundary ............................................................. 13
4. Total Emissions Profile 15
4.1 Emissions Breakdown ....................................................................................... 15
4.2 Completeness .................................................................................................. 17
4.3 Data Accuracy ................................................................................................. 18
5. Recommendations and Next Steps 20
5.1 Proposed Next Steps ........................................................................................ 20
6. Appendix 1: Data Inputs 21
6.1 Source Data .................................................................................................... 21
6.2 Greenhouse Gas Emissions Factors .................................................................... 22
7. Appendix 2: Policy Context 27
Tables
Table 1: Total community emissions summary for Tweed Shire Council ............................................... 7
Table 2: Sector descriptions used for GPC profiles ........................................................................... 11
Table 3: Total community emissions summary according to sector .................................................... 15
Table 4: Data accuracy classifications ............................................................................................ 19
Table 5: Grid supplied electricity emissions factors (Source: National GHG Accounting Factors 2016) .... 22
Table 6: Grid supplied gas emissions (Source: National GHG Accounting Factors 2015, Table 2) ........... 22
Table 7: Natural gas leakage factors (Source: National GHG Accounting Factors 2015, Table 16).......... 22
Table 8: Distribution losses (Source: Electricity and Gas Australia 2015, Table 3.5) ............................ 23
Table 9: Waste emission factors (Source: National GHG Accounting Factors 2015) .............................. 23
Table 10: Waste emission factors for total waste disposed to landfill by broad waste stream category
(Source: National GHG Accounting Factors 2015) ........................................................................... 23
Table 11: Transport fuels emission coefficients (Source: National GHG Accounting Factors 2015, Table 4)
................................................................................................................................................ 24
Table 12: Emission breakdown by fuel type (Source: National GHG Accounting Factors 2015) .............. 25
www.realaction.com.au
Tweed Shire Council Greenhouse Gas Profile Report Page 4 of 28
Table 13: Global warming potentials of greenhouse gases (Source: National GHG Accounting Factors
2015, Appendix 1) ...................................................................................................................... 25
Table 14: Electricity generation fuel mixes by state (Source: Electricity and Gas Australia 2015, Table
2.6) .......................................................................................................................................... 26
Figures
Figure 1: Tweed Shire Council Municipal Boundary ............................................................................ 9
Figure 2: Emissions scopes definitions ........................................................................................... 13
Figure 3: Emissions scopes and boundaries .................................................................................... 14
Figure 4: Tweed Shire’s emissions by source .................................................................................. 15
Figure 5: Tweed Shire’s emissions by gas type and source ............................................................... 16
Figure 6: Tweed Shire’s community emissions by scope .................................................................. 17
Figure 7: Notation keys ............................................................................................................... 18

www.realaction.com.au
Tweed Shire Council Greenhouse Gas Profile Report Page 5 of 28
Abbreviations and Definitions
Term Definition
ABS Australian Bureau of Statistics
ABARES Australian Bureau of Agricultural and Resource Economics and Sciences
(previously Australian Bureau of Agricultural and Resource Economics or ABARE)
Activity Data Activity data is a quantitative measure of a level of activity that results in GHG
emissions taking place during a given period of time (e.g., volume of gas used,
kilometres driven, tonnes of solid waste sent to landfill, etc.)
AEC Australian Energy Council
AFOLU Agriculture, Forestry, and Other Land Use
C40 C40 Cities Climate Leadership Group
CCA Climate Change Authority
CCP Cities for Climate Protection
cCR Carbonn Climate Register
CH4 Methane
CSIRO Commonwealth Scientific and Industrial Research Organisation
CO2 Carbon dioxide
CO2-e Carbon dioxide equivalent. The universal unit of measurement to indicate the
global warming potential (GWP) of each GHG, expressed in terms of the GWP of
one unit of carbon dioxide. It is used to evaluate the climate impact of releasing
(or avoiding releasing) different GHGs on a common basis.
Global Covenant of
Mayors
A coalition of city leaders addressing climate change by pledging to reduce their
greenhouse gas emissions, tracking their progress and preparing for the impacts
of climate change.
DNSP Distribution Network Service Provider (Electricity Network)
Emissions Factor An emissions factor is a measure of the mass of GHG emissions relative to a unit
of activity.
ERF Emissions Reduction Fund
ENA Electricity Networks Australia
GHG Greenhouse Gas
GHG Protocol The Greenhouse Gas Protocol, developed by World Resources Institute and World
Business Council on Sustainable Development, sets the global standard for how
to measure, manage, and report GHG emissions.
GPC Global Protocol for Community-Scale Greenhouse Gas Emission Inventories
GRP Gross Regional Product
GSP Gross State Product
Gt Gigatonne
www.realaction.com.au
Tweed Shire Council Greenhouse Gas Profile Report Page 6 of 28
GWP Global Warming Potential. The Global Warming Potential was developed to allow
comparisons of the global warming impacts of different gases. Specifically, it is a
measure of how much energy the emissions of one tonne of a gas will absorb
over a given period of time, relative to the emissions of one tonne of carbon
dioxide
ICLEI International Council for Local Government Initiatives
IPCC Intergovernmental Panel on Climate Change
IPPU Industrial Processes and Product Use
kt Kilotonne
Mt Megatonne
MCF Methane Correction Factor
SBT Science-Based Targets
SEIFA Socio-Economic Indexes for Areas
WRI World Resources Institute

www.realaction.com.au
Tweed Shire Council Greenhouse Gas Profile Report Page 7 of 28
1. Executive Summary
This report provides an overview of the community greenhouse gas (GHG) profile for Tweed
Shire Council. As a signatory to the Global Covenant of Mayors for Climate & Energy (herein
referred to as the Global Covenant of Mayors), Tweed Shire Council is required to develop an
emissions profile compliant with the Global Protocol for Community-Scale Greenhouse Gas
Emission Inventories (GPC). The development of this profile is the first step in the preparation
of a full process for mitigating climate change.
In line with GPC requirements, this profile includes an emissions total, as well as exploring
emissions through a number of filters: sector, gas type, and scope.
The total emissions summary is provided below (Table 1). Council’s total annual community
emissions have been calculated as 880kt CO2-e. The largest source of emissions by sector in
Tweed is stationary energy, which mainly comprises electricity consumed by buildings and
facilities and accounts for 62% (541kt) of total emissions. Meanwhile, on-road transportation is
responsible for 31% of emissions, solid waste accounts for 6% and emissions from wastewater
1%.
Table 1: Total community emissions summary for Tweed Shire Council
Category Emissions (t CO2e) Percentage (%)
Stationary Energy 541,419 62%
Transportation 269,613 31%
Waste 54,833 6%
Wastewater 11,551 1%
Total 877,416 100%
The majority of Tweed’s community emissions are scope 2, which refers to emissions that are
released as a result of using grid electricity and gas within the municipality, but with the
emissions from energy generation occurring outside of Council’s boundary. Emissions from
energy use in residential, commercial and industrial sectors are the main sources of scope 2
emissions.
It is important to note that while this profile is compliant with the international standard (GPC),
and covers emissions from the entire community, Council only has a limited amount of control
and influence over many of the emissions sources. While Council can continue to advocate and
assist the broader community to implement energy efficiency and renewable energy projects, a
cross-sectoral approach – with residents, business and other levels of government – is required
for substantial emissions reductions throughout the municipality.
Rather than use this profile as a baseline upon which to develop targets and measure the
impact of climate change mitigation actions by Council, targeted monitoring should instead be
used to measure and report the impact of these items. As data sources and emissions
calculation methods improve into the future, these items will be able to be linked to Council’s
profile as a monitoring tool.

www.realaction.com.au
Tweed Shire Council Greenhouse Gas Profile Report Page 8 of 28
Recommended next steps from here are:
• Work with other councils, greenhouse alliances, state government and stakeholders, such as
ICLEI Oceania and Ironbark, to source improved and updated data that can feed into future
profiles and improve accuracy.
• Continue to seek broader Global Covenant of Mayors compliance by developing community-
wide emissions reduction targets. To be best-practice this should be a “science-based” target
in line with maintaining global average temperatures below a 2-degree increase.
• Continue to undertake climate mitigation and adaptation actions (through the
implementation of the Tweed Byron Climate Change Adaptation Plan and the North Coast
Integrated Regional Vulnerability Assessment) and measure and report the impact of these
actions through targeted monitoring.

www.realaction.com.au
Page 9 of 28
2. Introduction
2.1 Background
Sourcing and analysis of community GHG emissions data has been a cause of frustration for
Australian councils over a long period of time. A decade ago, hundreds of councils had access
to “top-down” community data provided by ICLEI Oceania based on ABS (Australian Bureau of
Statistics) and ABARES (Australian Bureau of Agricultural and Resource Economics and
Sciences) data. However, the development of this data ceased in 2009 with the closure of the
Cities for Climate Protection funding.
Over the last 12 months, a range of council stakeholders
have been working on collating data from these traditional
sources (ABS and ABARES) as well as directly from utilities,
CSIRO and other state data (for example on waste and
transport) to develop GPC-compliant community inventories.
This has included the development and submission of GPC-compliant community inventories for
the purpose of complying with the Global Covenant of Mayors.
The development of the Tweed GHG profile has been undertaken by a team from Ironbark
Sustainability who have extensive experience working at and with councils. What’s more,
members of the team have recently been certified through the World Bank’s City Climate
Planner Certificate Program, a training and professional certificate program that aims to
increase the global talent base of climate planning professionals.
2.2 Council Community Profile
Tweed Shire Council is located in north eastern New South Wales. It shares its municipal
boundary with Byron Shire Council and Lismore City Council in the south, Kyogle Shire Council
in the west and the state border between New South Wales and Queensland in the north
(Figure 1). To the east, 37kms of coastline runs north-south along the Pacific Ocean. The
population of 2015/2016 GPC Profile year was estimated to be 96,034.
Tweed Shire Council is a biologically
diverse region of NSW. The region has
substantial development pressure from its
close proximity to the major growth area
of South East Queensland and the area
has witnessed strong economic and
population growth over the past decade.
Council has measures to reduce impact of
future urban development as well as
climate change. These impacts are likely
to affect biodiversity, water security,
coastal retreat and property
encroachment, flooding issues, and Figure 1: Tweed Shire Council Municipal
Boundary
www.realaction.com.au
Page 10 of 28
impacts to agriculture and tourism business. In response to this, Council has developed a
number of sustainability and greenhouse gas minimisation initiatives. In 2009, Council, in
conjunction with Byron Shire Council, developed a Climate Change Adaptation Plan to
investigate risks in the region and ways to mitigate negative environmental, social and
economic impacts. In addition, Tweed Shire Council is included in the state government’s North
Coast Integrated Regional Vulnerability Assessment of 2014. The assessment covers the
vulnerability of human services, landscapes and ecosystems, industries, settlements and
infrastructure, and emergency management sectors to a changing climate. Both the Regional
Vulnerability Assessment and the Climate Change Adaptation Plan point to the ongoing
pressures of growth in the area requiring a strategic approach to managing economic and
population growth while minimising greenhouse gas emissions and adapting to changing
climatic conditions.
2.3 Use of this Profile
It is very important that this profile is read and used appropriately. It should be stressed that
whilst this profile contains a snapshot of the GHGs allocated to activity within Tweed
municipality, it is not currently suitable as a monitoring tool for measuring the success of
targets or actions.
A GPC-compliant profile is required in order to comply with the requirements of the Global
Covenant of Mayors, to which Tweed Shire Council has committed. The GPC values
completeness over accuracy, which ensures that when profiles are compiled across
municipalities, emissions are not double-counted nor unaccounted for. This means that it is
sometimes preferable to use state or national level data scaled down to a municipal level, over
more detailed data that may not be complete or correctly aligned to municipal boundaries.
This profile contains a mixture of modelled and detailed data. As new data sources become
available and methods for calculating emissions become more sophisticated, the calculated
profile for Tweed will change, regardless of actual changes to emissions.
Ironbark envisions that council targets and action plans will be able to link together with their
GHG profiles in the future. Until this time, action plans and targets should still be developed
and monitored separately from this profile.

www.realaction.com.au
Page 11 of 28
3. Methodology and GPC Compliance
The GPC requires cities to measure and disclose a profile of GHG emissions and to total these
emissions using two distinct but complementary approaches. One captures emissions from both
production and consumption activities taking place within the city boundary, including some
emissions released outside the city boundary. The other categorises all emissions into “scopes,”
depending on where they physically occur. Separate accounting of emissions physically
released within the city boundary should be used for aggregation of multiple city inventories in
order to avoid double counting.
The GPC enables a municipality’s emissions to be broken down into the five sectors (where
relevant data is available), summarised in Table 2.
Table 2: Sector descriptions used for GPC profiles
Sector Description
Stationary Energy Stationary energy sources are one of the largest contributors to a
city’s GHG emissions. These emissions come from the combustion of
fuel in residential, commercial and institutional buildings and facilities,
and manufacturing industries and construction, as well as power plants
to generate grid-supplied energy. This sector also includes fugitive
emissions, which typically occur during extraction, transformation, and
transportation of primary fossil fuels.
Transportation Transportation covers all journeys by road, rail, water and air,
including inter-city and international travel. GHG emissions are
produced directly by the combustion of fuel or indirectly by the use of
grid-supplied electricity. Collecting accurate data for transportation
activities, calculating emissions and allocating these emissions to cities
can be a particularly challenging process. To accommodate variations
in data availability, existing transportation models, and profile
purposes, the GPC offers additional flexibility in calculating emissions
from transportation.
Waste (solid waste
and wastewater)
Waste disposal and treatment produces GHG emissions through
aerobic or anaerobic decomposition, or incineration. GHG emissions
from solid waste are calculated by disposal route, namely landfill,
biological treatment and incineration and open burning. If methane is
recovered from solid waste or wastewater treatment facilities as an
energy source, it is reported under Stationary Energy. Similarly,
emissions from incineration with energy recovery are reported under
Stationary Energy.
Industrial Processes
and Product Use
(IPPU)
GHG emissions are produced from a wide variety of non-energy
related industrial activities. The main emission sources are releases
from industrial processes that chemically or physically transform
materials (e.g., the blast furnace in the iron and steel industry, and
ammonia and other chemical products manufactured from fossil fuels
and used as chemical feedstock).
During these processes, many different GHGs can be produced. In
addition, certain products used by industry and end-consumers, such
as refrigerants, foams or aerosol cans, also contain GHGs which can be
released during use and disposal.
www.realaction.com.au
Page 12 of 28
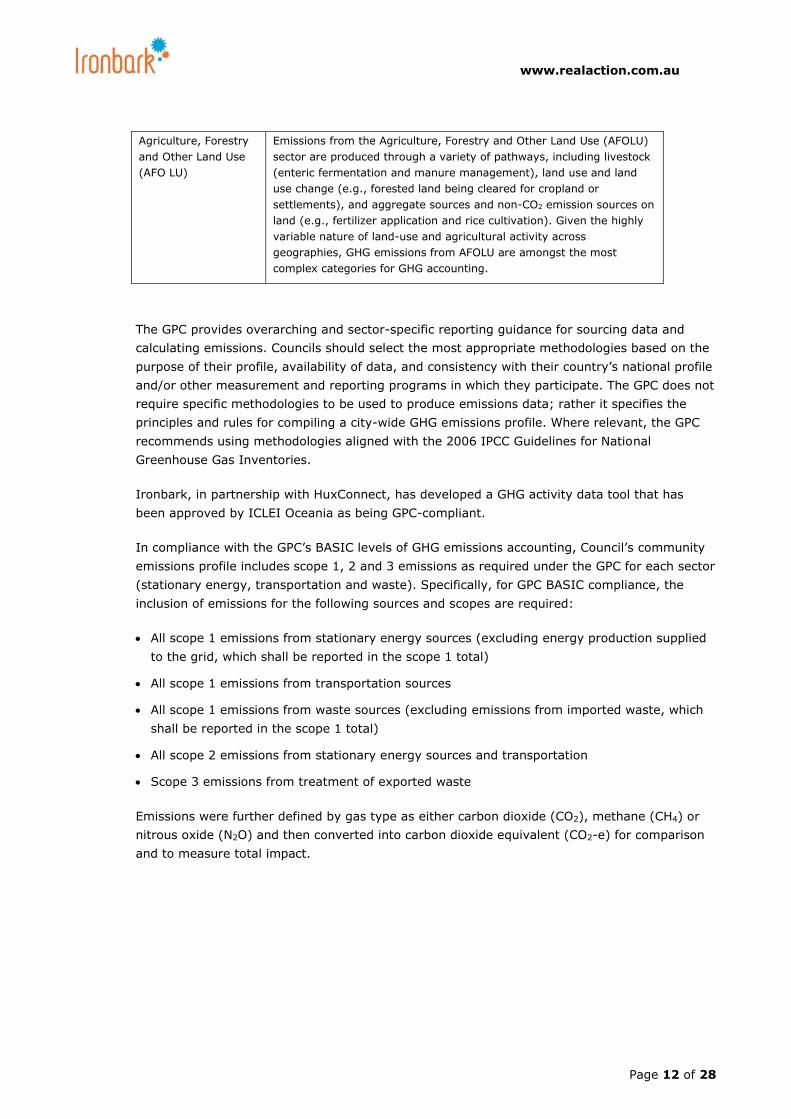
Agriculture, Forestry
and Other Land Use
(AFO LU)
Emissions from the Agriculture, Forestry and Other Land Use (AFOLU)
sector are produced through a variety of pathways, including livestock
(enteric fermentation and manure management), land use and land
use change (e.g., forested land being cleared for cropland or
settlements), and aggregate sources and non-CO2 emission sources on
land (e.g., fertilizer application and rice cultivation). Given the highly
variable nature of land-use and agricultural activity across
geographies, GHG emissions from AFOLU are amongst the most
complex categories for GHG accounting.
The GPC provides overarching and sector-specific reporting guidance for sourcing data and
calculating emissions. Councils should select the most appropriate methodologies based on the
purpose of their profile, availability of data, and consistency with their country’s national profile
and/or other measurement and reporting programs in which they participate. The GPC does not
require specific methodologies to be used to produce emissions data; rather it specifies the
principles and rules for compiling a city-wide GHG emissions profile. Where relevant, the GPC
recommends using methodologies aligned with the 2006 IPCC Guidelines for National
Greenhouse Gas Inventories.
Ironbark, in partnership with HuxConnect, has developed a GHG activity data tool that has
been approved by ICLEI Oceania as being GPC-compliant.
In compliance with the GPC’s BASIC levels of GHG emissions accounting, Council’s community
emissions profile includes scope 1, 2 and 3 emissions as required under the GPC for each sector
(stationary energy, transportation and waste). Specifically, for GPC BASIC compliance, the
inclusion of emissions for the following sources and scopes are required:
• All scope 1 emissions from stationary energy sources (excluding energy production supplied
to the grid, which shall be reported in the scope 1 total)
• All scope 1 emissions from transportation sources
• All scope 1 emissions from waste sources (excluding emissions from imported waste, which
shall be reported in the scope 1 total)
• All scope 2 emissions from stationary energy sources and transportation
• Scope 3 emissions from treatment of exported waste
Emissions were further defined by gas type as either carbon dioxide (CO2), methane (CH4) or
nitrous oxide (N2O) and then converted into carbon dioxide equivalent (CO2-e) for comparison
and to measure total impact.

www.realaction.com.au
Page 13 of 28
3.1 Disclaimer
This profile has been developed in accordance with the GHG Protocol Global Protocol for
Community-Scale Greenhouse Gas Emission Inventories (GPC) by experts certified under the
City Climate Planner Certificate Program.
The GPC is designed to promote best practice
GHG accounting and reporting that was
developed through an inclusive multi-
stakeholder process. This involved input from
experts from nongovernmental organisations,
governments, and others convened by WRI, C40
and ICLEI.
Data has been sourced from a variety of third parties (such as electricity providers and the
CSIRO). While every effort has been made to use data from reputable sources and a thorough
quality assurance process undertaken, neither Council nor Ironbark Sustainability are
responsible for data inaccuracies by third parties.
3.2 IPCC Greenhouse Gas System Boundary
To comply with the GPC, and indeed for any best-practice GHG profile development, a council
(or organisation or sub-national body) must first define a profile boundary. This identifies the
geographic area, time span, gases, and emission sources, covered by a GHG profile. Any
geographic boundary may be used for the GHG profile.
For this profile, the boundary aligns with the administrative boundary of Tweed Shire and
accounts for the GHG emissions in the reporting year 2015-2016. It covers the seven gases
covered by the Kyoto Protocol.
Activities taking place within Tweed can
generate GHG emissions that occur
inside the city boundary as well as
outside the city boundary. To distinguish
between them, the GPC groups
emissions into three categories based on
where they occur: scope 1, scope 2 or
scope 3 emissions. Definitions are
provided in Figure 2, based on an
adapted application of the scopes
framework used in other international
GHG protocol and standards.
Councils, by virtue of their size and connectivity, inevitably give rise to GHG emissions beyond
their boundaries. Measuring these emissions allows cities to take a more holistic approach to
tackling climate change by assessing the GHG impact of their supply chains, and identifying
areas of shared responsibility for upstream and downstream GHG emissions.
Figure 2: Emissions scopes definitions
www.realaction.com.au
Page 14 of 28
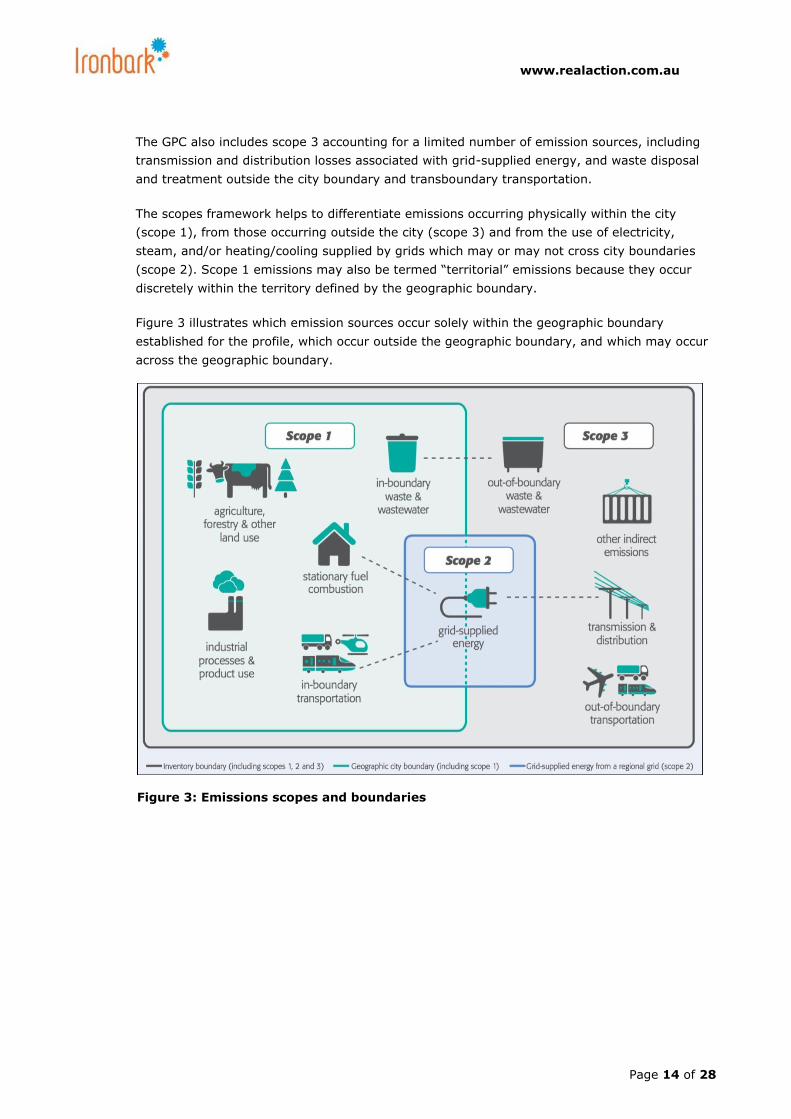
The GPC also includes scope 3 accounting for a limited number of emission sources, including
transmission and distribution losses associated with grid-supplied energy, and waste disposal
and treatment outside the city boundary and transboundary transportation.
The scopes framework helps to differentiate emissions occurring physically within the city
(scope 1), from those occurring outside the city (scope 3) and from the use of electricity,
steam, and/or heating/cooling supplied by grids which may or may not cross city boundaries
(scope 2). Scope 1 emissions may also be termed “territorial” emissions because they occur
discretely within the territory defined by the geographic boundary.
Figure 3 illustrates which emission sources occur solely within the geographic boundary
established for the profile, which occur outside the geographic boundary, and which may occur
across the geographic boundary.
Figure 3: Emissions scopes and boundaries

www.realaction.com.au
Page 15 of 28
4. Total Emissions Profile
4.1 Emissions Breakdown
Council’s total annual community emissions have been calculated as 880kt CO2-e.
Table 3: Total community emissions summary according to sector
Category Emissions (t CO2e) Percentage (%)
Stationary Energy 541,419 62%
Transportation 269,613 31%
Waste 54,833 6%
Wastewater 11,551 1%
Total 877,416 100%
As seen in Table 3 and Figure 4, the largest source of total GHG emissions is stationary energy,
which includes residential buildings; commercial and institutional facilities; and manufacturing
and construction industries.
On-road transportation produced the next highest emissions per category, 31% total emissions
or 270kt CO2-e. No emissions have been included under transport sector for rail, aviation,
water transport or other off-road transportation sources as this data was not readily available.
Where transport sources are responsible for emissions through use of electricity, such as rail,
these emissions have been included under stationary energy. As more granular data becomes
available the reporting of transport emissions will be improved upon.
Figure 4: Tweed Shire’s emissions by source

www.realaction.com.au
Page 16 of 28
Waste sources produced 7% of total emissions at 69kt CO2-e. The sources of this waste were
from the biological treatment of wastewater (1%) including sewerage, and also from the
disposal of solid waste (6%).
Figure 5 compares the emissions by source type and also shows the amounts of each GHG that
is produced either directly or indirectly through activities within the municipality. Gases are
measured in carbon dioxide equivalent to ensure they are comparable. Both stationary energy
and transportation are largely responsible for releasing carbon dioxide with trace amounts of
methane and nitrous oxide, whilst emissions from waste are mostly released as methane (CH4).
Figure 5: Tweed Shire’s emissions by gas type and source
www.realaction.com.au
Page 17 of 28
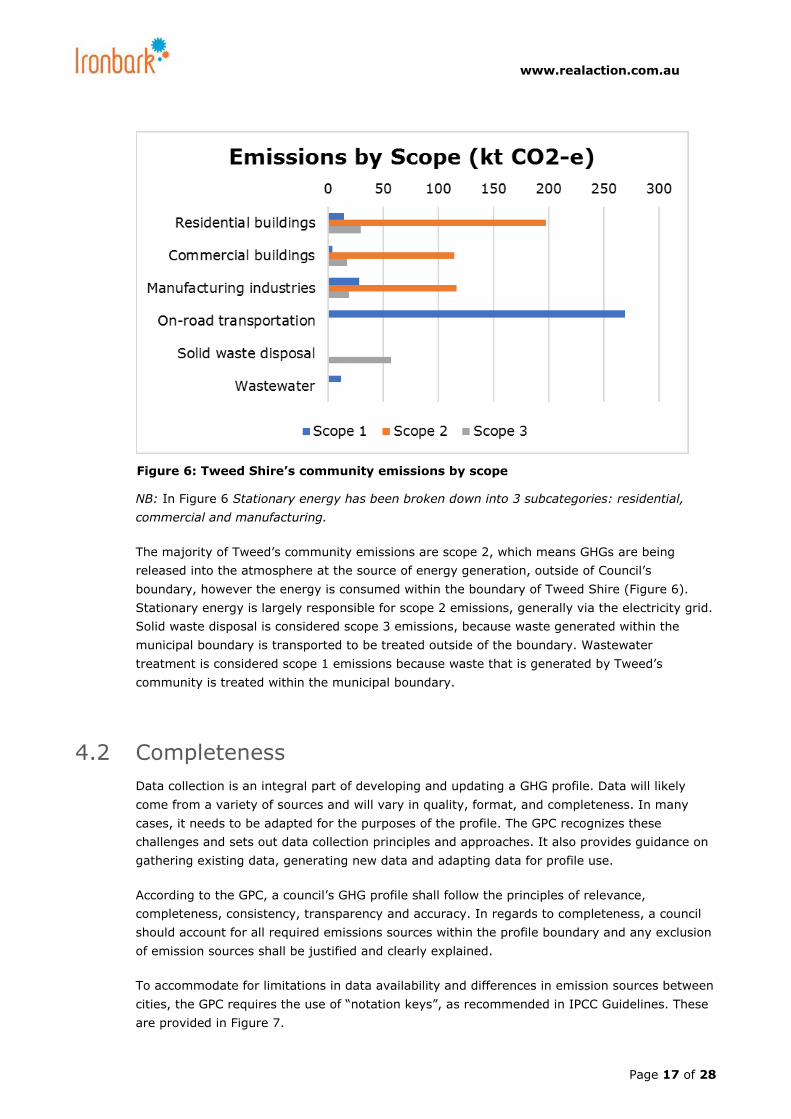
NB: In Figure 6 Stationary energy has been broken down into 3 subcategories: residential,
commercial and manufacturing.
The majority of Tweed’s community emissions are scope 2, which means GHGs are being
released into the atmosphere at the source of energy generation, outside of Council’s
boundary, however the energy is consumed within the boundary of Tweed Shire (Figure 6).
Stationary energy is largely responsible for scope 2 emissions, generally via the electricity grid.
Solid waste disposal is considered scope 3 emissions, because waste generated within the
municipal boundary is transported to be treated outside of the boundary. Wastewater
treatment is considered scope 1 emissions because waste that is generated by Tweed’s
community is treated within the municipal boundary.
4.2 Completeness
Data collection is an integral part of developing and updating a GHG profile. Data will likely
come from a variety of sources and will vary in quality, format, and completeness. In many
cases, it needs to be adapted for the purposes of the profile. The GPC recognizes these
challenges and sets out data collection principles and approaches. It also provides guidance on
gathering existing data, generating new data and adapting data for profile use.
According to the GPC, a council’s GHG profile shall follow the principles of relevance,
completeness, consistency, transparency and accuracy. In regards to completeness, a council
should account for all required emissions sources within the profile boundary and any exclusion
of emission sources shall be justified and clearly explained.
To accommodate for limitations in data availability and differences in emission sources between
cities, the GPC requires the use of “notation keys”, as recommended in IPCC Guidelines. These
are provided in Figure 7.
Figure 6: Tweed Shire’s community emissions by scope

www.realaction.com.au
Page 18 of 28
Where notation keys are used for this profile, an accompanying explanation is provided to
justify exclusions or partial accounting of GHG emission source categories.
The GPC gives councils the option of selecting between two reporting levels: BASIC or BASIC+.
The BASIC level covers emission sources that occur in almost all councils (stationary energy,
in-boundary transportation, and in-boundary generated waste) and the calculation
methodologies and data are more readily available. The BASIC+ level has a more
comprehensive coverage of emissions sources (BASIC sources plus IPPU, AFOLU,
transboundary transportation, and energy transmission and distribution losses) and reflects
more challenging data collection and calculation procedures.
This profile satisfies the requirements of GPC BASIC. Localised granular data has been sought
where possible, however time spent seeking granular data and/or BASIC+ level data has been
capped.
4.3 Data Accuracy
Due to variances in the availability of some data there was the need to extrapolate and rely on
assumptions in some cases.
The quality of data has been categorised and is outlined in Table 6. Further information on the
classifications is provided below.
High - Detailed Activity Data: denotes data that was directly available from a reliable
source, such as energy billing data provided by Council.
Medium - Modelled activity data using robust assumptions: where more reliable data is
not available granular data has been modelled.
Low - Highly modelled or uncertain activity data: denotes data that was modelled from a
highly reliable source, such as the Australian Bureau of Statistics.
Overall, data accuracy for this emissions profile is considered to be medium, but compliant with
the GPC BASIC requirements. Recommendations for improving data accuracy are at Section 5.
Figure 7: Notation keys

www.realaction.com.au
Page 19 of 28
Table 4: Data accuracy classifications
Methods
Profile Key Parameters Method Used Data Reliability
Activity data Emissions factors
Basic Municipal
BM1 BM1.1 Detailed Activity Data n/a
BM2 BM2.1 Detailed Activity Data n/a
Stationary Energy
SE1 SE1.1
Modeled activity data
using robust
assumptions
More general emission
factors
SE2 SE2.1
Modeled activity data
using robust
assumptions
More general emission
factors
SE3 SE3.1 Detailed Activity Data More general emission
factors
Transport
TR1 TR1.1 Highly-modeled or
uncertain activity data
More general emission
factors
Waste
WS1 WS1.1
Modeled activity data
using robust
assumptions
Default emission factors
WS2 WS2.3 Detailed Activity Data Default emission factors
www.realaction.com.au
Page 20 of 28
5. Recommendations and Next Steps
The development of this GPC-compliant profile is the first stage of compliance with the Global
Covenant of Mayors, and should be considered part of a process towards a climate mitigation
system involving targets and actions. This profile has been developed in a way that future
improvements in data (be that around relevance, completeness, consistency, transparency and
accuracy) can be easily adapted. This starting point is about developing a platform; reaching
GPC BASIC compliance; ensuring there is no double-counting across council boundaries and
that metrics are consistent across time.
A BASIC profile will only provide Global Covenant of Mayors compliance for one year, after
which time the profile must be updated to BASIC+. This update will need to be of a higher
standard, for example by incorporating more GHGs or more sectors.
As discussed in Section 0, this profile should not be used as a baseline for developing and
monitoring targets and actions. Instead, it should provide a summary of the relative GHGs for
which Tweed Shire is responsible and sit alongside, rather than above, these other items.
In the meantime, it is recommended that Council maintain their compliance with Global
Covenant of Mayors through the development of a science-based target and implementation of
their current climate action plan. Despite our recommendation to de-couple these items from a
GHG profile for now, the savings from each action can still be closely monitored and reported
separately to this profile.
It is expected that there will be changes to this profile as more granular data becomes available
and methods for calculating and allocating emissions become more sophisticated. In the future,
Council’s community GHG profile will be considered accurate enough to link with their targets
and actions as a full climate change mitigation system.
5.1 Proposed Next Steps
From here there are a number of actions that Council may undertake to maintain compliance
with Global Covenant of Mayors and work towards a full climate mitigation system:
• Work together with other councils, greenhouse alliances, state government or organisations,
such as Ironbark, to source improved and updated data that can feed into future profiles.
• Continue to seek broader Global Covenant of Mayors compliance by developing community-
wide emissions reduction targets. To be best-practice this should a “science-based” target in
line with keeping global average temperatures below a 2-degree increase.
• Continue to undertake climate mitigation and adaptation actions (through the
implementation of the Tweed Byron Climate Change Adaptation Plan and the North Coast
Integrated Regional Vulnerability Assessment, and future iterations) and measure and report
the impact of these actions through targeted monitoring.

www.realaction.com.au
Page 21 of 28
6. Appendix 1: Data Inputs
6.1 Source Data
The following sources have been used to develop this profile.
NB: While Ironbark Sustainability has attempted to retrieve sources published at dates
commensurate to the activity data generated in the community emissions profile, due to a
number of factors around data confidence and publishing cycles, the quality of the reporting
would be diminished if reports and recommendations are based on data from poor sources.
Ironbark is always assessing the availability of data sources and aims to use more up to date
and better quality sources where possible.
Name Author Publication date
Electricity Gas Australia 2015 Electricity Gas Australia April 2015
Small-scale Technology Certificates -
Registered Clean Energy Regulator April 2015
Population Estimates by Local
Government Area 2005 to 2015 Australian Bureau of Statistics September 2016
National Postcode Concordances 2011 Australian Bureau of Statistics March 2016
National Regional Profile - Industry - LGA
2010-14 Australian Bureau of Statistics June 2012
Waste Generation and Resource Recovery
– 2010/11 Randell Environmental Consulting February 2014
Waste Account, Australia, Experimental
Estimates Australian Bureau of Statistics February 2013
National Greenhouse Inventory 2015
Australian Department of
Environment and Energy June 2016
National Greenhouse Accounting Factors
Department of Environment and
Energy July 2017
National Greenhouse Accounting Factors
Department of Environment and
Energy August 2015
National Greenhouse Inventory 2015
Department of Industry, Innovation
and Science October 2016
Australian Energy Statistics - 2016
Update Electricity Gas Australia 2015 April 2015
Electricity Gas Australia 2015
Department of Industry, Innovation
and Science October 2016
National Greenhouse Gas Inventory
Australian Department of
Environment and Energy
June 2014

www.realaction.com.au
Page 22 of 28
6.2 Greenhouse Gas Emissions Factors
Emission factors convert activity data into a mass of GHG emissions; tonnes of CO2 released
per kilometre travelled, for example, or the ratio of CH4 emissions produced to amount of waste
landfilled. According to the GPC, emission factors should be relevant to the profile boundary,
specific to the activity being measured, and sourced from credible government, industry, or
academic sources1. The following tables outline the GHG emission factors used in the
development of this profile.
Table 5: Grid supplied electricity emissions factors (Source: National GHG Accounting
Factors 2016)
Grid supplied electricity emissions factors
State Financial Year Equivalent year Scope 2 EF
(kg CO2-e/kWh)
Scope 3 EF (kg
CO2-e/kWh)
NSW Latest Estimate 2015.5 0.83 0.12
Table 6: Grid supplied gas emissions (Source: National GHG Accounting Factors 2015,
Table 2)
Emission factors for the consumption of natural gas
Fuel
combusted
Energy content
factor
Emission factor
(kg CO2-e/GJ)
(relevant oxidation factors incorporated) (GJ/m3 unless
otherwise
indicated) CO2 CH4 N2O Total
Natural gas
distributed in a
pipeline
39.3 × 10⁻³ 51.4 0.1 0.03 51.53
Table 7: Natural gas leakage factors (Source: National GHG Accounting Factors 2015,
Table 16)
Natural gas leakage factors
State
Unaccounted for gas
(%UAG)
Natural gas composition factor (tonnes CO2-e/TJ)
UAG CO2 CH4
NSW 2.2 0.8 390
1 If no local, regional, or country-specific sources are available, councils can use IPCC default factors or data from the Emission Factor Database (EFDB) or other standard values from international bodies that reflect national circumstances.
www.realaction.com.au
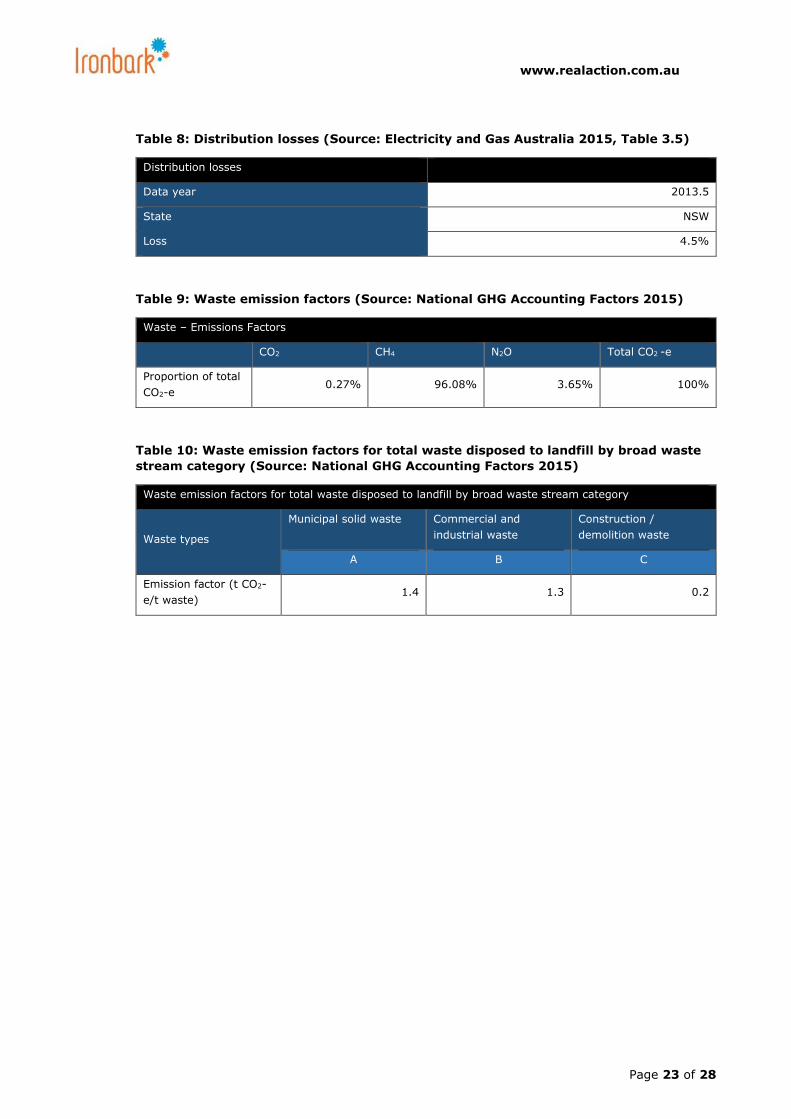
Page 23 of 28
Table 8: Distribution losses (Source: Electricity and Gas Australia 2015, Table 3.5)
Distribution losses
Data year 2013.5
State NSW
Loss 4.5%
Table 9: Waste emission factors (Source: National GHG Accounting Factors 2015)
Waste – Emissions Factors
CO2 CH4 N2O Total CO2 -e
Proportion of total
CO2-e 0.27% 96.08% 3.65% 100%
Table 10: Waste emission factors for total waste disposed to landfill by broad waste
stream category (Source: National GHG Accounting Factors 2015)
Waste emission factors for total waste disposed to landfill by broad waste stream category
Waste types
Municipal solid waste Commercial and
industrial waste
Construction /
demolition waste
A B C
Emission factor (t CO2-
e/t waste) 1.4 1.3 0.2

www.realaction.com.au
Page 24 of 28
Table 11: Transport fuels emission coefficients (Source: National GHG Accounting
Factors 2015, Table 4)
Fuel combustion emission factors - fuels used for transport energy purposes
Fuel combusted
Energy content factor
(GJ/kL unless
otherwise indicated)
Emission factor (kg CO2-e/GJ)
(relevant oxidation factors incorporated)
CO2 CH4 N2O
Pre-2004 vehicles
Gasoline (other than for use as
fuel in an aircraft) 34.2 67.4 0.5 1.8
Diesel oil 38.6 69.9 0.1 0.5
Liquefied petroleum gas 26.2 60.2 0.6 0.7
Ethanol for use as fuel in an
internal combustion engine 23.4 0 0.7 1.9
Post-2004 vehicles
Gasoline (other than for use as
fuel in an aircraft) 34.2 67.4 0.02 0.2
Diesel oil 38.6 69.9 0.01 0.6
Liquefied petroleum gas 26.2 60.2 0.4 0.3
Ethanol for use as fuel in an
internal combustion engine 23.4 0 0.2 0.2

www.realaction.com.au
Page 25 of 28
Table 12: Emission breakdown by fuel type (Source: National GHG Accounting Factors
2015)
Emissions breakdown by fuel type
Data year 2013.5
Fuel type CO2 emissions factors (kg CO2-e/GJ) Proportion of emissions
CO2 CH4 N2O Total CO2 CH4 N2O
Hydro 0.00 0.00 0.00 0.00 0.0000 0.0000 0.0000
Biofuels 0 0.07 1.1 1.17 0.0000 0.0598 0.9402
Black coal 90 0.03 0.2 90.23 0.9975 0.0003 0.0022
Brown coal 93.50 0.02 0.40 93.92 0.9955 0.0002 0.0043
Coal seam methane 51.4 0.2 0.03 51.63 0.9955 0.0039 0.0006
Natural gas 51.40 0.10 0.03 51.53 0.9975 0.0019 0.0006
Oil products 69.8 0 0.2 70.00 0.9971 0.0000 0.0029
Solar 0 0 0 0.00 0.0000 0.0000 0.0000
Wind 0.00 0.00 0.00 0.00 0.0000 0.0000 0.0000
Total (kg CO2-e/GJ) 81.08 0.02 0.35 81.46 0.9954 0.0003 0.0043
Total (kg CO2-e/MWh) 22.52 0.01 0.10 22.63 0.9954 0.0003 0.0043
99.536% 0.029% 0.434% 1.00
Table 13: Global warming potentials of greenhouse gases (Source: National GHG
Accounting Factors 2015, Appendix 1)
Global Warming Potentials
Gas Chemical formula Global Warming Potential
Carbon dioxide CO2 1
Methane CH4 25
Nitrous oxide N2O 298

www.realaction.com.au
Page 26 of 28
Table 14: Electricity generation fuel mixes by state (Source: Electricity and Gas
Australia 2015, Table 2.6)
Electricity generation fuel mixes
Data year 2013.5
State NSW
Generation source Value (GWh) Proportion
Hydro 4,213.1 6.3%
Biofuels 882.3 1.3%
Black coal 54,626.3 81.1%
Brown coal 0 0.0%
Coal seam methane 0 0.0%
Natural gas 5,528.3 8.2%
Oil products 170.7 0.3%
Solar 1,067.4 1.6%
Wind 899.2 1.3%
Total (kg CO2-e/GJ) 67,387.3 100.0%
Fossil Fuels 60,325.3 90%
Nuclear 0 0%
Renewables 7,062.0 10%
www.realaction.com.au
Page 27 of 28
7. Appendix 2: Policy Context
International/Federal
Globally, a number of countries, states and cities are making significant changes to the way
they live and work to reduce their contribution to human induced climate change. In some
countries, such as Australia, it has been cities and communities that are leading the way with
policies and programs to seize the opportunity of sustainability.
Australia has seen significant policy uncertainty through the introduction and repeal of policies
such as the price on carbon and the protracted review of the Renewable Energy Target.
Nationally, uncertainty regarding the Renewable Energy Target and carbon pricing continues to
stifle investment in large-scale renewable energy to the detriment of consumer prices.
The second major Federal policy influencing Council decision-making is the Emission Reduction
Fund (ERF). The methodologies and abatement pricing structures announced in the first round
of the Fund provide limited opportunities for councils to participate, however the second round
may provide some limited opportunity. The Australian Renewable Energy Agency and Clean
Energy Finance Corporation are still attempting to fund innovation and tailored project finance
to support the development of the industry irrespective of limited political support.
Australia recently became a signatory to the Paris Climate Agreement which pledges to reduce
carbon emissions and limit global warming to “well below 2°C above pre-industrial levels”.
State
The NSW Government has released the NSW Climate Change Policy Framework, which commits
NSW to the aspirational objectives of achieving net-zero emissions by 2050 and helping NSW to
become more resilient to a changing climate.
Climate Change Fund
The Climate Change Fund was established in 2007 to address the impacts of climate change,
encourage energy and water saving activities and increase public awareness and acceptance of
climate change.
On 3 November 2016, the NSW Government released a Draft Climate Change Fund Strategic
Plan and A Draft Plan to Save NSW Energy and Money. The government ran public consultation
from 3 November to 16 December 2016. The Draft Strategic Plan sets out priority investment
areas and potential actions for up to $500 million of new funding between 2017–18 and 2021–
22.
Energy Efficiency Action Plan
The Energy Efficiency Action Plan (EEAP), launched in response to Goal 5 of ‘NSW 2021’,
consists of 30 actions to strengthen the energy efficiency market and help NSW households,
business and government to use energy more efficiently.
www.realaction.com.au
Page 28 of 28
With the overall goal of tackling the costs of living in NSW, the EEAP aims to reach the following
targets:
• achieve 16,000 GWh in energy savings per year by 2020
• support 220,000 low income households to reduce energy use by up to 20% by 2014
• assist 50% of NSW commercial floor space achieve a four-star NABERS energy and water
rating by 2020, through the delivery of high-standard building retrofit programs
Community Renewable Energy
Through the Regional Clean Energy Program (RCEP), the NSW Government is helping
communities to produce their own electricity locally, using renewable energy resources.
The RCEP is a key component of the NSW Renewable Energy Action Plan (REAP) to increase
generation in the state, and work closely with communities and industry to bring new jobs,
investment and technological advances to local economies.
Local
At the local level, a number of councils across Australia have shown strong leadership in
climate action and derived great benefits by reducing their operational costs, carbon exposure
and improving productivity. In addition, this has provided a great basis for community
engagement and leadership.

![Roadside Vegetation Management Guidelines for Tweed Shire ... Attach 2 [EO-CM] Tweed...2012 - Roadside Vegetation Management Guidelines for Tweed Shire Council Page 2 Best Practice](https://img.dokumen.tips/doc/110x75/5e789dd78c98a076fb1d412a/roadside-vegetation-management-guidelines-for-tweed-shire-attach-2-eo-cm-tweed.jpg)