Embed Size (px)
Citation preview

Tutorial for Windows and Macintosh
Next Generation Sequence Alignment
© 2011 Gene Codes Corporation
Gene Codes Corporation 775 Technology Drive, Ann Arbor, MI 48108 USA
1.800.497.4939 (USA) +1.734.769.7249 (elsewhere) +1.734.769.7074 (fax)
www.genecodes.com [email protected]

Gene Codes Corporation ©2011 Next Generation Sequence Assembly p. 2 of 15
Next Generation Sequence Alignment
About File Formats ....................................................................................................................... 3
Getting Started............................................................................................................................. 4
Aligning Your Data with Maq ........................................................................................................ 4
Viewing the Results in Maqview..................................................................................................... 5
Reviewing the Contig in Sequencher .............................................................................................. 6
Hunting for SNPs with Maq ........................................................................................................... 7
Checking and Changing the Location of the Home Directory ........................................................... 8
Aligning your Data with GSNAP..................................................................................................... 9
Viewing the Results in Tablet ....................................................................................................... 10
Hunting for SNPs with GSNAP ..................................................................................................... 12
Hunting for Methylated Regions with GSNAP ............................................................................... 14
Conclusion.................................................................................................................................. 15

Gene Codes Corporation ©2011 Next Generation Sequence Assembly p. 3 of 15
Next Generation Sequence Assembly
Next Generation Sequencing requires new algorithms to assemble the large quantity of data produced. Reads are generally shorter than those produced using capillary electrophoresis and many more reads are produced per sequencing run. You can choose to use Maq or GSNAP to align your sequences. The Maqview and Tablet viewers will enable you to browse the reads in the contig created from these tools. You can now add the alignment programs Maq and GSNAP to Sequencher yourself and use those algorithms to align your Next Generation sequences to a reference sequence. Please see Using External Tools with Sequencher for detailed help in setting up your machine to use Maq and GSNAP as well as the associated viewers, Tablet and Maqview. In this tutorial, you will be provided with Next Gen reads in FastQ and FastA formats. If you want to use your own data, you will need to provide the reads in FastQ format (which contain quality values) or FastA files (which do not). There are two main types of FastQ format, Sanger and Illumina. You will need to know which type your FastQ files are.
ABOUT FILE FORMATS If you are working or obtaining your files from a 454 machine, then you may have been provided with SFF files. You can use the proprietary software provided by 454 or you can extract the necessary information into FastQ files using 3rd party scripts. There are some well-documented scripts available for free on the Internet. An example is sff_extract which is a Python script that needs to be run on the command line. You can obtain sff_extract from http://bioinf.comav.upv.es/sff_extract/. The version used in this example is 0.2.8 (March 2010). To use this script, you need the Python language installed on your computer. • Launch a Terminal window and type an sff_extract command similar to the one shown in the screenshot below,
replacing mycoplasma.sff in the example below with the name of your own file.
A new file containing your reads in Sanger FastQ format is created. If you were provided with FastA and Qual files, you could either use the FastA files alone or recombine the two files into a single FastQ file using the perl script fastaQual2fastq.pl. You can obtain this script from http://molecularevolution.org/molevolfiles/exercises/QC_of_NGS/fastaQual2fastq.pl_.txt. If you are working with or obtaining your files from an Illumina machine, then you may have been provided with FastQ format files. These differ from Sanger standard FastQ files in ASCII-64 format. If you are using this format, you do not need to reformat the files, you only need to tell Sequencher which format you are using with GSNAP. If you have been provided with .prb.txt and .seq.txt files, they can be combined using a script such as fq_all2std.pl which can be obtained from http://maq.sourceforge.net/fq_all2std.pl. To run this, you need Perl installed on your system. • Launch a Terminal window. • Type a command similar to fq_all2std.pl seqprb2std <in.seq.txt> <in.prb.txt> on the command line.

Gene Codes Corporation ©2011 Next Generation Sequence Assembly p. 4 of 15
You will need to replace in.seq.txt and in.prb.txt in the command above with the names of your own files. These are not the only tools for converting file formats. Besides these scripts, there are also some websites that can perform the conversion, although they may limit the size of the file you can submit. If you are working with FastA files only, then you need to take note of the following - GSNAP requires a special interleaved format for paired-end data if it is in FastA format. Normally paired-end data is provided in two separate files where the order of reads is the same. For example, in the first file the first read would be ‘first_read_101010/1’ and in the second file the first read would be ‘first_read_101010/2’. For GSNAP FastA, if the data is in FastQ format, the following format does not apply. The name of the second read which was >gi|116222307|gb|CP000473.1|_4454247_4454405_0/2 has been removed. >gi|116222307|gb|CP000473.1|_4454247_4454405_0/1 GTGGTGAAGACGCTTGACATGACCATCCCGCGCATC CGCGCGAAGATTGCCTTCCTTGAGCTTCTGGTCGGC
GETTING STARTED In this tutorial, you will use the Next Gen algorithms to align your Next Gen reads. You will first need to open a project. The project provided contains a reference sequence for use with the sample Next Gen data. • Launch Sequencher. • Go to the File menu and select Open Project… • Navigate to the Sample Data folder inside the Sequencher application folder. • Select the Next Generation Sequencing project and select Open. The project contains two sequences, one called Mycoplasma_5’ and one called methylation_reference. The Mycoplasma_5’ sequence represents the 5-prime end of the mycoplasma genitalium genome. It is already marked up with features taken from the feature table of the full-length genome. If you open the sequence in the Sequence Editor Overview, you can see the features in the Feature Map area of the Overview. Place the cursor over a feature in that Feature Map area to see its name and location in a tooltip as can be seen in the picture below.
ALIGNING YOUR DATA WITH MAQ Sequencher allows you to use external algorithms to align data sets. In this section of the tutorial, you will use Maq to align Next Generation reads that you can view in an external viewer. You will also be able to view the consensus sequence aligned to the reference sequence. The first step in aligning Next Gen sequences is to select your reference sequence.

Gene Codes Corporation ©2011 Next Generation Sequence Assembly p. 5 of 15
• Select the sequence called Mycoplasma_5’ in the Project Window. • From the Assemble menu, select the command Align Data Files to Ref Using > Maq… The Align Using Maq dialog appears. You use this dialog to choose both the data files you are going to work with as well as the types of analysis you want to perform, straightforward alignment or alignment with SNP analysis. Finally, you can also use the dialog to choose whether you want to see the results in a viewer now or review the alignment later. When you are working with single-end data, your data will be contained in one file. In this tutorial, you are working with paired-end data so you will need to choose two files. • Click on the Select File 1 button. • Navigate to the Sample Data folder inside the Sequencher application folder. Within the Sample Data
folder you will find a folder called NGS Data. Select file read1.fq and then click on the Open button. • Click on the Select File 2 button. • Navigate to the same folder as before, select read2.fq, and click on the Open button. In this part of the tutorial, you are only dealing with a straightforward alignment so you will not be using any Add i t i ona l Ana lys i s . You now need to choose whether you want to use a viewer or not. If you choose a viewer and click the A l i gn button, the alignment will proceed and your chosen viewer will open showing the contig. At the same time, a new contig will appear in the Project Window. Note that if you do not choose a viewer before submitting the reads for alignment, you will be able to invoke it later. This is not the case in the Demo Version of Sequencher or in Demo Mode. In those cases, you will not be able invoke a viewer later and will get a message to that effect. • Click on the None radio button. • Now click on the Align button. The alignment process begins. You will see a window telling you that the process may take a few moments. The length of time depends on the amount of RAM, the speed of your processors, and of course, the size of the reference sequence and number of reads in your data files. You will know the process is complete when the window disappears and a new contig appears on the Project Window. If you wish, you may save the project at this point. It is always good practice to save your work as often as possible.
VIEWING THE RESULTS IN MAQVIEW Sequencher will automatically place the results of the alignment in a SAM format file in the Gene Codes Home directory. There will also be some log files. Assume that you wish to review the results of the alignment process. As you have used Maq to produce your alignment, you have two options for viewing your results. These are Maqview and Tablet. The first part of the process is to open the SAM file in Maqview, an external program. • With the contig selected, choose Show NGS Data Using > Maqview from the Contig menu.

Gene Codes Corporation ©2011 Next Generation Sequence Assembly p. 6 of 15
The viewer opens at the left-hand end of the contig. The top two lines of the screen show the reference sequence and the consensus. Bases that are highlighted in red and are lower case are candidate SNPs. Other bases that are in lower case only are low quality. You can browse the contig by using keyboard combinations. Try the following: • Use the + key to zoom in. • Use the – key to zoom out. • Use Shift + > (Shift right arrow) to move 100 bases to the right. • Use Shift + < (Shift left arrow) to move 100 bases to the left. • Use the ? key to display the help screen. • Use the Esc/esc key to return to the contig view. As well as being able to scan through the bases, Maqview has two other views that can be displayed using the function keys F2 and F3. F1 will return you to the initial display. • To quit the viewer, press the Esc key.
REVIEWING THE CONTIG IN SEQUENCHER As well as being able to review the contig in an external viewer, you can also view the consensus sequence that has been aligned against the reference sequence in the newly created contig in Sequencher. • Double-click to open contig Maq Aligned To Mycoplasma_5' • Click on the Bases button in the open Contig Editor window. • Go to the View menu and ensure that Display Base Confidences has been selected. You will see that the first three bases are not present in the consensus sequence Maq Consensus to Mycoplasma_5’. This is due to the lack of coverage in this region. • Go to the Contig menu and choose Consensus by Confidence. • Go to the Contig menu and choose Compare Consensus To Reference. A new window opens containing a Variance Table. The first two columns refer to the reference sequence. The third column refers to the consensus sequence. You can see from this that there are 257 differences between the Mycoplasma reference and the Maq aligned consensus sequence. • Now click on the Translation button.
Gene Codes Corporation ©2011 Next Generation Sequence Assembly p. 7 of 15
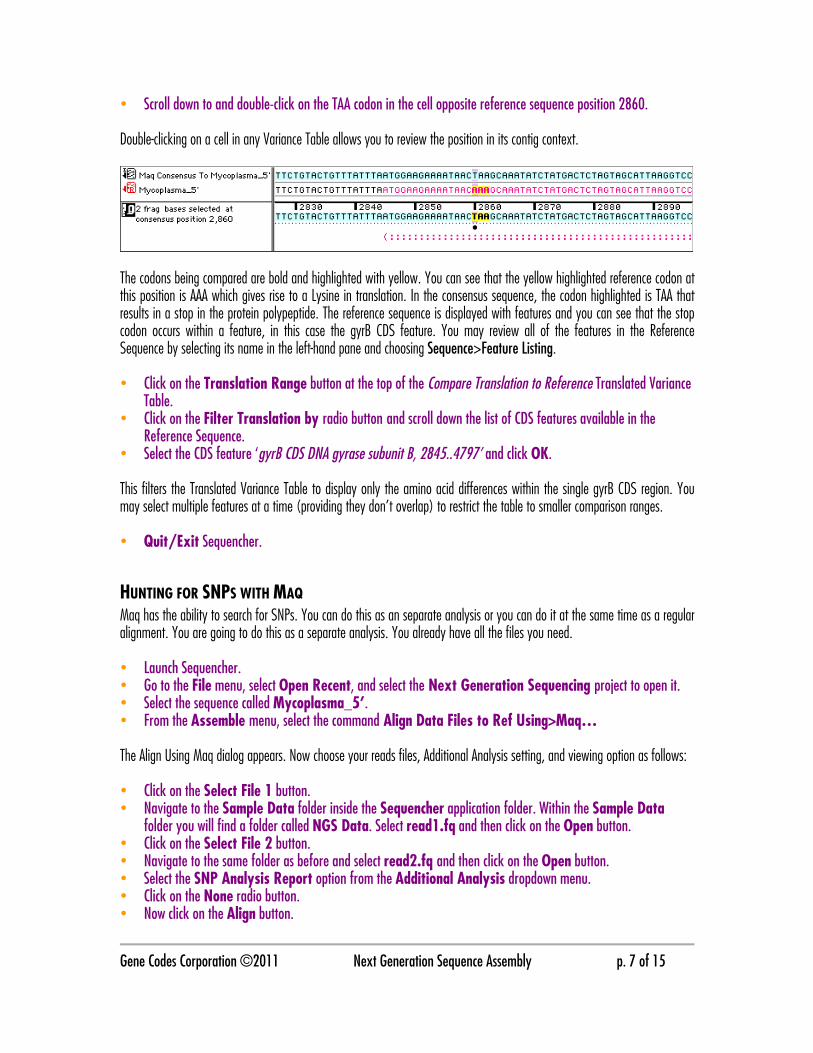
• Scroll down to and double-click on the TAA codon in the cell opposite reference sequence position 2860. Double-clicking on a cell in any Variance Table allows you to review the position in its contig context.
The codons being compared are bold and highlighted with yellow. You can see that the yellow highlighted reference codon at this position is AAA which gives rise to a Lysine in translation. In the consensus sequence, the codon highlighted is TAA that results in a stop in the protein polypeptide. The reference sequence is displayed with features and you can see that the stop codon occurs within a feature, in this case the gyrB CDS feature. You may review all of the features in the Reference Sequence by selecting its name in the left-hand pane and choosing Sequence>Feature Listing. • Click on the Translation Range button at the top of the Compare Translation to Reference Translated Variance
Table. • Click on the Filter Translation by radio button and scroll down the list of CDS features available in the
Reference Sequence. • Select the CDS feature ‘gyrB CDS DNA gyrase subunit B, 2845..4797’ and click OK. This filters the Translated Variance Table to display only the amino acid differences within the single gyrB CDS region. You may select multiple features at a time (providing they don’t overlap) to restrict the table to smaller comparison ranges. • Quit/Exit Sequencher.
HUNTING FOR SNPS WITH MAQ Maq has the ability to search for SNPs. You can do this as an separate analysis or you can do it at the same time as a regular alignment. You are going to do this as a separate analysis. You already have all the files you need. • Launch Sequencher. • Go to the File menu, select Open Recent, and select the Next Generation Sequencing project to open it. • Select the sequence called Mycoplasma_5’. • From the Assemble menu, select the command Align Data Files to Ref Using>Maq… The Align Using Maq dialog appears. Now choose your reads files, Additional Analysis setting, and viewing option as follows: • Click on the Select File 1 button. • Navigate to the Sample Data folder inside the Sequencher application folder. Within the Sample Data
folder you will find a folder called NGS Data. Select read1.fq and then click on the Open button. • Click on the Select File 2 button. • Navigate to the same folder as before and select read2.fq and then click on the Open button. • Select the SNP Analysis Report option from the Additional Analysis dropdown menu. • Click on the None radio button. • Now click on the Align button.

Gene Codes Corporation ©2011 Next Generation Sequence Assembly p. 8 of 15
The analysis begins. As in the previous section of the tutorial, you will know when the analysis is complete when a new contig appears in the Project Window. You can view the SNP report at any time by doing the following: • Go to the Sequence menu and select Analyses > Maq SNP Report.
The SNP report comes up in your default browser. If you are working with the demo version of Sequencher, you will only see a demo sample report. However, if the analysis was run previously using a full version of Sequencher, you will see a report of your data.
When reviewing the report, the first four columns are self-explanatory. The most important value is the Phred-like consensus quality. If the value in column 7 is or approaches 1.00, then this implies that the site falls in a unique region. Column 9 gives the quality of the neighboring region, thus a SNP falling in a region with low flanking quality may be less reliable than one that falls in a region with a high-flanking quality. Thus, the SNP at position 866 is less reliable than the SNPs on either side of it at positions 670 and 902.
CHECKING AND CHANGING THE LOCATION OF THE HOME DIRECTORY Sequencher saves the results of any alignment or analysis to the Gene Codes Home directory. This is located in a default folder, usually within your Documents folder. To check the location of the directory, do the following: • Go to Sequencher’s User Preferences dialog by selecting Window > User Preferences… • Select the External Data preference category.

Gene Codes Corporation ©2011 Next Generation Sequence Assembly p. 9 of 15
To change the location of the Gene Codes Home directory: • Click the Browse… button. • Use the Browse For Folder (Win) / Choose a Folder (OS X) dialog to browse to a new location. • Select a folder and then click the OK / Choose button to confirm it. The new location of the Gene Codes Home directory will be displayed in the External Data preference pane. • Quit/Exit Sequencher.
ALIGNING YOUR DATA WITH GSNAP Follow these steps to align your data with GSNAP: • Launch Sequencher. • Go to the File menu and select Open Project… • Navigate to the Sample Data folder inside the Sequencher application folder. • Select the Next Generation Sequencing project and select Open. • Click on the sequence called Mycoplasma_5’ to select it. • From the Assemble menu, select the command Align Data Files to Ref Using > GSNAP… The Align Using GSNAP dialog appears. You use this dialog to choose both the data files you are going to work with as well as the types of analysis you want to perform, straightforward alignment, SNP-tolerant alignment, or Methylation analysis. Finally you can also use the dialog to choose whether you want to see the results in a viewer now or review the alignment later. When you are working with single-end data, your data will be contained in one file. In this tutorial, you are working with paired-end data so you will need to choose two files. • Click on the Select File 1 button. • Navigate to the Sample Data folder inside the Sequencher application folder. Within the Sample Data
folder you will find a folder called NGS Data. Select read1.fq and then click on the Open button. On Windows, you’ll have to open the file type drop-down menu and select either the FastQ Files or All filter in order to see .fq files appear in the list.

Gene Codes Corporation ©2011 Next Generation Sequence Assembly p. 10 of 15
• Click on the Select File 2 button. • Navigate to the same folder as before, select read2.fq, and then click on the Open button. • Make sure that Sanger Standard is chosen from the FASTQ Encoding drop-down menu. As you are only dealing with a straightforward alignment, you will not be using any Add i t i ona l Ana lys i s options. You now need to choose whether you want to use a viewer or not. If you choose a viewer before clicking the A l i gn button, the alignment will proceed and your chosen viewer will open showing the contig. At the same time, a new contig will appear on the Sequencher Project Window. If you are using the Demo Version of Sequencher or are in Demo Mode and you chose to align with a selected viewer chosen, you will see your contig come up in a viewer but you will not be able to invoke a viewer later on for this contig – a message to that effect will be displayed. • Click on the None radio button. • Now click on the Align button. The alignment process begins. You will see a dialog telling you that the process may take a few moments. You will know the process is complete when the window disappears and a new contig appears in the Project Window. If you wish, you may save the project at this point. It is always good practice to save your work as often as possible.
VIEWING THE RESULTS IN TABLET Sequencher will automatically place the results of the alignment in a SAM format file in the Home directory. Some log and other resultant files are also placed in this directory. To see all of the resultant files that were generated as a result of an alignment, you can use the Open Ex te rna l Da ta Fo lde r command on the Window menu. You must have a Maq or GSNAP aligned contig selected or open at the time you issue the command. You can view the results of your GSNAP alignment using the Tablet viewer. In this section of the tutorial, you will view the aligned reads from a GSNAP alignment in Tablet. Tablet has a very rich set of features, some of which are explored in this section. • Select the contig whose alignment you wish to explore by clicking on it once. • From the Contig menu, choose Show NGS Data Using > Tablet. The viewer opens with the loaded aligned
reads. • Click on the contig in the list on the left-hand side of the Tablet viewer to display the aligned reads.
The reads will be displayed in the right-hand side of the window.
• Click on the Read Type button to change the view.

Gene Codes Corporation ©2011 Next Generation Sequence Assembly p. 11 of 15
The display will change from the default bases view to the view seen below.
The green reads are forward reads, the blue are reverse reads, and the red reads are unpaired. • Hover your mouse over a read.
Looking at the image, you can see the paired reads, their names, positions, and lengths. The red block in the green labeled read indicates a potential SNP. Tablet has a nice feature that can help to highlight potential SNPs even more. Locate the Zoom and Va r ian t s sliders. Notice the effects as you move these sliders right and left. As you move the Va r ian t s slider to the right, the reads view becomes darker and bases are obscure except for those bases that are SNPs.

Gene Codes Corporation ©2011 Next Generation Sequence Assembly p. 12 of 15
When you have finished working with Tablet, quit the program. You can review your alignments again by using the Cont ig menu and choosing Show NGS Data Us ing > Tab le t .
HUNTING FOR SNPS WITH GSNAP GSNAP performs SNP hunting in a different way than Maq. The analysis is a SNP-tolerant alignment and the results indicate whether the SNP is a known SNP or an unknown mismatch. You need to supply a file that contains a list of known SNPs. This file has to be in a specific format that will be described below.
The file is a text file and each SNP is placed on a separate line. Look at the image above. The lines begin with a > (angle bracket). This is followed by the reference name of the SNP. The next column contains the name of the reference sequence. It is very important that this name matches the name of the chosen reference sequence in the Project Window. Otherwise, the analysis will fail. In the case of the reference sequence we are using, that is Mcyoplasma_5’. The next columns (following the colon) indicate the position of the SNP. Note that these SNPs are single bases so the position is written from 12207 to 12207 so it is written as 12207:12207. The final column contains the major and minor alleles for the SNP. The file itself can be created in any text editor (not a word processor). Note that the position information in this file always assumes that the first base of the reference sequence in Sequencher is 1, no matter its actual numbering relative to its chromosomal or contig position. To perform the analysis, you need to select your reference sequence from the Project Window. • Select the Mycoplasma_5’ sequence in the Project Window. • Choose Assemble > Align Data Files to Ref Using … > GSNAP. • The Align Using GSNAP dialog will appear. From that dialog, click on the Select File 1 button and browse to the
first reads file you want to use. • Click on Select File 2 button if you are using paired-end data and select the second reads file you want to use. • Now choose SNP-Tolerant from the drop-down menu in the Additional Analysis group box on the dialog. • The Known SNPs File button is now enabled. Click on that button and browse to the file containing your list of
known SNPs. We have supplied one in the NGS Data folder that goes with the supplied reads files. Select file SNPlist.txt and click on the Open button.

Gene Codes Corporation ©2011 Next Generation Sequence Assembly p. 13 of 15
Also choose whether you want to see the results file in Tablet immediately after the alignment has finished. In the image above, None has been selected. Note that if you do not choose a viewer before submitting the reads for alignment, you will not be able to invoke it later if using the Demo Version of Sequencher or are running in Demo Mode. You will get a message to that effect if you try. You will still see a new contig on Project Window though. • Now click on the Align button to initiate the analysis. The analysis is complete when a new contig appears on the Project Window. • To review the results, choose the contig of interest. • Go to the Sequence menu. • Choose the Analyses > GSNAP SNP Analysis command. • The SNP report comes up in your default browser. The report you see presents the results as a series of genomic segments with reads aligned to the segment. Note that if you are working with a demo version of Sequencher, you will only see a sample report. Reading across the report you will see information which shows how many known SNPs and how many mismatches are in each segment. The image below explains the kind of result you might see in more detail. The first line is always a query read with the line below being an aligned segment from the reference sequence. Next comes the range of the alignment. In the example below, it ranges from base 1 to 35. Characters + or – in front of the region information indicates stranded-ness. Note that, if the region is from the – strand, the range information will be of the form 10..1 rather than 1..10. The word concordant refers to a paired-end read if both reads of the pair are on the same reference sequence and in the expected direction.

Gene Codes Corporation ©2011 Next Generation Sequence Assembly p. 14 of 15
In the result above there is both a mismatch, sub:1, and a minor allele, +1, leading to a total of 2 mismatches relative to the reference sequence (1+1=2). Only one segment was found (segs:1) with a mapping quality of 27. If the report shows a mismatch then this is likely to be a new SNP. If the report shows a minor allele, then this is a known SNP. • Use your browser’s Find function to search for sub:1 or +1 to find other SNPs. • When you are finished, close out of your browser and return to Sequencher.
HUNTING FOR METHYLATED REGIONS WITH GSNAP Sequencing studies of methylated parts of the genome involve using bisulfite treatment of the DNA followed by sequencing of the regions of interest. The bisulfite treatment chemically converts unmethylated Cs to Ts. GSNAP is capable of aligning the sequenced reads to the genomic (untreated) sequence. To perform the analysis, you need to supply a reference sequence and one or two (if paired -end) FastQ files containing reads from bisulfite treated DNA. In this example, you will be using a reference sequence called methylation_reference and analyzing a set of single-ends sequencing reads. • Go to the File menu and select Open Project… • Navigate to the Sample Data folder inside the Sequencher application folder, select the Next Generation
Sequencing project, and then select Open. • Click on the sequence called methylation_reference. • Choose Assemble > Align Data Files to Ref Using … > GSNAP. • The Align Using GSNAP dialog will appear. From that dialog, click on the Select File 1 button. • Navigate to the Sample Data folder inside the Sequencher application folder. • Within the Sample Data folder you will find a folder called NGS Data. Select bisulfite_read.fa and click on
the Open button. • Now choose Methylation from the drop-down menu in the Additional Analysis group box. • Choose the View Results None radio button. • Click on the Align button. Although you chose to not view the results at the time of alignment, you will still be able to invoke a viewer later to review the results. After the alignment is completed, you will see a new contig in the Project Window. In order to see the results of the analysis, do the following: • Go to the Sequence menu. • Choose Analyses > GSNAP Methylation Analysis. The Methylation report comes up in your default browser. This report will contain a great deal of information. As you browse through the contents, you will see periods below some of the Ts. These characters represent cytosines in the genomic sequence and are paired against some thymidines in the query reads. They indicate that the read contains a converted C > T, where the C was unmethylated and therefore unprotected from bisulfite treatment.

Gene Codes Corporation ©2011 Next Generation Sequence Assembly p. 15 of 15
In the segment of the report shown below, the read data follows the > character on the first line. The next column on the first line lists the number of matching genomic locations to which the read aligned. The line below it (containing the periods) is the genomic sequence followed by the range of the aligned read. In the example below, all 63 bases of the read sequence aligns to the genomic reference—1 to 63. The polarity of the genomic strand is indicated by a + or – character preceding the name of the reference (genomic) sequence.
>AATAATAATAATATTAAAAGTTAAAATTAAATTTATTAAATTAATTAAGGTTAAAGTTAAAAT 1 Frag[0001]_0-63_0
AA.AA.AATAATA..AAAAG..AAAATTAAA...ATTAAAT.AATTAAGGTTAAAG..AAAAT 1..63 -methylation_reference:63..1 start:0..end:0,sub:0
>ATTTTGGTTTTAATTTTAATTGATTTAATGGGTTTAATTTTGGTTTTTGGTATTATTGTTGTT 1 Frag[0001]_0-63_1
ATTTTGG.TTTAA..TTAATTGATTTAATGGGTTTAATTTTGG.TTTTGGTATTATTGTTGTT 1..63 +methylation_reference:1..63 start:0..end:0,sub:0
Any mismatches reported will be in lower case and the number of mismatches is indicated by the word sub. Thus, sub:2 means there are two mismatches in the reference vs query alignment. In the segment of the report shown in the image above, there are no mismatches and this is indicated by sub:0.
CONCLUSION In this tutorial, you have worked with two separate programs for aligning Next Generation sequences to a reference sequence. You have learned how to use these programs to hunt for SNPs and study methylation patterns following treatment of DNA with bisulfite. For more information on using Sequencher, this tutorial and others are a good place to start. You can also read the online manual or consult our website by visiting www.genecodes.com.