Embed Size (px)
Citation preview

Tutorial for VeritoolsVerifyer, SystemVerilog Assertions
VeritoolsVerifyer

Tutorial for SystemVerilog Assertions
To run the VeritoolsVerifyer, do the following steps:
% cd /flexlm and launch License Manager
% Run lmgrd for VeritoolsVerifyer license
% cd /(distribution directory)/examples/dma_assertions
% run_ut_batch_new
(Script is: ut –iv –sysver –source –sigfile vt.dump)

Start the VeritoolsVerifyer, by selecting the Tools menu item as shown above.
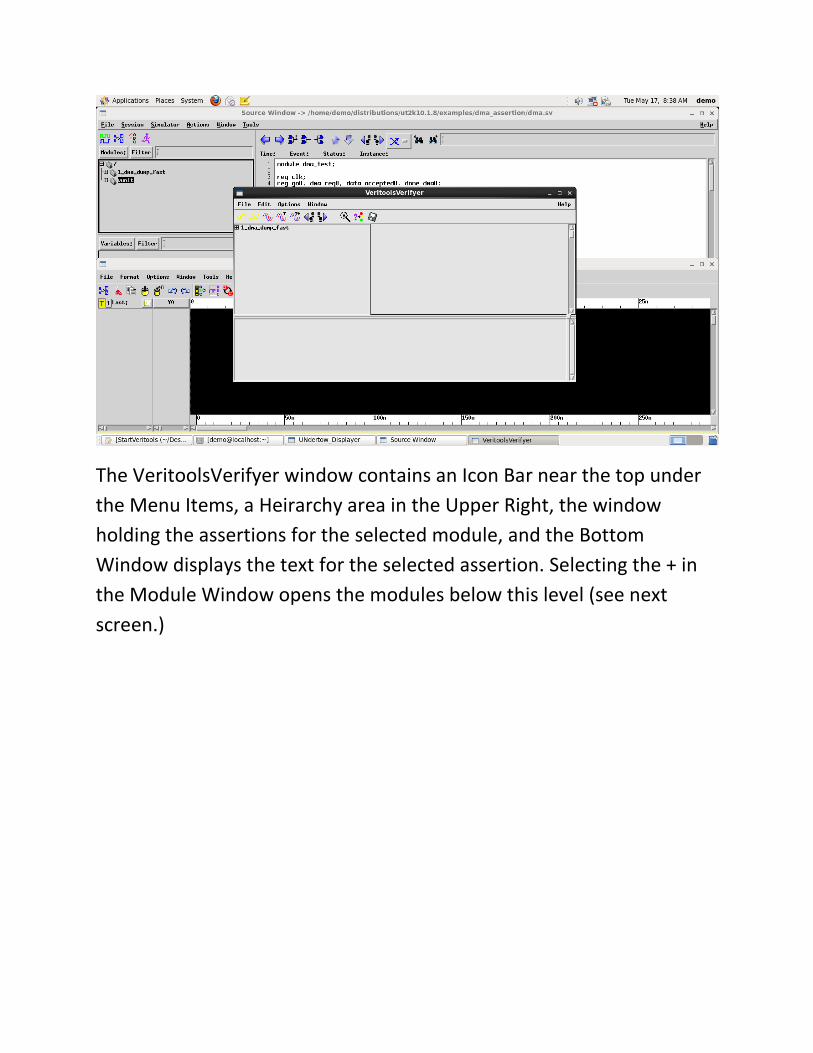
The VeritoolsVerifyer window contains an Icon Bar near the top under the Menu Items, a Heirarchy area in the Upper Right, the window holding the assertions for the selected module, and the Bottom Window displays the text for the selected assertion. Selecting the + in the Module Window opens the modules below this level (see next screen.)

By selecting the Name of the Module, the assertions in that module are displayed in the Assertion List Window.

Selecting an Assertion in the Assertion List Window, displays the Assertion Text in the bottom window. In the screen below, the assertion p1within (background is highlighted) is selected:

Next, use the Evaluate All Assertions In Module icon.
Note: All assertions at this level and all modules below this level will be evaluated.
Also, this will color code the hierarchy, and if even one assertion fails at this level or below this level, the entire hierarchy will be color coded Red.

After assertions are evaluated, the assertions will turn Yellow if Vacuously True, Green if the assertion Passes and Red if it Fails or if it is still pending past the end of simulation. The next step is to press the Display Assertion Results icon. This displays the assertion result waveform in the waveform window, as shown above. A low going pulse indicates the assertion failed, a high going pulse indicates the assertion passed. The leading or falling edge of this pulse indicates where the assertion started.
Note: The cursor is automatically placed on the leading edge of the Assertion Result Pulse, which is a low going pulse if the assertion failed, and a high going pulse if the assertion passed.

After evaluating the assertion and displaying the result, the assertion text is automatically color coded, Green for the part of the assertion that Passes evaluation, Red for the part that does not pass evaluation.
Note: the assertion is evaluated only when the T0 cursor is on the leading edge of the assertion result pulse, which is automatically done when you press the Display Assertion Result icon.

Next, click the Display Assertion Timing with Components icon. See above.
Note: the assertion timing signal indicates when the assertion is inactive, when it goes active and the latest possible time when it goes to a True or Fail condition.
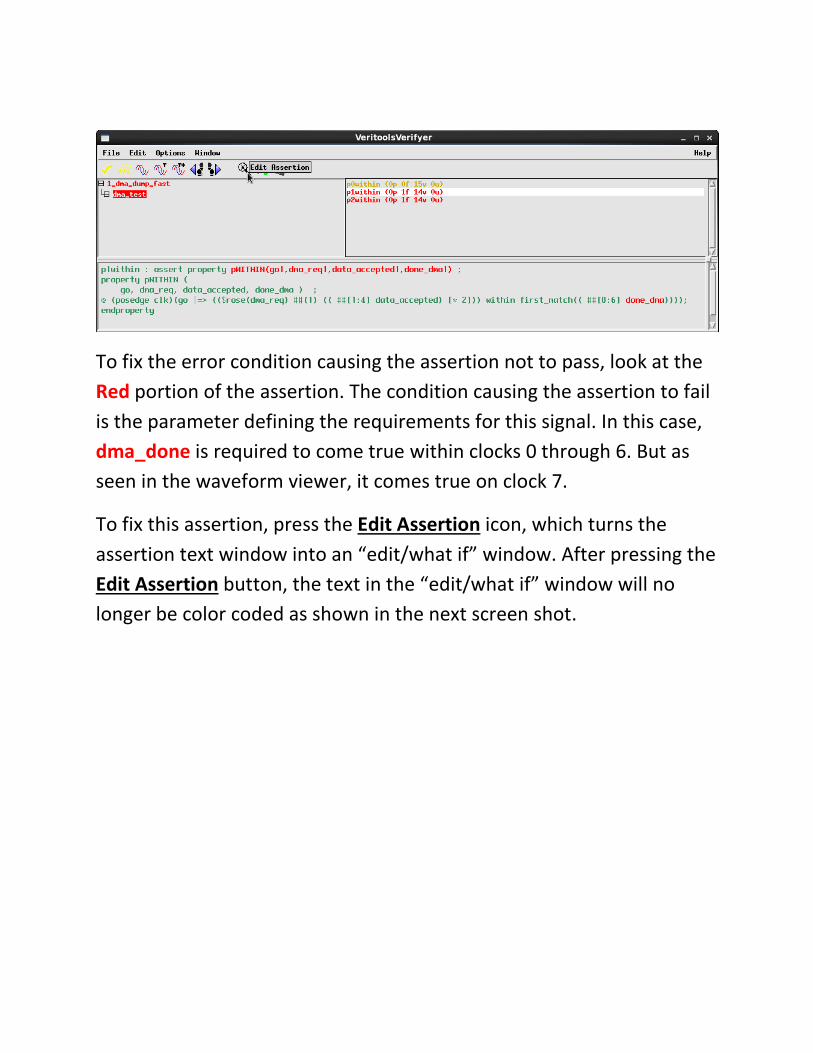
To fix the error condition causing the assertion not to pass, look at the Red portion of the assertion. The condition causing the assertion to fail is the parameter defining the requirements for this signal. In this case, dma_done is required to come true within clocks 0 through 6. But as seen in the waveform viewer, it comes true on clock 7.
To fix this assertion, press the Edit Assertion icon, which turns the assertion text window into an “edit/what if” window. After pressing the Edit Assertion button, the text in the “edit/what if” window will no longer be color coded as shown in the next screen shot.

Replacing the number 6 with a number greater than 6 will cause this assertion to Pass.
After editing this assertion, run Retest, the icon to the immediate right of the Edit Assertion icon:
This action will retest the modified assertion code.
The Retest icon is only active when in Edit mode (when the Edit Assertion icon is depressed. This allows users to modify and retest this assertion as many times as necessary.

Notice, after clicking Retest, if the assertion passes, the assertion timing signal will go inactive, active, pass, the assertion result will now show a high going pulse, and the assertion in the assertion list window will turn green. After the assertion passes, the user can then commit the modified code.

To commit, click the Commit Edited Assertion & Reparse icon as above:
Note: after pressing Commit Edited Assertion & Reparse a dialog box will ask if you wish to overwrite your source file for the assertion code.

Notice once the code is committed and reparsed, dma_done has changed from Red to Green, indicating the assertion now passes.

If there is a Red Downward Arrow in the assertion timing waveform (as shown above) it indicates this assertion has unique, independent execution threads. To display the unique, independent execution threads, select (click using left mouse button) the timing waveform (gray highlight, as shown above). Then press Options (pull down menu) -> and click Show Threads for Selected Timing Waveform.

The heirarchy and assertion windows are replaced by the above windows: the Selected assertion timing window, and the Next thread generator window.
Next, select the unique independent execution threads that you wish to display in the waveform display window. Click-and-hold with the left mouse button, and slide over the threads you wish to display. If you wish to select individual threads, select (left click) individually.

Pressing the Display Thread button will display the selected threads in the waveform window. Notice within the threads shown, are additional unique independent execution threads, as shown by the downward pointing Red arrow, in the new assertion timing signals. This allows you to denest all of the unique independent execution threads in any given assertion.

The above waveform window displays all the unique independent execution threads along with the timing signal for this assertion, the result signal for this assertion, and the signal components for this assertion.

To return to the assertion heirarchy window, click the Cancel button.

To see Coverage information, select the Options pulldown menu, then press Coverage (as shown above) to get the sub menu (next screen).

Click Collect Coverage Data For All Assertions as shown above.

This opens the coverage window, which shows the counts of each assertion: Passes, Fails, Vacuously True or Pending at the end of execution.