Embed Size (px)
Citation preview

Communications of the Association for Information Systems
Volume 25 Article 39
11-1-2009
Tutorial: Business Intelligence – Past, Present, andFutureHugh J. WatsonUniversity of Georgia, [email protected]
Follow this and additional works at: https://aisel.aisnet.org/cais
This material is brought to you by the AIS Journals at AIS Electronic Library (AISeL). It has been accepted for inclusion in Communications of theAssociation for Information Systems by an authorized administrator of AIS Electronic Library (AISeL). For more information, please [email protected].
Recommended CitationWatson, Hugh J. (2009) "Tutorial: Business Intelligence – Past, Present, and Future," Communications of the Association for InformationSystems: Vol. 25 , Article 39.DOI: 10.17705/1CAIS.02539Available at: https://aisel.aisnet.org/cais/vol25/iss1/39

Volume 25 Article 39
Tutorial: Business Intelligence – Past, Present, and Future
Hugh J. Watson
Department of MIS, University of Georgia
Business intelligence (BI) is a broad category of applications, technologies, and processes for gathering, storing, accessing, and analyzing data to help business users make better decisions. This tutorial discusses some of the early, landmark contributions to BI; describes a comprehensive, generic BI environment; and discusses four impor-tant BI trends: scalability, pervasive BI, operational BI, and the BI based organization. It also identifies BI resources that are available for faculty and students. Keywords: Business intelligence, data analysis, decision support systems
Volume 25, Article 39, pp. 487-510, November 2009

Tutorial: Business Intelligence – Past, Present, and Future
Tutorial: Business Intelligence – Past, Present, and Future
488 Volume 25 Article 39
I. INTRODUCTION
Computer-based decision support continues to evolve from its early structured reporting roots. Command line inter-faces and green bar reports are relics of the past, replaced by graphical interfaces that allow users to ―slice and dice‖ and view data in a myriad of ways. Operational personnel now have access to real-time information when performing their jobs. Decision support now extends beyond organizational boundaries as customers and suppliers are given access to company data. Decision support has changed from a ―nice to have‖ to a ―competitive necessity.‖ Even the name of the field—decision support systems (DSS)—is undergoing change as the business intelligence (BI) term becomes more widely used.
There is strong evidence of the importance of BI. Leading trade and business publications routinely describe many ways that companies are using and benefiting from BI (Davenport 2006). Each year Gartner conducts a survey and asks CIOs about their top technology initiatives. For the last three years (i.e., 2007–2009), BI has been at the top of the list (Gartner 2009). Most MIS, IS, and CIS programs offer required or elective BI courses. Some schools (e.g., Xavier University) have BI concentrations and several (e.g., St. Joseph’s College and the University of Denver) offer a master’s degree in BI.
The objective of this tutorial is to provide a broad understanding of the past, present, and future of BI. Knowing the past is important, because it provides context and helps in understanding many of today’s practices. As a result, some of the early contributions to DSS (e.g., Sprague’s framework, Alter’s taxonomy) and their relationship to the present are discussed.
After its past is discussed, BI is formally defined and a generic, comprehensive BI environment is presented. Current practices for moving data from source systems to a centralized decision support repository, storing the data in an appropriate architecture, and accessing the data using a variety of tools and applications are discussed. Three pos-sible BI ―targets‖ (i.e., objectives) and their value proposition are discussed.
There are many new, exciting developments with BI. Four specific trends—scalability, pervasive BI, operational BI, and the BI-based organization—are discussed. In illustrating the trends, examples are drawn from companies such as Harrah’s Entertainment, 1-800 CONTACTS, and Continental Airlines.
A rich set of resources is available to people who are interested in BI—professional organizations, websites, books and journals, and university support programs. A specific university program, the Teradata University Network, is discussed in detail.
II. THE FUTURE IS INFORMED BY THE PAST
In the 1960s, the first computer applications were developed for scientific purposes and transaction processing. Reports that summarized the processed transaction data provided some, but very limited, information for decision support.
It was not long, however, before maturing technology, business need, and the vision of the early pioneers led to the first decision support applications (Power 2007). Much of the early development work was conducted at MIT and Harvard. Particularly important was Michael S. Scott Morton’s (1967) doctoral dissertation research. He built, imple-mented, and tested a system to support planning for laundry equipment. Later, he published an influential Sloan Management Review article (Gorry and Scott Morton 1971) and book (1971) that helped spread decision support concepts and provided a name for these analytical applications—management decision systems.
Throughout the late 1960s and early-to-mid 1970s, a variety of decision support applications were developed (Fer-guson and Jones 1969; Little 1975). Many academicians with backgrounds in management science/operations re-search were attracted to the field because of the practical value of these new kinds of applications. Decision support systems (DSS) began to be used to describe these applications and also became the name of this emerging field. During this time, Ralph Sprague published his initial DSS frameworks (Sprague and Watson 1975) that were fol-lowed by his seminal MIS Quarterly (1980) article and book (Sprague and Carlson 1982).

Volume 25 Article 39 489
Sprague’s DSS Development Framework
Figure 1 presents Sprague’s DSS development framework. It contains three major components—the dialog between the user (either directly or through an intermediary) and the system’s other components, the database, and the model base. A key consideration in the design of the dialog (i.e., interface) is to have an appropriate trade-off bet-ween simplicity and flexibility of use. Systems that are easy to use are seldom flexible in what they can do, while highly flexible systems are more complex to operate. The database is specifically designed and created for use with the DSS. It draws its data from operational systems, other internal data, and external data. The model base contains and manages the development and use of strategic, tactical, and operational models.
Source: Adapted from Sprague and Watson 1989.
Figure 1. Sprague’s DSS Framework
Sprague’s DSS development framework continues to be interesting and important for several reasons. First, it fore-saw many current BI practices. For example, the concept of a dedicated decision support database is consistent with today’s data marts and data warehouses. Model management capabilities are commonly included in analytical workbenches. A second reason is that the dialog, data, and models (DDM) paradigm is still a good way of thinking about even the most current DSS developments. For example, placing decision support data on the cloud is a data-base architecture option. Rules engines are an example of a model base management system.
Alter’s DSS Taxonomy
At about the same time that Sprague was developing his framework, Steve Alter (1975, 1980) was providing an alternative conceptualization. Based on 56 DSS case studies, Alter concluded that there are seven kinds of DSS, as seen at the left of Figure 2. They, in turn, can be ultimately categorized as being either data or model-centric, de-pending on whether their primary purpose is to access and lightly analyze data or to perform powerful analytics.
Two things about Alter’s taxonomy are especially significant.
1. The use of DSS as an umbrella term to cover a wide variety of decision support applications. Today, the BI term is used in the same way.
2. Recognition that DSS applications can be very data- or modeling-intensive. In the early days, because many DSS academicians came from quantitative backgrounds, their focus tended to be model-centric. By way of contrast, business needs are often data-centric; that is, the simple analysis of large amounts of data (e.g., dashboard systems).

490 Volume 25 Article 39
Source: Alter 1975
Figure 2. Alter’s DSS Taxonomy
DSS Evolves and Expands
Over time, the decision support scene changed. Additional applications appeared, such as executive information systems (EIS), group decision support systems (GDSS), and geographic information systems (GIS), with their own unique characteristics and names. Data mining moved from the scholarly journals of academe into the world of practice, often under the predictive analytics rubric. Data warehouses stored massive amounts of decision support data and were key to reporting, online analytical processing (OLAP), and dashboard/scorecard applications. Rapid strides were made with data visualization. In addition to numerical data, other data entered the decision support world, such as documents and web pages. And the Internet became the delivery platform for BI/DSS.
Power’s DSS Taxonomy
Dan Power is the founder of DSS Resources (www.DSSResouces.com), a comprehensive website devoted to deci-sion support. On his website, Power provides a contemporary classification system for DSS. His DSS taxonomy includes the following five categories:
Communications-driven DSS. These are applications that support collaboration and communication. Examples include group decision support systems and audio and video conferencing.
Data-driven DSS. These applications involve the manipulation of large amounts of numerical data that is often stored in a data warehouse. Examples include reports, dashboards/scorecards, and online analytical processing.
Document-driven DSS. Useful information for decision support is often found in documents, such as Word files, scanned documents, images, sounds, and video. Systems that support the search and retrieval of documents are document-based DSS.
Knowledge-driven DSS. These applications incorporate the knowledge, experience, and judgment of experts in a particular domain and recommend courses of action. An expert system is an example of a knowledge-driven DSS.
Model-driven DSS. These applications focus on the use of sophisticated algorithms, such as optimization and simulation models. Examples include revenue management and production planning.
Power’s classification system is appealing because it retains the field’s long-standing DSS term, yet is broad enough to cover emerging applications.

Volume 25 Article 39 491
The More Things Change …
The DSS field underwent significant changes over the years, much of it driven by technological advances. For example, the Internet and web-based applications changed how people search for information and how it is de-livered. The collection, analysis, and use of real-time data expanded the range of DSS/BI applications. Dashboards/ scorecards allow organizational performance to be closely monitored. Data visualization software allows data to be analyzed in new ways.
Despite these significant advances, much remains the same. The names and some of the nuances may change, but many of the fundamental DSS concepts are the same. This is encouraging because the core body of DSS/BI know-ledge transcends the passage of time and technological advances. Consider a couple of these core concepts.
Rockart (1979) popularized the critical success factors (CSFs) concept. As the name suggests, there are critical things that workers, work units, and companies must do well to be successful. CSFs became an important concept and component part of executive information systems (Watson, Houdeshel, and Rainer 1997). Later on, key perfor-mance indicators (KPIs) became the more popular term, but the idea was the same—monitor that which is important for managerial and organizational success. The roots of today's dashboards/scorecards that display performance metrics go back to CSFs.
When DSS first emerged, it was recognized that the systems development life cycle (or ―waterfall‖ model) was inappropriate for developing decision support applications (Sprague 1980). Rather, a methodology that quickly resulted in a prototype that users could react to and be easily revised was better because of the difficulty of identi-fying decision support information requirements. As a result, iterative, evolutionary, and ―middle out‖ methods were recommended (Sprague 1980). This recognition and approach continues today, and agile design (exemplified by Extreme Programming [XP] and Scrum) carries the DSS development methodology banner.
Additional ideas, concepts, and understandings continue today, including the need for a separate decision support data repository, the need for model management, the demand for ever fresher data, and the use of the traffic light metaphor (e.g., red, yellow, and green) to highlight conditions.
III. THE WORLD OF BUSINESS INTELLIGENCE
As has been suggested, DSS has changed over the years, with many new kinds of applications (e.g., OLAP, dashboards/scorecards). In 1989, Howard Dresner, later an analyst at Gartner, coined the BI term. It is especially popular in industry and is used to describe all decision support applications. Its popularity is also finding its way into academia.
A BI Definition Although there is no well-accepted definition of BI, the following definition is useful for our purposes.
Business intelligence (BI) is a broad category of applications, technologies, and processes for gathering, storing, accessing, and analyzing data to help business users make better decisions.
This definition is broad. BI encompasses not only applications, but also technologies and processes. It includes not only ―getting data out‖ (through tools and applications), but also ―getting data in‖ (to a data mart or warehouse).
It should be pointed out that some authors use the BI term to refer to ―getting data out,‖ and data warehousing as ―getting data in.‖ Some authors use the data warehousing term to refer to both ―getting data in‖ and ―getting data out,‖ much like we use business intelligence. The good news is that the differing terminology does not normally cause confusion because of the context in which the terms are used.
Three BI Targets
Not all BI initiatives are the same. For example, some focus on a single or a few applications, while others are designed to provide enterprise-wide BI. Three specific BI targets can be identified (Watson 2006). They differ in terms of their focus; scope; level of sponsorship, commitment, and required resources; technical architecture; impact on personnel and business processes; and benefits.
(1) The development of a single or few related BI applications. This target is similar to the initial DSS that organi-zations created. It is often a point solution for a departmental need, such as campaign management in marketing. Sponsorship, approval, funding, impacts, and benefits are typically at the departmental level. A data mart is usually

492 Volume 25 Article 39
created to provide necessary data. Organizations must be careful that the mart (an ―independent‖ data mart) does not become a ―data silo‖ that stores data that is inconsistent and cannot be integrated with other data.
(2) The second target is the creation of infrastructure that supports current and future BI needs. A critical component is an enterprise data warehouse. Because it is an enterprise-wide initiative, senior management often provides sponsorship, approval, and funding. The impacts and benefits are felt throughout the organization.
3M provides an example of this target (Goodhue and Wixom 2000). The problem at 3M was that its divisions oper-ated independently and had separate decision support platforms. Not only was this costly, it was impossible to integrate the data and present a ―single face‖ to customers. Sales representatives did not know what business customers were doing with other 3M divisions. The solution was to develop an enterprise data warehouse, whose cost was covered by savings resulting from the consolidation of the various platforms and that allowed 3M to operate as an integrated company.
(3) The final target is organizational transformation where BI is used to fundamentally change how a company com-petes in the marketplace. BI supports a new business model and enables the business strategy. Because of its scope and importance, sponsorship, approval, and funding originate at the highest organizational levels. The impact on personnel and processes can be significant. The benefits are organization-wide.
Harrah’s Entertainment provides a good example of this BI target (Watson and Volonino 2002). In the early 1990s, the gaming laws changed to allow gambling on riverboats and Indian reservations. Harrah’s senior management saw this as an opportunity to expand and operate all Harrah’s properties in an integrated way. In the past, properties were run as ―independent fiefdoms.‖ At the heart of this new business model was the collection and use of customer data and the creation of a customer loyalty program (i.e., Total Rewards) that encouraged cross-casino play. The business strategy necessitated the creation of a BI infrastructure (i.e., WINet) that collected data from casino, hotel, and special event systems (e.g., wine tasting weekends) across the various customer touchpoints (e.g., slot ma-chines, table games, and Internet). Using this data, Harrah’s was able to become a leader in the gaming industry because of its ability to reward loyal customers and reach out to them in a personal and appealing way (e.g., through promotional offers created using BI).
A Generic BI Environment
Different BI targets require different BI environments. For example, developing a single or a few BI applications may require only a data mart rather than a data warehouse. Figure 3 shows a generic BI environment that is applicable for enterprise-wide BI. At the left are the source systems that provide data to the decision support data repository (i.e., data warehouse and marts). Data integration technology and processes are needed to prepare the data for decision support use. The mart or warehouse can employ a variety of architectures, technologies, and data models. On the right, a variety of users can access the data using different tools and applications. To ensure that BI meets its intended purposes, metadata, data quality, and governance processes must be in place. Let’s ―drilldown‖ into the component parts.
Source Systems
There is typically some ―organizational pain‖ (i.e., business need) that motivates BI. Working backwards, this pain leads to information requirements, BI applications, and source system data requirements. The data requirements can require only a single-source system, as in the case of a single BI application, or hundreds of source systems, as in the case with enterprise-wide BI.
A variety of source systems can be used. Possibilities include operational systems, ERPs, web data, third-party data (e.g., customer demographic data), and more. The trend is to include more types of data (e.g., sensing data from RFID tags). These source systems often use different platforms (e.g., IBM, Oracle) and store data in different for-mats (e.g., relational, hierarchical).
Many source systems have been in use for years and contain ―bad data‖ (e.g., missing or incorrect data) and are poorly documented. As a result, data profiling software should be used at the beginning of a data warehousing pro-ject to better understand the data (Fisher 2007). For example, data profiling software can provide statistics on missing data, identify possible primary and foreign keys, and reveal how derived values are calculated. Subject area database specialists (e.g., human resources) can also help in understanding and accessing the data in source systems.

Volume 25 Article 39 493
Figure 3. A Generic BI Environment
Other source systems issues must be addressed. Often there are multiple systems that contain some of the same data, and the best system must be selected as the source. It must also be decided how granular (i.e., the level of detail) the data needs to be. For example, are daily sales figures needed, or is data at the individual transaction level needed? The conventional wisdom is that it best to store data at a highly granular level because it is likely to be requested at some point.
Data Integration
It is necessary to extract data from source systems, transform it (often in a staging area), and load it into a data mart or warehouse. This is often called ETL, but the generic data integration term is increasingly used because of the growing number of ways that source system data can be handled. For example, in some cases, data is extracted, loaded into a mart or warehouse, and then transformed (i.e., ELT rather than ETL).
Data extraction can be performed by hand-written code (e.g., SQL queries) or by commercial data integration soft-ware. Most companies ultimately use commercial software. It makes it relatively easy to specify the tables and attributes in the source systems that are to be used, map and schedule the movement of the data to the target (e.g., staging area, data warehouse), make the required transformations, and ultimately load the data.
Using business rule, the data is transformed to make it more useful. For example, data from different systems may be integrated around a common key. This is common with customer data in order to have a 360 degree view of all interactions with customers. There may be required format changes to the data, such as using Male and Female to denote gender, as opposed to 0 and 1 or M and F. Aggregations may be performed, say on sales figures, so that queries can use the summaries rather than recalculating them each time. Data cleansing software may be used to ―clean up‖ the data, such as eliminating duplicate records (e.g., for the same customer).
Data is loaded into the warehouse during a ―load window.‖ This window (i.e., the period of time for loading new data) is getting smaller as companies seek to have ever-fresher data in their warehouses. At the extreme, with real-time data warehousing, enterprise application integration (EAI) software is used to monitor and extract data from opera-tional systems, feed the data into a queue, and ―trickle feed‖ it into the warehouse. For example, within fifteen min-utes of a purchase at Walmart, the details of the sale are in a warehouse and available for analysis.
494 Volume 25 Article 39
Storing the Data
There are many architecture and data models that can be used. One architecture—independent data marts—has its origins in DSS where the data was organized around the application rather than being treated as an organization-wide resource. While independent data marts may meet localized needs, they do not provide ―a single version of the truth‖ for the entire organization. They typically have inconsistent data definitions and inconsistent dimensions and measures that make it difficult to run distributed queries across the marts. They are also costly and time consuming to maintain.
In the late 1980s, companies began to develop data warehouses as enterprise-wide data repositories. Two com-peting architectures for data warehousing emerged, each recommended by one of the two luminaries in the field. Bill Inmon advocated the enterprise data warehouse (also known as the hub and spoke, corporate information factory, or DW 2.0 architecture) and Ralph Kimball championed the data mart bus architecture. The disagreement has con-tinued over the years as to which architecture is best (Breslin 2004).
The building of an enterprise data warehouse starts with an enterprise-level analysis of data requirements (Inmon et al. 2001). Special attention is given to building a scalable infrastructure. Using this enterprise view of data, the archi-tecture is developed in an iterative manner, subject area by subject area (e.g., marketing data, sales data). Data is stored in the warehouse in 3
rd normal form. Dependent data marts are created that source data from the warehouse.
The dependent marts can either be physical (i.e., a separate server) or logical (i.e., a view within the warehouse). The dependent data marts may be developed for departmental, functional area, or special purposes (e.g., data mining/predicted analytics) and use a data model appropriate for its intended use (e.g., relational, multidimensional). Because the dependent data marts obtain their data from the warehouse, a single version of the truth is maintained.
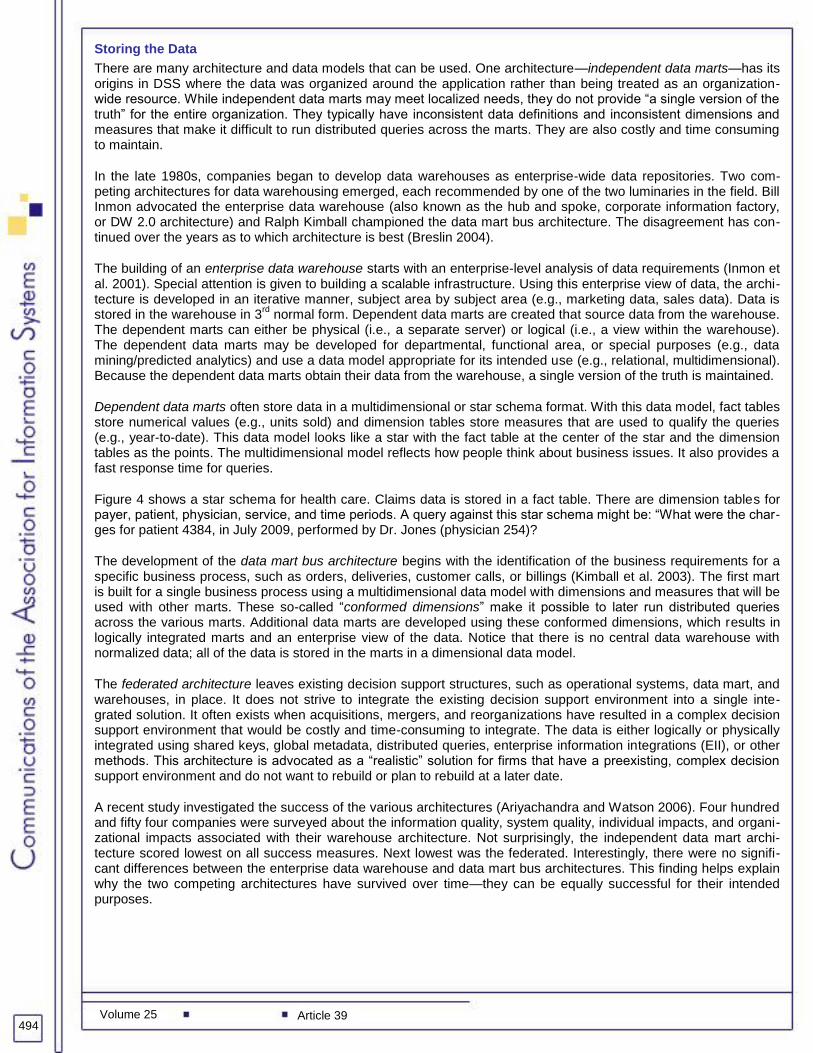
Dependent data marts often store data in a multidimensional or star schema format. With this data model, fact tables store numerical values (e.g., units sold) and dimension tables store measures that are used to qualify the queries (e.g., year-to-date). This data model looks like a star with the fact table at the center of the star and the dimension tables as the points. The multidimensional model reflects how people think about business issues. It also provides a fast response time for queries.
Figure 4 shows a star schema for health care. Claims data is stored in a fact table. There are dimension tables for payer, patient, physician, service, and time periods. A query against this star schema might be: ―What were the char-ges for patient 4384, in July 2009, performed by Dr. Jones (physician 254)?
The development of the data mart bus architecture begins with the identification of the business requirements for a specific business process, such as orders, deliveries, customer calls, or billings (Kimball et al. 2003). The first mart is built for a single business process using a multidimensional data model with dimensions and measures that will be used with other marts. These so-called ―conformed dimensions‖ make it possible to later run distributed queries across the various marts. Additional data marts are developed using these conformed dimensions, which results in logically integrated marts and an enterprise view of the data. Notice that there is no central data warehouse with normalized data; all of the data is stored in the marts in a dimensional data model.
The federated architecture leaves existing decision support structures, such as operational systems, data mart, and warehouses, in place. It does not strive to integrate the existing decision support environment into a single inte-grated solution. It often exists when acquisitions, mergers, and reorganizations have resulted in a complex decision support environment that would be costly and time-consuming to integrate. The data is either logically or physically integrated using shared keys, global metadata, distributed queries, enterprise information integrations (EII), or other methods. This architecture is advocated as a ―realistic‖ solution for firms that have a preexisting, complex decision support environment and do not want to rebuild or plan to rebuild at a later date.
A recent study investigated the success of the various architectures (Ariyachandra and Watson 2006). Four hundred and fifty four companies were surveyed about the information quality, system quality, individual impacts, and organi-zational impacts associated with their warehouse architecture. Not surprisingly, the independent data mart archi-tecture scored lowest on all success measures. Next lowest was the federated. Interestingly, there were no signifi-cant differences between the enterprise data warehouse and data mart bus architectures. This finding helps explain why the two competing architectures have survived over time—they can be equally successful for their intended purposes.

Volume 25 Article 39 495
Figure 4. A Star Schema for Health Care
Users, Tools, and Applications
Once the data is in a data mart or warehouse, it is ready for access. This begins the receiving of business value from BI; everything else constitutes creating BI infrastructure.
There are a large number of potential BI users, including:
IT developers
Front line workers
Analysts
Information workers
Managers and executives
Suppliers, customers, and regulators
A significant BI trend is extending BI to additional users, such as front-line workers, suppliers, customers, and regu-lators. This is referred to as pervasive BI and is discussed in more depth later.
Some of these users are information producers, in that they primarily create information for others (Eckerson 2002). IT developers and analysts typically are in this category. On the other hand, some users are information consumers, including managers and executives, because they consume information created by others.
Users access data mart and warehouse data using a variety of tools and applications, including:
SQL queries
Published reports
Drillable/OLAP reports
Excel

496 Volume 25 Article 39
DSS/specific applications
EIS/dashboards/scorecards
Data visualization
Data mining/predictive analytics
Some of the tools and applications are appropriate for information producers while others are best for information consumers. For example, IT developers and some analysts may write SQL queries, but not managers and execu-tives. Front line workers are most likely to use reports and dashboards/scorecards.
IT departments often want to standardize on a single or a few decision support products in order to reduce licensing, installation, maintenance, support, and training costs. While the goal is noble, it is often impossible to meet the needs of all users with a single tool (or more likely, a product suite). Users’ needs vary considerably, and business units normally have the clout and resources to acquire whatever tools they want. When companies do press to limit the number of products, there is a tendency to select a product that meets the needs of power users but are too complex for casual users, because it is normally the business power users that are on the software selection committees.
Some tools and applications, such as drillable/OLAP reports, Excel, and dashboard/scorecards, are good at hitting the decision support ―sweet spot,‖ in that they are easy to use and can meet the information needs of a large number of users (Eckerson 2002). Figure 5 shows a Human Resources dashboard/scorecard developed using MicroStrategy, one of the leading BI software vendors. At a glance, users can see claims-related information in graphical, tabular, summary, and detailed form. Radio buttons at the top of the screen allow the type of claim (e.g., medical, dental) to be easily changed.
Despite its limitations, Excel is by far the most popular BI tool. For years, BI vendors ―fought‖ against the use of Excel, but have now decided to ―join it‖ by making Excel a possible client that works with the rest of their software. Here is how it typically works. Plug ins that add functionality are downloaded to Excel (or any of the Microsoft Office products). It can be thought of as creating ―Excel on steroids.‖ Excel then connects to the vendor’s application server, which connects to a backend database. This gives Excel users the functionality and access to data associ-ated with sophisticated BI products, while allowing users to work with a familiar client—Excel. Microsoft has made similar changes to its product line. In particular, Excel can now be used with MS SQL Server.
Metadata
It is important for IT personnel and users to have metadata about the data in the marts/warehouse. For example, IT personnel who ―get the data in‖ need to know:
What data is stored in the data marts/warehouse
Mapping of the data flows from sources to targets
Data refresh schedules
Data models
Table and attribute names
Data transformation logic and business rules
History of metadata changes for version control
Performance metrics for managing growth
Users, on the other hand, need metadata to support ―getting data out,‖ including:
Detailed business descriptions of the available data
Subject areas, dimensions, and measures
The source systems for the data
The timeliness and quality of the data
Estimated response time for specific queries
Who has access to specific data and reports

Volume 25 Article 39 497
Source: MicroStrategy
Figure 5. A Human Resources Dashboard/Scorecard
Metadata should be created during the development of the marts/warehouse rather than as an afterthought. Some metadata will be the direct result of building the marts/warehouse, while other metadata can be obtained from opera-tional source systems, ETL software, and existing metadata repositories. It is best to maintain metadata in a cen-tralized repository that is accessible by IT personnel and users. Companies employ a range of alternatives for stor-ing metadata. The weakest option is to use Excel files. Another option is to rely on the metadata storage capabilities of the ETL or BI tools. Then there are stand-alone metadata repository products. Some companies have very good custom-built web-based systems.
Data Quality
BI tends to expose companies’ long-standing data quality problems. The profiling of source systems typically reveals a myriad of problems—missing data, dummy values, multipurpose fields, and reused primary keys. Some of these problems can be addressed with data cleansing software, but the better long-term solution is to correct the data quality problems at the source. This can be challenging, however, because the data owners are business unit man-agers, and they must sometimes be convinced that it is worthwhile spending resources to correct problems. High-level executive sponsorship and data governance can help in this regard. Data quality problems must be solved, however, or the usefulness and creditability of BI are significantly affected.
Several understandings, principles, and approaches are important to data quality. First, data in most firms is a stra-tegic resource and needs to be treated accordingly. There isn’t a ―quick fix‖ for data quality problems. Shoddy prac-tices need to be exposed and human processes changed. Lots of training and education are needed. People and processes need to be put in place to deal with data quality. Many companies name data stewards who are respon-sible for the quality of data for their area (e.g., marketing). People from the business units should be the official ―owners‖ of their data.
High data quality doesn’t require zero-defects or complete accuracy. Quality is relative to business need and user expectations. It needs to be accurate enough for how it will be used; it needs to be consistently defined and used; all

498 Volume 25 Article 39
of the necessary data should be available; it should be timely enough; and it should be easily accessible, under-standable, and usable.
BI Governance
The scope of BI governance is broad. At the strategic level, it helps ensure that BI efforts are aligned with company objectives and strategy. At the tactical level, it makes sure that BI projects are on time and schedule. At the opera-tional level, it addresses metadata and data quality issues (Watson, Fuller, and Ariyachandra 2004).
Governance is performed by multi-level, cross-functional committees and teams. Vice-president level executives typically provide strategic direction, directors prioritize and monitor projects, and users and the BI staff work on operational issues. Members of the BI staff often chair, coordinate, and participate in the various committees.
The committees establish processes for managing BI, such as processes for approving new projects, prioritizing projects, establishing schedules, resolving issues, creating and approving data definitions, and resolving data problems.
BI Benefits
BI potentially generates a range of benefits; see Figure 6. Some of them, like cost savings from consolidating multiple data marts into a centralized warehouse, are relatively easy to calculate. Others, such as the potential returns from supporting the accomplishment of strategic business objectives (e.g., organizational transformation), are more challenging. Some, like a departmental application, have a local impact, while others, like a company-wide dashboard/scorecard application, are global.
Figure 6. The Potential Benefits from BI
Like most organizational expenditures, BI projects usually go through an approval process and later the resulting benefits are assessed. There are exceptions, however, such as projects that are mandated by senior management or are so successful that there isn’t a need to spend time and money going through a post-implementation review.
Assessing BI benefits is more challenging than for operational systems because of the ―soft‖ nature of many of the benefits, such as more and better information and the making of better decisions. Normally it is easier to assess the benefits after a BI project is implemented than before.

Volume 25 Article 39 499
Many consulting firms, vendors, and companies take the following approach to assessing BI benefits. First the ―or-ganizational pain‖ is identified. For a telecommunications company, it might be high customer churn. Then the cur-rent situation is benchmarked; in our example, the key metric is the annual churn rate. The BI project might be the implementation of customer relationship management software to help reduce churn. An estimate is then made as to how much the BI initiative would reduce the churn rate—perhaps two percent. This reduction in churn is then finan-cially simulated, often using an Excel spreadsheet, to estimate the improvement in the firm’s ―bottom line.‖ This improvement is then compared to the cost of the BI initiative to determine if the investment is justified.
IV. BI IS CONSTANTLY CHANGING
Like IT in general, BI is always changing. Much of it is driven by enhancements in technology (e.g., data visualiza-tion software). Some by business need (e.g., real time data). Other changes reflect better ways of doing things (e.g., tying performance metrics to business strategy). Figure 7 identifies some of the newest and most exciting develop-ments in BI.
Figure 7. New Developments in BI
To illustrate the changes taking place in BI, four trends are discussed and illustrated: scalability, pervasive BI, opera-tional BI, and the BI-based organization.
Scalability
Advancements in hardware and database software are continuing to affect the scalability of BI; that is, BI’s ability to handle larger amounts of data, more concurrent users, and more complex queries, without a degradation of system performance. Some companies now store upwards of a petabyte of data in their warehouses (e.g., Walmart) and support thousands of users. Because of increases in scalability, companies can bring BI to more users and allow them to analyze large amounts of data in new, powerful ways.

500 Volume 25 Article 39
Pay as You Drive
There are many interesting examples of the impact of scalability. One is Pay as You Drive (PAYD), a new way of pricing automobile insurance that was first offered in the United Kingdom and has found its way into the US and other countries. With this approach, insurance costs are based on actual driving behavior. The simplest form of PAYD is pricing based on the number of miles driven. But this doesn’t take into account where, when, and how
safely you drive. Progressive Insurance’s MyRate approach to PAYD is more sophisticated. When you sign up for
MyRate, you are given a small monitoring device that plugs into your car’s OnBoard Diagnostic port under the dashboard. It transmits data about the number of miles driven, when the miles are driven, and the speed. Your insurance costs are calculated based on this information. Drivers who drive fewer miles, during the day, at low speeds are charged less than comparable drivers who drive more miles, at night, and at higher speeds. This ap-proach to pricing is possible because of Progressive Insurance’s ability to capture, store, and analyze large amounts
of data for every MyRate customer.
Pervasive BI
A goal in many companies is to make BI more pervasive; that is, to put BI in the hands of more people, and thereby ―democratize BI for the masses.‖ This spread of BI is not only to employees but also to suppliers and customers. There is still a lot of work to do, however. A 2007 InformationWeek BI survey found that only 11 percent of the re-sponding firms have pervasive BI across the enterprise. A 2008 TDWI study found that only 24 percent of BI users with a license use the tool at least once a week (Eckerson 2008). This is up from 18 percent in 2005, showing an improvement.
There are challenges to pervasive BI. One is the time, cost, and complexity to choose, acquire, and implement BI tools. Another challenge is the time and cost of training and supporting users. A related problem is that many users find the tools difficult to use, and require considerable training and support, not only on the tool, but also on the underlying data and how the tool can be used in their jobs (Avery and Watson 2004).
There are a variety of possible solutions for these problems. The use of open-source BI software can reduce the cost of BI software and decrease the time required for software selection and implementation (Klawans 2006). Customized, web-based applications can be developed that address the ease-of-use challenge. Interactive dash-boards and scorecards resonate with users and require little or no training. The use of Microsoft Office, and especially Excel, provides users with a familiar interface at a relatively low price. Designing business processes with BI embedded in them (e.g., business activity monitoring (BAM) dashboards, alerts) makes BI part of the work system.
BI software vendors are making progress on making their products easier to use. These efforts are following a vari-ety of paths, and one of the most interesting is to provide a Google-like search capability (Kotorov and Freivald 2007). This capability addresses a common problem that users have—finding relevant BI information. This informa-tion can include unstructured (e.g., documents) as well as structured (e.g., dashboards) data.
Progress EasyAsk exemplifies this type of search capability. Users enter a natural language statement of the infor-mation that they need. As they are typing, EasyAsk suggests types of analyses that are available. It also lists reports and documents that already exist. Users just select what they want to see. A demo of this software is available at http://www.imakenews.com/easyask/#a1197368.
Operational BI
Until recently, BI has focused on the use of historical data. This has changed with the emergence of technology for capturing, storing, and using real time data. This has opened up the world of BI and it is now possible to support operational decision making and interactions with customers in new ways. Not only can current operations be moni-tored, but also current operations can be influenced by real time of data.
The impact of having real time data is so great that it can be considered to be a new generation of decision-support data management (Watson 2005). The first generation is associated with the early DSS applications where a need for a separate data repository was recognized and the data was organized around specific DSS applications. This is an application-centric approach to decision-support data management. The second generation is traditional data warehousing where the warehouse is an enterprise-wide resource that supports a wide variety of applications. This approach is data-centric. The third generation is real time data warehousing and warrants being called a new gener-ation because it changes the paradigm for BI. It, too, is data-centric.
Hackathorn (2004) provides a useful model for understanding the value of real time BI; see Figure 8. Value is lost as the action distance increases, which is the amount of time that passes between when an event occurs and an action

Volume 25 Article 39 501
based on the event is taken. Action distance has three components. Data latency is the time between when an event occurs and when data about the event is in the data warehouse. Analysis latency is the time between when the data is in the warehouse and when the event data has been analyzed and the findings are available for use. Decision latency is the time that it takes for a person, application, or process to act on the information. Data and analysis latency can be minimized through the use of real-time technologies. Reducing decision latency is more challenging because it typically depends on workers to take action.
Figure 8. The Value of Real Time Data
Business activity monitoring (BAM) utilizes real-time data and dashboards in order to monitor current operations and motivate workers. It supports the old BI adage, ―that gets watched, gets done.‖ A good example of BAM is provided by 1-800 CONTACTS.
1-800 CONTACTS
1-800 CONTACTS is the world's largest contact lens store®, selling as many contact lenses as 2,500 retail optical shops combined. Customers can order over the Internet, by mail or fax, at Walmart, or by phone with nearly 300 customer service agents.
Performance dashboards are used to monitor and motivate the customer service agents who handle calls. The dashboards are updated every fifteen minutes, and the agents and their supervisors can see how they are doing on key metrics and compare their performance to other operators. The operators’ compensation is based in part on this information.
Figure 9 presents a typical operator’s dashboard. The gauges on the left are for the current day and show how the operator is performing on the closing ratio, average sale, and calls/hour metrics. The bar charts to the right show how the agent is performing throughout the day. The straight line shows the agent’s average performance for the month for the three metrics. You can see that the operator is doing better than his monthly average on closing ratio

502 Volume 25 Article 39
and average sale, but only in the 1:00 pm hour has he done better on calls/hour. At the right of the screen is a customer testimony about favorable service. The ribbon at the bottom of the screen identifies the top five performers on various metrics.
Figure 9. 1-800 CONTACTS Customer Service Agent Dashboard
A Call Center Incentive (CCI) index is calculated for each operator, which is used in determining the agents’ monthly compensation. The CCI formula uses a closing ratio index, average order size index, hours worked, bonus points for work, such as setting up appointments, and a quality index that is based on audits of the quality of the operator’s interactions with customers. The top 80 percent of agents receive bonuses, and the very best agents can receive upwards of $1,000 in bonus pay.
There are also executive dashboards (not shown) that indicate how the business is doing at any point during the day, how the business is performing relative to four weeks and a year ago, the performance of the various channels, and the predicted sales for the day. The last item is especially interesting. Based on an analysis of historical and current data, it is usually possible by 10:00 am each morning to predict end-of-the-day sales within a couple of thousand dollars. How might this capability be used? A marketing manager can monitor the effectiveness of a new campaign and make changes quickly if it is not doing well.
The operators’ dashboards are highly effective. After implementing the dashboards, revenues increased $50,000 per month, and call quality remained high. Call center management attributed the increase to the dashboards. The oper-ators have responded well to the dashboards. They like the ability to monitor their performance and to see how it compares to the other agents. Every fifteen minutes the agents can see how far they have ―moved the needle.‖

Volume 25 Article 39 503
The BI-Based Organization
The competitive landscape is changing, and for many firms, BI has evolved from being a ―nice to have,‖ to being a requirement for competing in the marketplace (Davenport 2006). Such firms are BI-based organizations because of the role that BI plays in their operations and overall business success.
Several examples of BI based-organizations have already been given, such as Harrah’s Entertainment. Another is Continental Airlines.
Continental Airlines
Continental is the seventh largest commercial airline in the world, employing more than 43,000 people and serving approximately 65 million passengers each year. Continental, along with Continental Express and Continental Con-nection, offers 2,300 daily departures to more than 265 destinations across five continents.
In 1998, Continental made the decision to develop an enterprise data warehouse that all employees could use for quick access to key information about the business and its customers. The data warehouse provided the infra-structure for a variety of early, big ―wins.‖ The initial BI applications for pricing and revenue management were fol-lowed by the integration of customer information, finance, flight information, and security.
After these successes, the management team raised the bar to focus on being the favorite airline of its most pro-fitable customers. As Continental moved ahead with this strategy, it became increasingly important for the ware-house to provide real-time, actionable information to support operational decision making and business processes. In 2001, Continental moved to real-time data warehousing (Watson et al. 2006).
Some of the BI applications that illustrate the use of real time data are described below. In many cases, the appli-cations also rely on the analysis of historical data.
A revenue accounting application quickly and accurately records the revenues that Continental generates, including estimating the revenues from any flight soon after ―the wheels are up.‖ Generating this information requires ticket purchase and final flight manifest data.
Continental identifies its most profitable customers through an analysis of warehouse data and strives to provide them with exceptional service. For example, a gate attendant may notice that a high-value customer has had a recent bad flight experience and offer a complimentary free upgrade.
A daily report lists Continental’s most profitable customers. A man appeared out of nowhere one day as #1 on the list. An alert user did not recognize the name and investigated. She discovered that he had counterfeited boarding passes and tickets and bundled them together and sent them in to the OnePass (i.e., Continental’s frequent flyer program) service center for retroactive flight credit. A timely report, an alert employee, and the ability to drill into OnePass and flight data caught this attempted fraud.
Real time data is also used to improve flight operations. Figure 10 shows one of the screens from Continental’s Flight Management Dashboard application (for Houston, Texas). Its most important use is to improve customer service by helping passengers make their flight connections. The display shows gates where customers have potential gate connection problems so that gate agents, baggage supervisors, and other operations managers can assess where ground transportation assistance and other services are needed so that these customers and their luggage avoid missing flights.
The display shows that Flight 678 is arriving twenty-one minutes late from San Diego (SAN) to Gate C37 (see the box at the bottom right-hand side). Three high-value and five other customers need assistance in making their connection at Gate C24 and will have only twelve minutes to make their flight. Five high-value and six other customers need to get to Gate C29 and will have twenty minutes. By combining customer profitability, current flight schedule, and passenger reservation data, along with flight status information transmitted from the incoming air-planes, Continental is able to anticipate and respond to potential connection problems and improve the customer flying experience.

504 Volume 25 Article 39
Figure 10. Continental’s Flight Management Dashboard
V. BI RESOURCES
There are many great BI resources available to faculty and students: (1) professional organizations, (2) websites, (3) journals and books, and (4) university support programs. Let us consider some of the better resources, and then look in more depth at a particular one, the Teradata University Network.
Professional Organizations
The leading practitioner organization for BI is The Data Warehousing Institute (TDWI), though some academicians also join. You can learn more about it at www.tdwi.org. The current membership cost for faculty is $275 and students can become members for only $50. TDWI has great resources and services, including educational programs, BI certification, research reports, publications, marketplace information, news, and webinars. Some of the resources are free, while others are restricted to members. TDWI holds four world conferences (in the US) each year, and the conferences include in-depth courses in addition to sessions on timely topics. A scholarship is awarded for each conference to a faculty member or graduate student who is doing teaching and/or research in BI and data ware-housing. You can apply for a scholarship on the TDWI website.
The Association for Information Systems (AIS) is ―the premier global organization for academics specializing in Information Systems.‖ It sponsors a large number of special interest groups, including the Special Interest Group on Decision Support, Knowledge and Data Management Systems (SIGDSS). Academics can join SIGDSS for a nominal fee (currently $10). SIGDSS provides networking opportunities for people who teach and research any kind of decision support. It sponsors workshops, conference tracks, and a variety of communications. You can learn more about it at: http://ais.affiniscape.com/displaycommon.cfm?an=1&subarticlenbr=269.
Websites
Two free practitioner-oriented websites are the BeyeNetwork (www.b-eye-network.com) and Information Manage-ment (www.information-management.com), formerly called DMReview. Both are great sources of timely materials, including channels on various BI topics, articles, white papers, cases, blogs, videos, podcasts, web seminars, and events.

Volume 25 Article 39 505
A slightly different website is DSS Resources (www.dssresources.com), owned and maintained by Dan Power, a Professor of MIS at the University of Northern Iowa. The site has a variety of resources that provide timely infor-mation on a variety of BI topics, but it also has materials of particular interest to academics. For example, Dan provides a history of the DSS field; interviews with DSS pioneers; channels for teachers, students, and researchers; a DSS newsletter; and the DSS framework mentioned previously. Some of the materials are free, while others are available only to subscribers (currently $10 for two or $15 for four months).
Journals and Books
There are academic and practitioner journals devoted to decision support. The oldest and best-known academic journal is Decision Support Systems (www.elsevier.com/wps/find/journaldescription.cws_home/505540/description#description).
The Journal of Decision Systems (www.jds.revuesonline.com) is an academic journal with an international editorial board. A new academic journal is the International Journal of Business Intelligence Research (www.igi-global.com/journals/details.asp?id=34414). It will publish its first issue in 2010. A leading practitioner journal (published by TDWI) is the Business Intelligence Journal (www.tdwi.org/Publications/BIJournal/index.aspx). It publishes timely, practical articles.
There are more professional and trade books than BI textbooks. For many years, the textbooks written by Efraim Turban and his co-authors have been market leaders. The second edition of Business Intelligence (published by Prentice-Hall/Pearson) was published in late 2009.
University Support Programs
Jerry Wagner was a Professor at the University of Texas–Austin in the early 1970s when he and some of his gradu-ate students developed one of the first DSS products, Interactive Financial Planning System (IFPS). Wagner later took IFPS to the marketplace, where it became a market leader. Because of Wagner’s understandings of the needs of universities and desire to help faculty and students work with leading-edge software, Wagner’s company, Execu-com, created the first comprehensive university support program. Many faculty and students around the world benefited from it. Today, Jerry is back in academia as a Professor at the University of Nebraska, Omaha, and offers a new product, Planners Lab, free to universities.
Over the years, BI vendors have increasingly made their resources, including software, available to faculty and students through university support programs. This is a ―win-win‖ situation as it helps faculty educate students using the latest BI resources, and helps the vendors because thousands of students enter the workplace being familiar with their products.
Industry consolidation is one of the recent BI trends (Weir 2008). Mostly through acquisitions, the larger companies are filling out their BI stack (i.e., product offerings). There are now four ―biggies‖—IBM, Microsoft, Oracle, and SAP—plus a fifth group of independents (e.g., Teradata, MicroStrategy, and SAS). Each of these groups has university initiatives. Some offer membership and resources for free, while others charge.
The IBM Academic Initiative makes resources (e.g., white papers, demos) available to faculty (www-304.ibm.com/ jct01005c/university/scholars/academicinitiative). IBM’s featured BI product is Cognos, which was acquired.
Microsoft does not have an identifiable group that makes BI resources available to faculty and students. However, at the Faculty Resource Center, there are resources specifically for teaching BI, such as slide decks, videos, case studies, and white papers (www.facultyresourcecenter.com/curriculum/FacetMain.aspx?FT=Tag &TagList=17& Results Title=Business%20Intelligence&ShowResults=1).
Oracle offers resources through its Oracle Academy (https://academy.oracle.com). You are probably familiar with how Oracle makes its database software available to universities. Though Oracle has several different BI-related products, Hyperion’s BI software is especially noteworthy. Schools, faculty, and students can become Oracle Acad-emy members.
You may think of SAP more in terms of ERP than BI, but this is changing. SAP moved into the BI space with the introduction of its Business Warehouse product. It purchased Business Objects, a leading BI tool. The SAP Univer-sity Alliances Community is SAP’s organization for working with universities and offers a wide variety of resources (www.sdn.sap.com/irj/scn/uac).

506 Volume 25 Article 39
Teradata University Network
The Teradata University Network (www.teradatauniversitynetwork.com) is a free learning portal for faculty with interests in data warehousing, DSS/BI, and database. Leading academics (including the author) and Teradata work closely together to design, develop, and operate the portal; see Figure 11. The site contains a wide variety of resources, including articles, assignments, book chapters, cases, podcasts, projects, PowerPoint presentations, research reports, software, syllabi, tutorials, web seminars, and white papers.
Especially noteworthy is the software and supporting pedagogical materials. On the site, users can access software from: (1) Teradata (database), (2) MicroStrategy (drillable reports, OLAP, dashboards/scorecards), (3) Planners Lab (model-based DSS), and (4) Tableau (data visualization).Software from SAS will be coming soon.
There is a separate portal for students, located at www.teradatastudentnetwork.com, which contains most of the above materials but specifically excludes resources that are only for faculty, such as assignment solutions.
Figure 11. Homepage for the Teradata University Network
The author teaches a MBA class in BI and another MBA class in Data Warehousing and Mining using the resources on TUN/TSN (my syllabi are available on TUN). The students like TSN because they do not have to buy a textbook, and the materials are very current (many are provided by TDWI). Some leading texts (Turban et al 2008; Hoffer et al. 2009) direct students to TSN for assignments and readings. While I send students to TSN for learning materials, some faculty prefer to download resources and place them on their learning platform (e.g., eLearning Commons).

Volume 25 Article 39 507
REFERENCES
Editor’s Note: The following reference list contains hyperlinks to world wide web pages. Readers who have the ability to access the web directly from their word processor or are reading the paper on the web, can gain direct access to these linked references. Readers are warned, however, that:
1. These links existed as of the date of publication but are not guaranteed to be working thereafter. 2. The contents of web pages may change over time. Where version information is provided in the References,
different versions may not contain the information or the conclusions referenced. 3. The author(s) of the web pages, not AIS, is (are) responsible for the accuracy of their content. 4. The author(s) of this article, not AIS, is (are) responsible for the accuracy of the URL and version
information.
Alter, S.L. (1975). ―A Study of Computer Aided Decision Making in Organizations,‖ Doctoral Dissertation, Cambridge, MA: M.I.T.
Alter, S.L. (1980). Decision Support Systems: Current Practice and Continuing Challenge. Reading, MA: Addison-Wesley.
Ariyachandra, T., and H.J. Watson (2006). ―Which Data Warehouse Architecture Is Most Successful? ‖ Business Intelligence Journal 11 (1), pp. 4–6.
Avery, K.L., and H.J. Watson (2004). ―Training Data Warehouse End Users, ‖ Business Intelligence Journal, 9 (4), pp. 40–51.
Breslin, M. (2004). ―Data Warehousing Battle of Giants: Comparing the Basics of the Kimball and Inmon Models,‖ Business Intelligence Journal, 9 (1), pp. 6–20.
Davenport, T. (2006). ―Competing on Analytics, ‖ Harvard Business Review 84 (1), pp. 98–107.
Eckerson, W.W. (1998). ―Post-Chasm Warehousing, ‖ Journal of Data Warehousing 3 (3), pp. 38–45.
Eckerson, W. (2002). ―The Decision Support Sweet Spot, ‖ Journal of Data Warehousing 7 (3), pp. 4–9.
Eckerson, W. (2004). ―Data Profiling: A Tool Worth Buying (Really), ‖ DM Review, 14 (6), pp. 28–31, 82.
Eckerson, W.W. (2008). ―Pervasive Business Intelligence,‖ TDWI Best Practices Report, Seattle, WA: The Data Warehousing Institute.
Ferguson, R.L., and C.H. Jones (1969). ―A Computer Aided Decision System,‖ Management Science 15 (10), pp. B550–B562.
Fisher, T. (2007). ―Data Profiling: The Diagnosis for Better Enterprise Information,‖ Business Intelligence Journal, 12 (3), pp. 10–17.
Gartner EXP (2009). ―Gartner EXP Worldwide Survey of More than 1,500 CIOs Shows IT Spending to Be Flat in 2009.‖ Press release, http://www.gartner.com/it/page.jsp?id=855612.
Goodhue, D.L., and B.H. Wixom (2000). ―3M Moves to a Customer Focus Using a Global Data Warehouse,‖ in TDWI Industry Study: 2000: Harnessing Customer Information for Strategic Advantage: Technical Challenges and Business Opportunities, Seattle: The Data Warehousing Institute.
Gray, P., and H.J. Watson (1992). Decision Support in the Data Warehouse. Upper Saddle River, NJ: Prentice-Hall.
Gorry, A., and M.S. Scott Morton (1971). ―A Framework for Information Systems,‖ Sloan Management Review 13 (1), pp. 56–79.
Hackathorn, R. (2004). ―The BI Watch: Real-Time to Real Value,‖ DM Review, 14 (1), pp. 24, 43.
Hackney, D. (1998). ―Architecture of Architectures: Warehouse Delivery,‖ DM Review, 12 (4), pp. 7–10.
Hoffer, J.A., M. Prescott, and H. Topi (2009). Modern Data Management, 9th edition. Upper Saddle River, NJ:
Prentice-Hall/Pearson.
Inmon, W.H. (1992). Building the Data Warehouse. New York: Wiley.
Inmon, W., C. Imhoff, and R. Sousa (2001). Corporate Information Factory. New York: Wiley.
Kimball, R., L. Reeves, M. Ross, and W. Thornthwaite (2003). The Data Warehouse Lifecycle Toolkit: Expert Methods for Designing, Developing, and Deploying Data Warehouses. New York: Wiley.
Klawans, B. (2006). ―Saving Time and Money—Why Open-Source BI Makes Sense,‖ Business Intelligence Journal, 11 (4), pp. 18-24..

508 Volume 25 Article 39
Kotorov, R., and J. Freivald (2007). ―Enterprise BI Search: Implementation Considerations,‖ Business Intelligence Journal, 12 (2), pp. 7–14.
Little, J.D.C. (1975). ―Brandaid, an On-Line Marketing Mix Model, Part 2: Implementation, Calibration and Case Study,‖ Operations Research 23 (4), pp. 656–673.
Power, D.J. (2007). ―A Brief History of Decision Support Systems,‖ DSSResources.COM, world wide web, http://DSSResources.COM/history/dsshistory.html, version 4.0.
Scott Morton, M.S. (1969). ―Computer-Driven Visual Display Devices—Their Impact on the Management Decision-Making Process,‖ Doctoral Dissertation, Boston, MA: Harvard Business School.
Scott Morton, M.S. (1971). Management Decision Systems: Computer-Based Support for Decision Making. Boston: Division of Research, Graduate School of Business, Harvard University.
Sprague, R.H., Jr., and H.J. Watson (1975). ―MIS Concepts,‖ Journal of Systems Management 26 (1), pp. 34–37.
Sprague, R.H., Jr., and H.J. Watson (1989), Decision Support Systems: Putting Theory into Practice, second edition. Englewood Cliffs, NJ: Prentice-Hall.
Rockart, J.F. (1979). ―Chief Executives Define Their Own Data Needs,‖ Harvard Business Review 67 (2), pp. 81–93.
Sprague, R.L., Jr. (1980). ―A Framework for the Development of Decision Support Systems,‖ MIS Quarterly 4 (4), pp. 1–26.
Sprague, R.L., Jr., and E.D. Carlson (1982). Building Effective Decision Support Systems. Englewood Cliffs, NJ: Prentice-Hall.
Turban, E., R. Sharda, J.E. Aronson, and D. King (2008). Business Intelligence. Englewood Cliffs, NJ: Prentice-Hall/Pearson.
Watson, H.J., G. Houdeshel, and R.K. Rainer, Jr. (1997). Building Executive Information Systems and other Decision Support Applications. New York: Wiley.
Watson, H.J. and L. Volonino, (2002). ―Customer Relationship Management at Harrah's Entertainment,‖ in G.A. Forgionne, J.N.D. Gupta, and M. Mora (eds.) Decision-Making Support Systems: Achievements and Challenges for the Decade. Hershey, PA: Idea Group Publishing.
Watson, H.J., C. Fuller, and T. Ariyachandra (2004). ―Data Warehouse Governance: Best Practices at Blue Cross and Blue Shield of North Carolina,‖ 38, pp. 435–450.
Watson, H.J. (2005). ―Real Time: The Next Generation of Decision-Support Data Management,‖ Business Intelligence Journal, 10 (3), pp. 4–6.
Watson, H.J., B.J. Wixom, J. Hoffer, J.R. Anderson-Lehman, and A.M. Reynolds (2006). ―Real-time Business Intelligence: Best Practices at Continental Airlines,‖ Information Systems Management, 23 (1), pp. 7–19.
Watson, H.J. (2006). ―Three Targets for Data Warehousing,‖ Business Intelligence Journal, 11 (4), pp.4–7.
Weier, M. H. (2008). ―How To Choose Among The Four Bright Lights Of BI, ‖ InformationWeek, 14 April 2008. http://www.informationweek.com/news/business_intelligence/information_mgt/showArticle.jhtml?articleID=207101021.

Volume 25 Article 39 509
APPENDIX
Glossary
Agile development. A group of software development methodologies based on iterative development, where requirements and solutions evolve through collaboration between self-organizing cross-functional teams.
BI Competency Center. A cross organizational unit that supports enterprise-wide BI by coordinating policy, creating standards, selecting software, coordinating data quality initiatives, identifying and prioritizing projects, and supporting development.
BI 2.0 Software. Second generation BI software that contains features such as social networking capabilities, information sharing, ratings, blogs, wikis, and mashups.
BI in the cloud. An external service provider hosts the technical infrastructure for BI (e.g., servers, BI software) and company data is transmitted, stored, analyzed, and the analyses returned over the Internet.
BI Gadgets. Mini BI applications that provide information or features in a simple and visually appealing way, such as a chart on a dashboard.
BI Governance. The people, committees, and processes that ensure that BI meets organizational goals.
BI Search. The ability to find and access BI reports, analyses, dashboards/scorecards, documents and more through a natural language entry into a ―Google like‖ search box.
Business intelligence (BI). A broad category of applications, technologies, and processes for gathering, storing, accessing, and analyzing data to help business users make better decisions.
Business performance management (BPM). A group of concepts, technologies, and processes (e.g., Balanced Scorecard) that ensure organizational alignment at the strategic, tactical, and operational levels.
Columnar databases. A database that organizes data by columns rather than rows in order to improve query response time and store data more efficiently.
Data (warehouse) appliances. Hardware and software preinstalled and optimized to serve specific data warehousing needs and applications.
Data visualization. A broad category of applications, technologies, and processes for visually displaying and analyzing data.
Decision support system (DSS). An interactive system that provides the user with easy access to decision models and data in order to support semi-structured and unstructured decision-making tasks.
Enterprise data warehouse. A data warehouse that has data from throughout the organization (e.g., sales, production, human resources) and supports users and applications organization wide.
Event analytics. Monitoring, analyzing, and taking action based on events that occur and are important to the organization.
Executive information system (EIS). A system that provides executives with easy access to internal and external information that is relevant to their critical success factors.
Geographic information system (GIS). A system for creating, storing, analyzing and managing spatial data.
Group decision support system (GDSS). A collaboration technology that supports meetings and group work.
In-memory analytics. Data is stored in random access memory (RAM), and analytics are performed there, which greatly increases processing speed.
Master data management. The management of data that is frequently shared throughout the organization, such as customer or product data.

510 Volume 25 Article 39
Mobile BI. Providing access to BI (e.g., dashboards) to employees who are away from the office through cell phones, PDAs, laptops, etc.
Online analytical processing (OLAP).. Software technology that supports multidimensional data analysis (i.e., ―slicing and dicing‖ data).
Open source BI software. BI software that can be used for free by organizations.
Predictive analytics (data mining). A group of analytical techniques and processes (e.g., cluster analysis, market basket analysis) for finding relationships in data and using these discovered relationships to predict future outcomes.
Rules engines. Software systems that execute business rules in a runtime production environment.
Software as a Service (SaaS). A software deployment model where a vendor hosts the software and organizations use the software as needed over the Internet. Also referred to as software on demand.
Star schema. A data model that uses fact and dimension tables to provide a dimensional view of the data and speed query response time.
Systems development life cycle (“waterfall” model). A group of software development methodologies based on a sequential series of steps, such as analyze the existing system, identify information requirements, logical system design, physical system design, coding, testing, and implementation.
Text analytics. Analytical techniques and processes for finding relationships in textual data, such as documents and e-mail.
ABOUT THE AUTHOR
Dr. Hugh J. Watson is a Professor of MIS and a holder of a C. Herman and Mary Virginia Terry Chair of Business Administration in the Terry College of Business at the University of Georgia. Hugh is a leading scholar and authority on decision support, having authored twenty-two books and over 100 scholarly journal articles. He helped develop the conceptual foundation for decision support systems in the 1970s, researched the development and implemen-tation of executive information systems in the 1980s, and for the past fifteen years has specialized in BI and data warehousing. Hugh is a Fellow of the Association for Information Systems and The Data Warehousing Institute and is the Senior Editor of the Business Intelligence Journal.
Copyright © 2009 by the Association for Information Systems. Permission to make digital or hard copies of all or part of this work for personal or classroom use is granted without fee provided that copies are not made or distributed for profit or commercial advantage and that copies bear this notice and full citation on the first page. Copyright for com-ponents of this work owned by others than the Association for Information Systems must be honored. Abstracting with credit is permitted. To copy otherwise, to republish, to post on servers, or to redistribute to lists requires prior specific permission and/or fee. Request permission to publish from: AIS Administrative Office, P.O. Box 2712 At-lanta, GA, 30301-2712, Attn: Reprints; or via e-mail from [email protected].

Volume 25 Article 39
.
ISSN: 1529-3181
EDITOR-IN-CHIEF Ilze Zigurs
University of Nebraska at Omaha AIS SENIOR EDITORIAL BOARD Guy Fitzgerald Vice President Publications Brunel University
Ilze Zigurs Editor, CAIS University of Nebraska at Omaha
Kalle Lyytinen Editor, JAIS Case Western Reserve University
Edward A. Stohr Editor-at-Large Stevens Institute of Technology
Blake Ives Editor, Electronic Publications University of Houston
Paul Gray Founding Editor, CAIS Claremont Graduate University
CAIS ADVISORY BOARD Gordon Davis University of Minnesota
Ken Kraemer University of California at Irvine
M. Lynne Markus Bentley College
Richard Mason Southern Methodist University
Jay Nunamaker University of Arizona
Henk Sol University of Groningen
Ralph Sprague University of Hawaii
Hugh J. Watson University of Georgia
CAIS SENIOR EDITORS Steve Alter University of San Francisco
Jane Fedorowicz Bentley College
Jerry Luftman Stevens Institute of Technology
CAIS EDITORIAL BOARD Michel Avital University of Amsterdam
Dinesh Batra Florida International University
Indranil Bose University of Hong Kong
Ashley Bush Florida State University
Fred Davis University of Arkansas, Fayetteville
Evan Duggan University of the West Indies
Ali Farhoomand University of Hong Kong
Sy Goodman Georgia Institute of Technology
Mary Granger George Washington University
Ake Gronlund University of Umea
Douglas Havelka Miami University
K.D. Joshi Washington State University
Michel Kalika University of Paris Dauphine
Julie Kendall Rutgers University
Nancy Lankton Michigan State University
Claudia Loebbecke University of Cologne
Paul Benjamin Lowry Brigham Young University
Sal March Vanderbilt University
Don McCubbrey University of Denver
Fred Niederman St. Louis University
Shan Ling Pan National University of Singapore
Jackie Rees Purdue University
Thompson Teo National University of Singapore
Craig Tyran Western Washington University
Chelley Vician Michigan Technological University
Rolf Wigand University of Arkansas, Little Rock
Vance Wilson University of Toledo
Peter Wolcott University of Nebraska at Omaha
Yajiong Xue East Carolina University
DEPARTMENTS Global Diffusion of the Internet Editors: Peter Wolcott and Sy Goodman
Information Technology and Systems Editors: Sal March and Dinesh Batra
Papers in French Editor: Michel Kalika
Information Systems and Healthcare Editor: Vance Wilson
ADMINISTRATIVE PERSONNEL James P. Tinsley AIS Executive Director
Vipin Arora CAIS Managing Editor University of Nebraska at Omaha
Copyediting by Carlisle Publishing Services