Embed Size (px)
Citation preview
8/14/2019 Turtle Mountain Field Laboratory: 2007 Data and Activity Summary (OFR_2008_07)
http://slidepdf.com/reader/full/turtle-mountain-field-laboratory-2007-data-and-activity-summary-ofr200807 1/47
ERCB/AGS Open File Report 2008
Turtle Mountain Field Laboratory:2007 Data and Activi ty Summary

8/14/2019 Turtle Mountain Field Laboratory: 2007 Data and Activity Summary (OFR_2008_07)
http://slidepdf.com/reader/full/turtle-mountain-field-laboratory-2007-data-and-activity-summary-ofr200807 2/47
ERCB/AGS Open File Report 2008-07
Turtle Mountain FieldLaboratory: 2007 Data and Activity Summary
F. Moreno and C.R. Froese
Energy Resources Conservation Board Alberta Geological Survey
October 2008

8/14/2019 Turtle Mountain Field Laboratory: 2007 Data and Activity Summary (OFR_2008_07)
http://slidepdf.com/reader/full/turtle-mountain-field-laboratory-2007-data-and-activity-summary-ofr200807 3/47
©Her Majesty the Queen in Right of Alberta, 2008
ISBN 978-0-7785-6960-2
The Energy Resources Conservation Board/Alberta Geological Survey (ERCB/AGS) and its employees
and contractors make no warranty, guarantee or representation, express or implied, or assume any legal
liability regarding the correctness, accuracy, completeness or reliability of this publication. Any software
supplied with this publication is subject to its licence conditions. Any references to proprietary softwarein the documentation, and/or any use of proprietary data formats in this release, do not constitute
endorsement by ERCB/AGS of any manufacturer's product.
When using information from this publication in other publications or presentations, due acknowledgment
should be given to the ERCB/AGS. The following reference format is recommended:
Moreno, F. and Froese, C.R. (2008): Turtle Mountain field laboratory: 2007 data and activity summary;
Energy Resources Conservation Board, ERCB/AGS Open File Report 2008-07, 40 p.
Published September 2008 by:
Energy Resources Conservation Board
Alberta Geological Survey
4th Floor, Twin Atria Building4999 – 98th Avenue
Edmonton, Alberta
T6B 2X3
Canada
Tel: 780.422.3767
Fax: 780.422.1918
E-mail: [email protected]
Website: www.ags.gov.ab.ca
ERCB/AGS Open File Repor t 2008-07 (October 2008) • iii
8/14/2019 Turtle Mountain Field Laboratory: 2007 Data and Activity Summary (OFR_2008_07)
http://slidepdf.com/reader/full/turtle-mountain-field-laboratory-2007-data-and-activity-summary-ofr200807 4/47
Contents
Acknowledgments........................................................................................................................................vi Abstract.......................................................................................................................................................vii 1 Introduction ............................................................................................................................................ 1 2 Sensor Network Activity ........................................................................................................................ 2
2.1 New Installations........................................................................................................................... 2 2.1.1 Electronic Distance Measurement (EDM) Network.......................................................... 2 2.1.2 Differential Global Positioning System (dGPS) Network................................................. 5 2.1.3 Turtle Mountain web cameras ........................................................................................... 8
2.2 Performance ..................................................................................................................................9 3 Data Analysis ....................................................................................................................................... 10
3.1 Deformation Monitoring Data..................................................................................................... 11 3.1.1 Crackmeters.....................................................................................................................11 3.1.2 Tiltmeters.........................................................................................................................11 3.1.3 Extensometers.................................................................................................................. 12
3.2 Other Monitoring Data ................................................................................................................ 12 3.2.1 Climatic and Thermistor Data ......................................................................................... 12
3.2.2 Differential Global Positioning System (dGPS).............................................................. 14 3.2.3 Electronic Distance Measurement (EDM) System Network........................................... 16
3.3 Discussion of Monitoring Data ................................................................................................... 16 4 Supporting Studies and Research ......................................................................................................... 16
4.1 South Peak Structural Mapping................................................................................................... 17 4.1.1 Previous Studies .............................................................................................................. 17 4.1.2 Upper South Peak ............................................................................................................ 18 4.1.3 Lower South Peak............................................................................................................ 27 4.1.4 Results ............................................................................................................................. 30
4.2 Third Peak Structural and Kinematic Analyses........................................................................... 30 4.2.1 Upper Third Peak ............................................................................................................30 4.2.2 Lower Third Peak ............................................................................................................ 30
4.3 Run-Out Studies .......................................................................................................................... 31 4.4 New Monitoring Studies ............................................................................................................. 33 4.4.1 Periodic GPS system ....................................................................................................... 33
5 Summary and Conclusions...................................................................................................................36 6 References ............................................................................................................................................ 39
Tables
Table 1. Main structural sets at Turtle Mountain.................................................................................... 19 Table 2. Photogrammetric target displacements between 1982 and 2005, Turtle Mountain.................. 24 Table 3. TM-71 gauge displacements between 1981 and 1994 for Zone 3 area, Turtle Mountain ........ 24 Table 4. Results of kinematic test performed in lower South Peak area ................................................ 28
Figures
Figure 1. Location of Turtle Mountain in Alberta and full-extent aerial view of the Frank Slide............. 1 Figure 2. Overview of the sensor network on Turtle Mountain as of December 2007.............................. 3 Figure 3. Location of the prisms on Turtle Mountain, as viewed from the pumphouse ............................ 4 Figure 4. Installation of one of the sixteen prisms on the eastern face of Turtle Mountain....................... 4 Figure 5. The Leica ‘total station’ installation in the municipal pumphouse at Bellevue, near the
base of Turtle Mountain.............................................................................................................. 5
ERCB/AGS Open File Repor t 2008-07 (October 2008) • iv

8/14/2019 Turtle Mountain Field Laboratory: 2007 Data and Activity Summary (OFR_2008_07)
http://slidepdf.com/reader/full/turtle-mountain-field-laboratory-2007-data-and-activity-summary-ofr200807 5/47
Figure 6. Typical differential GPS installation on Turtle Mountain.......................................................... 6 Figure 7. Schematic diagram of data flow for the combined dGPS-EDM system on Turtle Mountain .... 7 Figure 8. Web camera installation on the South Peak of Turtle Mountain................................................ 8 Figure 9. Image from the web camera on the South Peak of Turtle Mountain .......................................... 9 Figure 10. Image from the web camera at the Bellevue pumphouse, near the base of Turtle Mountain... 10 Figure 11. Plot of displacement versus time for crackmeter Set B, South Peak, Turtle Mountain............ 11
Figure 12. Plot of tilt versus time for tiltmeters, South Peak, Turtle Mountain......................................... 12 Figure 13. Plot of displacement versus time for extensometers, South Peak, Turtle Mountain ................ 13 Figure 14. Air temperature and variation of rock temperature with depth in the borehole at the top
of South Peak, Turtle Mountain, 2005–2007............................................................................ 13 Figure 15. Measured and typical average monthly distribution of rainfall in the vicinity of Turtle
Mountain, 2005–2007............................................................................................................... 14 Figure 16. Surface displacements derived from dGPS stations during the period 2006–2007.................. 15 Figure 17. Eastern face of Turtle Mountain, showing the upper and lower zones of Third and South
peaks ......................................................................................................................................... 17 Figure 18. Main discontinuity sets identified using COLTOP software and based on an interpretation
of the relief at Turtle Mountain derived from an airborne LiDAR survey............................... 19 Figure 19. 3-D model of the South Peak of Turtle Mountain with the three main potential sliding
joint sets and simplified schematic diagram of the postulated kinematic modes of failureon upper South Peak, Turtle Mountain..................................................................................... 20
Figure 20. Oblique view toward the south of the South Peak of Turtle Mountain, showing the three
main zones of deformation observed........................................................................................ 21 Figure 21. Plan view of three main deformation modes on the South Peak of Turtle Mountain............... 22 Figure 22. Photogrammetric target layout on the South Peak of Turtle Mountain.................................... 23 Figure 23. Close-up of zone of toppling .................................................................................................... 25 Figure 24. Lateral view of the postulated wedge failure zone ................................................................... 26 Figure 25. Close-up of subsidence zone and vertical airphoto showing the relative locations of the
photogrammetric targets, the EDM prisms and the Moiré crack gauges.................................. 27 Figure 26. Influence on morphology of the joint set J1 ............................................................................. 28 Figure 27. Six main instability zones on the lower South Peak, identified in the detailed structural
mapping and kinematic analysis............................................................................................... 29 Figure 28. Schematic diagram and photos of the shallow instability mechanism identified from the
field and office structural studies of the upper Third Peak area, Turtle Mountain................... 31 Figure 29. Plan view of mapped structural features and postulated unstable volumes.............................. 32 Figure 30. Cross-section of the two main unstable volumes identified on the lower Third Peak.............. 33 Figure 31. Original map prepared by Allan outlining to two estimates of run-out boundaries for a
5 million m3 rock avalanche originating from South Peak, Turtle Mountain........................... 34 Figure 32. BGC Engineering empirical upper limit boundary in relation to the large danger zone
identified by Allan for a rock avalanche originating from South Peak, Turtle Mountain ........ 35 Figure 33. Results of the sensitivity analysis undertaken by O. Hungr Geotechnical Research,
showing various scenarios for run-out boundaries for a 6 million m3 rock avalanche
originating from South Peak, Turtle Mountain......................................................................... 36
Figure 34. Locations of the 15 periodic dGPS monitoring points installed in the summer of 2007 by the University of Calgary Geomatics Engineering Group.................................................. 37
Figure 35. Typical periodic GPS point installation on Turtle Mountain.................................................... 38
ERCB/AGS Open File Repor t 2008-07 (October 2008) • v

8/14/2019 Turtle Mountain Field Laboratory: 2007 Data and Activity Summary (OFR_2008_07)
http://slidepdf.com/reader/full/turtle-mountain-field-laboratory-2007-data-and-activity-summary-ofr200807 6/47
Acknowledgments
The authors acknowledge the following colleagues and collaborators who have contributed either to the
operation and maintenance of the Turtle Mountain monitoring system or to studies on the mountainduring 2007:
•
G. Jean, J. Warren, J. Morgan, W. Langenberg, S. Mei (Alberta Geological Survey)• A. Pedrazzini, M. Jaboyedoff (University of Lausanne, Lausanne, Switzerland)
• D. Stead, M. Sturzenegger (Simon Fraser University, Burnaby, BC)
• O. Hungr, S. McDougall (University of British Columbia, Vancouver, BC)
•
H. Bland (Pinnacle Technologies, Calgary, AB)
•
G. Bjorgan (McElhanney Consulting Services Ltd., Vancouver, BC)
• A. Jones (Durham Geo Slope Indicator, Richmond, BC)
• B. Teskey, A. Eberling (University of Calgary, Calgary, AB)
The authors also thank R. Couture (Geological Survey of Canada, Ottawa) for his review and commentsof this report.
ERCB/AGS Open File Repor t 2008-07 (October 2008) • vi

8/14/2019 Turtle Mountain Field Laboratory: 2007 Data and Activity Summary (OFR_2008_07)
http://slidepdf.com/reader/full/turtle-mountain-field-laboratory-2007-data-and-activity-summary-ofr200807 7/47
ERCB/AGS Open File Repor t 2008-07 (October 2008) • vii
Abst rac t
Since 2005, the Alberta Geological Survey (AGS) has undertaken detailed review of the near-real-time
data stream from a sensor network installed on the South Peak of Turtle Mountain, and has initiatednumerous supporting studies to understand better the style and rate of movement of the slowly moving
rock mass. The South Peak site has been called the Turtle Mountain Field Laboratory (TMFL), as the data
from the sensor network at the site will be used by the international geotechnical research community todevelop a better understanding of 1) the mechanics of slowly moving rock masses, 2) instrumentation for
measuring these movements, and 3) the application of new technologies.
Near-real-time data continue to show trends related both to seasonal thermal cycles and to slow, long-
term creep of the South Peak mass. In general, the observed trends highlighted very slow movement along
the deep fractures to the west side of South Peak, in the order of less than a millimetre per year.
Preliminary results from detailed mapping of Third and South peaks, including lower slopes, has helped
to define potential zones of movement and led to interpretations of the mechanisms for movement and
potential volumes involved in these areas.
During 2007, a network of periodically read global positioning system (GPS) monuments was installed on
the more active portions of the peak, which had been identified by photogrammetry studies. In addition,
installation of the differential global positioning system (dGPS) and electronic distance measurement
(EDM) was completed. This included the addition of a number of new prisms on the eastern face of South
Peak and lower down the mountain, which will provide a more complete picture of the pattern of
movement in potentially unstable areas.
Reliability and continuity of the monitoring system have been reasonable and are expected to improve.
Current level of reliability allows the instrumentation installed at Turtle Mountain to provide an indication
of increased movements on South Peak. Periodic visual inspections have proven to be a necessary and
important element of the monitoring system. Considerable maintenance and repair have been required to
increase the reliability of the sensor network. Similar efforts, although possibly diminishing, will likely be
necessary in the years to come. Necessary ongoing work will include maintenance of the roof system for
the crackmeters, continued protection of the tiltmeters against humidity, and replacement of faulty
instruments.

8/14/2019 Turtle Mountain Field Laboratory: 2007 Data and Activity Summary (OFR_2008_07)
http://slidepdf.com/reader/full/turtle-mountain-field-laboratory-2007-data-and-activity-summary-ofr200807 8/47
1
Introduction
Since 2005, Alberta Geological Survey has been responsible for operating and managing the near-real-
time data stream from a network of sensors on the South Peak of Turtle Mountain, and for coordinating
numerous complementary studies to better understand the state of stability of the mountain’s eastern
slopes (Figure 1). Since these studies and the interpretation of data coming from the mountain sensor
system are ongoing, this report provides the 2007 annual summary of results and interpretations for the benefit of the geotechnical community and stakeholders in the Crowsnest Pass. The report is meant to be
brief, with the more detailed scientific results being presented in peer-reviewed journals and conference
publications.
Figure 1. Location of Turt le Mountain in Alberta and fu ll-extent aerial view of the Frank Slide. The dashed line belowSouth Peak outlines the area identified by Al lan (1931, Figure 2) as being most unstable.
ERCB/AGS Open File Repor t 2008-07 (October 2008) • 1

8/14/2019 Turtle Mountain Field Laboratory: 2007 Data and Activity Summary (OFR_2008_07)
http://slidepdf.com/reader/full/turtle-mountain-field-laboratory-2007-data-and-activity-summary-ofr200807 9/47
2
Sensor Network Activ ity
This section provides an overview of the major changes to the physical sensor network of the monitoring
system during the period between January and December 2007. Documentation of the hardware thatforms the various components of the communication stations was provided in Moreno and Froese (2006)
and is therefore not included in this summary.
The main activities undertaken with respect to the sensor network during 2007 include
1) completion of the design and installation of six global positioning system (GPS) stations on South
Peak;
2) installation of the electronic distance measurement (EDM) ‘total station’ and twenty prisms on the
east face of the mountain;
3) installation of two web cameras (one at the top of the mountain looking down, and one at the bottom
of the mountain looking up); and
4) replacement of two crackmeters and upgrade of the protective housing on five sets of crackmeter
triplets.
The following sections provide a brief overview and photographs of these activities. Figure 2 provides an
overview of the sensor-network layout as of December 2007.
2.1 New Installations
2.1.1 Electronic Distance Measurement (EDM) Network
An automated laser-ranging survey system was installed during the summer of 2007 by McElhanney
Engineering Services of Vancouver (McElhanney Consulting Services Ltd., 2007; Combined GPS and
EDM monitoring on Turtle Mountain, Alberta, (Bjorgan and Froese, work in progress, 2008). This system
consists of twenty prisms installed on the mountain and a Leica robotic total station in the valley bottom
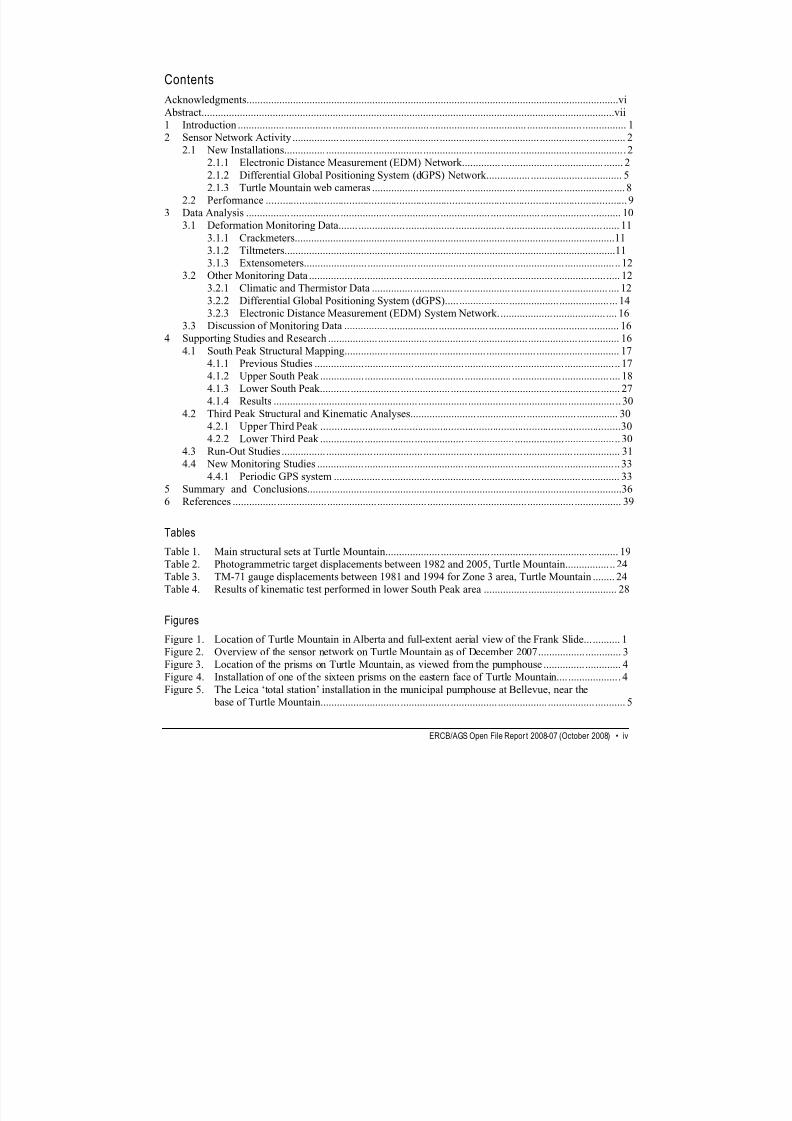
to sight the prisms. Of the 20 prisms, four were co-located with the GPS stations at the Third Peak, South
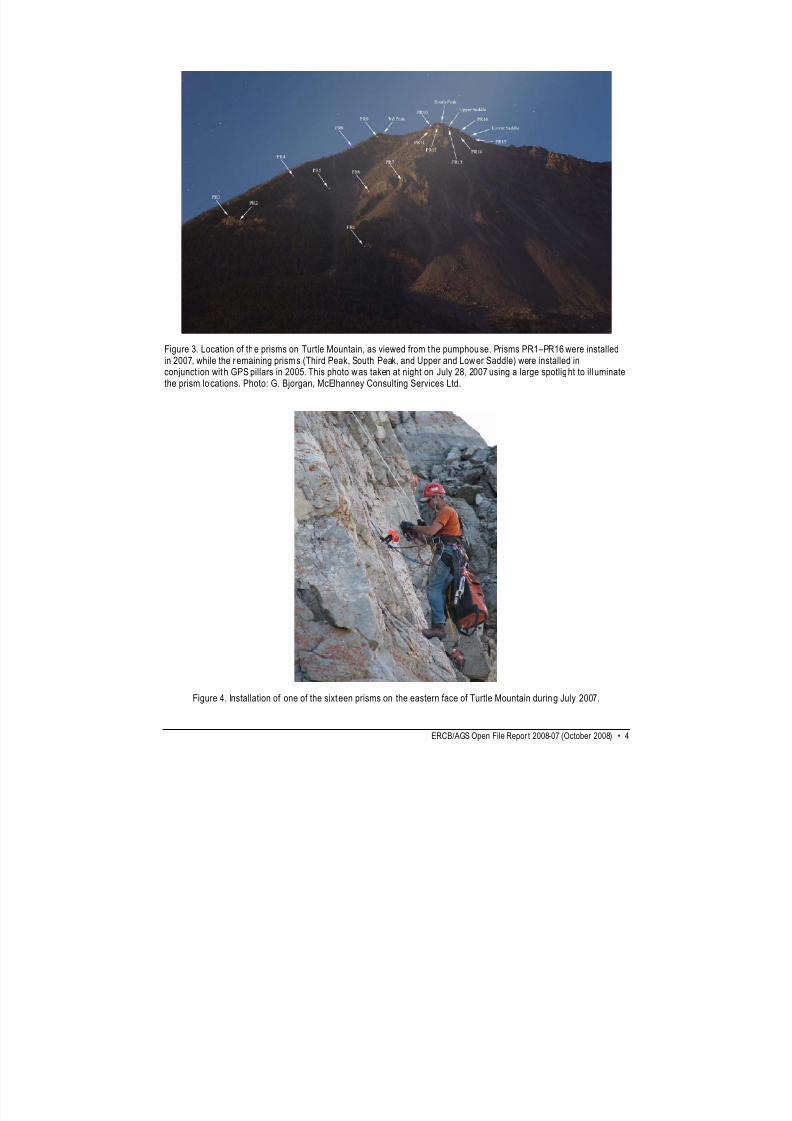
Peak, Upper Saddle and Lower Saddle (Figure 3). The other sixteen prisms were mounted on the east face
of Turtle Mountain by Vertical Systems International Inc., using ropes and climbing gear (Figure 4). This
work included the addition of a number of prisms on the eastern face of Third Peak and lower down themountain to obtain a more complete picture of the movement patterns in potential unstable zones
highlighted by recent light detection and ranging (LiDAR) studies (Moreno and Froese, 2007). The
locations of the prisms are shown in Figure 3.
The total station is located at the municipal pumphouse in Bellevue on a reinforced concrete pillar that
was built for the project. A viewing port was constructed through the brick wall of the building and a
protective wooden structure built and insulated to keep outside air from affecting any of the equipment in
the pumphouse (Figure 5). The total station can measure distance with an accuracy of about ±3 mm
between the pumphouse and the prisms (an absolute distance of almost 3 km). However, given the large
change in elevation between the pumphouse and the summit of Turtle Mountain, atmospheric refraction
can introduce large errors in measuring absolute distance. To fully correct for refraction effects, distance
measurements from the total station to the four ridge prisms are constantly taken by their co-located GPS.
These readings are used to calibrate the distance between the ridge and the total station, and thesecalibrated distances are then used to correct the distances to the other prisms. Since each prism must be
visible to the instrument in order to gather readings, readings cannot be obtained when the prisms are
obscured (fog, snow, ice on the prisms).The prisms are covered by snow and ice during much of the
winter, so the reliability of readings, if obtained, is low.
ERCB/AGS Open File Repor t 2008-07 (October 2008) • 2

8/14/2019 Turtle Mountain Field Laboratory: 2007 Data and Activity Summary (OFR_2008_07)
http://slidepdf.com/reader/full/turtle-mountain-field-laboratory-2007-data-and-activity-summary-ofr200807 10/47
8/14/2019 Turtle Mountain Field Laboratory: 2007 Data and Activity Summary (OFR_2008_07)
http://slidepdf.com/reader/full/turtle-mountain-field-laboratory-2007-data-and-activity-summary-ofr200807 11/47
Figure 3. Location of the prisms on Turtle Mountain, as viewed from the pumphouse. Prisms PR1–PR16 were installedin 2007, while the remaining prisms (Third Peak, South Peak, and Upper and Lower Saddle) were installed inconjunct ion with GPS pillars in 2005. This photo was taken at night on July 28, 2007 using a large spotlight to ill uminatethe prism locations. Photo: G. Bjorgan, McElhanney Consulting Services Ltd.
Figure 4. Installation of one of the sixteen prisms on the eastern face of Turtle Mountain during July 2007.
ERCB/AGS Open File Repor t 2008-07 (October 2008) • 4

8/14/2019 Turtle Mountain Field Laboratory: 2007 Data and Activity Summary (OFR_2008_07)
http://slidepdf.com/reader/full/turtle-mountain-field-laboratory-2007-data-and-activity-summary-ofr200807 12/47
Figure 5. The Leica ‘total station’ installation in the munici pal pumphouse at Bellevue, near the base of Turtle Mountain.The total station is in an insu lated box and located approximately 3 km from the prisms on the eastern face of TurtleMountain. Photo: G. Bjorgan, McElhanney Consulting Services Ltd.).
In May 2006, Pinnacle Technologies (formerly Alto Instruments Ltd.) managed the installation of a new
radio tower on the west side of the pumphouse. This tower establishes a 5 GHz link between the EDM
system on the mountain and the Frank Slide Interpretive Centre (FSIC). At present, data collected by the
total station are streamed in real time to McElhanney’s processing server in Vancouver via the 5 GHz link between the Bellevue municipal pumphouse and the provincial building in Blairmore. However, it is
expected that these data will be transmitted to the FSIC computer server by the end of 2008. This data-
streaming modification will be completed in the summer of 2008, with the performance and resulting data
being included in the 2008 annual summary report. The advantages of this configuration are that the EDM
data can be combined with the data from the other deformation and climate sensors on the mountain and
incorporated directly into the emergency warning application.
2.1.2 Differential Global Positioning System (dGPS) Network
In addition to the automated laser-ranging survey system, six single-frequency dGPS stations and one
base unit were installed by McElhanney Consulting Services Ltd. (2007; Combined GPS and EDM
monitoring on Turtle Mountain, Alberta, Bjorgan and Froese, work in progress, 2008), in the vicinity of
South Peak and at the Bellevue pumphouse, respectively. Three of these stations are positioned along theridge just north of South Peak; two are located on the west face of the mountain, immediately downslope
from the South Peak borehole (one on each side of Crack 1); and one is located at Third Peak. The Third
Peak GPS station is considered stable relative to those on South Peak and has a short baseline that is
acceptable for use as a base station. This project began in September 2005 and was completed in
November 2007. The locations of these installations are shown in Figure 2.
Each station comprises a reinforced concrete pillar mounted with a dual-metal-plate assembly and a fixed
GPS antenna. The GPS antenna is connected to a GPS data recorder and a wireless server inside a
ERCB/AGS Open File Repor t 2008-07 (October 2008) • 5

8/14/2019 Turtle Mountain Field Laboratory: 2007 Data and Activity Summary (OFR_2008_07)
http://slidepdf.com/reader/full/turtle-mountain-field-laboratory-2007-data-and-activity-summary-ofr200807 13/47
waterproof plastic enclosure, allowing true real-time communication. The enclosure, radio antenna and
solar panel are attached to a guyed mast that is bolted to the rock outcrop. Each station is powered by
deep-cycle marine batteries located inside an insulated battery box. Figure 6 shows a typical installation.
The GPS base unit installed at Bellevue pumphouse differs only in that it uses utility power, rather than
solar, and a different brand of wireless server. The pumphouse GPS station is more than 3 km from the
South Peak GPS array and is therefore used only periodically as a stable base to confirm that the Third
Peak GPS station is not moving.
The connection to the Turtle Mountain network is handled by a 5 GHz link between the new radio tower
on the west side of South Peak and the provincial building in Blairmore, where data collected by the six
units on the mountain are streamed in real time to a processing server in Vancouver (McElhanney
Consulting Services Ltd. office). After being accepted by custom software on the processing server, the
raw data are archived and then passed on to the Novatel RTKNav processing engine. The GPS data are
processed in two different ways:
1) A real-time solution is provided from instantaneous readings, which has an accuracy of 1–2 cm.
2) An average solution is obtained from one-hour blocks of readings, which is accurate to approximately
3–5 mm.
Both types of processed solutions are then filtered and archived on the processing computer. Raw data
processing, filtering and archiving will be migrated to the computer server located at the FSIC in the
summer of 2008; the results of this will be reported in the 2008 annual summary. A schematic diagram ofthe data flow for the GPS and EDM systems is shown in Figure 7.
Figure 6. Typical differential GPS installation on Turtle Mountain, showing concrete pillar with Novatel antenna (right),battery box (centre) and solar panel (left). Enclosure hidden behind so lar panel. Photo: G. Bjorgan, McElhanneyConsulting Services Ltd.
ERCB/AGS Open File Repor t 2008-07 (October 2008) • 6

8/14/2019 Turtle Mountain Field Laboratory: 2007 Data and Activity Summary (OFR_2008_07)
http://slidepdf.com/reader/full/turtle-mountain-field-laboratory-2007-data-and-activity-summary-ofr200807 14/47
satellites
aap
ab
a
Figure 7. Schematic diagram of data flow for the combined dGPS-EDM system on Turtle Mountain (from McElhanneyConsulting Services Ltd., 2007; Combined GPS and EDM monitori ng on Turtle Mountain, Alberta, Bjorgan and Froese,work in progress, 2008).
ERCB/AGS Open File Repor t 2008-07 (October 2008) • 7

8/14/2019 Turtle Mountain Field Laboratory: 2007 Data and Activity Summary (OFR_2008_07)
http://slidepdf.com/reader/full/turtle-mountain-field-laboratory-2007-data-and-activity-summary-ofr200807 15/47
2.1.3 Turtle Mountain web cameras
Two web cameras were installed at Turtle Mountain by H. Bland of Pinnacle Technologies (formerly Alto
Instruments Ltd.) to provide visual confirmation and help with interpretation of any displacement detected
by the primary monitoring system. One was located at the top of the mountain (South Peak), looking
down to the northeast across the head of the 1903 slide, and the other at the bottom of the mountain
(Bellevue pumphouse), looking up at the eastern face of Turtle Mountain. The South Peak camera wasinstalled at a former seismic monitoring station at South Peak. Seismic monitoring at this station ceased in2006 after severe lightning destroyed the monitoring equipment and data radio. During installation, the
damaged radio was replaced, a mast extension added to accommodate the camera mount and additional
guy wires installed to prevent the mast from twisting under severe winds. Installation also included the re-
use of existing equipment enclosures, solar panels, solar controllers and associated batteries (Figure 8).
The camera is attached to the mast extension and connected through a single cable to the network radio,which transmits the image data to the computer server at the Frank Slide Interpretive Centre (Figure 9).
The Bellevue pumphouse web camera was established as a secondary visual inspection point. This site is
connected to the FSIC via a 5GHz wireless data link. Power for the Bellevue camera is supplied from a
power-over-Ethernet injector with an integrated 48V DC supply. The injector and network connection are
housed in the electronics enclosure inside the pumphouse building. The camera’s data/power cable runs
from the enclosure through the conduit to the west. The line passes through the wall via a service cap
above the roofline and then to the antenna in the radio tower next to the pumphouse. The two cameras are
identical except for a slightly greater zoom on the pumphouse lens.
Figure 8. Web camera installation on the South Peak of Turtle Mountain, showing radio antenna, battery boxes andsolar panels (left), and close-up of camera, pole mount and mast extension (right). Photo: H. Bland, PinnacleTechnologies (formerly Alto Instruments Ltd.).
ERCB/AGS Open File Repor t 2008-07 (October 2008) • 8
8/14/2019 Turtle Mountain Field Laboratory: 2007 Data and Activity Summary (OFR_2008_07)
http://slidepdf.com/reader/full/turtle-mountain-field-laboratory-2007-data-and-activity-summary-ofr200807 16/47
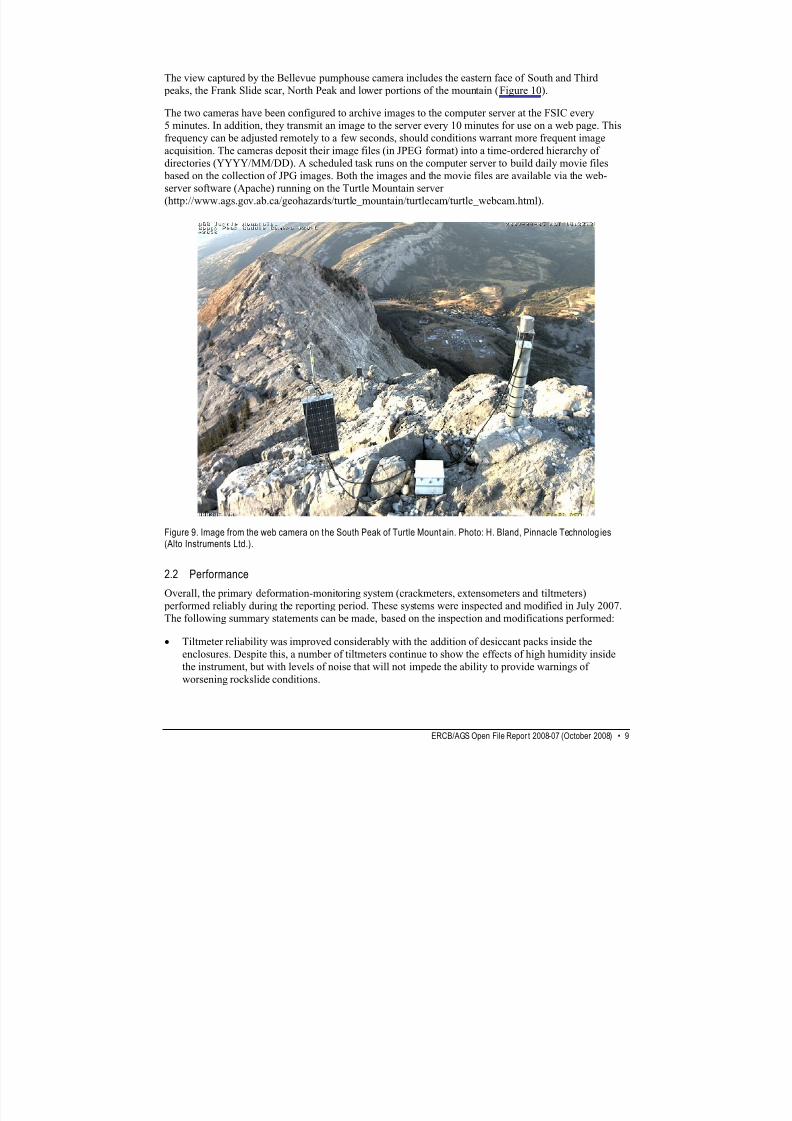
The view captured by the Bellevue pumphouse camera includes the eastern face of South and Third
peaks, the Frank Slide scar, North Peak and lower portions of the mountain (Figure 10).
The two cameras have been configured to archive images to the computer server at the FSIC every
5 minutes. In addition, they transmit an image to the server every 10 minutes for use on a web page. This
frequency can be adjusted remotely to a few seconds, should conditions warrant more frequent image
acquisition. The cameras deposit their image files (in JPEG format) into a time-ordered hierarchy ofdirectories (YYYY/MM/DD). A scheduled task runs on the computer server to build daily movie files
based on the collection of JPG images. Both the images and the movie files are available via the web-
server software (Apache) running on the Turtle Mountain server
(http://www.ags.gov.ab.ca/geohazards/turtle_mountain/turtlecam/turtle_webcam.html).
Figure 9. Image from the web camera on the South Peak of Turtle Mountain. Photo: H. Bland, Pinnacle Technolog ies(Alto Instruments Ltd.).
2.2 Performance
Overall, the primary deformation-monitoring system (crackmeters, extensometers and tiltmeters)
performed reliably during the reporting period. These systems were inspected and modified in July 2007.The following summary statements can be made, based on the inspection and modifications performed:
• Tiltmeter reliability was improved considerably with the addition of desiccant packs inside the
enclosures. Despite this, a number of tiltmeters continue to show the effects of high humidity inside
the instrument, but with levels of noise that will not impede the ability to provide warnings of
worsening rockslide conditions.
ERCB/AGS Open File Repor t 2008-07 (October 2008) • 9

8/14/2019 Turtle Mountain Field Laboratory: 2007 Data and Activity Summary (OFR_2008_07)
http://slidepdf.com/reader/full/turtle-mountain-field-laboratory-2007-data-and-activity-summary-ofr200807 17/47
Figure 10. Image from the web camera at the Bellevue pumphouse, near the base of Turtle Mountain.
•
Several of the 22 crackmeters continue to show evidence of snow or ice loading. However, the data
obtained from some of the crackmeters with improved roofs (Set C) show that effective protection
against snow can be achieved. It is expected that refurbishment of additional roofs, undertaken inearly July 2007, will increase the reliability of this system.
• The five extensometers performed consistently well, providing high-quality data throughout most of
the reporting period, although their reliability was somewhat affected by lightning activity. Two
extensometers were lost during a thunderstorm event during early September.
• The six GPS stations performed reliably during the reporting period, although some of these stations
have been continuously affected by lightning. Several trips were made during the reporting period to
repair/replace damaged equipment. Damage due to moisture accumulation in the enclosure has been
documented in one case.
• Operation of the two web cameras has yielded mixed results. Although the Bellevue camera
performed very well during the reporting period, the South Peak camera suffered from frequent
damage associated with lightning. Maximum lightning protection options are currently under review
and should be implemented in late 2008.
3
Data Analysis
This section discusses interpretations of slope conditions and displacement behaviour from
instrumentation results. As some of the sensors have been impacted by climatic factors, discussion will
ERCB/AGS Open File Repor t 2008-07 (October 2008) • 10

8/14/2019 Turtle Mountain Field Laboratory: 2007 Data and Activity Summary (OFR_2008_07)
http://slidepdf.com/reader/full/turtle-mountain-field-laboratory-2007-data-and-activity-summary-ofr200807 18/47
focus on the sensors that have provided reliable annual performance. Meteorological data have been
essential in explaining general displacement trends observed in the surface instrumentation.
3.1 Deformation Monitoring Data
3.1.1 Crackmeters
Crackmeters were installed to monitor continuously the direction and magnitude of surface-fractureopening. Details of installation have been described by Moreno and Froese (2006). Although
displacements were observed on many of the crackmeter sets, the most indicative record of slope
displacement has been obtained from the cluster of three crackmeters in Set B. These instruments provide
the time series of crack opening and temperature over a period of three years (Figure 11). Monitoring
results show an annual displacement cycle, which correlates with temperature cycles, that are dominated
by an active phase, with displacements occurring in early autumn to late winter, and a relatively inactive
phase, with limited to no displacements in spring to late summer. Magnitudes of displacement rate of
0.4 mm/year have been recorded. Likewise, the measured data show displacement fluctuations, related to
daily air-temperature cycles, with crack-width changes on the order of 0.02 mm.
2.0
1.5
1.0
0.5
0.0
-0.5
-1.0
-1.5
-2.0
20
0
-20
-40
-60
-80
-1001 -J an -0 5 1 -M ay- 05 2 9- Au g-0 5 2 7- De c-0 5 2 6- Ap r- 06 2 4- Au g- 06 2 2- De c-0 6 2 1- Ap r- 07 1 9-A ug -0 7 17 -D ec -0 7
o
2005 2006 2007
Figure 11. Plot o f disp lacement versus time fo r crackmeter Set B, South Peak, Turtle Mountain.
3.1.2
Tiltmeters
Results from the tiltmeter network reveal a variety of trends, ranging from sensor fluctuations that mirror
the thermal cycles to trends that might indicate cumulative, permanent creep (observed at two of the
sensors).
In general, all sensors display an increase in tilt at the start of the summer period and a return to the
previous state at the end of it (Figure 12). A similar cyclic variation in tilt associated with diurnal
temperature fluctuations is also present, but at a smaller scale (∼0.01°). Noisy responses due to moisture
in the sensors continue to affect the quality of tiltmeter data (T-1, T-8 and T-10), although the addition of
desiccant packs during summer 2006 has remarkably improved data quality (T-2 and T-3).
ERCB/AGS Open File Repor t 2008-07 (October 2008) • 11
8/14/2019 Turtle Mountain Field Laboratory: 2007 Data and Activity Summary (OFR_2008_07)
http://slidepdf.com/reader/full/turtle-mountain-field-laboratory-2007-data-and-activity-summary-ofr200807 19/47
Tiltmeter2
Noise
0.30
0.25
0.20
0.15
0.10
0.05
0.00
-0.05
-0.10
20
0
-20
-40
-60
-80
-100
1 -J an -0 5 1 -Ma y- 05 2 9- Au g-0 5 2 7- De c- 05 2 6-A pr -0 6 2 4-A ug -0 6 2 2- De c- 06 2 1- Ap r- 07 1 9- Au g- 07 1 7-D ec- 07
2005 2006 2007
o
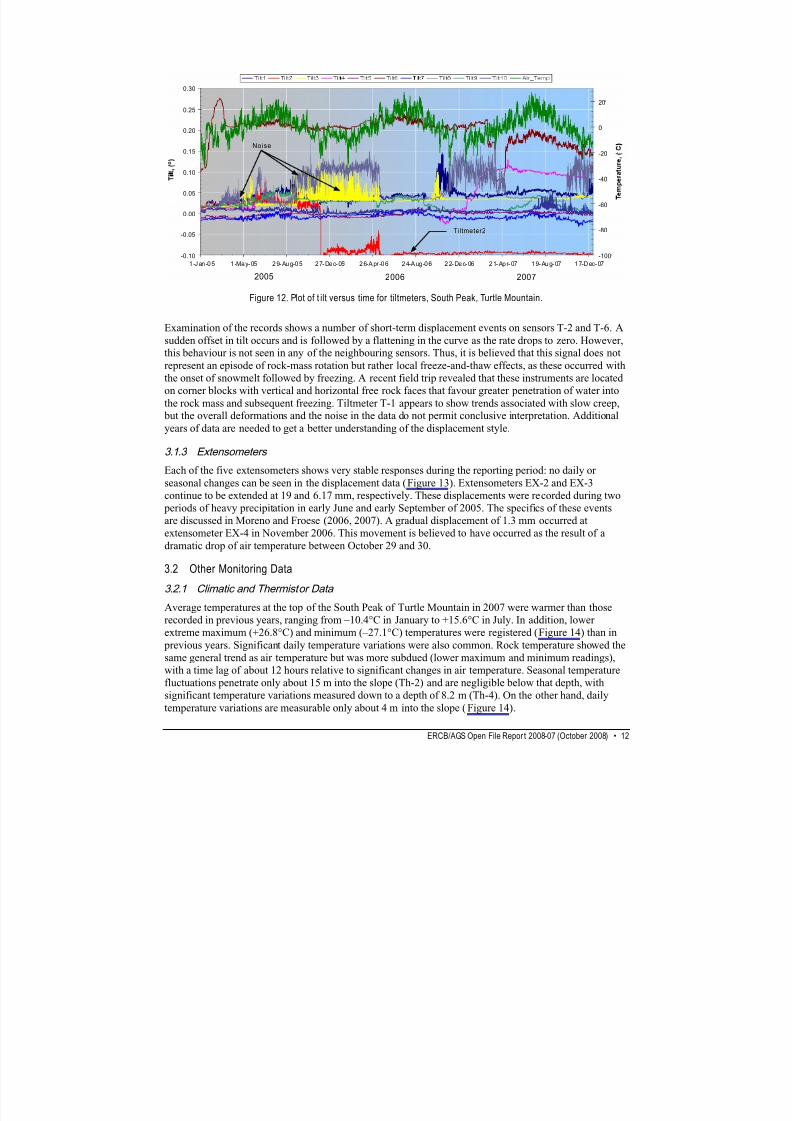
Figure 12. Plot of t ilt versus time for tiltmeters, South Peak, Turtle Mountain.
Examination of the records shows a number of short-term displacement events on sensors T-2 and T-6. A
sudden offset in tilt occurs and is followed by a flattening in the curve as the rate drops to zero. However,this behaviour is not seen in any of the neighbouring sensors. Thus, it is believed that this signal does not
represent an episode of rock-mass rotation but rather local freeze-and-thaw effects, as these occurred with
the onset of snowmelt followed by freezing. A recent field trip revealed that these instruments are located
on corner blocks with vertical and horizontal free rock faces that favour greater penetration of water into
the rock mass and subsequent freezing. Tiltmeter T-1 appears to show trends associated with slow creep, but the overall deformations and the noise in the data do not permit conclusive interpretation. Additional
years of data are needed to get a better understanding of the displacement style.
3.1.3
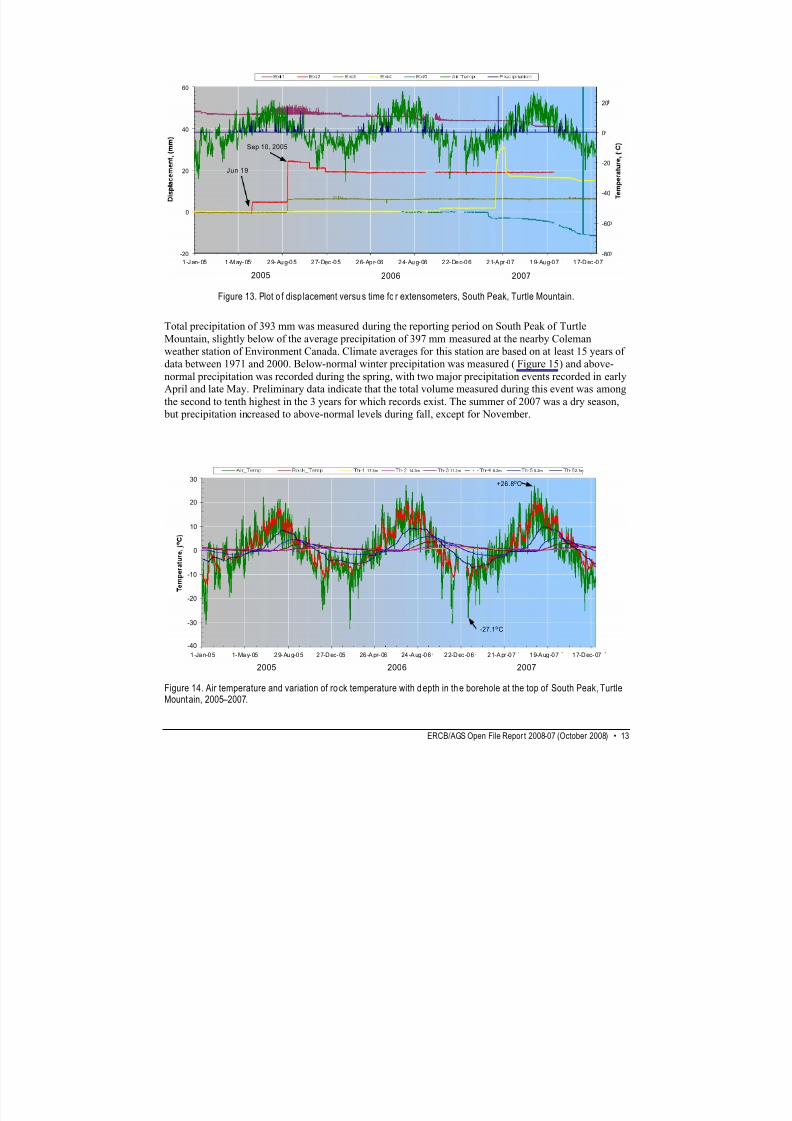
ExtensometersEach of the five extensometers shows very stable responses during the reporting period: no daily or
seasonal changes can be seen in the displacement data (Figure 13). Extensometers EX-2 and EX-3
continue to be extended at 19 and 6.17 mm, respectively. These displacements were recorded during two
periods of heavy precipitation in early June and early September of 2005. The specifics of these events
are discussed in Moreno and Froese (2006, 2007). A gradual displacement of 1.3 mm occurred at
extensometer EX-4 in November 2006. This movement is believed to have occurred as the result of a
dramatic drop of air temperature between October 29 and 30.
3.2 Other Monitoring Data
3.2.1 Climatic and Thermistor Data
Average temperatures at the top of the South Peak of Turtle Mountain in 2007 were warmer than thoserecorded in previous years, ranging from –10.4°C in January to +15.6°C in July. In addition, lower
extreme maximum (+26.8°C) and minimum (–27.1°C) temperatures were registered (Figure 14) than in
previous years. Significant daily temperature variations were also common. Rock temperature showed the
same general trend as air temperature but was more subdued (lower maximum and minimum readings),
with a time lag of about 12 hours relative to significant changes in air temperature. Seasonal temperature
fluctuations penetrate only about 15 m into the slope (Th-2) and are negligible below that depth, with
significant temperature variations measured down to a depth of 8.2 m (Th-4). On the other hand, daily
temperature variations are measurable only about 4 m into the slope (Figure 14).
ERCB/AGS Open File Repor t 2008-07 (October 2008) • 12
8/14/2019 Turtle Mountain Field Laboratory: 2007 Data and Activity Summary (OFR_2008_07)
http://slidepdf.com/reader/full/turtle-mountain-field-laboratory-2007-data-and-activity-summary-ofr200807 20/47
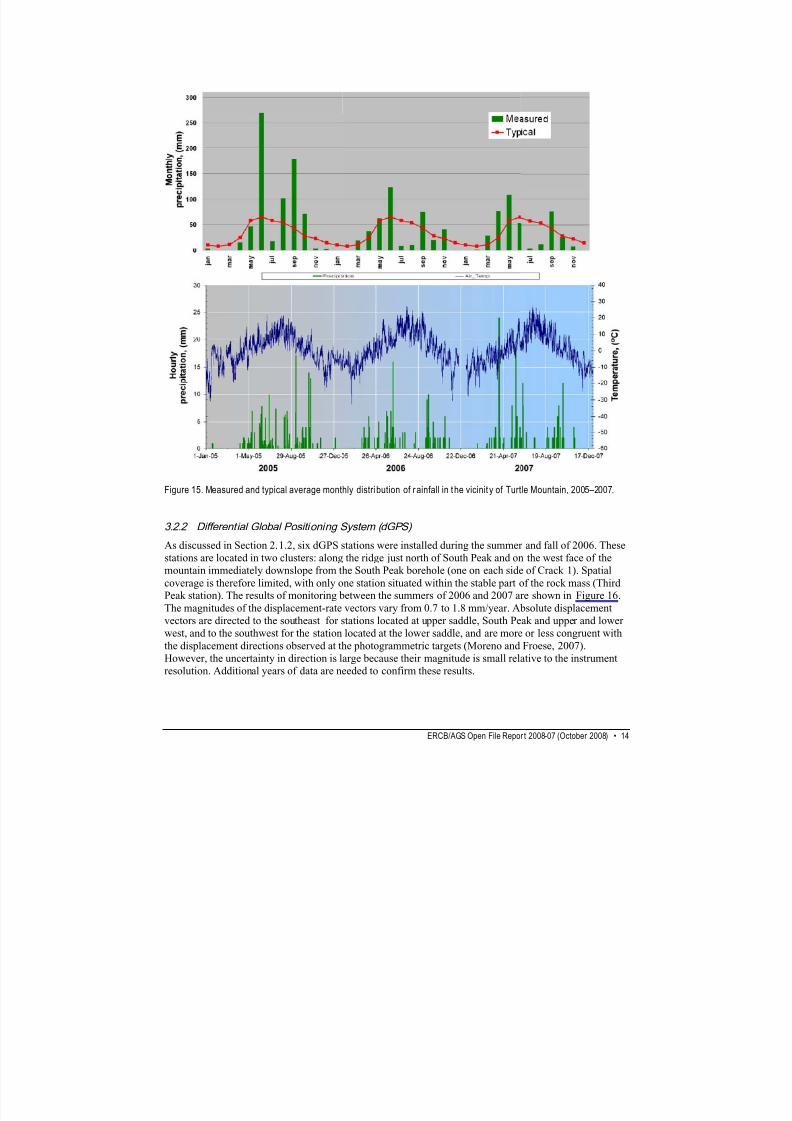
Total precipitation of 393 mm was measured during the reporting period on South Peak of Turtle
Mountain, slightly below of the average precipitation of 397 mm measured at the nearby Coleman
weather station of Environment Canada. Climate averages for this station are based on at least 15 years of
data between 1971 and 2000. Below-normal winter precipitation was measured (Figure 15) and above-
normal precipitation was recorded during the spring, with two major precipitation events recorded in earlyApril and late May. Preliminary data indicate that the total volume measured during this event was among
the second to tenth highest in the 3 years for which records exist. The summer of 2007 was a dry season,
but precipitation increased to above-normal levels during fall, except for November.
Sep 10, 2005
Jun 19
1 -J an- 05 1 -M ay- 05 2 9- Au g-0 5 2 7- Dec -0 5 2 6- Ap r- 06 2 4- Au g- 06 2 2- De c-0 6 2 1-A pr -0 7 1 9- Au g-0 7 1 7-D ec -0 7
20
0
-20
-40
-60
-80
0
20
40
60
-20
2005 2006 2007
o
Figure 13. Plot o f disp lacement versus time fo r extensometers, South Peak, Turtle Mountain.
-27.1oC
+26.8oC30
20
10
0
-10
-20
-30
-40
1 -Ja n-0 5 1- Ma y- 05 2 9- Au g-0 5 2 7-D ec- 05 26 -A pr- 06 24 -A ug -0 6 2 2-D ec -0 6 2 1-A pr -0 7 1 9-A ug -0 7 1 7-D ec- 07
2005 2006 2007
17.3m 14.3m 11.3m 8.2m 5.2m 2.1m
Figure 14. Air temperature and variation of rock temperature with depth in the borehole at the top of South Peak, TurtleMountain, 2005–2007.
ERCB/AGS Open File Repor t 2008-07 (October 2008) • 13
8/14/2019 Turtle Mountain Field Laboratory: 2007 Data and Activity Summary (OFR_2008_07)
http://slidepdf.com/reader/full/turtle-mountain-field-laboratory-2007-data-and-activity-summary-ofr200807 21/47
Figure 15. Measured and typical average monthly distri bution of rainfall in t he vicinit y of Turtle Mountain, 2005–2007.
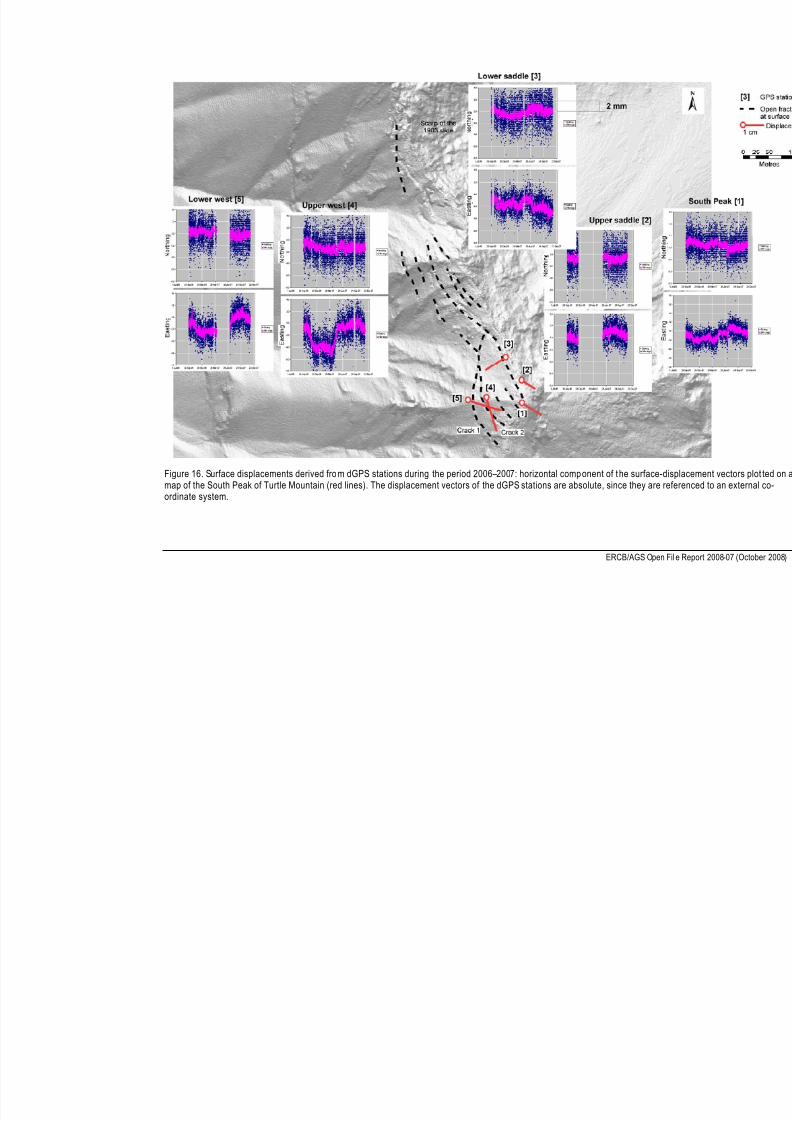
3.2.2 Differential Global Positioning System (dGPS)
As discussed in Section 2.1.2, six dGPS stations were installed during the summer and fall of 2006. These
stations are located in two clusters: along the ridge just north of South Peak and on the west face of the
mountain immediately downslope from the South Peak borehole (one on each side of Crack 1). Spatial
coverage is therefore limited, with only one station situated within the stable part of the rock mass (ThirdPeak station). The results of monitoring between the summers of 2006 and 2007 are shown in Figure 16.
The magnitudes of the displacement-rate vectors vary from 0.7 to 1.8 mm/year. Absolute displacementvectors are directed to the southeast for stations located at upper saddle, South Peak and upper and lower
west, and to the southwest for the station located at the lower saddle, and are more or less congruent with
the displacement directions observed at the photogrammetric targets (Moreno and Froese, 2007).
However, the uncertainty in direction is large because their magnitude is small relative to the instrument
resolution. Additional years of data are needed to confirm these results.
ERCB/AGS Open File Repor t 2008-07 (October 2008) • 14
8/14/2019 Turtle Mountain Field Laboratory: 2007 Data and Activity Summary (OFR_2008_07)
http://slidepdf.com/reader/full/turtle-mountain-field-laboratory-2007-data-and-activity-summary-ofr200807 22/47
Figure 16. Surface displacements derived from dGPS stations during the period 2006–2007: horizontal component of t he surface-map of the South Peak of Turtle Mountain (red lines). The displacement vectors of the dGPS stations are absolute, since they areordinate system.
ERCB/AGS Open

8/14/2019 Turtle Mountain Field Laboratory: 2007 Data and Activity Summary (OFR_2008_07)
http://slidepdf.com/reader/full/turtle-mountain-field-laboratory-2007-data-and-activity-summary-ofr200807 23/47

8/14/2019 Turtle Mountain Field Laboratory: 2007 Data and Activity Summary (OFR_2008_07)
http://slidepdf.com/reader/full/turtle-mountain-field-laboratory-2007-data-and-activity-summary-ofr200807 24/47
Figure 17. Eastern face of Turt le Mountain, showing the upper and l ower zones of Third and South peaks. These areaswere the focus of detailed struct ural mapping and kinematic analysis.
4.1 South Peak Structural Mapping
4.1.1 Previous Studies
The structure of Turtle Mountain was initially described as a monocline of Paleozoic limestone dipping to
the west at about 50° (McConnell and Brock, 1904; Daly et al., 1912). The limestone (Livingstone
Formation) was initially thought to have been thrust eastwards over subvertical Mesozoic sandstone, shale
and coal on the Turtle Mountain Thrust, located near the base of the mountain. Based on this
interpretation, the Frank Slide was believed to have occurred across bedding along east-dipping joints.
Daly et al. (1912) considered the geological structure of Turtle Mountain to be similar from south of the
slide to a point well past North Peak and recommended the relocation of the Town of Frank from its
original location to its current location north of Highway 3.
The geological model of Turtle Mountain has evolved considerably since these early investigations. The
Turtle Mountain anticline was first recognized by Leach (1904), and was reported by MacKenzie (1913).
The axis of the anticline runs approximately north-south; its trace lies on the east face of Turtle Mountain.
Subsequent models by Allan (1933), MacKay (1933) and Norris (1955) each incorporated the anticlinal
structure of the mountain, and the Turtle Mountain Thrust.
The first studies that focused on the structure of the South Peak were completed by Allan (1933). Allan’sthree reports (1931, 1932, 1933) mapped the fractures on the peak; estimated the potential volume of a
ERCB/AGS Open File Repor t 2008-07 (October 2008) • 17

8/14/2019 Turtle Mountain Field Laboratory: 2007 Data and Activity Summary (OFR_2008_07)
http://slidepdf.com/reader/full/turtle-mountain-field-laboratory-2007-data-and-activity-summary-ofr200807 25/47
second large rock avalanche, assuming the same mechanism for the Frank Slide that was generally
accepted at that time; and estimated the travel paths of two different volumes of displaced material. His
studies clearly mapped the pattern of large fractures on the peak but assumed that deformations would be
initiated to the east, on the eastern limb of the Turtle Mountain anticline.
Cruden and Krahn (1973) developed the first kinematic model of the Frank Slide in which a major portion
of the rupture surface of the slide followed bedding on the eastern flank of the anticline, and incorporatedthe subhorizontal thrust and a minor splay at the toe of the slide. The upper part of the slope opened along
joints, leaving a subvertical scarp and the prominent North and South peaks (Figure 1).
In 1986, as part of the 1980s monitoring program, Fossey (1986) undertook detailed structural mapping of
the South Peak area and identified three kinematically feasible mechanisms for slope movements at South
Peak: planar sliding along the east limb of the anticline, and both toppling and wedge failure along the
western limb of the anticline. Although Fossey (1986) identified the potential for wedge and toppling
failure, he did not complete a detailed zoning of the South Peak area and identify potential volumes
associated with each mode of deformation.
4.1.2 Upper South Peak
4.1.2.1
Kinematic Analyses
Since 2003, the acquisition of new digital-elevation-model (DEM) data has allowed the application of
emerging computing tools to aid in structural mapping on Turtle Mountain. As part of work undertaken in
2003 for the centennial of the Frank Slide, the Geological Survey of Canada provided a photogrammetric
DEM, (for which the raw data density was approximately 1 point per 2 m2. Using this DEM, Jaboyedoff
et al. (in press) employed custom-developed software (COLTOP) to assign structural orientations to each
grid and plotted these data on an equal-area stereonet to depict the fabric that controlled the morphology
of the mountain. Jaboyedoff et al. (in press) highlighted six fabric elements, including three joint sets (J1,
J2 and J3) that appeared to control the toppling of large wedges of rock in the headwall of the 1903 slide.
Jaboyedoff et al. (in press) also indicated that these structures would likely also exist in the area of South
Peak and could control the mechanism for deformation in this area.
In July 2005, an airborne light detection and ranging (LiDAR) survey was undertaken by AirborneImaging Inc. of Calgary. The AGS purchased the license for an area covering Turtle Mountain and the
Frank Slide. Raw point data were acquired at a density of approximately 1 point per m2. The new LiDAR
digital elevation model (DEM) has the advantage of sufficient data points that the first returns from
vegetation can be distinguished from ground returns and therefore allow only ground points to be used to
interpolate a model for the ground surface.
In order to create a digital elevation model (DEM) or bare earth model, a surface was interpolated fromthe triangulated irregular network (TIN) provided by the LiDAR three-dimensional point cloud. The mesh
size of the grid is 0.5 m, based on a raw point collection density of 1 point per m2. A natural neighbour
interpolation technique was used to handle the large number of input points (more than 80 000).
A simplified 3-D discrete model of the pattern of discontinuities was constructed for the South Peak ofTurtle Mountain by incorporating the major fracture sets observed. Construction of this model required
the extrapolation of the mapped fractures from the surface to depth and from the borehole wall into the
rock mass. This 3-D model assumes fully discontinuous polyhedral geometries for the rock blocks. This
assumption is an approximation; the slope has been relatively stable for the last hundred years, indicating
that rock bridges may be present on discontinuities used as boundary surfaces. As with the
photogrammetric DEM, COLTOP was used to analyze the fabric. Based on the analysis of the coloured,
shaded relief map, six discontinuity sets were identified (Figure 18). The dip and dip direction of each set
mapped are given in Table 1.
ERCB/AGS Open File Repor t 2008-07 (October 2008) • 18

8/14/2019 Turtle Mountain Field Laboratory: 2007 Data and Activity Summary (OFR_2008_07)
http://slidepdf.com/reader/full/turtle-mountain-field-laboratory-2007-data-and-activity-summary-ofr200807 26/47
Figure 18. Main discont inuity sets identified using COLTOP software and based on an interpretation of the relief atTurtle Mountain derived from an airborne LiDAR survey. The stereonet on the right (equal-area projection, lowerhemisphere) indicates the selected discont inuity o rientations J1 to J6.
These results agree well with the structural interpretation based on the photogrammetric DEM in
Jaboyedoff et al. (in press). Figure 19 provides a representation of the three main joint sets (J1, J2, J3) and
the bedding on the western limb of the anticline and their projection into the peak, to better visualize the
intersections and controls on slope deformations. As can be seen, a large wedge is bounded by J2, J3 and
bedding, while J2 also delineates potential toppling near parallel to the slope face. A schematic of theinteraction between the main mechanisms that control movement on upper South Peak is shown in
Figure 19.
When comparing the structural measurements from the DEM with recent oblique aerial photography, themain wedge and toppling zones can be observed on the South Peak area (Figure 20). On this photo, three
distinct zones of deformation can be observed on the South Peak wedge: toppling to the east, wedge
sliding to the northeast, and formation of a graben to the south and west of the wedge. The features
Table 1. Main structu ral sets at Turtl e Mountain.
Joint set Dip direction/dip angle (°)
J1 013/50
J2 060/70
J3 136/54
J4 210/39
J5 270/40
J 6 325/45
S0 323/36
ERCB/AGS Open File Repor t 2008-07 (October 2008) • 19

8/14/2019 Turtle Mountain Field Laboratory: 2007 Data and Activity Summary (OFR_2008_07)
http://slidepdf.com/reader/full/turtle-mountain-field-laboratory-2007-data-and-activity-summary-ofr200807 27/47
Figure 19. (Left) 3-D model of t he South Peak of Turtl e Mountain with the three main potential slidi ng join t sets (J2, J3, J6). (Rightpostulated kinematic modes of failure on upper South Peak, Turtle Mountain.
ERCB/AGS Open
8/14/2019 Turtle Mountain Field Laboratory: 2007 Data and Activity Summary (OFR_2008_07)
http://slidepdf.com/reader/full/turtle-mountain-field-laboratory-2007-data-and-activity-summary-ofr200807 28/47
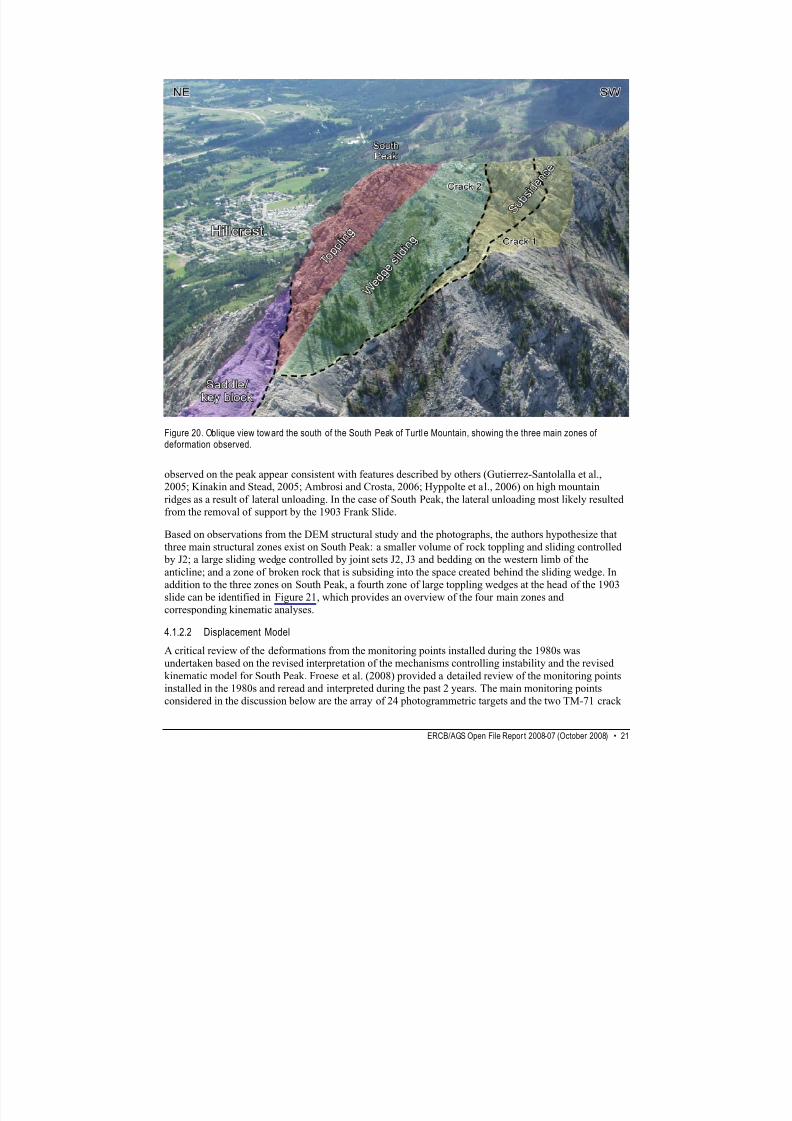
Figure 20. Oblique view toward the south of the South Peak of Turtl e Mountain, showing the three main zones ofdeformation observed.
observed on the peak appear consistent with features described by others (Gutierrez-Santolalla et al.,2005; Kinakin and Stead, 2005; Ambrosi and Crosta, 2006; Hyppolte et al., 2006) on high mountain
ridges as a result of lateral unloading. In the case of South Peak, the lateral unloading most likely resulted
from the removal of support by the 1903 Frank Slide.
Based on observations from the DEM structural study and the photographs, the authors hypothesize that
three main structural zones exist on South Peak: a smaller volume of rock toppling and sliding controlled
by J2; a large sliding wedge controlled by joint sets J2, J3 and bedding on the western limb of the
anticline; and a zone of broken rock that is subsiding into the space created behind the sliding wedge. In
addition to the three zones on South Peak, a fourth zone of large toppling wedges at the head of the 1903
slide can be identified in Figure 21, which provides an overview of the four main zones and
corresponding kinematic analyses.
4.1.2.2 Displacement Model
A critical review of the deformations from the monitoring points installed during the 1980s was
undertaken based on the revised interpretation of the mechanisms controlling instability and the revised
kinematic model for South Peak. Froese et al. (2008) provided a detailed review of the monitoring points
installed in the 1980s and reread and interpreted during the past 2 years. The main monitoring points
considered in the discussion below are the array of 24 photogrammetric targets and the two TM-71 crack
ERCB/AGS Open File Repor t 2008-07 (October 2008) • 21

8/14/2019 Turtle Mountain Field Laboratory: 2007 Data and Activity Summary (OFR_2008_07)
http://slidepdf.com/reader/full/turtle-mountain-field-laboratory-2007-data-and-activity-summary-ofr200807 29/47
Figure 21. Plan view of thr ee main deformation modes on the South Peak of Turtle Mountain. Zone 4 represents theunstable saddle area at the head of the 1903 Frank Slide.
ERCB/AGS Open File Repor t 2008-07 (October 2008) • 22

8/14/2019 Turtle Mountain Field Laboratory: 2007 Data and Activity Summary (OFR_2008_07)
http://slidepdf.com/reader/full/turtle-mountain-field-laboratory-2007-data-and-activity-summary-ofr200807 30/47
Figure 22. Photogr ammetric target layout on the South Peak of Turtle Mountain. The vector p lots represent totaldisplacement of the targets between 1982 and 2005 (displacement of Target 20 is from 1984 to 2005).
gauges. Figure 22 is a summary of the displacements observed on the photogrammetric targets on South
Peak between 1982 and 2005. Displacement results for the photogrammetric targets and the TM-71
gauges are provided in Tables 2 and 3, respectively.
The following sections discuss the deformations in the four main deformation zones shown in Figures 20 and 21.
Zone 1: Toppling/Block Sliding
The eastern portion of South Peak is characterized by linear fractures and troughs that trend
approximately parallel to the trend of the slope face. The authors hypothesize that the mechanism acting
on this area is a combination of toppling of blocks and planar sliding along stress-relief–related joints in
ERCB/AGS Open File Repor t 2008-07 (October 2008) • 23
8/14/2019 Turtle Mountain Field Laboratory: 2007 Data and Activity Summary (OFR_2008_07)
http://slidepdf.com/reader/full/turtle-mountain-field-laboratory-2007-data-and-activity-summary-ofr200807 31/47
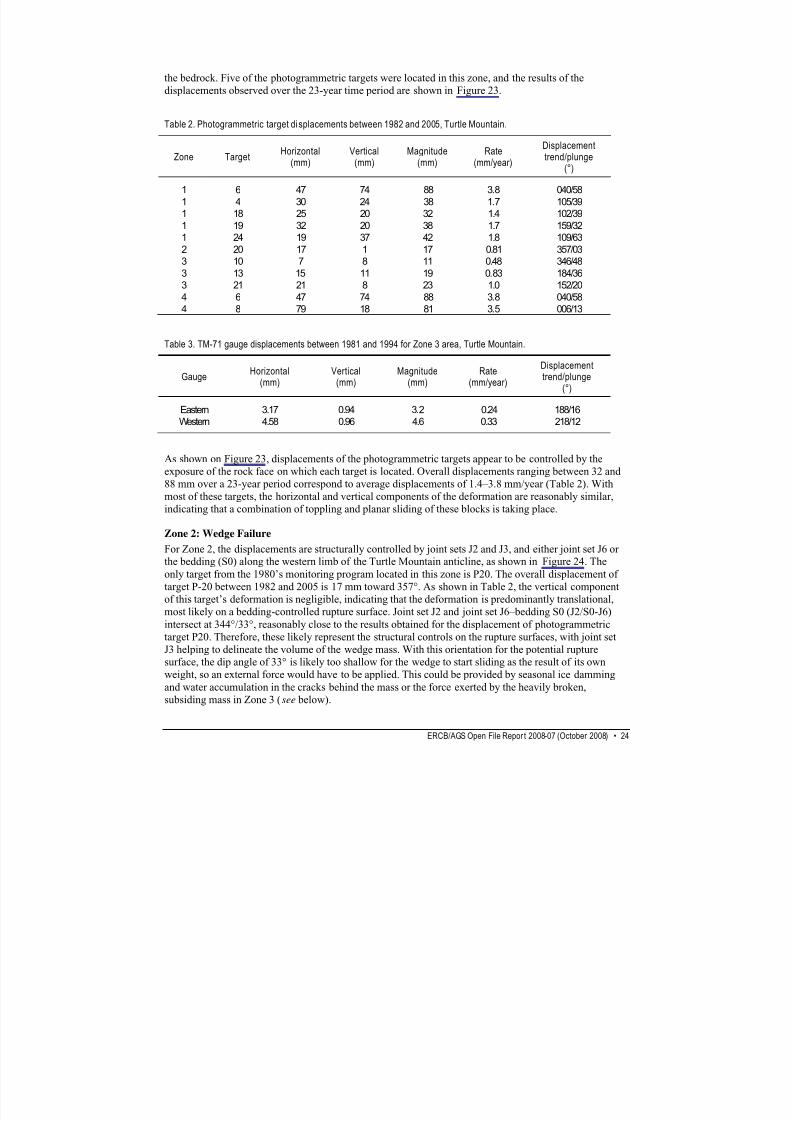
the bedrock. Five of the photogrammetric targets were located in this zone, and the results of the
displacements observed over the 23-year time period are shown in Figure 23.
Table 2. Photogrammetric target di splacements between 1982 and 2005, Turtle Mountain.
Zone Target Horizontal(mm)
Vertical(mm)
Magnitude(mm)
Rate(mm/year)
Displacementtrend/plunge
(°)
1 6 47 74 88 3.8 040/58
1 4 30 24 38 1.7 105/39
1 18 25 20 32 1.4 102/39
1 19 32 20 38 1.7 159/32
1 24 19 37 42 1.8 109/63
2 20 17 1 17 0.81 357/03
3 10 7 8 11 0.48 346/48
3 13 15 11 19 0.83 184/36
3 21 21 8 23 1.0 152/20
4 6 47 74 88 3.8 040/58
4 8 79 18 81 3.5 006/13
Table 3. TM-71 gauge displacements between 1981 and 1994 for Zone 3 area, Turtle Mountain.
GaugeHorizontal
(mm)Vertical
(mm)Magnitude
(mm)Rate
(mm/year)
Displacementtrend/plunge
(°)
Eastern 3.17 0.94 3.2 0.24 188/16
Western 4.58 0.96 4.6 0.33 218/12
As shown on Figure 23, displacements of the photogrammetric targets appear to be controlled by theexposure of the rock face on which each target is located. Overall displacements ranging between 32 and
88 mm over a 23-year period correspond to average displacements of 1.4–3.8 mm/year (Table 2). With
most of these targets, the horizontal and vertical components of the deformation are reasonably similar,
indicating that a combination of toppling and planar sliding of these blocks is taking place.
Zone 2: Wedge Failure
For Zone 2, the displacements are structurally controlled by joint sets J2 and J3, and either joint set J6 orthe bedding (S0) along the western limb of the Turtle Mountain anticline, as shown in Figure 24. The
only target from the 1980’s monitoring program located in this zone is P20. The overall displacement of
target P-20 between 1982 and 2005 is 17 mm toward 357°. As shown in Table 2, the vertical component
of this target’s deformation is negligible, indicating that the deformation is predominantly translational,
most likely on a bedding-controlled rupture surface. Joint set J2 and joint set J6–bedding S0 (J2/S0-J6)
intersect at 344°/33°, reasonably close to the results obtained for the displacement of photogrammetric
target P20. Therefore, these likely represent the structural controls on the rupture surfaces, with joint set
J3 helping to delineate the volume of the wedge mass. With this orientation for the potential rupture
surface, the dip angle of 33° is likely too shallow for the wedge to start sliding as the result of its own
weight, so an external force would have to be applied. This could be provided by seasonal ice damming
and water accumulation in the cracks behind the mass or the force exerted by the heavily broken,
subsiding mass in Zone 3 (see below).
ERCB/AGS Open File Repor t 2008-07 (October 2008) • 24

8/14/2019 Turtle Mountain Field Laboratory: 2007 Data and Activity Summary (OFR_2008_07)
http://slidepdf.com/reader/full/turtle-mountain-field-laboratory-2007-data-and-activity-summary-ofr200807 32/47
Figure 23. (Left) Close-up of zone of topplin g (Zone 1) with photogr ammetric displacements. (Right) Deformationvectors for the photogrammetric targets in this zone. Local topography and slope aspect control the movement
directions for the blocks on which the targets are situated. Note the influence of discontinuity J2 on slope morphology(black colour). Square denotes area covered by the close-up on the left.
Zone 3: Subsidence
Zone 3 is a heavily fractured zone that appears to have subsided as the result of spreading of the top of
South Peak due to the removal of lateral support to the east. The available monitoring points in this zone
are three photogrammetric targets (P10, P13, P21), the two Moiré crack motion detection gauges (TM-71
East and West in Figure 25), three EDM prisms (a, b, and c; Teskey, 2006) and the complete network of
trilateral signs (Figure 25). The results from the trilateral signs all indicate significant closure of Crack 1,
by a few millimetres. As measurement errors are of the same order, the readings are not included in this
discussion. Table 2 provides an overview of the displacements observed for the photogrammetric targets,
while Table 3 presents displacement data for the Moiré crack gauges.
There is good agreement between the displacements of photogrammetric targets P13 and P21 and those
measured by the two Moiré crack gauges (TM71 East and West). Both sets of instruments indicate
deformations that are both down and into the slope (south-southeast) and are consistent with visual
observations that this highly broken zone is subsiding into the void created by the sliding wedge that
constitutes Zone 2. In addition, the results from the readings of the EDM prisms between 1982 and 2006
indicate a decrease in crack width between targets a and c, rather than the opening that was expected
when these targets were originally installed.
ERCB/AGS Open File Repor t 2008-07 (October 2008) • 25

8/14/2019 Turtle Mountain Field Laboratory: 2007 Data and Activity Summary (OFR_2008_07)
http://slidepdf.com/reader/full/turtle-mountain-field-laboratory-2007-data-and-activity-summary-ofr200807 33/47
Figure 24. Lateral view of the postulated wedge failure zone (Zone 2). This zone is bounded by joint sets J2 (black) andJ3 (red) and, at its base, by the bedding on the western limb of the Turtle Mountain anticline.
Zone 4: Saddle/Key Block
Looking at the wedge failure mechanism for Zone 2, it is apparent that the toe of this feature is at least
partially buttressed by the zone of highly fractured material at the head of the 1903 Frank Slide in a zonethat has been referred to as the saddle between North and South peaks (Allan, 1931, Figure 2). This is the
zone that was the focus of the discussion by Jaboyedoff et al. (in press), where active rock topples and
rock falls are structurally controlled by joint sets J1, J2 and J3. Three photogrammetric targets (P6,
P8, P9) are located in this zone (Figures 21, 22). The displacements of these targets between 1983 and
2005 are provided in Table 2.
As shown in Table 2, displacements in Zone 4 have higher velocities than those observed in the other
three zones, with the vertical component increasing with proximity to the eastern face of the mountain.
ERCB/AGS Open File Repor t 2008-07 (October 2008) • 26

8/14/2019 Turtle Mountain Field Laboratory: 2007 Data and Activity Summary (OFR_2008_07)
http://slidepdf.com/reader/full/turtle-mountain-field-laboratory-2007-data-and-activity-summary-ofr200807 34/47
ERCB/AGS Open File Repor t 2008-07 (October 2008) • 27
Displacements of 81–88 mm (3.5–3.8 mm/year) were observed for these targets between 1982 and 2005.
Target P8, located approximately 60 m from the eastern face, is moving mainly by translation and P6,
within 12 m of the exposed eastern face, has a significant downward component to the movement. In this
zone, large blocks fall annually, leaving fresh debris tracks on the upper portion of the Frank Slide debris
slope.
4.1.3 Lower South Peak
The lower portion of the lower slope below South Peak is heavily fractured and obscured by rock-falldebris. This fracturing is most likely related to the presence of the anticline hinge zone. Many cracks in
the area are oriented toward the northwest, generally following the J2 joint set. The crack opening width
is variable but generally increases toward the northeast, based on manual measurements. The J1 joint set
is very persistent and its influence is clearly visible through the morphology of the slope (Figure 26).
4.1.3.1 Kinematic Analysis
A kinematic analysis was undertaken by Pedrazzini and Jaboyedoff (2008) to provide a more
representative analysis of possible failure mechanisms for the lower South Peak area. Two slope attitudes
were chosen: one in a northeasterly direction, toward the Frank Slide deposit (030°/50°), and the second
subparallel to the bedding planes that form the slope (090°/55°). The friction angle was set to 35° for the
analyses (Table 4).
The kinematic results and the field mapping show that the main potential mechanisms in the area are
directed toward the north-northeast, following planar sliding on J1 or a wedge sliding on J1^S0.1
Mechanisms in the main slope direction, particularly the wedge J2^J3, are only locally developed and
involve small unstable volumes.
1 The ^ symbol stands for ‘and’.
Figure 25. (Left) Close-up of subsidence zone (Zone 3), with locations of the three prism points (a, b, c) andphotog rammetric target P-21. (Right) Vertical airphoto showing the relative locations of t he photogrammetric t argets (P-13, P-21), the EDM prisms (a, b, c) and the Moiré crack gauges (TM71 East and West), and the deformation vectors foreach installation.

8/14/2019 Turtle Mountain Field Laboratory: 2007 Data and Activity Summary (OFR_2008_07)
http://slidepdf.com/reader/full/turtle-mountain-field-laboratory-2007-data-and-activity-summary-ofr200807 35/47
Figure 26. Influence on morphology of the joint set J1: (Left) 3-D DEM view showing extraction of joint set J1 from theCOLTOP 3-D analysis. (Right) Close-up of outcrop condit ions in the lower South Peak area; rock fractur ing along J1
jo int set ind icates possib le act ivi ty.
4.1.3.2 Structural Model for the Lower South Peak Area
Until recently, there has been no reliable deformation data available for the lower South Peak area. Based
on the results of kinematic analyses, as well as field measurements of crack orientations and the
morphology of the slope, the lower South Peak area could be divided into at least six potentially unstable
zones. The different areas appear to move towards the northeast, following the J1 joint set. Based on
visual observations of crack orientations and openings, movement appears to be more active in the upper
portion of the stacked instabilities and, in particular, in the northwestern part of the area. This is suggested
by the important rockfall activity in this area and by the fracturing along the J1 joint set.
Movement parallel to the slope direction is possible, following the wedge J2^J3, but the crack orientations
observed during the field mapping did not provide evidence of such movement. Large-scale planar sliding
on the bedding seems unlikely, as the bedding dips more steeply than the slope angle. However, in the
case of large slope movements involving the entire lower South Peak area, a flexural buckling mechanism
of the bedding cannot be excluded.
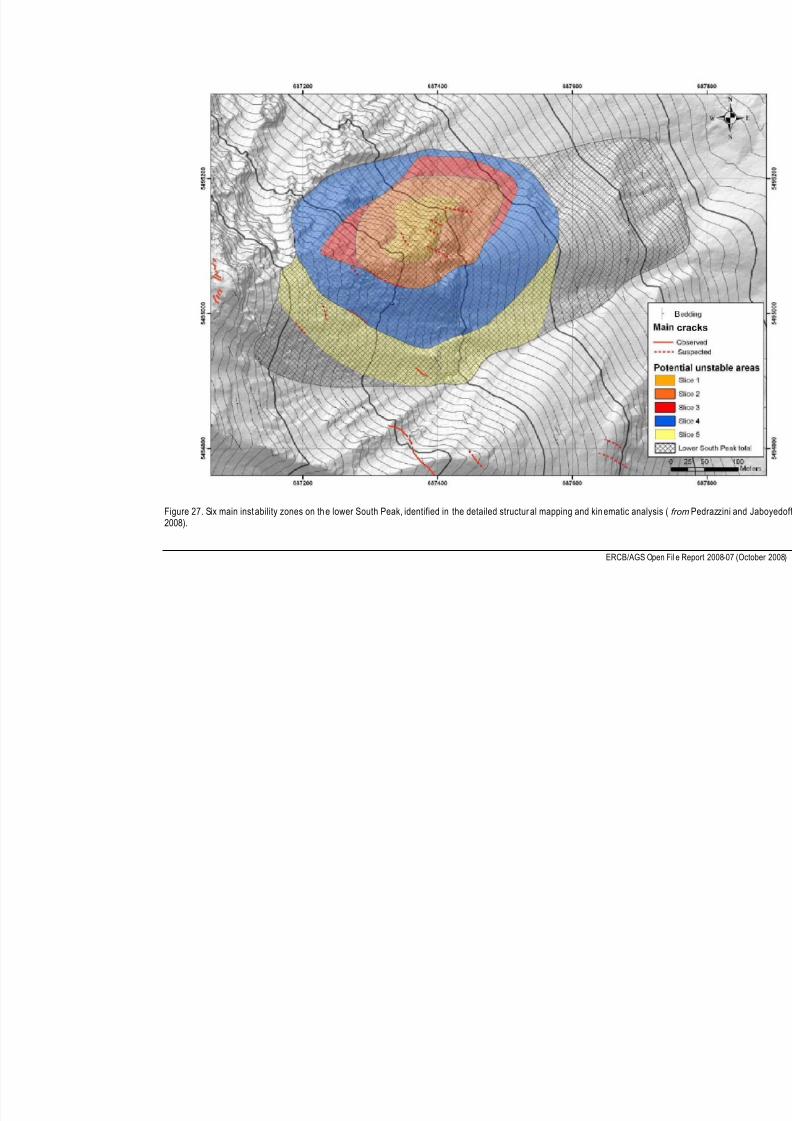
Following the failure model and the crack orientations observed during the field mapping, the lower slope
below South Peak has been divided into six zones (Figure 27). The Sloping Local Base Level (SLBL)
computation has been applied to each zone (Pedrazzini and Jaboyedoff, 2008). The best fit, according to
the geometry of the discontinuity sets, has been used for the estimation of volumes.
Table 4. Results of k inematic test perfo rmed in lower South Peak area (from Pedrazzini and Jaboyedoff, 2008).
Potential mechanism Planar sliding Wedge sliding Toppling
Slope orientation (030/50) J1 Locally J1̂ J2 (1) -
Slope orientation (95/55) Locally S0, J3 LocallyJ2̂ J3 and J1̂ S0 -
(1) The ̂ symbol stands for ‘and’.
ERCB/AGS Open File Repor t 2008-07 (October 2008) • 28
8/14/2019 Turtle Mountain Field Laboratory: 2007 Data and Activity Summary (OFR_2008_07)
http://slidepdf.com/reader/full/turtle-mountain-field-laboratory-2007-data-and-activity-summary-ofr200807 36/47
Figure 27. Six main instability zones on the lower South Peak, identified in the detailed structur al mapping and kinematic analysi2008).
ERCB/AGS Open

8/14/2019 Turtle Mountain Field Laboratory: 2007 Data and Activity Summary (OFR_2008_07)
http://slidepdf.com/reader/full/turtle-mountain-field-laboratory-2007-data-and-activity-summary-ofr200807 37/47
4.1.4 Results
Three discrete masses of rock on the lower South Peak, identified using the SLBL method, are susceptible
to planar sliding to the northeast along the J1 joint set. Their volumes have been estimated to range
between 0.065 and 0.5 million m3. According to field observations, they exhibit signs of previous and
ongoing movement. Three other, deeper, potentially unstable masses (slice 4, lower instability and total
South Peak area), ranging between 1.2 and 5.5 million m
3
,
have a more southerly direction of movement.These volumes are in agreement with previous estimations (Allan, 1933; Jaboyedoff et al., in press).
In the case of the largest of the volumes identified for the lower South Peak area (5.5 million m3), large-
scale planar sliding seems unlikely. Thus, identification of the instability limits and the relevant volume
could not be directly determined from discontinuity orientations but was based mainly on morphological
indications (i.e., shallow activity extension and irregularities in the topography).
4.2 Third Peak Structural and Kinematic Analyses
As highlighted in the 2006 annual summary (Moreno and Froese, 2008), analysis of the airborne LiDAR
bare earth model highlighted features associated with instability observed below Third Peak. In order to
better understand the possible kinematic modes of failure and the associated volumes, a detailed study
was undertaken by the University of Lausanne, Switzerland (Pedrazzini and Jaboyedoff, 2008; Pedrazziniet al., 2008). This study consisted of detailed field mapping by staff from the University of Lausanne and
the AGS, followed by detailed analysis of the LiDAR DEM to assess both the feasible kinematic
mechanisms and the associated volumes for potentially unstable areas below South and Third peaks. The
results of the analyses on South Peak were discussed in the previous section; this section discusses the
findings for the upper and lower portions of the Third Peak area of Turtle Mountain.
4.2.1 Upper Third Peak
Pedrazzini and Jaboyedoff (2008) did not highlight any significant failure volumes on the upper portion
of Third Peak. Due to the proximity to the fold hinge, kinematically feasible failure mechanisms were
limited to shallow sliding and toppling, involving only small volumes of rock. Figure 28 illustrates the
instability mechanisms in the upper Third Peak area.
4.2.2 Lower Third Peak
Detailed review of the surface morphology for the lower Third Peak area on the airborne LiDAR data
highlighted the surface indications of a large, deep–seated, rock slope movement. This, coupled with the
occurrence of at least one known large crack near the ridge seismic station justified further investigation
in the area. The field and office studies of the area by Pedrazzini and Jaboyedoff (2008) have mapped in
detail the condition, spacing and orientation of fractures and rock structure in the lower Third Peak area,
and have highlighted a number of kinematically feasible movement mechanisms and associated volumes.
Although Pedrazzini and Jaboyedoff (2008) highlighted several small zones of rock-fall potential, there
were two large areas where rock slides are considered to be kinematically feasible: a 0.85 million m3
volume and a 2.2 million m3 volume. These zones are delineated in the head region by two large cracks,
and movement is likely controlled by bedding on the western limb of the anticline. The estimated arealextent and section view of these two zones are shown in Figures 29 and 30.
There is currently no information on the rates of deformation of these masses, as the instrumentation was
installed in this area during the summer of 2007 (see Section 3.2.3). At least one new continuous dGPS
station will be added to this area in the summer of 2008.
ERCB/AGS Open File Repor t 2008-07 (October 2008) • 30

8/14/2019 Turtle Mountain Field Laboratory: 2007 Data and Activity Summary (OFR_2008_07)
http://slidepdf.com/reader/full/turtle-mountain-field-laboratory-2007-data-and-activity-summary-ofr200807 38/47
Figure 28. Schematic diagram and photos of the shallow in stability mechanism i dentified from the field and officestructural stud ies of the upper Thir d Peak area, Turtle Mountain (from Pedrazzini and Jaboyedoff, 2008).
4.3
Run-Out Studies
The identification and detailed mapping of the South Peak hazard in the 1930s by Allan (1931, 1932,
1933) represented the initial attempt to understand the extent of the area at risk from a rock avalanche
from South Peak (Figure 31). This zoning was based on an assumed volume for the South Peak
movement and empirical relationships (fall height and travel distance) that were likely derived from the
behaviour of the Frank Slide. Based on Allan’s zoning, a Notice of Danger was issued by the Government
of Alberta and provided to all residents in the danger zone.
In 2000, a report by BGC Engineering (2000) revisited Allan’s assumed failure mechanism and volume
calculation, used more recent empirical relations for rock-fall height, volume and travel distance
formulated by Hutchinson (1988), and came up with a set of revised danger zones (Figure 32). All of the
current early-warning and emergency-response planning and protocols (Froese et al., 2005; ‘Turtle
Mountain warning system: ERCB roles and responsibilities manual’, Moreno and Froese, work in progress, 2008) have utilized the zone defined by the BGC empirical upper limit.
With the refined definition of the volume for a South Peak failure, the availability of a higher resolution
DEM and improved 3-D analytical techniques (McDougall and Hungr, 2004), new predictions for the
run-out of a South Peak failure have been undertaken by O. Hungr Geotechnical Research (2007). The
modelling package DAN3D was used for the updated analyses. Two existing computer run-out models
were used to predict the run-out distance. The models were first calibrated by back-analysis of the 36million m3 1903 Frank Slide and two smaller rock avalanches in the Rocky Mountains. Forward analyses
ERCB/AGS Open File Repor t 2008-07 (October 2008) • 31

8/14/2019 Turtle Mountain Field Laboratory: 2007 Data and Activity Summary (OFR_2008_07)
http://slidepdf.com/reader/full/turtle-mountain-field-laboratory-2007-data-and-activity-summary-ofr200807 39/47
Figure 29. Plan view of mapped structural f eatures and postulated unstable volumes, including a deep-seatedgravitational surface (DSGS, lower Third Peak, Turtle Mountain from Pedrazzini and Jaboyedoff, 2008).
ERCB/AGS Open File Repor t 2008-07 (October 2008) • 32

8/14/2019 Turtle Mountain Field Laboratory: 2007 Data and Activity Summary (OFR_2008_07)
http://slidepdf.com/reader/full/turtle-mountain-field-laboratory-2007-data-and-activity-summary-ofr200807 40/47
Figure 30. Cross-section of the two main unstable volumes identi fied on the lower Third Peak (from Pedrazzini andJaboyedoff, 2008). Abbreviations: DEM, digit al elevation model; DSGS, deep-seated gravitational sur face; M, million.
were then completed for a potential rock slide from South Peak, a planar slide with a volume of 6.7
million m3.
Based on the updated sensitivity analysis for a volume of rock of up to 6 million m3, a number of different
scenarios for the bounds of potential run-out were identified and are shown on Figure 33. When comparedto the previous studies by Allan (1933) and BGC Engineering (2000), the run-out limits are similar and
do not justify revision of emergency-response planning boundaries.
As future work is done to refine the movement mechanisms and volumes on the areas below South Peak
and Third Peak, any resulting revision of the run-out estimates will be reported.
4.4 New Monitor ing Studies
As discussed in Section 4, field and office studies have highlighted other potentially unstable areas on the
eastern face of Turtle Mountain. In order to characterize the potential zones of movement, an overlapping
array of complementary monitoring techniques was proposed that used different principles to monitor
movement and provide redundancy. The set of EDM prisms (Section 3.2.3) was integrated into the sensor
network in the summer of 2007 and monitoring was initiated by the Precise Engineering and DeformationSurveys (PEDS) Group in the Department of Geomatics Engineering at the University of Calgary, as both
a complementary monitoring technique and a Ph.D. research project.
4.4.1 Periodic GPS system
The aim of this project was to set up a series of monitoring points that would be used to collect
differential global positioning system (dGPS) readings at least biannually, in order to detect and
characterize displacements at these monitoring points. Although the initial focus of the monitoring was on
ERCB/AGS Open File Repor t 2008-07 (October 2008) • 33
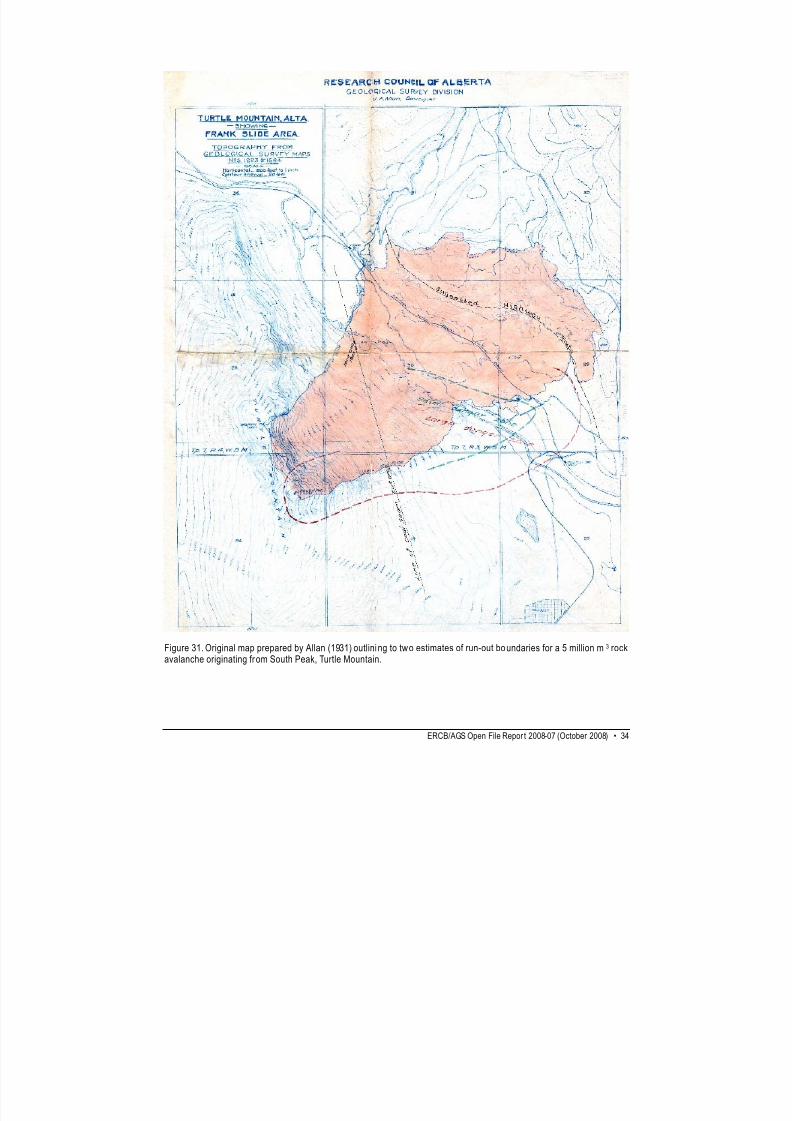
8/14/2019 Turtle Mountain Field Laboratory: 2007 Data and Activity Summary (OFR_2008_07)
http://slidepdf.com/reader/full/turtle-mountain-field-laboratory-2007-data-and-activity-summary-ofr200807 41/47
Figure 31. Original map prepared by Allan (1931) outlini ng to two estimates of run-out boundaries for a 5 million m 3 rockavalanche originating from South Peak, Turtle Mountain.
ERCB/AGS Open File Repor t 2008-07 (October 2008) • 34

8/14/2019 Turtle Mountain Field Laboratory: 2007 Data and Activity Summary (OFR_2008_07)
http://slidepdf.com/reader/full/turtle-mountain-field-laboratory-2007-data-and-activity-summary-ofr200807 42/47
the eastern face of the mountain (below Third and South peaks), monitoring points also covered areas to
the south that are assumed to be stable and very unstable, active areas on the Saddle zone, between South
and North peaks. Figure 34 provides the locations of the monitoring points.
Fifteen structural steel target points were designed, fabricated and installed on Turtle Mountain in May
2007 by PEDS. Each of the points was first observed in June 2007 to provide the baseline set of readings,
and a second set of readings was taken in late September and early October 2007. A typical 10 cm x10 cm (4 inch x 4 inch) structural steel target point is shown in Figure 35. Points were observed using
both reflectorless total station (RTS) and differential GPS (dGPS) from a base station located in the valley
bottom northeast of Turtle Mountain.
As expected, no significant movements were observed during the June to October 2007 time frame.
Possible movements were observed on targets 6 and 13, but further readings in the summer and fall of
2008 will be required to confirm these trends. It is expected that, for most of the movements on the east
face, many years of observation will be required to gain confidence in movement rates and patterns. It is
expected that trends will become clear in a shorter time frame in the Saddle zone, due the high relative
activity in this area.
Figure 32. BGC Engineering (2000) empirical upper limit boundary (RED) in relation to the large danger zone (GREEN)identified by Allan (1931) for a rock avalanche originating from South Peak, Turtle Mountain.
ERCB/AGS Open File Repor t 2008-07 (October 2008) • 35

8/14/2019 Turtle Mountain Field Laboratory: 2007 Data and Activity Summary (OFR_2008_07)
http://slidepdf.com/reader/full/turtle-mountain-field-laboratory-2007-data-and-activity-summary-ofr200807 43/47
Figure 33. Results of the sensitivit y analysis undertaken by O. Hungr Geotechnical Research (2007), showing variousscenarios for run-out boundaries for a 6 million m 3 rock avalanche origi nating from South Peak, Turtle Mountain.Results were obtained usi ng a dynamic analysis software application called DAN3D (O. Hungr Geotechnical Research,2007) Legend: red, most likely prediction; purple, alternative prediction; yellow, extreme run-out prediction; turquoise,piecemeal detachment predicti on.
5
Summary and Conclusions
A clearer picture of deformations on the South Peak of Turtle Mountain is now possible by combining
observations from newly available remote-sensing data and digital air photos with an updated set of
readings from monitoring points installed in the 1980s. Rather than simply deformation of the entire
wedge of South Peak to the east, it is now known that there are at least three kinematic modes of
ERCB/AGS Open File Repor t 2008-07 (October 2008) • 36

8/14/2019 Turtle Mountain Field Laboratory: 2007 Data and Activity Summary (OFR_2008_07)
http://slidepdf.com/reader/full/turtle-mountain-field-laboratory-2007-data-and-activity-summary-ofr200807 44/47
deformation — toppling, wedge sliding and subsidence — acting on South Peak at rates ranging from
0.24 to 3.8 mm/year.
These observations have significant impact on the modern monitoring and risk management of South
Peak. Firstly, this study provides a baseline for understanding the near-real-time data that have been
collected since 2003 from more than forty sensors installed on the peak. Secondly, assumptions regarding
the volume of the moving rock and the approach to monitoring and warning now need to be re-evaluated.Previous monitoring had assumed that monitoring the fractures on the western side of South Peak would
provide warning of movement of the South Peak mass (~0.5 million m3) and the slope below
Figure 34. Locations of the 15 periodic dGPS monitoring points i nstalled in the summer of 2007 by the University o fCalgary Geomatics Engineering Group.
ERCB/AGS Open File Repor t 2008-07 (October 2008) • 37

8/14/2019 Turtle Mountain Field Laboratory: 2007 Data and Activity Summary (OFR_2008_07)
http://slidepdf.com/reader/full/turtle-mountain-field-laboratory-2007-data-and-activity-summary-ofr200807 45/47
(~4.5 million m3). The findings summarized above indicate that historical monitoring would not provide a
warning for the larger lower slope movement. Expanded monitoring and characterization of the lower
slope is therefore required to provide a more realistic indication of the risk to the developments and
infrastructure below this portion of Turtle Mountain.
Figure 35. Typical periodi c GPS point installation on Turtle Mountain.
ERCB/AGS Open File Repor t 2008-07 (October 2008) • 38

8/14/2019 Turtle Mountain Field Laboratory: 2007 Data and Activity Summary (OFR_2008_07)
http://slidepdf.com/reader/full/turtle-mountain-field-laboratory-2007-data-and-activity-summary-ofr200807 46/47
6
References
Airborne Imaging Inc. (2006): LiDAR report on Turtle Mountain; unpublished report prepared for
Alberta Geological Survey, 16 p.
Allan, J.A. (1931): Report on the stability of Turtle Mountain, Crowsnest District, Alberta; Alberta
Department of Public Works, 14 p.
Allan, J.A. (1932): Second report on the stability of Turtle Mountain, Crowsnest District, Alberta; Alberta
Department of Public Works, Alberta Provincial Archives, 25 p.
Allan, J.A. (1933): Report on stability of Turtle Mountain, Alberta and survey of fissures between North
Peak and South Peak; Alberta Department of Public Works, Alberta Provincial Archives, 28 p.
Ambrosi, C. and Crosta, G.B. (2006): Large sackung along major tectonic features in the central Italian
Alps; Engineering Geology, v. 83, p. 183–200.
BGC Engineering Inc. (2000): Geotechnical hazard assessment of the south flank of Frank Slide,
Hillcrest, Alberta; unpublished report for Alberta Environment, Contract No. 00-0153, 29 p.
Cruden, D.M. and Krahn, J. (1973): A re-examination of the geology of the Frank Slide; Canadian
Geotechnical Journal, v. 10, p. 581–591.Daly, R.A., Miller, W.G. and Rice, G.S. (1912): Report of the commission appointed to investigate Turtle
Mountain, Frank, Alberta; Geological Survey of Canada, Memoir 27, 34 p.
Fossey, K.W. (1986): Structural geology and slope stability of the southeast slopes of Turtle Mountain,
Alberta; M.Sc. thesis, University of Alberta, 113 p.
Froese, C., Moreno, F, Jaboyedoff, M. and Cruden, D. (in press): 25 years of movement monitoring on
the South Peak of Turtle Mountain (Alberta, Canada): an understanding of the hazard; Canadian
Geotechnical Journal.
Froese, C.R., Murray, C., Cavers, D.S., Anderson, W.S., Bidwell, A.K., Read R., Cruden, D.M. and
Langenberg, W. (2005): Development of a warning system for the South Peak of Turtle Mountain; in
Landslide Risk Management, O. Hungr, R. Fell, R.R. Couture and E. Eberhardt (ed.), A.A. Balkema,Leiden, Netherlands, p. 705–712.
Gutierrez-Santolalla, F., Acosta, E., Rios, S., Geurrero, J. and Lucha, P. (2005): Geomorphology and
geochronology of sackung features (uphill-facing scarps) in the central Spanish Pyrenees;
Geomorphology, v. 69, p. 298–314.
Hutchinson, J.N. (1988): General report: morphological and geotechnical parameters of landslides in
relation to geology and hydrogeology; in Proceedings of the 5th International Symposium on
Landslides, A.A. Balkema, Leiden, Netherlands, v. 1, p. 3–35.
Hyppolte, J-C., Brocard, G., Tardy, M., Nicoud, G., Courles, D., Braucher, R., Menard, G. and Souffache,
B. (2006): The recent fault scarps of the western Alps (France): tectonic surface ruptures or
gravitational sackung scarps? A combined mapping, geomorphic, levelling and 10Be dating
approach; Tectonophysics, v. 418, no. 3–4, p. 255–276, doi:10.1016/j.tecto.2006.02.009.
Jaboyedoff, M., Couture, R. and Locat, P. (in press): Structural analysis of Turtle Mountain (Alberta)
using digital elevation model: toward a progressive failure; Geomorphology.
Kinakin, D. and Stead, D. (2005): Analysis of the distributions of stress in natural ridge forms:
implications for the deformations mechanisms of rock slopes and the formation of sackung;
Geomorphology, v. 65, p. 85–100.
ERCB/AGS Open File Repor t 2008-07 (October 2008) • 39

8/14/2019 Turtle Mountain Field Laboratory: 2007 Data and Activity Summary (OFR_2008_07)
http://slidepdf.com/reader/full/turtle-mountain-field-laboratory-2007-data-and-activity-summary-ofr200807 47/47
Leach, W.W. (1904): The Blairmore-Frank coal-fields; Geological Survey of Canada, Summary Report,
1902–1903, p. 169–185
MacKay, R.B. (1933): Geology and coal deposits of Crowsnest Pass area, Alberta; Geological Survey ofCanada, Summary Report, 1932, Part B, p. 21–68.
MacKenzie, J.D. (1913): South Fork coal area, Oldman River, Alberta; Geological Survey of Canada,
Summary Report, 1912, p. 235–246.
McConnell, R.G. and Brock, R.W. (1904): Report on the great landslide at Frank, Alberta, Canada;
Canada Department of the Interior, Annual Report, 1902–1903, Part 8, 17 p.
McDougall, S. and Hungr, O. (2004): A model for the analysis of rapid landslide motion across three-dimensional terrain; Canadian Geotechnical Journal, v. 41, p. 1084–1097.
McElhanney Consulting Services Ltd. (2006): Turtle Mountain real-time monitoring project, September
2006 installation summary; unpublished report prepared for Alberta Geological Survey, 12 p.
Moreno F. and Froese C. (2006): Turtle Mountain Field Laboratory monitoring and research summary
report, 2005; Alberta Energy and Utilities Board, EUB/AGS Earth Sciences Report 2006-07, 94 p.
Moreno, F. and Froese, C.R. (2007): Turtle Mountain Field Laboratory (TMFL): Part 2 – review of
trends, 2005 to 2006; 1st North American Landslide Conference, Vail, Colorado.
Moreno, F. and Froese, C. (2008): Turtle Mountain Field Laboratory: 2006 data and activity summary;
Energy Resources Conservation Board, ERCB/AGS Open File Report 2008-01, 29 p.
Norris, D.K. (1955): Blairmore, Alberta; Geological Survey of Canada, Paper 55-18, 1 map at 63 360scale.
O. Hungr Geotechnical Research (2007): South Peak of Turtle Mountain, Frank, Alberta: runout analyses
of potential landslides; unpublished report prepared for Alberta Geological Survey, 13 p.
Pedrazzini, A. and Jaboyedoff, M. (2008): Turtle Mountain stability analysis project: morpho-structural
analysis and estimation of potential unstable volumes; University of Lausanne (Switzerland),
Institute of Geomatics and Risk Analysis, unpublished report prepared for Alberta Geological
Survey, 38 p.
Pedrazzini, A., Jaboyedoff, M., Froese, C.R., Langenberg W. and Moreno, F. (2008): Structure and
failure mechanisms analysis of Turtle Mountain; in Proceedings of the 4th Canadian Conference on
Geohazards: From Causes to Management, J. Locat, D. Perret, D. Turmel, D. Demers and S.
Leroueil (ed.), Presses de l’Université Laval, Québec, 594 p.
Teskey, W. (2006): Analysis of 1982 and 2006 EDM measurements on Turtle Mountain; unpublished
report prepared for Alberta Geological Survey, 10 p.
Watson, A.D., Moore, D.P. and Stewart, T.W. (2004): Temperature influence on rock slope movements at
Checkerboard Creek; in Landslides: Evaluation and Stabilization, W. Lacerda, M. Ehrlich, F.A.B.
Fontoura and A.S.F. Sayao (ed.), Proceedings of the 9th International Landslide Symposium, Rio de
Janeiro, Brazil, v. 2, p. 1293–1298.