Embed Size (px)
Citation preview

Wealth Management Advisory
Turning up the heat
2018 Outlook(In-brief)

Outlook 2018 / 1
Welcome to 2018 Outlook
2017 surprised on the upside and was a great year for investors. Global equities rallied over 20%, while commodities, bonds and alternative strategies also generated positive returns.
Our recommended gradual pivot towards more growth areas of the equity market – away from high dividend yielding equities and corporate bonds – paid off. As an example, our Asia-focused tactical asset allocation model for a moderate risk investor rose 14.2% since our Outlook 2017 publication, signi�cantly outperforming its strategic benchmark*. Meanwhile, our preferred multi-asset income allocation still rose a very healthy 11.4% over the same period. Of course, not all our views worked as we expected, but even where our relative preferences did not play out, they generally delivered positive returns for investors (see page 98 for a more detailed analysis of the performance of our views).
So, what about the outlook for 2018? Investors are understandably concerned about high valuations in both equity and bond markets, including corporate bonds.
In the Goldilocks (“not too hot, not too cold”) economic environment we have been experiencing, where global growth has become more synchronised, in�ation pressures are still muted and central banks have remained accommodative, one can �nd solid arguments to justify the high levels of valuation. However, we are cognisant that such an environment cannot go on forever.
In 2017, we predicted a pivot to a more re�ationary outcome combining stronger economic growth with rising in�ation. Growth accelerated in 2017, but in�ation did not. We believe this process is still under way and that a gradual ‘heating up’ of the global economy is likely in 2018.
Global growth is expected to remain relatively strong, weakening somewhat in China, but accelerating in the US and in Emerging Markets excluding China. Meanwhile, rising commodity prices and declining slack in the global economy, whether it be in labour markets or product markets, are likely to be tailwinds for in�ation.
Rising in�ation is likely to put upward pressure on interest rates and bond yields. Our core scenario is this happens gradually, but even then, it will be increasingly dif�cult for investors relying predominantly on bonds to generate the level of total returns witnessed in the recent past, even on a leveraged basis, as rising yields will lead to lower prices.
Against this backdrop of waning support for income assets, we have two overarching suggestions for investors. First, we believe investors should continue pivoting towards pro-growth areas of the markets as we recommended in 2017. Despite elevated valuations, we believe equity markets will continue to do well. Still-strong growth and relatively modest increase in in�ation are likely to support global corporate earnings growth of 10% in 2018.
Second, as we move even more clearly into the late stage of the global economic cycle, we believe it is time to start thinking about protecting against sharp drawdowns once the cycle turns. Our central scenario is that a recession is unlikely in 2018 given signi�cant excess capacity in many major economies (eg. southern Europe, China, India, Brazil and Russia) and very well-anchored in�ation expectations after years of low in�ation. However, we are also cognisant that predicting recessions is incredibly dif�cult and, by the time a recession becomes apparent, the damage to investment portfolios is already severe.
Against this backdrop, in addition to pivoting to pro-growth assets, we would consider increasing, as the year progresses, our allocation to less volatile, less correlated and relative investment strategies. In particular, a diversi�ed allocation to alternative strategies can help improve the risk-reward pro�le of investment allocations over the long run and can be particularly valuable in times of stress. For now, given our constructive view on global equities, we would continue to have a tilt to Equity Hedge strategies, but this should not be at the expense of a more diversi�ed approach, including Global Macro strategies, which can offer insurance-like characteristics in times of severe risk-off environments.
Alexis Calla
Global Head Investment Advisory and Strategy &Chief Investment Of�cer
*Views taken from the Outlook 2017 publication, updated in the Global Market Outlook publication through the year. The benchmark used is our Strategic Asset Allocation model as updated in February 2017.
2017 proved to be a very positive year for �nancial markets against a Goldilocks (ie. not too hot, not too cold) economic backdrop. The strong performance of equities and corporate bonds was led by earnings growth across major regions, range-bound government bond yields and rising valuations. The fact that in�ation in the US and Euro area has remained contained meant that worries over excessive monetary policy tightening and a turn in direction towards unwinding monetary stimulus failed to derail markets. Emerging Market assets fared very well amid this environment of optimism, especially as the US Dollar softened.
Recent strong economic data suggests this “Goldilocks” environment can spill over at least into the start of 2018. Having said that, we are cognizant that Goldilocks environments cannot carry on forever. Our Group Investment Committee continues to
2 / Outlook 2018
be of the view that we are at a fairly late stage in the business cycle, with the US further along than the Euro area or Asia ex-Japan. The historical perspective that equities tend to see some of the strongest gains in the �nal stages of the business cycle is one key factor behind our preference for equity markets. This largely holds true for other pro-cyclical assets like corporate bonds as well.
However, it is extremely dif�cult to time the end of the cycle. The fact that US equities and high yield bond markets have historically peaked six to nine months ahead of a US recession makes the investment decision even harder. Therefore, we believe there is value in starting the year continuing to favour equities, while also starting to think about managing downside risks by allocating to alternative strategies which have lower drawdown risks and correlations with traditional asset classes.
Turning up the heat Steve Brice | Manpreet Gill
• Economic growth continues to simmer: The “Goldilocks” environment (ie.not too hot, not too cold) of strong growth and limited in�ation is likely to extendinto the early part of 2018. Continued earnings growth means equities andcorporate bonds have room to extend gains going into 2018, in our view.
• Turning up the heat on in�ation: In�ation is the main risk to this “Goldilocks”scenario, especially further into 2018. A larger-than-expected rise in in�ationwould mean the environment could turn too hot, forcing central banks to slamon the brakes.
• Investment implications: Our view is that we are at a mature stage in the USbusiness cycle. Equities tend to do very well late in the cycle, a trend whichis behind our preference for equities. Our view that the US Dollar will weakenmodestly supports our preference for bonds in Emerging Markets – speci�callyUSD sovereign and Asia corporate bonds. However, we believe there is valuein staying nimble as we go through 2018. An allocation towards AlternativeStrategies is likely to help maintain exposure to our preferred asset classes whilestarting to contain potential downside risks, in our view.

Outlook 2018 / 3
Business cycle
Late stage business cycle• Equities tend to outperform in the late cycle.
Valuations not yet a constraint
• US economy likely at a later stage thanthe Euro area or Asia ex-Japan
• However, need to stay nimble as we couldreach a turning point in 2018
Policy shifts• QE withdrawal, higher US and potentially
Euro area interest rates could pose a headwind
• Magnitude of China deleveraging effortskey to its market impact
• US �scal stimulus could offera positive offset
In�ation• Modest, continued re�ation likely to
extend Goldilocks environment near term
• Faster-than-expected in�ationcreates risk of accelerated monetary
policy tightening
External risks• Number of geopolitical �ashpoints exist
(Korea, Middle-East)
• Trade policy an ongoing risk

4 / Outlook 2018
Investment implications and key themes
EQUITIES
Equities our preferred asset class
Key themes
• Asia ex-Japan equities to outperform global equities
• Euro area equities to outperform global equities
• South Korea equities to outperform Asia ex-Japan equities
• China equities to outperform Asia ex-Japan equities
Our preference for equities stems from two sources. First, equity valuations still offer room for gains; while they are undoubtedly above long-term averages in most regions, historically they have, on average, delivered positive returns from similar levels in the past. Second, earnings growth remains reasonably strong, driven in many regions by margin expansion, offering grounds for further gains beyond just higher valuations.
Asia ex-Japan is one of our preferred regions, supported by both margin expansion as well as valuations that remain inexpensive relative to Developed Markets. See the equities section for more details on our country preferences within the region.
The Euro area is also a preferred equity region. Strong domestic consumption and the likelihood of greater investment spending favour continued earnings growth. Italian elections pose a political risk, but we believe these will remain well-contained and short-lived.
BONDS
We see bonds as a core holding
Key themes
• Emerging Market (EM) USD government bonds to outperform global bonds
• Asia USD corporate bonds to outperform global bonds
We have a preference for Emerging Markets within bonds as we believe they offer an attractive balance between yield and quality at this time.
Within this, we prefer Emerging Market USD government bonds given our view that the asset class offers a combination of a reasonably attractive yield (at c.5%) sourced from a mix of both investment grade and high yield sovereigns. While a high sensitivity to rising US Treasury yields is a risk, our view that the 10-year Treasury yield will remain centred around 2.50%, together with the relatively higher yield buffer on offer, is positive.
We also prefer Asia USD corporate bonds, though we have a strong preference for investment grade over high yield within this. One of the most remarkable characteristics of this bond asset class has been the low volatility relative to Developed Market bonds, which we believe is likely to be valuable late in the economic cycle and/or if volatility broadly rises unexpectedly. Accelerated Chinese deleveraging is a risk, though we believe this is likely to be a greater risk for HY bonds rather than IG.

Outlook 2018 / 5
MULTI-ASSET AND ALTERNATIVE STRATEGIES
Diversification via Multi-Asset and Alternative StrategiesKey themes
• Multi-asset balanced strategies to outperform multi-asset income strategies
• Equity Hedge strategies to outperform other alternative strategies
The high likelihood of further equity market gains late in the economic cycle is a significant factor behind our preference for multi-asset balanced strategies. The higher presence of growth assets relative to an income strategy should be the main source of this outperformance, in our view.
Having said that, we still believe multi-asset income strategies are likely to deliver positive absolute returns given our view that, short of a major inflation surprise, any rise in yields should remain contained.
Meanwhile, we believe alternative strategies offer attractive exposure given the difficulty in timing the market peak towards the end of the economic cycle. Equity Hedge strategies offer room to obtain equity and bond market exposure, albeit giving up some upside in return for more contained downside. At the other extreme, macro strategies continue to offer what we believe to be insurance-like characteristics, should the cycle turn sooner than we expect.
CURRENCIES
Modest USD weakness to drive FX markets
Key themes
• US Dollar to weaken modestly
• EM currencies to gain against the USD
• EUR, KRW to strengthen against the USD
• JPY to weaken against the USD
We believe the USD is likely to continue to weaken modestly in 2018, short-term reversals notwithstanding. A greater room for monetary policy surprises in Europe is largely responsible for this view given further Fed rate hikes are unlikely to dramatically surprise the market, while the start of European Central Bank (ECB) rate hikes would likely be a surprise.
The context of this US Dollar view means that we expect the EUR to extend gains, especially if the ECB remains on the path of gradually removing monetary policy accommodation. The JPY, though, is unlikely to benefit from this support given what appears to be a continued lack of domestic inflation.
A softer US Dollar is also likely to be beneficial for the broad Emerging Market currency universe. Within this, though, we believe the KRW is likely to be one of the biggest beneficiaries as the Korean economy benefits from continued improvement in US growth via exports.
Key asset class views
Equities Bonds Commodities Alternative Strategies Cash
US Govt DM IG Energy Equity Hedge
Euro area Govt EM USD Precious Relative Value EUR
UK Govt EM LCY Base Event Driven KRW
Japan Corp DM IG Global Macro JPY
Asia ex-JP Corp DM HY
Other EM Corp Asia USD Preferred | Less preferred | Core holding
FX

Macro overviewAt a glanceRajat Bhattacharya
Global growth is expected to accelerate in 2018 for the second straight year, led by the US and Latin America, while China, Japan and the Euro area stabilise after a strong pick-up in 2017. We expect the ongoing synchronised economic expansion across regions to continue, on the back of still-easy �nancial conditions and robust consumer and business con�dence.
We expect a modest upturn in core in�ation worldwide, especially in the US, as tightening labour markets fuel wage pressures and spare productive capacity narrows.
Monetary policy outlook is turning less accommodative. We expect the Fed and some Asian central banks to raise rates at a gradual pace over the coming year. However, in�ation-adjusted policy rates are likely to remain negative in major economies, including the Euro area and Japan.
The key risk scenarios, we believe, are two-fold: 1. In�ationary downside, or a sharp upturn in in�ation, eventually leading to tighter monetary policies and a growth downturn (15% probability). 2. Return to de�ation, likely caused by a hard-landing in China or a too-early/too-fast pace of Fed rate hikes (10% probability).
Region Growth In�ation BenchmarkRates
FiscalDe�cit
Comments
USGrowth to accelerate for second year. Fed to stick to gradual rate hikes under Powell amid muted in�ation. Risk of overheating from tax cut
Euro AreaSynchronised expansion to continue. In�ation to remain tepid amid slack in southern Europe. ECB to withdraw stimulus, but rate hikes unlikely
UKBrexit uncertainty remains key risk. Purchasing power further hit by rising in�ation, slowing wages. BoE likely guided by Brexit talk outcome
JapanAbe’s re-election positive for stimulus, growth. BoJ to maintain easy monetary policy as in�ation remains well below target, despite recent uptick
Asia ex-JapanPresident Xi to focus on quality of growth, while ensuring �nancial stability. India’s growth to recover. South Korea expected to hike rates
Emerging Markets ex-Asia
Brazil and Russia rate cutting cycle coming to a close as in�ation rebounds. Mexico to cut rates
Source: Standard Chartered Global Investment CommitteeLegend: Supportive of risk assets | Neutral | Not supportive of risk assets
Key themes
Key drivers
Key chart
Figure 1
Monetary policy is likely to tighten gradually worldwide; this is likely to be offset by less stringent �scal policies
-120 -20 80
USEuro areaChinaJapanUKIndiaCanadaSouth KoreaAustraliaRussiaMexico
bps
-1.5-1.0-0.50.00.51.0
Euro
are
a(2
011-
13)
US(2
011-
14)
UK(2
010-
11)
Japa
n(2
014-
15)
GDP
wei
ghte
dav
erag
e
Euro
are
a
US UK
Japa
nAnnu
al a
vera
ge (p
p) Projected easing in 2017-18
GDP
wei
ghte
dav
erag
eSource: Bloomberg, Fitch Ratings, Standard Chartered
6 / Outlook 2018

Outlook 2018 / 7
Multi-assetAt a glanceAditya Monappa, CFA | Audrey Goh, CFA | Trang Nguyen
Broadening growth coupled with rising in�ation solidify the pivot towards re�ation in our scenario-based outlook, in our view. In 2018, we continue to prefer a growth-tilted allocation and expect it to outperform a multi-asset income strategy focused on yielding assets.
A multi-asset income allocation, while underperforming its growth-tilted counterpart, should deliver a positive return alongside a yield in the 4-5% range. However, expensive income assets suggest yields are likely to be at the lower end of this range.
Despite increasing con�dence in Emerging Market assets, we prefer a globally diversi�ed multi-asset income allocation versus one purely focused on EM assets, which has potentially much higher risk. We do, however, suggest a large (~40%) allocation to EM within a global allocation.
For investors focused on leveraged strategies to generate yield, returns in 2018 are unlikely to match the strong 2017 performance as borrowing costs rise amidst still compressed longer term bond yields.
Income Asset Classes
Weight Yield Income Potential
Capital Growth
Risk of Pullback
Comments
Bonds 58% 4.4Portfolio anchor; source of yield; sharp move in yields a risk
Equity Income 20% 4.7Key source of income and modest upside from capital growth, potential for large pullbacks
Non-core Income
22% 4.6Useful diversi�er for income and growth; sharp move in yields a risk for certain non-core assets
Source: Bloomberg, Standard Chartered. Non-core income includes Preferred Equity, Global REITs, Convertible Bonds, Contingent Convertible Bonds and Covered Calls. Refer to Important information related to Contingent Convertibles at the end of this document.Legend: Attractive potential/low risk | Moderate potential/medium risk | Unattractive potential/high risk
Key themes
Key chart
Key drivers
Figure 1
For the �rst time in four years, a balanced allocation outperformed the multi-asset income allocation in 2017
Performance comparison of balanced and income allocation between 2014 and 2017
Total Return of Income Allocation (Ann.)
Total Return of Balanced Allocation (Ann.)
Volatility of Income Allocation (Ann.)
Volatility of Balanced Allocation (Ann.)
6.1% 5.4%
2.4% 2.1%
6.0%
7.3%
5.9%7.1%
6.5%
2014- 20172014 2015 2016 2017
4.8%
7.1%
2.4%
5.3%
14.7%
8.9%11.4%
1.3%
-2.5%
7.0%
5.8%
Source: Bloomberg, Standard Chartered. For indices used, refer to end note at the conclusion of this section.Income allocation is as described in our H2 Outlook, Should I stay, or…?, 30 June 2017, page 30Balanced allocation as described our Global Market Outlook, Fresh opportunities to pivot, 31 March 2017, page 28

Asset Allocation
View Rates Policy
Macro Factors
Valuation FX Comments Yield*
EM USD govt ▲ n/a
Attractive yields, relative value, positive EM sentiment
5.3%
Asian USD ▲ n/aHigh credit quality, defensive allocation. In�uenced by China risk sentiment
3.9%
EM Local currency ◆
Attractive yield and positive EM sentiment balanced by high volatility and drawdown risk
6.2%
DM HY corporate ◆
Attractive yields on offer, offset by increasingly expensive valuations
5.2%
DM IG corporate ◆
Likely to outperform DM IG government bonds. Yield premium is relatively low
2.5%**
DM IG govt ▼ n/aReturns challenged by normalising Fed and ECB monetary policy
1.2%**
Source: Citigroup, JP Morgan, Barclays, Bloomberg, Standard Chartered; * As of 5 December 2017, ** As of 30 November 2017Legend: ▲ Most preferred | ▼ Least preferred | ◆ Core | Not supportive | Neutral | Supportive
Bondsat a glanceManpreet Gill | Abhilash Narayan
We view bonds as a core holding in a well-diversi�ed investment allocation as we expect only a gradual rise in Developed Market (DM) government bond yields. We expect the 10-year US Treasury yield to remain anchored around 2.50% as we see a low likelihood of a sharp rise in long-term in�ation expectations.
Emerging Market (EM) bonds are expected to outperform bonds from the US and Europe on the back of a modestly weaker USD and relatively attractive yields. EM USD government and Asian USD bonds are our preferred areas in bonds.
Within DM, we prefer corporate bonds, both Investment Grade (IG) and High Yield (HY), over government bonds. While valuations are elevated, they are supported by strong earnings and low default rates.
We favour a moderate maturity pro�le of 5-7 years as we believe it offers a balance between yields and interest rate sensitivity. In the US, we expect short-term (2-year) yields to rise faster than long-term (10-year) yields, which could be a headwind for short-maturity bonds and leveraged bond investing.
Figure 1
EM bonds offer relatively attractive yields
0
2
4
6
8
10
%
Current
Mean
DM IG governmentbonds
DM IG corporatebonds
EM USD governmentbonds
EM local currency bonds
DM HYbonds
Asia USDbonds
Note: Grey bars represent yield ranges from 2010 onwards. Source: Citigroup, JP Morgan, Barclays, Bloomberg, Standard Chartered
Key themes
Key drivers
Key chart
8 / Outlook 2018

Outlook 2018 / 9
EquityAt a glanceClive McDonnell | Belle Chan | Jill Yip
Figure 1
Euro area, Asia ex-Japan and Japan remain relatively attractive from a valuation perspective Global equity market valuations relative history
0
5
10
15
20
25
30
35
40
US Euro area Japan AxJ Non-AsiaEM
UK
12m
fwd
P/E
(x)
High/Low Current
Source: Standard Chartered
Key themes
Key drivers
Key chart
We remain positive on global equity markets in 2018. Low double digit growth in earnings is anticipated in 2018. The US technology sector is expected to continue to perform well and US banks may bene�t from rising interest rates.
Asia ex-Japan is a preferred region,. Within Asia ex-Japan, we are most positive on Korea and China, driven by a signi�cant increase in corporate margins.
Euro Area is a preferred region. Close to double digit earnings growth driven by strong domestic consumption is anticipated. We believe Euro area bond yields curve could rise, which has historically been a positive for Euro area banks.
Upside in�ation surprises and the impact of reduced monetary policy stimulus are the biggest risks for equity markets in 2018. Our base case is for two to three rate hikes by the Fed in 2018, a pace of tightening which is likely to be conducive of sustainable equity returns. The risk is a faster pace of tightening.
Equity View Valuations Earnings Return on Equity
Economic Data
Bond yields
Comments
Asia ex-Japan ▲
Earnings upgrades and ROE recovery combined with attractive valuations
Euro area ▲Double digit earning growth, ROE improving
Japan ◆Lead indicators of earnings point towards future improvement
US ◆2018 earnings growth will increase modestly. Elevated valuations a drag
EM ex-Asia ◆
Lead indicators of earnings point towards future deterioration
UK ▼Earnings under pressure and economic data is weak
Source: Standard CharteredLegend: ▲ Preferred | ◆ Core holding | ▼ Least preferred | Not supportive | Neutral | SupportiveNote: The colour of each signal refers to its relevance as a driver as opposed to its current positive/neutral/negative status.
Asia ex-Japan is our most preferred region in 2018, followed by the Euro area
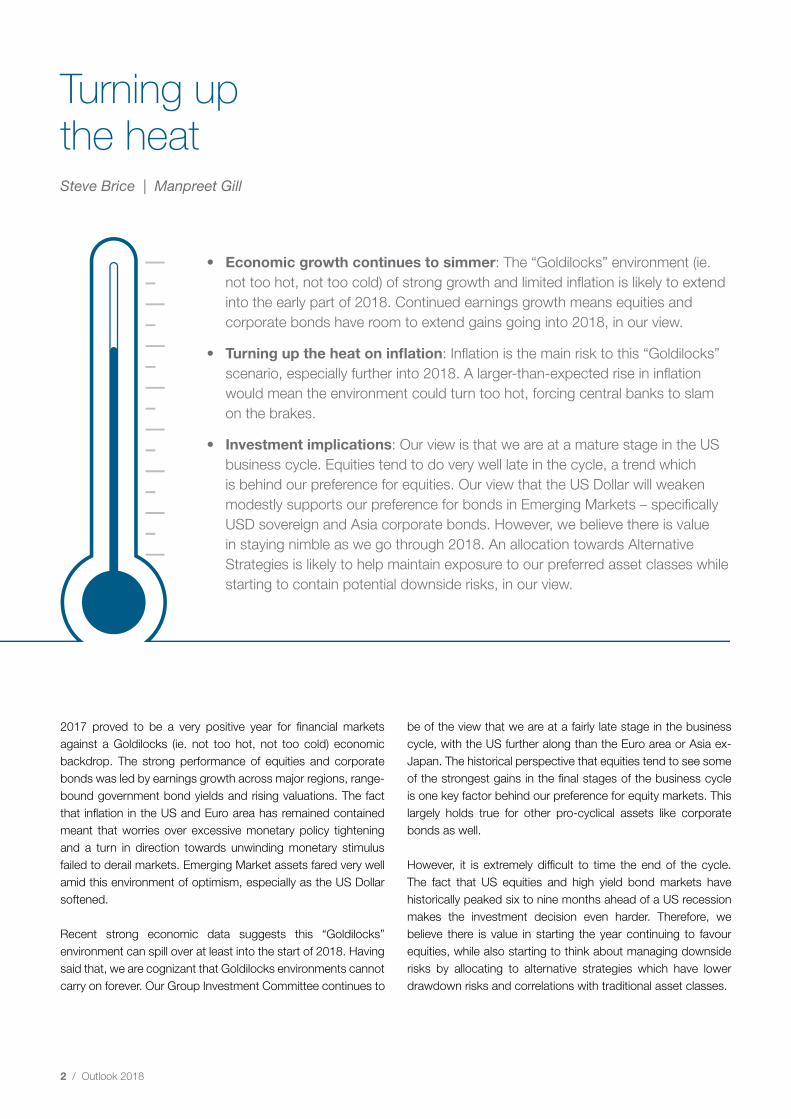
FXat a glanceTariq Ali, CFA | Manpreet Gill
We expect a modest decline in the USD index, mostly as a result of a stronger EUR and marginally offset by a weaker JPY.
GBP and AUD likely to trade in a broad range as risks remain balanced.
EM currencies likely to strengthen further on a widening EM-DM growth differential, higher commodity prices and a modestly weaker USD.
Key themes
Currency Outlook Real Interest Rate
Differentials
Risk Sentiment
Commodity Prices
Broad USD Strength
Comments
USD ▼ n/a n/aUS monetary policy divergence with the rest of the world likely peaking, interest rate differentials to narrow
EUR ▲ n/a n/aIncreasing likelihood of an earlier ECB stimulus withdrawal to support EUR. Political risks contained
JPY ▼ n/a n/aBoJ likely to maintain easing policy, further widening of interest rate differentials to weaken JPY
GBP ◆ n/a n/aFurther BoE rate hikes remain at risk from Brexit-related uncertainty and its potential impact on growth
AUD ◆Supportive risk environment balanced by likely status quo in monetary policy
EM FX ▲ n/aA weaker USD, moderately higher commodity prices and positive risk sentiment to support EM FX
Source: Bloomberg, Standard CharteredLegend: ▲ Bullish | ▼ Bearish | ◆ Neutral | Not Supportive | Neutral | Supportive
Key drivers
Key chart
Figure 1
End of a bullish USD super cycle?
USD real effective exchange rate
95
105
115
125
135
145
155
Feb-80 Jun-86 Oct-92 Feb-99 Jun-05 Oct-11 Feb-18
Inde
x
?
Source: Bloomberg, Standard Chartered
10 / Outlook 2018

Outlook 2018 / 11
Commoditiesat a glanceTariq Ali, CFA | Manpreet Gill
We expect commodity prices to rise modestly in 2018, amid a moderately positive demand environment, but still elevated supply levels in many cases.
Gold prices to rise modestly, most likely trading in the USD 1250–1350 per ounce range amid a slightly weaker USD, balanced with largely range-bound real yields.
Oil prices likely to remain broadly range-bound, most likely trading in the USD55–65 per barrel range.
Key themes
Figure 1
Outlook for China growth still a key driver of commodity prices
China leading indicator and Bloomberg commodity index
50
100
150
200
250
Jan-00 Aug-02 Mar-05 Oct-07 May-10 Dec-12 Jul-15
96
98
100
102
104
106
108
110
Inde
x
Inde
x
China leading indicator Bloomberg commodity index (LHS)
Source: Bloomberg, Standard Chartered
Key chart
Commodity View Inventory Production Demand Real Interest Rates
USD Risk Sentiment
Comments
Oil ◆ n/aOPEC cut backs likely to be offset by US production increase. Inventories remain elevated
Gold ◆US rate increases expected to be in-line with in�ation
Metals ◆ n/aChina demand a support; market still over supplied
Source: Bloomberg, Standard CharteredLegend: ◆ Neutral | Not supportive | Neutral | Supportive
Key drivers

Alternative Strategiesat a glanceArun Kelshiker, CFA | Trang Nguyen
Alternative Strategies are ranked as one of our highest asset class convictions going into 2018 and we expect our Alternatives Allocation to deliver positive returns within a rising interest rate environment.
We continue to advocate a diversi�ed alternatives allocation into Equity Hedge, Relative Value, Event Driven and Global Macro with a tilt towards Equity Hedge.
Our Alternatives Allocation delivered +5.3% in line with our call of positive returns since last year’s Outlook; amongst sub-strategies, Equity Hedge has been the best performer, up 7.9%.
Key themes
Key drivers
Key chart
Figure 1
Prefer a diversi�ed Alternatives Allocation with a tilt towards Equity Hedge
Our suggested allocation relative to the HFRX index weights
Alternative Strategies Allocation Global Hedge Fund Index
GlobalMacro
Event Driven
EquityHedge
23%
RelativeValue
25%
36%
16%
26%
27%
29%
19%
SUBS
TITU
TES
DIVE
RSIF
IERS
Source: Bloomberg, Standard Chartered, UBS, Hedge Fund Research Inc., HFRX Hedge Fund Index is a common benchmark used to represent all of the main hedge fund strategies. Composition of benchmark proxied by UBS HFRX Global Hedge Fund Index ETF (end-October 2017).
Description View Drivers for strategies to perform
SU
BS
TIT
UT
ES
Equity Hedge
In essence, buying undervalued stocks and selling overvalued stocks ▲
• Positively trending equity markets• Rising equity market dispersion
Event Driven
Taking positions based on an event such as a merger or acquisition ▼
• Positively trending equity markets• Rising mergers and acquisitions• Narrowing credit spreads
Relative Value
Looking to take advantage of differences in pricing of related �nancial instruments ▼
• Lower interest rate levels• Cost of funding, narrowing credit spreads
DIV
ER
SIF
IER
S
Global Macro
Looking to exploit themes, trends and asset class relationships (correlations) at a global level, generally with leverage
▼• Rising volatility and credit spreads• Increasing cross asset dispersion• Clear market trends (up/down)
Source: Standard Chartered Global Investment CommitteeLegend: ▲ Most preferred | ▼ Least preferred | ◆ Neutral | Not supportive | Neutral | Supportive
12 / Outlook 2018

Asset allocation Global
View vs. SAA Conservative Moderate Moderately Aggressive Aggressive
Cash Underweight 11 2 0 0Fixed Income Neutral 41 32 12 5Equity Overweight 34 48 71 90Commodities Neutral 7 6 6 0Alternative Strategies Neutral 7 12 11 5Asset Class RegionCash & Cash Equivalents USD Cash Underweight 11 2 0 0
Developed Market (DM) Investment Grade (IG) Bonds
DM IG Sovereign Underweight 18 14 6 2DM IG Corporate Neutral 14 11 4 3
Developed Market High Yield (HY) Bonds
DM HY Neutral 4 3 2 0
Emerging Market Bonds EM Sovereign HC Overweight 5 4 0 0EM Sovereign LC Neutral 0 0 0 0Asia Corporate HC Overweight 0 0 0 0
Developed Market Equity North America Neutral 16 24 36 46Europe ex-UK Overweight 8 10 15 18UK Underweight 0 0 0 0Japan Neutral 3 4 5 7
Emerging Market Equity Asia ex-Japan Overweight 7 10 13 16Non-Asia EM Neutral 0 0 2 3
Commodities Commodities Neutral 7 6 6 0Hedge FoF/CTAs Alternatives Neutral 7 12 11 5
*FX-hedged exposure. All �gures in %. For illustrative purpose only. Please refer to the Important information section at the end of this document for more details.Source: Standard Chartered
Commodities
Equity
Fixed Income
Cash
Alternatives
MODERATE AGGRESSIVE
2%
32%48%
6%12%
5%90%
5%
CONSERVATIVE
41%34%
7%7%
MODERATELYAGGRESSIVE
12%71 %
6%11%
11%
Outlook 2018 / 13

Asset allocation Asia
View vs. SAA Conservative Moderate Moderately Aggressive Aggressive
Cash Underweight 9 0 0 0Fixed Income Neutral 54 42 18 4Equity Overweight 25 43 68 87Commodities Neutral 6 5 5 4Alternative Strategies Neutral 6 10 9 5Asset Class RegionCash & Cash Equivalents Cash Underweight 9 0 0 0
Developed Market (DM) Investment Grade (IG) Bonds
DM IG Sovereign Underweight 9 7 2 0DM IG Corporate Neutral 8 6 3 0
Developed Market High Yield (HY) Bonds
DM HY Neutral 3 3 0 0
Emerging Market Bonds EM Sovereign HC Overweight 13 10 5 0EM Sovereign LC Neutral 8 6 3 0Asia Corporate HC Overweight 13 10 5 4
Developed Market Equity North America Neutral 6 11 17 22Europe ex-UK Overweight 5 10 15 19UK Underweight 0 0 0 0Japan Neutral 2 0 3 3
Emerging Market Equity Asia ex-Japan Overweight 10 19 28 36Non-Asia EM Neutral 2 3 5 7
Commodities Commodities Neutral 6 5 5 4Hedge FoF/CTAs Alternatives Neutral 6 10 9 5
*FX-hedged exposure. All �gures in %. For illustrative purpose only. Please refer to the Important information section at the end of this document for more details.Source: Standard Chartered
Commodities
Equity
Fixed Income
Cash
Alternatives
MODERATE AGGRESSIVE
42%43%
5%10%
4%87%
4%5%
CONSERVATIVE
54%25%
6%6%
MODERATELYAGGRESSIVE
18%68%
5%9%
9%
14 / Outlook 2018

Our 2017 calls in reviewManpreet Gill
A
D
A
P
T
Equity and bond markets both delivered strong performance in 2017. This provided signi�cant support for the performance of our views. As areference point, our moderate risk, Asia-focused strategic asset allocation baseline model generated total returns of 13.0%1 since we released our Outlook 2017. The corresponding tactical allocation model – which incorporates our tactical asset class preferences through the year – was up 14.2%1.
13.0%
14.2%
2012 2013 2014 2015 2016 2017YTD
2012-2017(ann.)12.76%
12.72%
2.56%
4.27%
1.71%
1.03%
1.43%
0.40%
1.94%
1.24%
-3.25%
-1.31%
-0.91%
7.83%
6.92%
12.96%
14.20%
5.48%
6.22%
0.75%
SAA TAA Relative (+/-)
-0.04%
1 SAA is our Asia-focused moderate strategic asset allocation. This is made up of 5% USD cash, 45% bonds, 35% equities, 5% commodities and 10% alternatives.TAA is our Asia-focused moderate tactical asset allocation which tilts the SAA allocation according to the SCB Global Investment Committee’s views.TAA and SAA performance measure from 15 December 2016 to 5 December 2017.
Baseline Strategic Asset Allocation1
Our Tactical Asset Allocation1
Annual performance of our Tactical Asset Allocation1 relative to the Strategic Asset Allocation1 baseline model
Source: Bloomberg, Standard Chartered
Outlook 2018 / 15
16 / Outlook 2018
1.0%8.2%
5.9%3.1%
4.9%
3.9%
12.4%5.5%5.5%
9.9%7.3%
6.3%15.9%
-8.4%-9.2%
5.7%19.4%
7.3%10.0%
8.6%
11.9%12.4%
9.7%12.9%
2.3%7.3%
12.4%17.3%
7.8%23.9%
38.5%22.2%
18.1%21.5%
5.6%15.9%
22.4%
26.3%45.1%
31.2%48.2%
2.4%19.6%
13.5%24.1%
37.3%14.8%
22.1%18.1%
22.7%12.0%
19.1%32.2%
20.0%18.1%
21.3%
-20% -10% 0% 10% 20% 30% 40% 50% 60%
Year to date 2016
-2.9%
11.1%1.0%2.5%
18.5%8.7%
-1.4%0.9%
9.5%31.0%
37.8%14.8%
5.4%11.4%
2.4%-0.7%-0.4%
-20% 0% 20% 40% 60%
USWestern Europe (Local)
Japan (Local)
AustraliaAsia ex-Japan
AfricaEastern Europe
LatamMiddle East
ChinaIndia
South KoreaTaiwan
Alternatives
DM High Yield Corporates US High Yield
Europe High YieldAsia Hard Currency
8.9% -16.3%GBPJPY
Composite (All strategies)Relative ValueEvent DrivenEquity HedgeMacro CTAs
Precious Metal
Gold
FX (against USD)
AUD
Industrial Metal
Asia ex-Japan
EUR
Crude Oil
Commodity
AgricultureEnergy
Bonds | CreditDM IG Corporates
Global Equities
Emerging Markets (EM)
Japan (USD)
Western Europe (USD)
Global High Divi Yield EquitiesDeveloped Markets (DM)
Equity | Country & Region
Consumer Discretionary
Energy
Equity | Sector
FinancialHealthcareIndustrial
Consumer Staples
MaterialsTelecomUtilities
Global Property Equity/REITs
IT
US SovereignEU Sovereign
EM Sovereign Hard CurrencyEM Sovereign Local Currency
Asia EM Local Currency
DM IG Sovereign
Bonds | Sovereign
7.2%10.9%11.2%
7.5%11.0%
7.9%
4.6%5.7%7.3%
23.6%12.2%11.9%
-6.8%12.4%
32.0%1.5%2.9%
1.8%8.7%10.2%
0.9%1.0%1.5%
5.8%3.4%
17.1%14.3%
4.2%
8.6%16.2%
9.5%19.9%
16.3%2.1%
7.5% SGD -2.0%2.8%
-3.2%
-3.4%-1.1%
0.1%
-2.0% Diversi�ed Commodity 11.8%
Source: MSCI, JP Morgan, Barclays, Citigroup, Dow Jones, HFRX, FTSE, Bloomberg, Standard Chartered*All performance shown in USD terms, unless otherwise stated.The column ‘2017 Year to date’ indicates performance from 31 December 2016 to 5 December 2017.The column ‘2016’ indicates performance from 31 December 2015 to 31 December 2016.
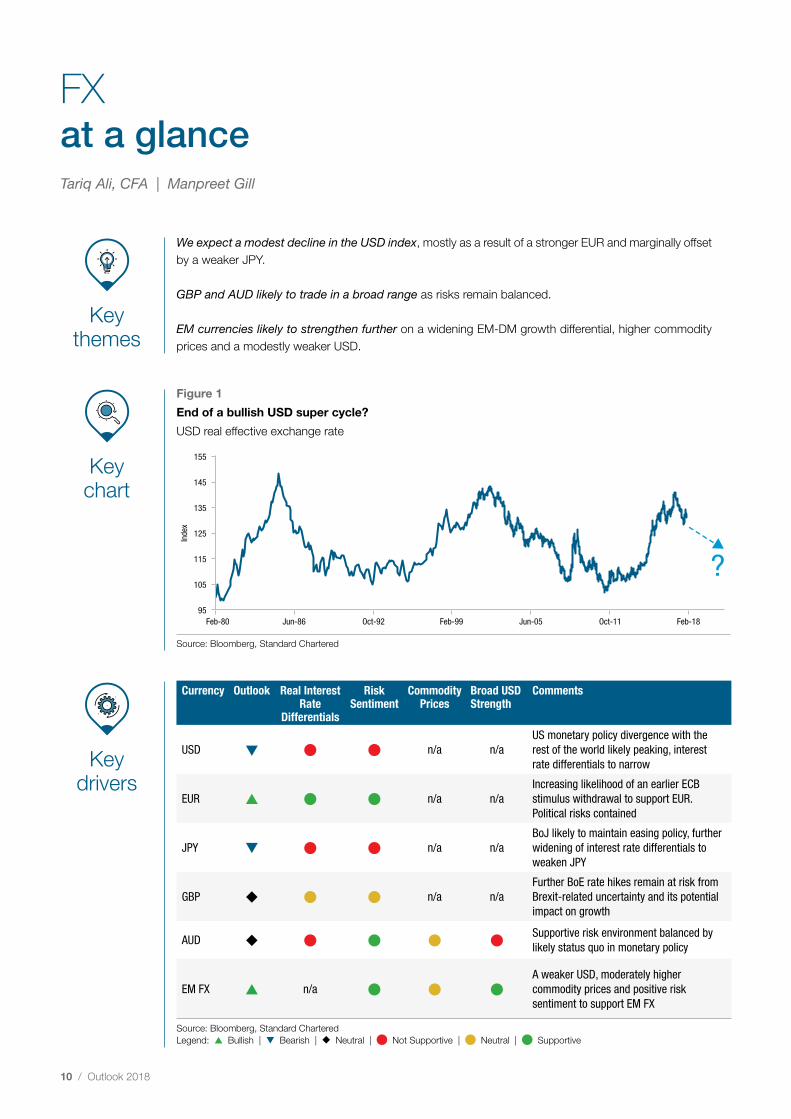
2017 markets summary

Outlook 2018 / 17
2018 key events
YE
AR
20
18
JANUARY
OCTOBER
NOVEMBER
DECEMBER
FEBRUARY
MARCH
APRIL
MAY
JUNE
JULY
AUGUST
SEPTEMBER
X Japan LDP President election where Prime Minister Abe faces challengers
13 ECB Policy decision
19 BoJ Policy decision
27 FOMC Policy decision
X Thailand elections due
06 US House (all 435 seats) and Senate (33 out of 100 seats) elections
09 FOMC policy decision
12-18 APEC Summit
01 Mexico Presidential and Parliamentary elections
26 ECB Policy decision
31 BoJ Policy decision
X Italy elections likely
X PBoC Governor Zhou’s term ends
08 ECB Policy decision
09 BoJ Policy decision
18 Russia Presidential elections
22 FOMC Policy Decision
X Taiwan central bank Governor Perng’s term ends
01 FOMC Policy Decision
08 BoJ Governor Kuroda’s current term ends; he may get another term
26 ECB Policy decision
27 BoJ Policy decision
7 Brazil elections – 1st round
25 ECB policy decision
28 Brazil elections – 2nd round
31 BoJ policy decision
13 ECB Policy Decision
20 FOMC Policy Decision
20 BoJ Policy Decision
02 FOMC Policy Decision
24 Malaysia elections due
23 BoJ Policy decision
25 ECB Policy decision
03 FOMC Policy Decision
14 FOMC Policy Decision
14 ECB Policy decision
15 BoJ Policy decision
Legend: X – Date not con�rmed | ECB – European Central Bank | FOMC – Federal Open Market Committee (US) | BoJ – Bank of Japan

Meet the team
Alexis Calla Chief Investment Of�cer
Steve Brice Chief Investment Strategist
Clive McDonnell HeadEquity Investment Strategy
Aditya Monappa, CFA Head Asset Allocation and Portfolio Solutions
Christian Abuide HeadDiscretionary Portfolio Management
Manpreet Gill HeadFICC Investment Strategy
Arun Kelshiker, CFA Senior Investment StrategistAsset Allocation and Portfolio Solutions
18 / Outlook 2018
Daniel Lam, CFA Senior Investment Strategist Asset Allocation and Portfolio Solutions
Belle Chan Senior Investment Strategist
Rajat Bhattacharya Senior Investment Strategist
Ajay Saratchandran Discretionary Portfolio Manager
Samuel Seah, CFA Discretionary Portfolio Manager
Audrey Goh, CFASenior Investment Strategist Asset Allocation and Portfolio Solutions
Tariq Ali, CFA Investment Strategist
Francis Lim Quantitative Investment Strategist
Jill Yip, CFA Senior Investment Strategist
Abhilash Narayan Investment Strategist
Cedric Lam Investment Strategist
Trang Nguyen Analyst Asset Allocation and Portfolio Solutions
Jeff Chen Analyst Asset Allocation and Portfolio Solutions
DJ Cheong Investment Strategist

Outlook 2018 / 19
Investment view generationOur adaptive process
Revi
ew
01OPEN-PLATFORMINPUTS
DISCUSS & DEBATE
INVESTMENTSTRATEGYDECISIONS
02
03
Third party views as diverse as possible are curated from leading research boutiques, banks and asset management companies to harness the collective intelligence of our network
Decisions are not a consensus. Global Investment Committee (GIC) members vote anonymously on key questions and decisions to form �nal house views. Voting process involves a detailed questionnaire and all individual results are tracked to identify key trends associated with house views
GIC ideas and themes are discussed with product and country teams to formulate conviction lists of relevant investment opportunities for our clients
Investment results of our house views and conviction-based opportunities are thoroughly reviewed together with all the quantitative data collected during the voting process
Once a month, these curated questions, insights and analysis are shared and digested by the GIC members
through a rigorous debating process to ensure full consideration is given to the diverse perspectives
ADVISORY COMMUNICATION04
The results of the vote are organised to form our “House Views” and articulated by our Investment Strategists
through investment publications; they are communicated immediately to all our global and local product teams
RELEVANT &ACTIONABLE CONVICTIONS
05
THOROUGHREVIEW 07
COMMUNICATION TO CLIENTS06
Our “House views” and conviction-based investmentopportunities reach our clients through our various
publications, relationship managers and investment advisors
We have a robust advisory process ensuring we deliver high-quality insights and solutions to our clients.

20 / Outlook 2018
THIS IS NOT A RESEARCH REPORT AND HAS NOT BEEN PRODUCED BY A RESEARCH UNIT.
This document is not research material and it has not been prepared in accordance with legal requirements designed to promote the independence of investment research and is not subject to any prohibition on dealing ahead of the dissemination of investment research. This document does not necessarily represent the views of every function within Standard Chartered Bank, particularly those of the Global Research function.
Standard Chartered Bank is incorporated in England with limited liability by Royal Charter 1853 Reference Number ZC18. The Principal Of�ce of the Company is situated in England at 1 Basinghall Avenue, London, EC2V 5DD. Standard Chartered Bank is authorised by the Prudential Regulation Authority and regulated by the Financial Conduct Authority and Prudential Regulation Authority.
Banking activities may be carried out internationally by different Standard Chartered Bank branches, subsidiaries and af�liates (collectively “SCB”) according to local reg-ulatory requirements. With respect to any jurisdiction in which there is a SCB entity, this document is distributed in such jurisdiction by, and is attributable to, such local SCB entity. Recipients in any jurisdiction should contact the local SCB entity in relation to any matters arising from, or in connection with, this document. Not all products and services are provided by all SCB entities.
This document is being distributed for general information only and it does not constitute an offer, recommendation or solicitation to enter into any transaction or adopt any hedging, trading or investment strategy, in relation to any securities or other �nancial instruments. This document is for general evaluation only, it does not take into account the speci�c investment objectives, �nancial situation or particular needs of any particular person or class of persons and it has not been prepared for any particular person or class of persons.
Investment involves risks. The prices of investment products �uctuate, sometimes dramatically. The price of investment products may move up or down, and may become valueless. It is as likely that losses will be incurred rather than pro�t made as a result of buying and selling investment products. You should not rely on any contents of this document in making any investment decisions. Before making any investment, you should carefully read the relevant offering documents and seek independent legal, tax and regulatory advice. In particular, we recommend you to seek advice regarding the suitability of the investment product, taking into account your speci�c investment objectives, �nancial situation or particular needs, before you make a commitment to purchase the investment product.
Opinions, projections and estimates are solely those of SCB at the date of this document and subject to change without notice. Past performance is not indicative of future results and no representation or warranty is made regarding future performance. Any forecast contained herein as to likely future movements in rates or prices or likely fu-ture events or occurrences constitutes an opinion only and is not indicative of actual future movements in rates or prices or actual future events or occurrences (as the case may be). This document has not been and will not be registered as a prospectus in any jurisdiction and it is not authorised by any regulatory authority under any regulations.
SCB makes no representation or warranty of any kind, express, implied or statutory regarding, but not limited to, the accuracy of this document or the completeness of any information contained or referred to in this document. This document is distributed on the express understanding that, whilst the information in it is believed to be reliable, it has not been independently veri�ed by us. SCB accepts no liability and will not be liable for any loss or damage arising directly or indirectly (including special, incidental or consequential loss or damage) from your use of this document, howsoever arising, and including any loss, damage or expense arising from, but not limited to, any defect, error, imperfection, fault, mistake or inaccuracy with this document, its contents or associated services, or due to any unavailability of the document or any part thereof or any contents.
SCB, and/or a connected company, may at any time, to the extent permitted by applicable law and/or regulation, be long or short any securities, currencies or �nancial instruments referred to on this document or have a material interest in any such securities or related investment, or may be the only market maker in relation to such investments, or provide, or have provided advice, investment banking or other services, to issuers of such investments. Accordingly, SCB, its af�liates and/or subsidiaries may have a con�ict of interest that could affect the objectivity of this document. This document must not be reproduced, forwarded or otherwise made available to any other person without the express written consent of SCB, nor should it be distributed into any other jurisdiction unless permitted by the local laws and regulations of that jurisdiction. Neither SCB nor any of its directors, employees or agents accept any liability whatsoever for the actions of third parties in this respect.
Explanatory Notes:1. Figure 12 (page 46) show a multi-asset income asset allocation for a moderate risk pro�le only – different risk pro�les may produce signi�cantly different asset allocation results. Figure 7 (page 39) and the asset allocation diagrams (page 96-97) are only examples, provided for general information only and they do not constitute investment advice, an offer, recommendation or solicitation. They do not take into account the speci�c investment objectives, needs or risk tolerances of a particular person or class of persons and they have not been prepared for any particular person or class of persons.
2. Contingent Convertibles are complex �nancial instruments and are not a suitable or appropriate investment for all investors. This document is not an offer to sell or an invitation to buy any securities or any bene�cial interests therein. Contingent convertible securities are not intended to be sold and should not be sold to retail clients inthe European Economic Area (EEA) (each as de�ned in the Policy Statement on the Restrictions on the Retail Distribution of Regulatory Capital Instruments (Feedback to CP14/23 and Final Rules) (“Policy Statement”), read together with the Product Intervention (Contingent Convertible Instruments and Mutual Society Shares) Instrument2015 (“Instrument”, and together with the Policy Statement, the “Permanent Marketing Restrictions"), which were published by the United Kingdom’s Financial ConductAuthority in June 2015), other than in circumstances that do not give rise to a contravention of the Permanent Marketing Restrictions.
Copyright: Standard Chartered Bank 2017. Copyright in all materials, text, articles and information contained herein is the property of, and may only be reproduced with permission of an authorised signatory of, Standard Chartered Bank. Copyright in materials created by third parties and the rights under copyright of such parties are hereby acknowledged. Copyright in all other materials not belonging to third parties and copyright in these materials as a compilation vests and shall remain at all times copyright of Standard Chartered Bank and should not be reproduced or used except for business purposes on behalf of Standard Chartered Bank or save with the express prior written consent of an authorised signatory of Standard Chartered Bank. All rights reserved. © Standard Chartered Bank 2017.
Important information

Outlook 2018 / 21
Standard Chartered Private Bank is the private banking division of SCB. Private banking activities may be carried out internationally by different SCB legal entities and af�liates according to local regulatory requirements. Not all products and services are provided by all SCB branches, subsidiaries and af�liates. Some of the SCB entities and af�liates only act as representatives of the Standard Chartered Private Bank, and may not be able to offer products and services, or offer advice to clients. They serve as points of contact only.
Country Speci�c DisclosuresBotswana: This document is being distributed in Botswana by, and is attributable to, Standard Chartered Bank Botswana Limited which is a �nancial institution licensed under the Section 6 of the Banking Act CAP 46.04 and is listed in the Botswana Stock Exchange.
China: This document is being distributed in China by, and is attributable to, Standard Chartered Bank (China) Limited which is mainly regulated by China Banking Reg-ulatory Commission (CBRC), State Administration of Foreign Exchange (SAFE), and People’s Bank of China (PBOC).
Ghana: Standard Chartered Bank Ghana Limited accepts no liability and will not be liable for any loss or damage arising directly or indirectly (including special, incidental or consequential loss or damage) from your use of these documents. Past performance is not indicative of future results and no representation or warranty is made regarding future performance. You should seek advice from a �nancial adviser on the suitability of an investment for you, taking into account these factors before making a commitment to invest in an investment. To unsubscribe from receiving further updates, please click here. Please do not reply to this email. Call our Priority Banking on 0302610750 for any questions or service queries. You are advised not to send any con�dential and/or important information to the Bank via e-mail, as the Bank makes no representations or warranties as to the security or accuracy of any information transmitted via e-mail. The Bank shall not be responsible for any loss or damage suffered by you arising from your decision to use e-mail to communicate with the Bank.
Hong Kong: In Hong Kong, this document, except for any portion advising on or facilitating any decision on futures contracts trading, is distributed by Standard Chartered Bank (Hong Kong) Limited (“SCBHK”), a subsidiary of Standard Chartered Bank. SCBHK has its registered address at 32/F, Standard Chartered Bank Building, 4-4A Des Voeux Road Central, Hong Kong and is regulated by the Hong Kong Monetary Authority and registered with the Securities and Futures Commission (“SFC”) to carry on Type 1 (dealing in securities), Type 4 (advising on securities), Type 6 (advising on corporate �nance) and Type 9 (asset management) regulated activity under the Secu-rities and Futures Ordinance (Cap. 571) (“SFO”) (CE No. AJI614). The contents of this document have not been reviewed by any regulatory authority in Hong Kong and you are advised to exercise caution in relation to any offer set out herein. If you are in doubt about any of the contents of this document, you should obtain independent professional advice. Any product named herein may not be offered or sold in Hong Kong by means of any document at any time other than to “professional investors” as de�ned in the SFO and any rules made under that ordinance. In addition, this document may not be issued or possessed for the purposes of issue, whether in Hong Kong or elsewhere, and any interests may not be disposed of, to any person unless such person is outside Hong Kong or is a “professional investor” as de�ned in the SFO and any rules made under that ordinance, or as otherwise may be permitted by that ordinance. In Hong Kong, Standard Chartered Private Bank is the private banking division of Standard Chartered Bank (Hong Kong) Limited.
India: Standard Chartered Bank is registered with Securities and Exchange Board of India as an Investment Advisor (Registration Number: INA000002249) under the Securities and Exchange Board of India (Investment Advisers) Regulations, 2013. You can avail of investment advisory services of Standard Chartered Bank only upon (i) executing separate documents with the Investment Advisory Group of Standard Chartered Bank for availing 'Investment Advice’ (as de�ned in the Securities and Exchange Board of India (Investment Advisers) Regulations, 2013); and (ii) paying speci�c fees (if applied by Standard Chartered Bank ) for such ‘Investment Advice’. Standard Chartered Bank acts as a distributor of mutual funds and referrer of other third party �nancial products, for which Standard Chartered Bank receives commission / referral fees from the product provider.
Jersey: In Jersey, Standard Chartered Private Bank is the Registered Business Name of the Jersey Branch of Standard Chartered Bank. The Jersey Branch of Standard Chartered Bank is regulated by the Jersey Financial Services Commission. Copies of the latest audited accounts of Standard Chartered Bank are available from its princi-pal place of business in Jersey: PO Box 80, 15 Castle Street, St Helier, Jersey JE4 8PT. Standard Chartered Bank is incorporated in England with limited liability by Royal Charter in 1853 Reference Number ZC 18. The Principal Of�ce of the Company is situated in England at 1 Basinghall Avenue, London, EC2V 5DD. Standard Chartered Bank is authorised by the Prudential Regulation Authority and regulated by the Financial Conduct Authority and Prudential Regulation Authority. The Jersey Branch of Standard Chartered Bank is also an authorised �nancial services provider under license number 44946 issued by the Financial Services Board of the Republic of South Africa. Jersey is not part of the United Kingdom and all business transacted with Standard Chartered Bank, Jersey Branch and other Standard Chartered Group Of�ces outside of the United Kingdom, are not subject to some or any of the investor protection and compensation schemes available under United Kingdom law.
Kenya: Investment Products and Services are distributed by Standard Chartered Investment Services Limited, a wholly owned subsidiary of Standard Chartered Bank Kenya Limited (Standard Chartered Bank/the Bank) that is licensed by the Capital Markets Authority as a Fund Manager. Standard Chartered Bank Kenya Limited is regulated by the Central Bank of Kenya.
Singapore SCBSL: This document is being distributed in Singapore by, and is attributable to, Standard Chartered Bank (Singapore) Limited (“SCBSL”). Recipients in Singapore should contact SCBSL in relation to any matters arising from, or in connection with, this document. SCBSL is an indirect wholly-owned subsidiary of Stand-ard Chartered Bank and is licensed to conduct banking business in Singapore under the Singapore Banking Act, Chapter 19. IN RELATION TO ANY FIXED INCOME AND STRUCTURED SECURITIES REFERRED TO IN THIS DOCUMENT (IF ANY), THIS DOCUMENT TOGETHER WITH THE ISSUER DOCUMENTATION SHALL BE DEEMED AN INFORMATION MEMORANDUM (AS DEFINED IN SECTION 275 OF THE SECURITIES AND FUTURES ACT, CHAPTER 289 (“SFA”). IT IS INTENDED FOR DISTRIBUTION TO ACCREDITED INVESTORS, AS DEFINED IN SECTION 4A OF THE SFA, OR ON TERMS THAT THE SECURITIES MAY ONLY BE ACQUIRED AT A CONSIDERATION OF NOT LESS THAN S$200,000 (OR ITS EQUIVALENT IN A FOREIGN CURRENCY) FOR EACH TRANSACTION. Further, in relation to �xed income and structured securities mentioned (if any), neither this document nor the Issuer Documentation have been, and will not be, registered as a prospectus with the Monetary Authority of Singapore under the SFA. Accordingly, this document and any other document or material in connection with the offer or sale, or invitation for subscription or purchase, of the product may not be circulated or distributed, nor may the product be offered or sold, or be made the subject of an invitation for subscription or purchase, whether directly or indirectly, to persons other than a relevant person pursuant to section 275(1) of the SFA, or any person pursuant to section 275(1A) of the SFA, and in accordance with the conditions, speci�ed in section 275 of the SFA, or pursuant to, and in accordance with the conditions of, any other applicable provision of the SFA. Singapore dollar deposits of non-bank depositors are insured by the Singapore Deposit Insurance Corporation, for up to S$50,000 in aggregate per depositor per Scheme member by law. Foreign currency deposits, dual currency investments, structured deposits and other investment products are not insured.

Singapore SCB, Singapore Branch: This document is being distributed in Singapore by SCB, Singapore branch only to accredited investors, expert investors or institutional investors, as de�ned in the Securities and Futures Act, Chapter 289 of Singapore. Recipients in Singapore should contact SCB, Singapore branch in relation to any matters arising from, or in connection with, this document. In Singapore, Standard Chartered Private Bank is the Private Banking division of SCB, Singapore branch. SCB, Singapore branch (Registration No. S16FC0027L) (GST Registration No.: MR-8500053-0) is licensed to conduct banking business under the Banking Act, Chapter 19 of Singapore. IN RELATION TO ANY FIXED INCOME AND STRUCTURED SECURITIES REFERRED TO IN THIS DOCUMENT (IF ANY), THIS DOCUMENT TOGETHER WITH THE ISSUER DOCUMENTATION SHALL BE DEEMED AN INFORMATION MEMORANDUM (AS DEFINED IN SECTION 275 OF THE SFA). IT IS INTENDED FOR DISTRIBUTION TO ACCREDITED INVESTORS, AS DEFINED IN SECTION 4A OF THE SFA. Further, in relation to �xed income and structured securities mentioned (if any), neither this document nor the Issuer Documentation have been, and will not be, registered as a prospectus with the Monetary Authority of Singapore under the SFA. Accordingly, this document and any other document or material in connection with the offer or sale, or invitation for subscription or purchase, of the product may not be circulated or distributed, nor may the product be offered or sold, or be made the subject of an invitation for subscription or purchase, whether directly or indirectly, to persons other than a relevant person pursuant to section 275(1) of the SFA, and in accordance with the conditions, speci�ed in section 275 of the SFA, or pursuant to, and in accordance with the conditions of, any other applicable provision of the SFA. Singapore dollar deposits of non-bank depositors are insured by the Singapore Deposit Insurance Corporation, for up to S$50,000 in aggregate per depositor per Scheme member by law. Foreign currency deposits, dual currency investments, structured deposits and other investment products are not insured. In relation to any collective investment schemes referred to in this document (if any), this document is for general information purposes only and is not an offering document or prospectus (as de�ned in the SFA). This document is not, nor is it intended to be (i) an offer or solicitation of an offer to buy or sell any �nancial product; or (ii) an advertisement of an offer or intended offer of any �nancial product.
Thailand: Please study the Scheme Information Documents carefully e.g. investment policy, risks, fund performance before investing.
UAE: DIFC – Standard Chartered Bank, Dubai International Financial Centre (SCB DIFC) having its of�ces at Dubai International Financial Centre, Building 1, Gate Precinct, P.O. Box 999, Dubai, UAE is a branch of Standard Chartered Bank and is regulated by the Dubai Financial Services Authority (“DFSA”). This document is intended for use only by Professional Clients and is not directed at Retail Clients as de�ned by the DFSA Rulebook. In the DIFC we are authorized to provide �nancial services only to clients who qualify as Professional Clients and Market Counterparties and not to Retail Clients. As a Professional Client you will not be given the higher retail client protection and compensation rights and if you use your right to be classi�ed as a Retail Client we will be unable to provide �nancial services and products to you as we do not hold the required license to undertake such activities. For Islamic transactions, we are acting under the supervision of our Shariah Supervisory Committee. Relevant information on our Shariah Supervisory Committee is currently available on the Standard Chartered Bank website in the Islamic banking section here.
UAE: For residents of the UAE – Standard Chartered Bank UAE does not provide �nancial analysis or consultation services in or into the UAE within the meaning of UAE Securities and Commodities Authority Decision No. 48/r of 2008 concerning �nancial consultation and �nancial analysis.
Uganda: Our Investment products and services are distributed by Standard Chartered Bank Uganda Limited, which is licensed by the Capital Markets Authority as an investment adviser.
United Kingdom: Standard Chartered Bank (trading as Standard Chartered Private Bank) is an authorised �nancial services provider (licence number 45747) in terms of the South African Financial Advisory and Intermediary Services Act, 2002.
Zambia: This document is distributed by Standard Chartered Bank Zambia Plc, a company incorporated in Zambia and registered as a commercial bank and licensed by the Bank of Zambia under the Banking and Financial Services Act Chapter 387 of the Laws of Zambia.
Market Abuse Regulation (MAR) Disclaimer
Standard Chartered Bank is incorporated in England with limited liability by Royal Charter 1853 Reference Number ZC18. The Principal Of�ce of the Company is situated in England at 1 Basinghall Avenue, London, EC2V 5DD. Standard Chartered Bank is authorised by the Prudential Regulation Authority and regulated by the Financial Conduct Authority and Prudential Regulation Authority. Banking activities may be carried out internationally by different Standard Chartered Bank branches, subsidiaries and af�liates (collectively “SCB”) according to local regulatory requirements. Opinions may contain outright "buy", "sell", "hold" or other opinions. The time horizon of this opinion is dependent on prevailing market conditions and there is no planned frequency for updates to the opinion.
This opinion is not independent of SCB’s own trading strategies or positions. SCB and/or its af�liates or its respective of�cers, directors, employee bene�t programmes or employees, including persons involved in the preparation or issuance of this document may at any time, to the extent permitted by applicable law and/or regulation, be long or short any securities or �nancial instruments referred to in this document or have material interest in any such securities or related investments. Therefore, it is possible, and you should assume, that SCB has a material interest in one or more of the �nancial instruments mentioned herein. If speci�c companies are mentioned in this communication, please note that SCB may at times do business or seek to do business with the companies covered in this communication; hold a position in, or have economic exposure to, such companies; and/or invest in the �nancial products issued by these companies. Further, SCB may be involved in activities such as dealing in, holding, acting as market makers or liquidity providers, or performing �nancial or advisory services including but not limited to, lead manager or co-lead manager in relation to any of the products referred to in this communication. SCB may have received compensation for these services and activities. Accordingly, SCB may have a con�ict of interest that could affect the objectivity of this communication.
SCB has in place policies and procedures, logical access controls and physical information walls to help ensure con�dential information, including material non-public or inside information is not disclosed unless in line with its policies and procedures and the rules of its regulators.
Please refer to https://www.sc.com/en/banking-services/market-disclaimer.html for more detailed disclosures, including past opinions in the last 12 months and con�ict of interests, as well as disclaimers. This document must not be forwarded or otherwise made available to any other person without the express written consent of SCB.
THIS IS NOT A RESEARCH REPORT AND HAS NOT BEEN PRODUCED BY A RESEARCH UNIT.
22 / Outlook 2018

Here for good