Embed Size (px)
Citation preview
at
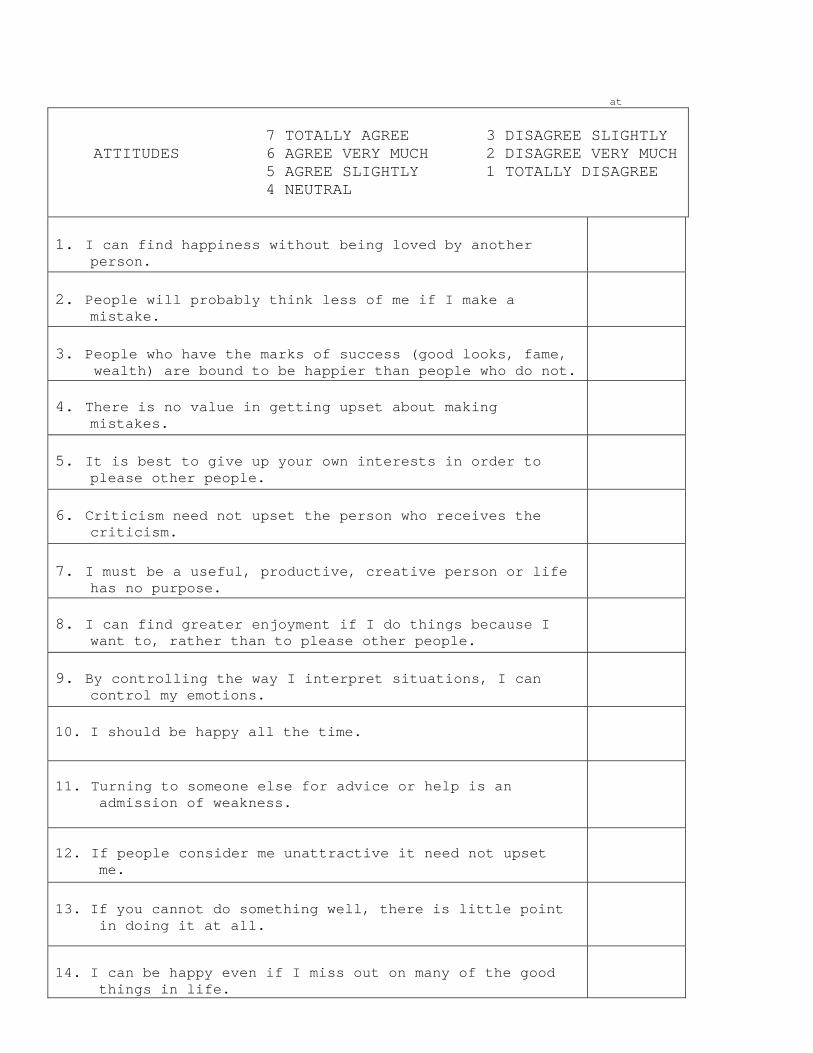
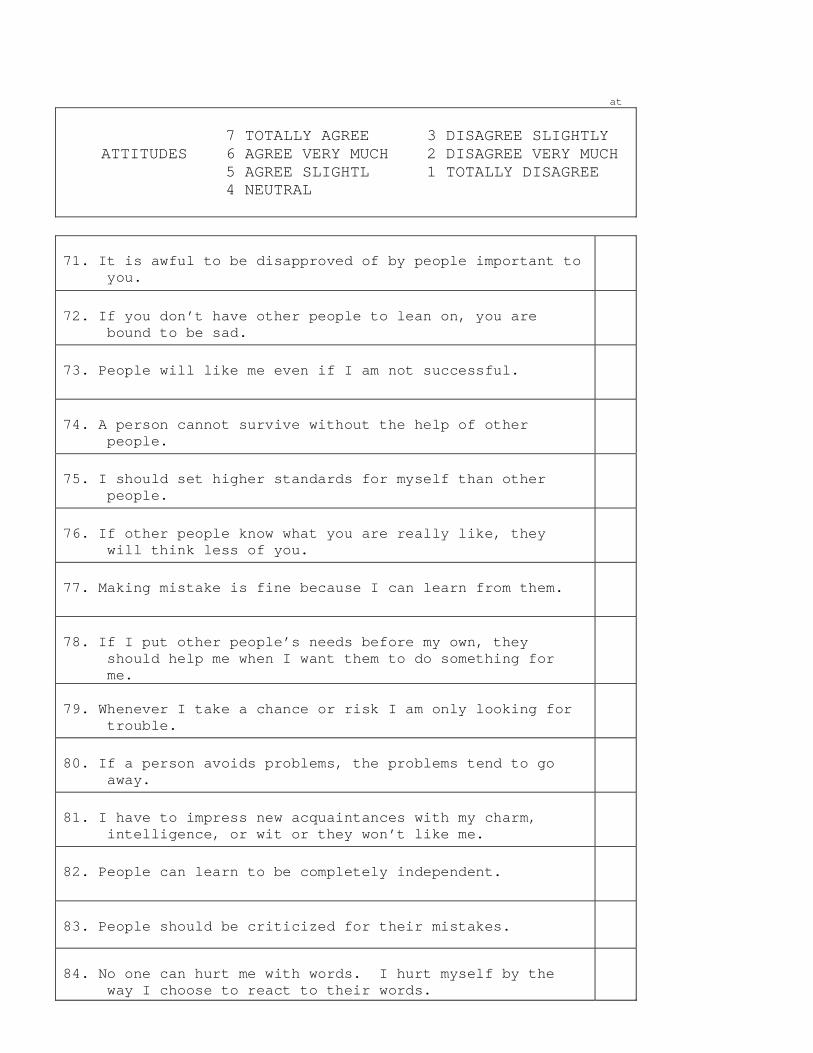
7 TOTALLY AGREE 3 DISAGREE SLIGHTLY ATTITUDES 6 AGREE VERY MUCH 2 DISAGREE VERY MUCH 5 AGREE SLIGHTLY 1 TOTALLY DISAGREE 4 NEUTRAL
1. I can find happiness without being loved by another person.
2. People will probably think less of me if I make a mistake.
3. People who have the marks of success (good looks, fame,
wealth) are bound to be happier than people who do not.
4. There is no value in getting upset about making mistakes.
5. It is best to give up your own interests in order to please other people.
6. Criticism need not upset the person who receives the criticism.
7. I must be a useful, productive, creative person or life has no purpose.
8. I can find greater enjoyment if I do things because I want to, rather than to please other people.
9. By controlling the way I interpret situations, I can control my emotions.
10. I should be happy all the time.
11. Turning to someone else for advice or help is an admission of weakness.
12. If people consider me unattractive it need not upset me.
13. If you cannot do something well, there is little point in doing it at all.
14. I can be happy even if I miss out on many of the good things in life.
at
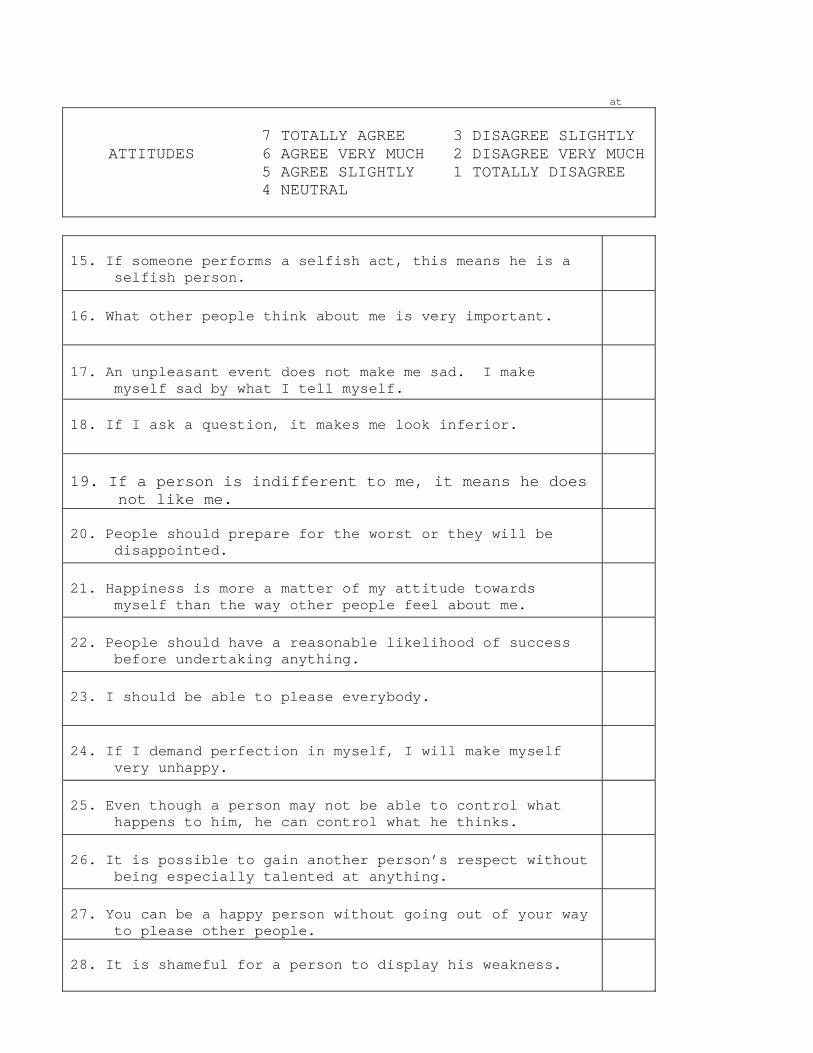
7 TOTALLY AGREE 3 DISAGREE SLIGHTLY ATTITUDES 6 AGREE VERY MUCH 2 DISAGREE VERY MUCH 5 AGREE SLIGHTLY 1 TOTALLY DISAGREE 4 NEUTRAL
15. If someone performs a selfish act, this means he is a selfish person.
16. What other people think about me is very important.
17. An unpleasant event does not make me sad. I make myself sad by what I tell myself.
18. If I ask a question, it makes me look inferior.
19. If a person is indifferent to me, it means he does not like me.
20. People should prepare for the worst or they will be disappointed.
21. Happiness is more a matter of my attitude towards myself than the way other people feel about me.
22. People should have a reasonable likelihood of success before undertaking anything.
23. I should be able to please everybody.
24. If I demand perfection in myself, I will make myself very unhappy.
25. Even though a person may not be able to control what happens to him, he can control what he thinks.
26. It is possible to gain another person’s respect without being especially talented at anything.
27. You can be a happy person without going out of your way to please other people.
28. It is shameful for a person to display his weakness.
at
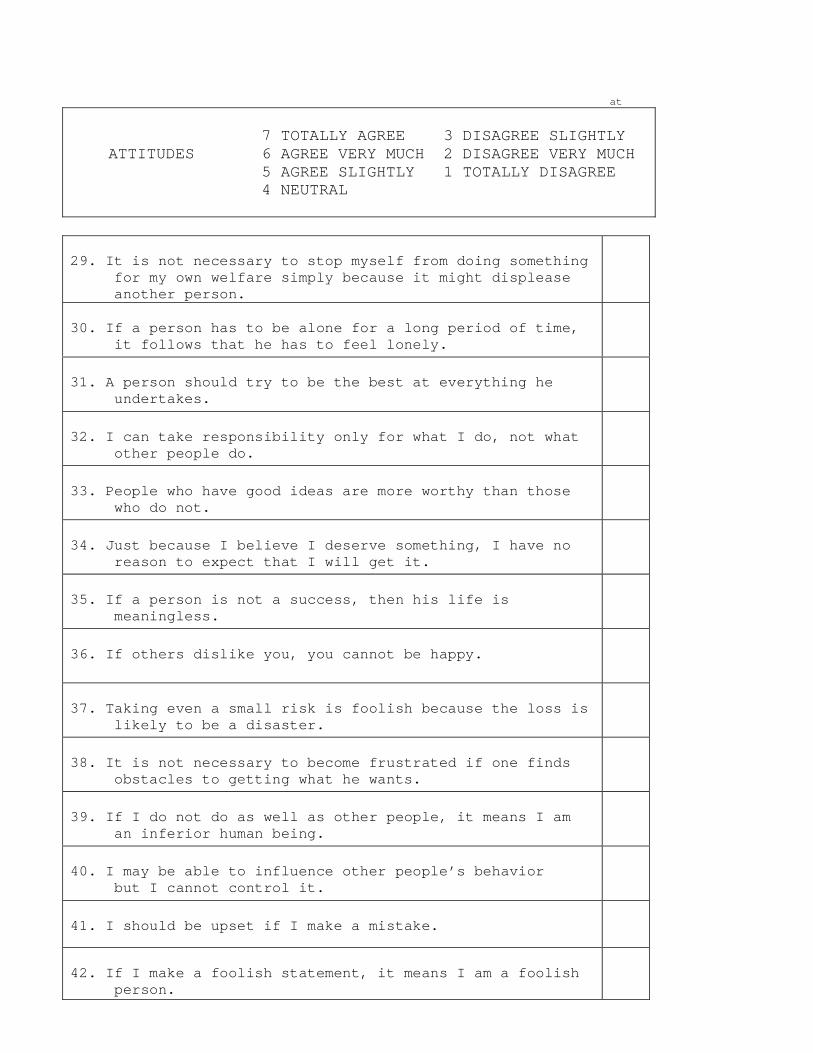
7 TOTALLY AGREE 3 DISAGREE SLIGHTLY ATTITUDES 6 AGREE VERY MUCH 2 DISAGREE VERY MUCH 5 AGREE SLIGHTLY 1 TOTALLY DISAGREE 4 NEUTRAL
29. It is not necessary to stop myself from doing something for my own welfare simply because it might displease another person.
30. If a person has to be alone for a long period of time, it follows that he has to feel lonely.
31. A person should try to be the best at everything he undertakes.
32. I can take responsibility only for what I do, not what other people do.
33. People who have good ideas are more worthy than those who do not.
34. Just because I believe I deserve something, I have no reason to expect that I will get it.
35. If a person is not a success, then his life is meaningless.
36. If others dislike you, you cannot be happy.
37. Taking even a small risk is foolish because the loss is likely to be a disaster.
38. It is not necessary to become frustrated if one finds obstacles to getting what he wants.
39. If I do not do as well as other people, it means I am an inferior human being.
40. I may be able to influence other people’s behavior but I cannot control it.
41. I should be upset if I make a mistake.
42. If I make a foolish statement, it means I am a foolish person.

at
7 TOTALLY AGREE 3 DISAGREE SLIGHTLY ATTITUDES 6 AGREE VERY MUCH 2 DISAGREE VERY MUCH 5 AGREE SLIGHTLY 1 TOTALLY DISAGREE 4 NEUTRAL
43. A person cannot change his emotional reactions even if he knows they are harmful to him.
44. I should always have complete control over my feelings.
45. My life is wasted unless I am a success.
46. If people whom I care about do not care for me, it is awful.
47. If I fail at my work, then I am a failure as a person.
48. I can enjoy myself even when others do not like me.
49. If I don’t set the highest standards for myself, I am likely to end up a second-rate person.
50. I do not need other people’s approval for me to be happy.
51. If I do not do well all the time, people will not respect me.
52. A person should think less of himself if other people do not accept him.
53. One should look for a practical solution to problems rather than a perfect solution.
54. My value as a person depends greatly on what others think of me.
55. If I do well, it is probably due to chance: if I do badly, it is probably my own fault.
56. A person should do well at everything he undertakes.
at
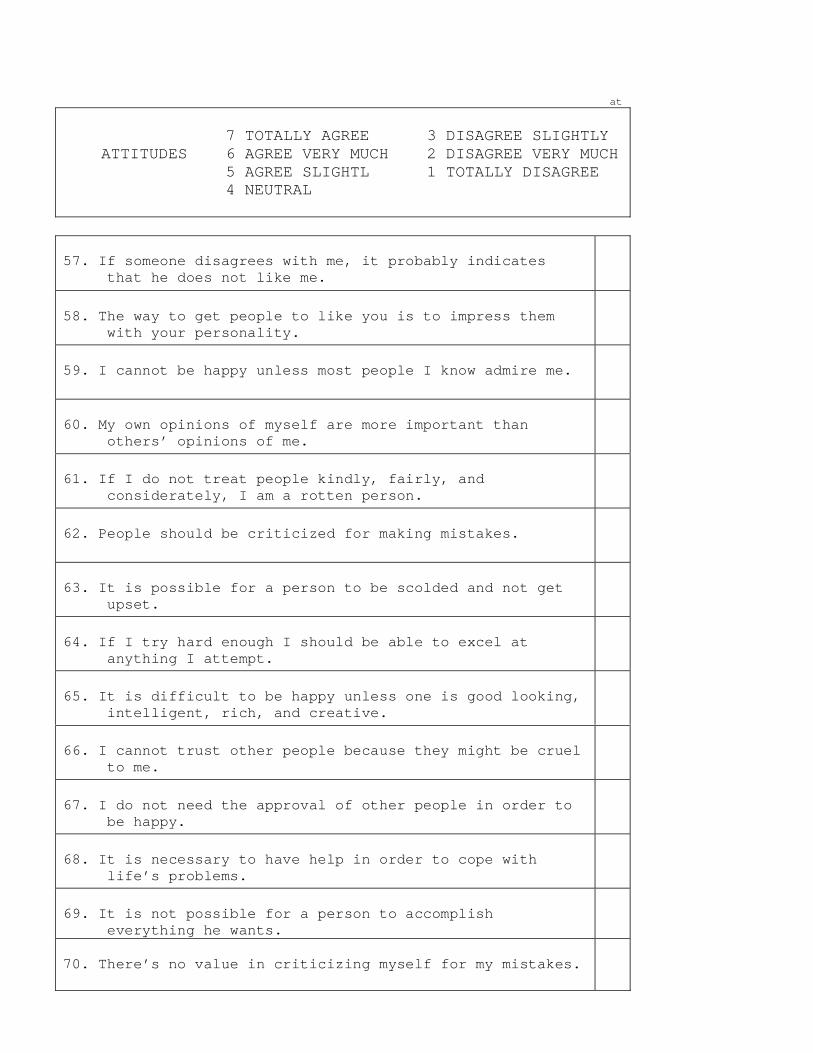
7 TOTALLY AGREE 3 DISAGREE SLIGHTLY ATTITUDES 6 AGREE VERY MUCH 2 DISAGREE VERY MUCH 5 AGREE SLIGHTL 1 TOTALLY DISAGREE 4 NEUTRAL
57. If someone disagrees with me, it probably indicates that he does not like me.
58. The way to get people to like you is to impress them with your personality.
59. I cannot be happy unless most people I know admire me.
60. My own opinions of myself are more important than others’ opinions of me.
61. If I do not treat people kindly, fairly, and considerately, I am a rotten person.
62. People should be criticized for making mistakes.
63. It is possible for a person to be scolded and not get upset.
64. If I try hard enough I should be able to excel at anything I attempt.
65. It is difficult to be happy unless one is good looking, intelligent, rich, and creative.
66. I cannot trust other people because they might be cruel to me.
67. I do not need the approval of other people in order to be happy.
68. It is necessary to have help in order to cope with life’s problems.
69. It is not possible for a person to accomplish everything he wants.
70. There’s no value in criticizing myself for my mistakes.
at
7 TOTALLY AGREE 3 DISAGREE SLIGHTLY ATTITUDES 6 AGREE VERY MUCH 2 DISAGREE VERY MUCH 5 AGREE SLIGHTL 1 TOTALLY DISAGREE 4 NEUTRAL
71. It is awful to be disapproved of by people important to you.
72. If you don’t have other people to lean on, you are bound to be sad.
73. People will like me even if I am not successful.
74. A person cannot survive without the help of other people.
75. I should set higher standards for myself than other people.
76. If other people know what you are really like, they will think less of you.
77. Making mistake is fine because I can learn from them.
78. If I put other people’s needs before my own, they should help me when I want them to do something for me.
79. Whenever I take a chance or risk I am only looking for trouble.
80. If a person avoids problems, the problems tend to go away.
81. I have to impress new acquaintances with my charm, intelligence, or wit or they won’t like me.
82. People can learn to be completely independent.
83. People should be criticized for their mistakes.
84. No one can hurt me with words. I hurt myself by the way I choose to react to their words.
at
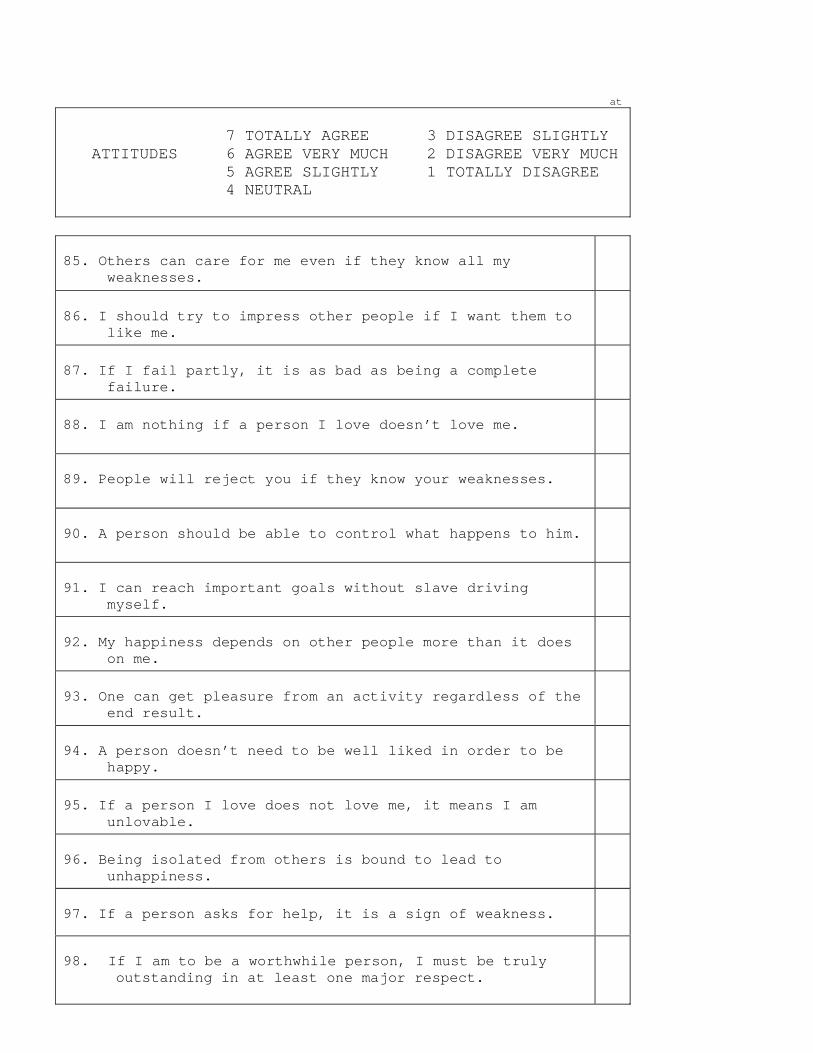
7 TOTALLY AGREE 3 DISAGREE SLIGHTLY ATTITUDES 6 AGREE VERY MUCH 2 DISAGREE VERY MUCH 5 AGREE SLIGHTLY 1 TOTALLY DISAGREE 4 NEUTRAL
85. Others can care for me even if they know all my weaknesses.
86. I should try to impress other people if I want them to like me.
87. If I fail partly, it is as bad as being a complete failure.
88. I am nothing if a person I love doesn’t love me.
89. People will reject you if they know your weaknesses.
90. A person should be able to control what happens to him.
91. I can reach important goals without slave driving myself.
92. My happiness depends on other people more than it does on me.
93. One can get pleasure from an activity regardless of the end result.
94. A person doesn’t need to be well liked in order to be happy.
95. If a person I love does not love me, it means I am unlovable.
96. Being isolated from others is bound to lead to unhappiness.
97. If a person asks for help, it is a sign of weakness.
98. If I am to be a worthwhile person, I must be truly outstanding in at least one major respect.
at
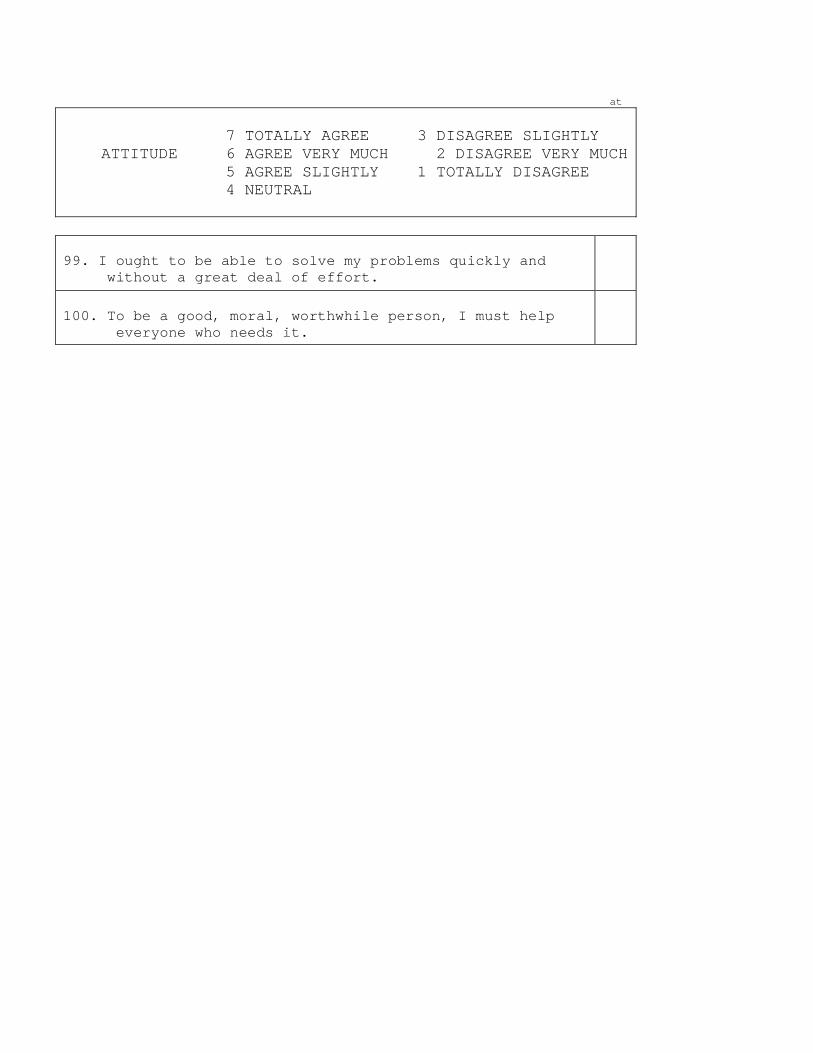
7 TOTALLY AGREE 3 DISAGREE SLIGHTLY ATTITUDE 6 AGREE VERY MUCH 2 DISAGREE VERY MUCH 5 AGREE SLIGHTLY 1 TOTALLY DISAGREE 4 NEUTRAL
99. I ought to be able to solve my problems quickly and without a great deal of effort.
100. To be a good, moral, worthwhile person, I must help everyone who needs it.
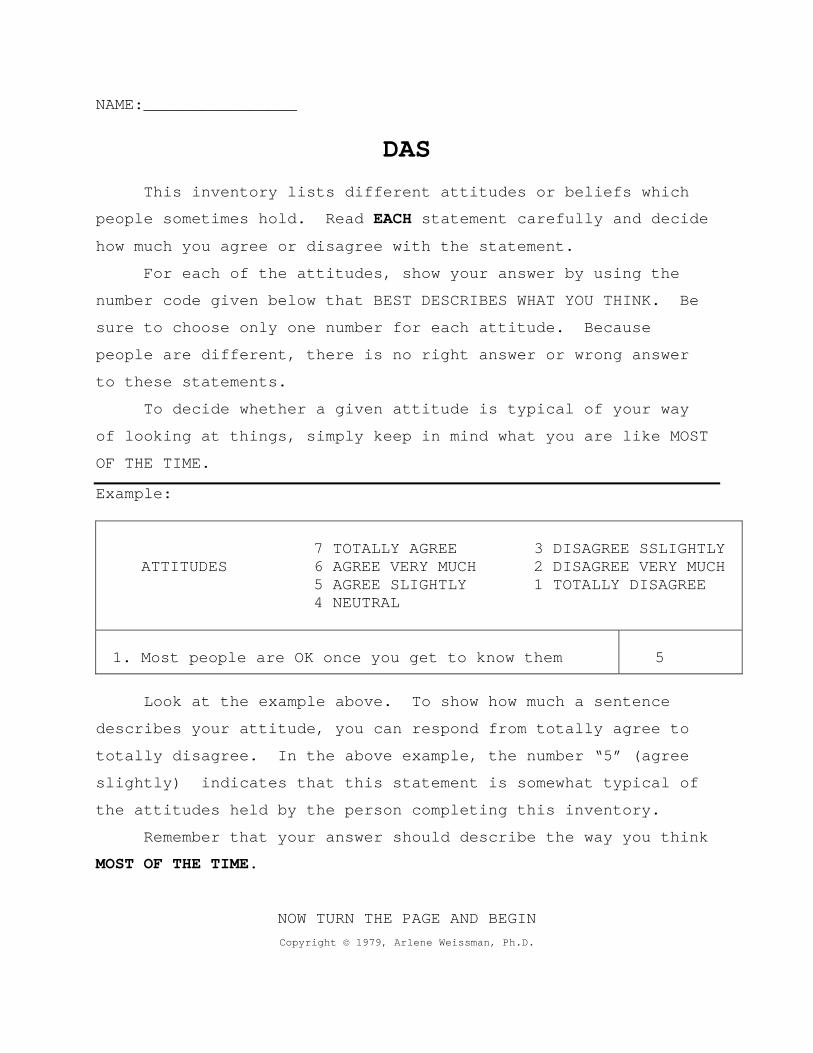
NAME:________________
DAS
This inventory lists different attitudes or beliefs which
people sometimes hold. Read EACH statement carefully and decide
how much you agree or disagree with the statement.
For each of the attitudes, show your answer by using the
number code given below that BEST DESCRIBES WHAT YOU THINK. Be
sure to choose only one number for each attitude. Because
people are different, there is no right answer or wrong answer
to these statements.
To decide whether a given attitude is typical of your way
of looking at things, simply keep in mind what you are like MOST
OF THE TIME.
Example: 7 TOTALLY AGREE 3 DISAGREE SSLIGHTLY ATTITUDES 6 AGREE VERY MUCH 2 DISAGREE VERY MUCH 5 AGREE SLIGHTLY 1 TOTALLY DISAGREE 4 NEUTRAL 1. Most people are OK once you get to know them
5
Look at the example above. To show how much a sentence
describes your attitude, you can respond from totally agree to
totally disagree. In the above example, the number “5” (agree
slightly) indicates that this statement is somewhat typical of
the attitudes held by the person completing this inventory.
Remember that your answer should describe the way you think
MOST OF THE TIME.
NOW TURN THE PAGE AND BEGIN Copyright © 1979, Arlene Weissman, Ph.D.

AT, 3/20/00
100-ITEM DYSFUNCTIONAL ATTITUDE SCALE (DAS)*
Scoring Instructions
The score is the sum of the answers given for certain items plus the sum of the reverse answers for the remaining items. Items scored in reverse (i.e. 1=7, 2=6, 3=5, 4=4, 5=3, 6=2, 7=1): 1, 4, 6, 8, 9, 12, 14, 17, 21, 24, 25, 26, 27, 29, 32, 34, 38, 40, 48, 50, 53, 60, 63, 67, 69, 70, 73, 77, 82, 84, 85, 91, 93 and 94. Items which are scored as answered: 2, 3, 5, 7, 10, 11, 13, 15, 16, 18, 19, 20, 22, 23, 28, 30, 31, 33, 35, 36, 37, 39, 41, 42, 43, 44, 45, 46, 47, 49, 51, 52, 54, 55, 56, 57, 58, 59, 61, 62, 64, 65, 66, 68, 71, 72, 74, 75, 76, 78, 79, 80, 81, 83, 86, 87, 88, 89, 90, 92, 95, 96, 97, 98, 99, 100. If more than one answer is given for any one item, score only the one with the highest point value.

ATTITUDES
TOTALLY AGREE
AGREE VERY
MUCH
TOTALLY AGREE
AGREE
SLIGHTLY
NEUTRAL
DISAGREE
SLIGHTLY
DISAGREE VERY
MUCH
TOTALLY
DISAGREE
REMEMBER, ANSWER EACH STATEMENT
ACCORDING TO THE WAY YOU THINK MOST OF
THE TIME
1. It is difficult to be happy unless
one is good looking, intelligent, rich
and creative.
2. Happiness is more a matter of my
attitude towards myself than the way
other people feel about me.
3. People will probably think less of
me if I make a mistake.
4. If I do not do well all the time,
people will not respect me.
5. Taking even a small risk is foolish
because the loss is likely to be a
disaster.
6. It is possible to gain another
person’s respect without being
especially talented at anything.
7. I cannot be happy unless most people
I know admire me.
DAS-A
ATTITUDES
TOTALLY AGREE
AGREE VERY MUCH
TOTALLY AGREE
AGREE SLIGHTLY
NEUTRAL
DISAGREE SLIGHTLY
DISAGREE VERY MUCH
TOTALLY DISAGREE
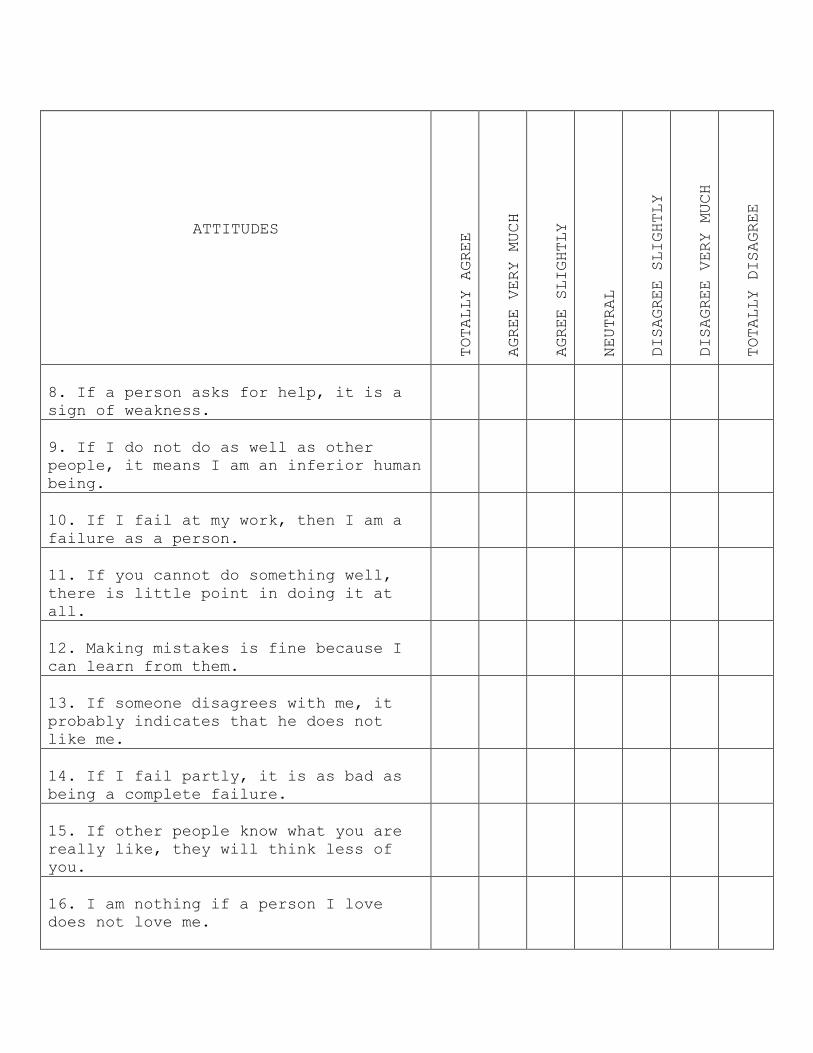
8. If a person asks for help, it is a
sign of weakness.
9. If I do not do as well as other
people, it means I am an inferior human
being.
10. If I fail at my work, then I am a
failure as a person.
11. If you cannot do something well,
there is little point in doing it at
all.
12. Making mistakes is fine because I
can learn from them.
13. If someone disagrees with me, it
probably indicates that he does not
like me.
14. If I fail partly, it is as bad as
being a complete failure.
15. If other people know what you are
really like, they will think less of
you.
16. I am nothing if a person I love
does not love me.

ATTITUDES
TOTALLY AGREE
AGREE VERY MUCH
TOTALLY AGREE
AGREE SLIGHTLY
NEUTRAL
DISAGREE SLIGHTLY
DISAGREE VERY
MUCH
TOTALLY DISAGREE
17. One can get pleasure from an
activity regardless of the result.
18. People should have a
reasonable likelihood of success
before undertaking anything.
19. My value as a person depends
greatly on what others think of
me.
20. If I don’t set the highest
standards for myself, I am likely
to end up a second-rate person.
21. If I am to be a worthwhile
person, I must be truly
outstanding in at least one major
respect.
22. People who have good ideas are
more worthy than those who do not.
23. I should be upset if I make a
mistake.
24. My own opinions of myself are
more important than others’
opinions of me.
25. To be a good, moral,
worthwhile person, I must help
everyone who needs it.
26. If I ask a question, it makes
me look inferior.
ATTITUDES
TOTALLY AGREE
AGREE VERY
MUCH
TOTALLY AGREE
AGREE SLIGHTLY
NEUTRAL
DISAGREE
SLIGHTLY
DISAGREE VERY
MUCH
TOTALLY
DISAGREE
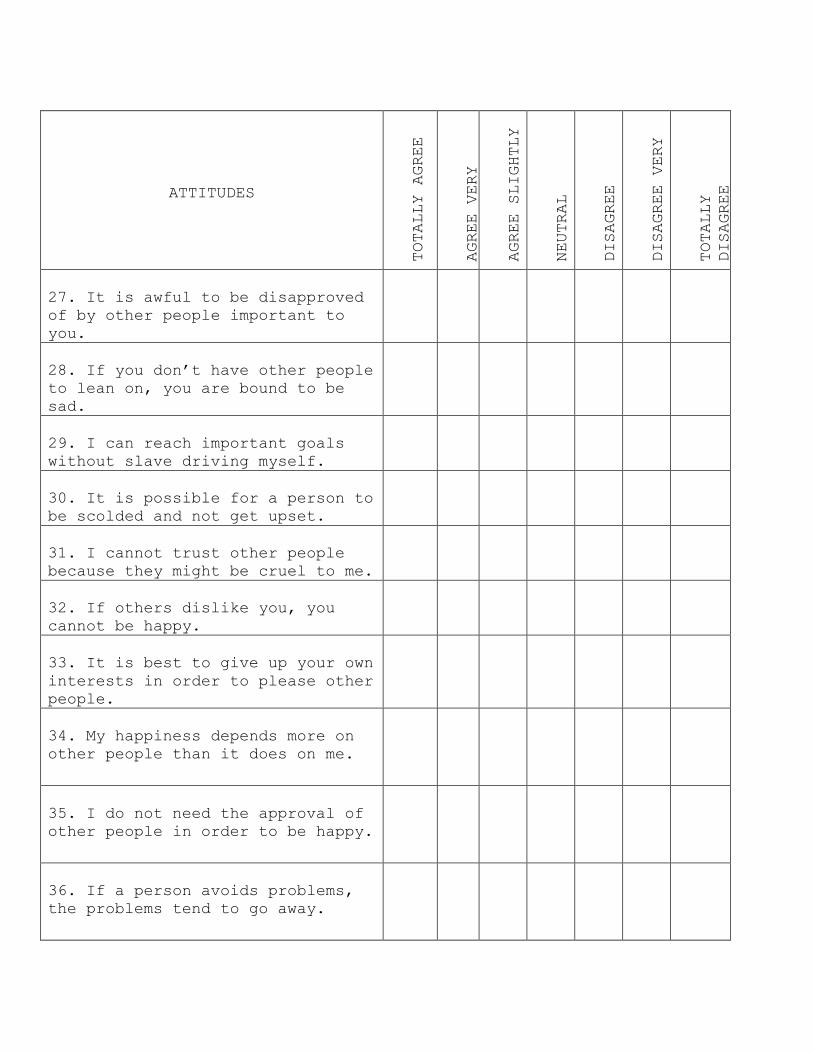
27. It is awful to be disapproved
of by other people important to
you.
28. If you don’t have other people
to lean on, you are bound to be
sad.
29. I can reach important goals
without slave driving myself.
30. It is possible for a person to
be scolded and not get upset.
31. I cannot trust other people
because they might be cruel to me.
32. If others dislike you, you
cannot be happy.
33. It is best to give up your own
interests in order to please other
people.
34. My happiness depends more on
other people than it does on me.
35. I do not need the approval of
other people in order to be happy.
36. If a person avoids problems,
the problems tend to go away.
ATTITUDES
TOTALLY AGREE
AGREE VERY
MUCH
TOTALLY AGREE
AGREE SLIGHTLY
NEUTRAL
DISAGREE
SLIGHTLY
DISAGREE VERY
MUCH
TOTALLY
DISAGREE
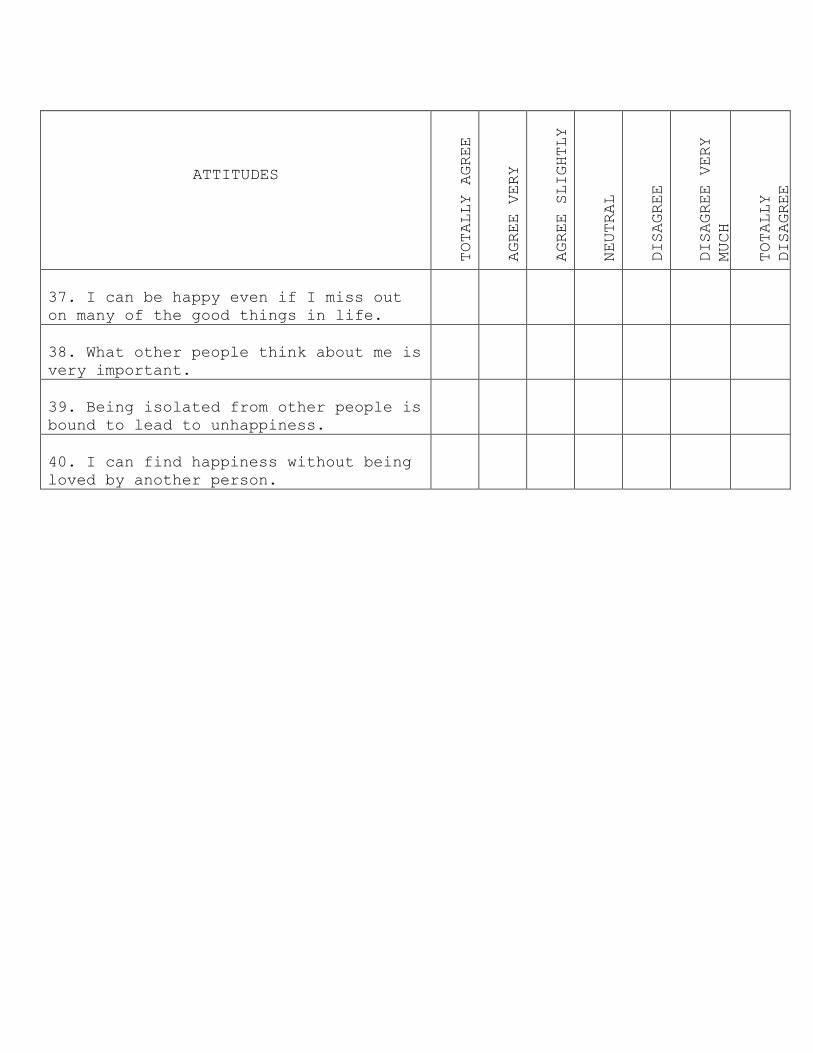
37. I can be happy even if I miss out
on many of the good things in life.
38. What other people think about me is
very important.
39. Being isolated from other people is
bound to lead to unhappiness.
40. I can find happiness without being
loved by another person.
ATTITUDES
TOTALLY AGREE
AGREE VERY
MUCH
TOTALLY AGREE
AGREE
SLIGHTLY
NEUTRAL
DISAGREE
SLIGHTLY
DISAGREE VERY
MUCH
TOTALLY
DISAGREE
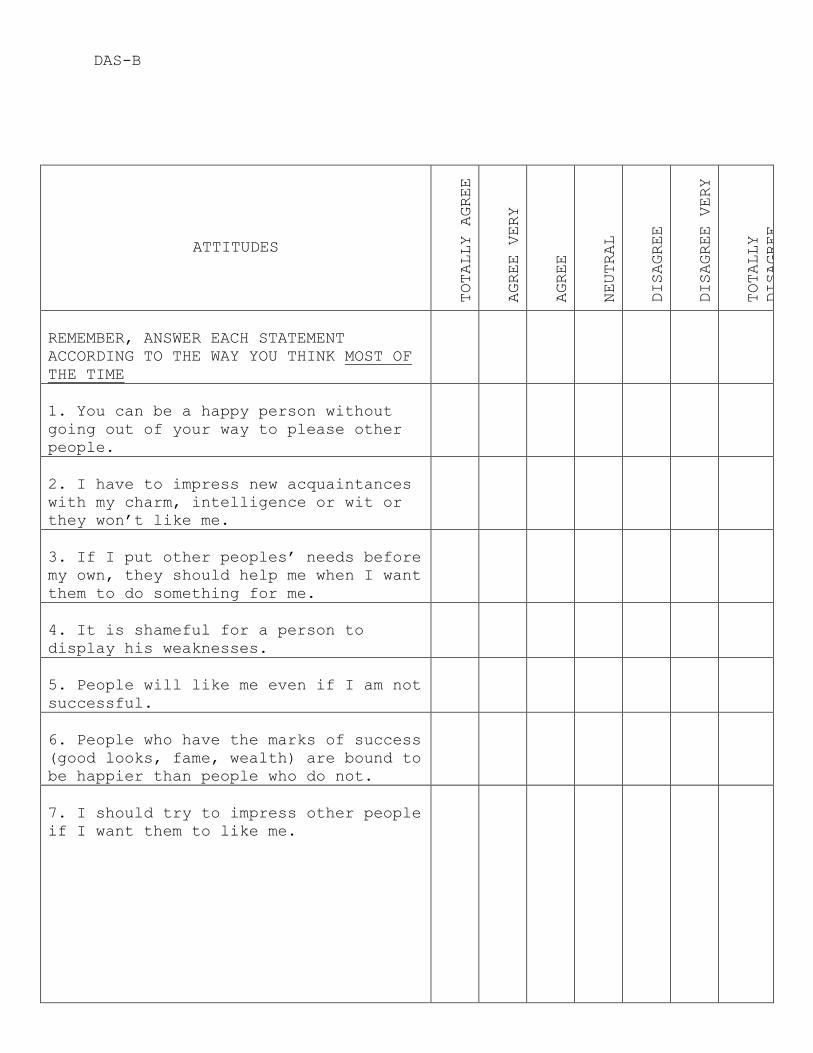
REMEMBER, ANSWER EACH STATEMENT
ACCORDING TO THE WAY YOU THINK MOST OF
THE TIME
1. You can be a happy person without
going out of your way to please other
people.
2. I have to impress new acquaintances
with my charm, intelligence or wit or
they won’t like me.
3. If I put other peoples’ needs before
my own, they should help me when I want
them to do something for me.
4. It is shameful for a person to
display his weaknesses.
5. People will like me even if I am not
successful.
6. People who have the marks of success
(good looks, fame, wealth) are bound to
be happier than people who do not.
7. I should try to impress other people
if I want them to like me.
DAS-B
ATTITUDES
TOTALLY AGREE
AGREE VERY MUCH
TOTALLY AGREE
AGREE SLIGHTLY
NEUTRAL
DISAGREE SLIGHTLY
DISAGREE VERY MUCH
TOTALLY DISAGREE
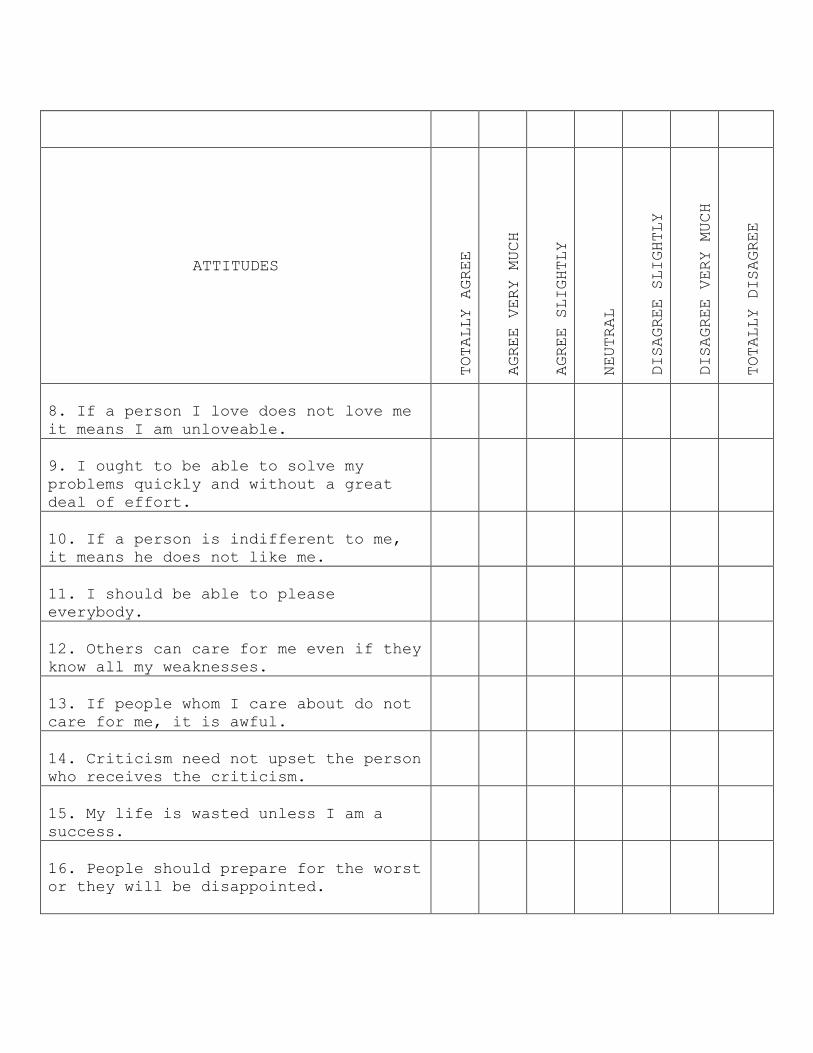
8. If a person I love does not love me
it means I am unloveable.
9. I ought to be able to solve my
problems quickly and without a great
deal of effort.
10. If a person is indifferent to me,
it means he does not like me.
11. I should be able to please
everybody.
12. Others can care for me even if they
know all my weaknesses.
13. If people whom I care about do not
care for me, it is awful.
14. Criticism need not upset the person
who receives the criticism.
15. My life is wasted unless I am a
success.
16. People should prepare for the worst
or they will be disappointed.
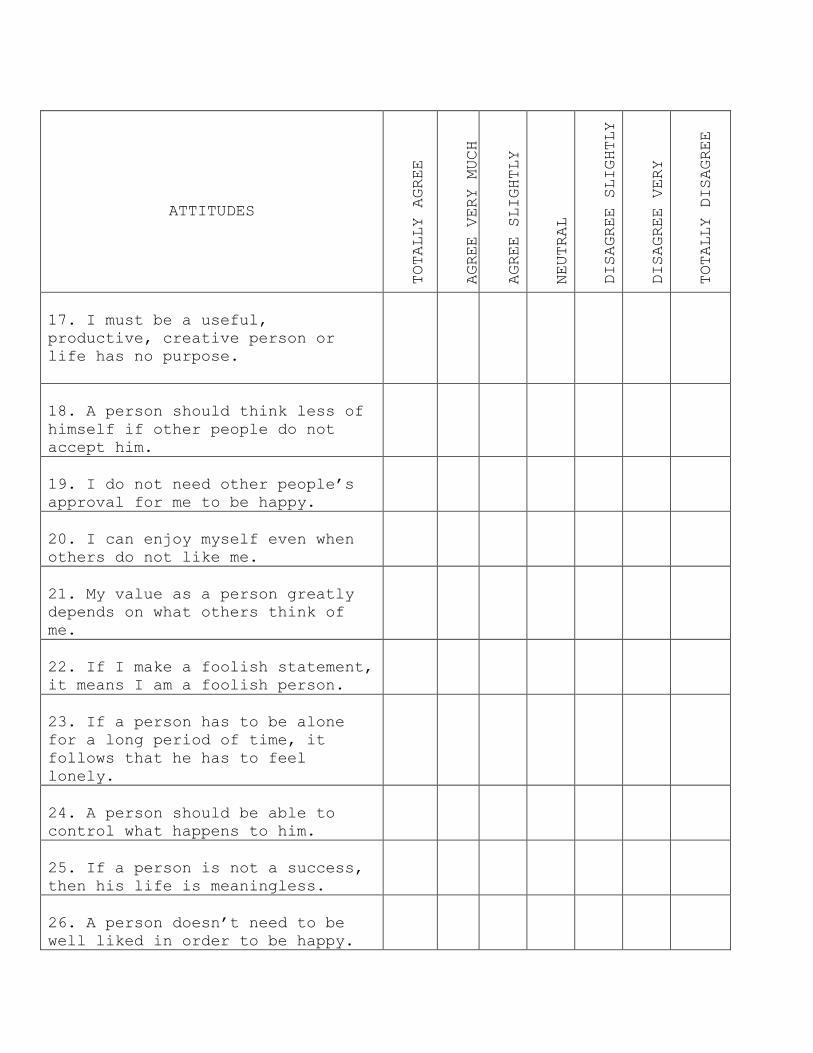
ATTITUDES
TOTALLY AGREE
AGREE VERY MUCH
TOTALLY AGREE
AGREE SLIGHTLY
NEUTRAL
DISAGREE SLIGHTLY
DISAGREE VERY
MUCH
TOTALLY DISAGREE
17. I must be a useful,
productive, creative person or
life has no purpose.
18. A person should think less of
himself if other people do not
accept him.
19. I do not need other people’s
approval for me to be happy.
20. I can enjoy myself even when
others do not like me.
21. My value as a person greatly
depends on what others think of
me.
22. If I make a foolish statement,
it means I am a foolish person.
23. If a person has to be alone
for a long period of time, it
follows that he has to feel
lonely.
24. A person should be able to
control what happens to him.
25. If a person is not a success,
then his life is meaningless.
26. A person doesn’t need to be
well liked in order to be happy.
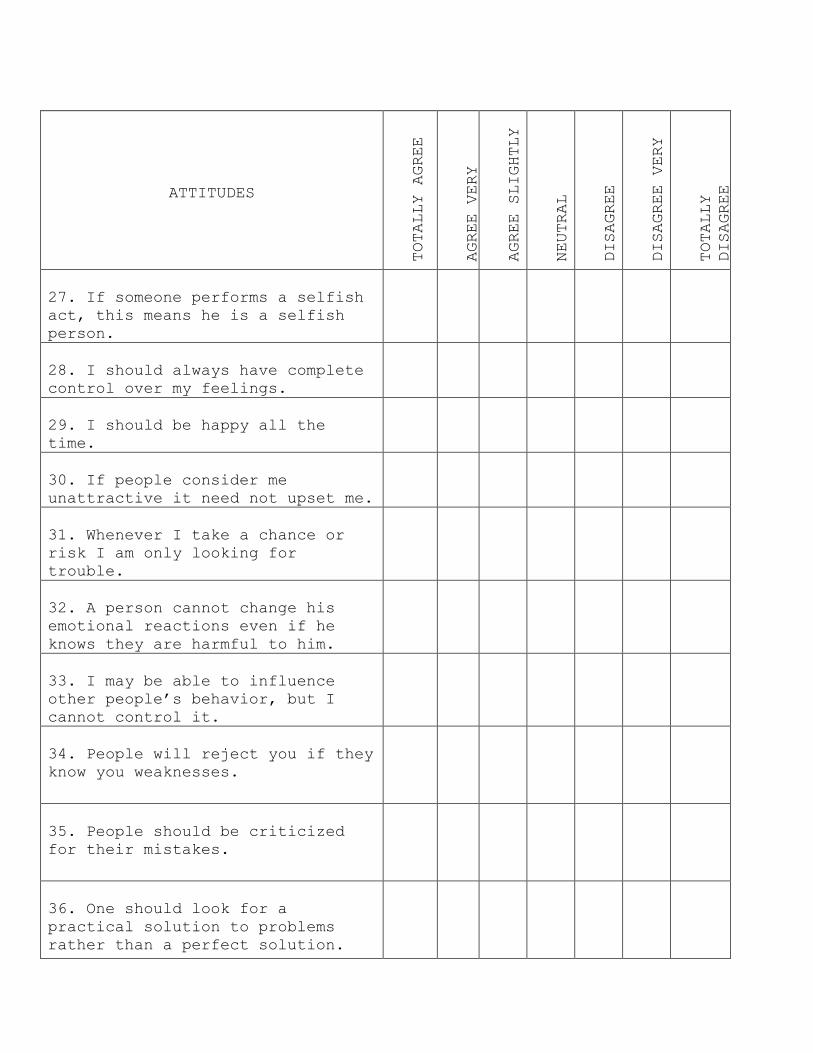
ATTITUDES
TOTALLY AGREE
AGREE VERY
MUCH
TOTALLY AGREE
AGREE SLIGHTLY
NEUTRAL
DISAGREE
SLIGHTLY
DISAGREE VERY
MUCH
TOTALLY
DISAGREE
27. If someone performs a selfish
act, this means he is a selfish
person.
28. I should always have complete
control over my feelings.
29. I should be happy all the
time.
30. If people consider me
unattractive it need not upset me.
31. Whenever I take a chance or
risk I am only looking for
trouble.
32. A person cannot change his
emotional reactions even if he
knows they are harmful to him.
33. I may be able to influence
other people’s behavior, but I
cannot control it.
34. People will reject you if they
know you weaknesses.
35. People should be criticized
for their mistakes.
36. One should look for a
practical solution to problems
rather than a perfect solution.
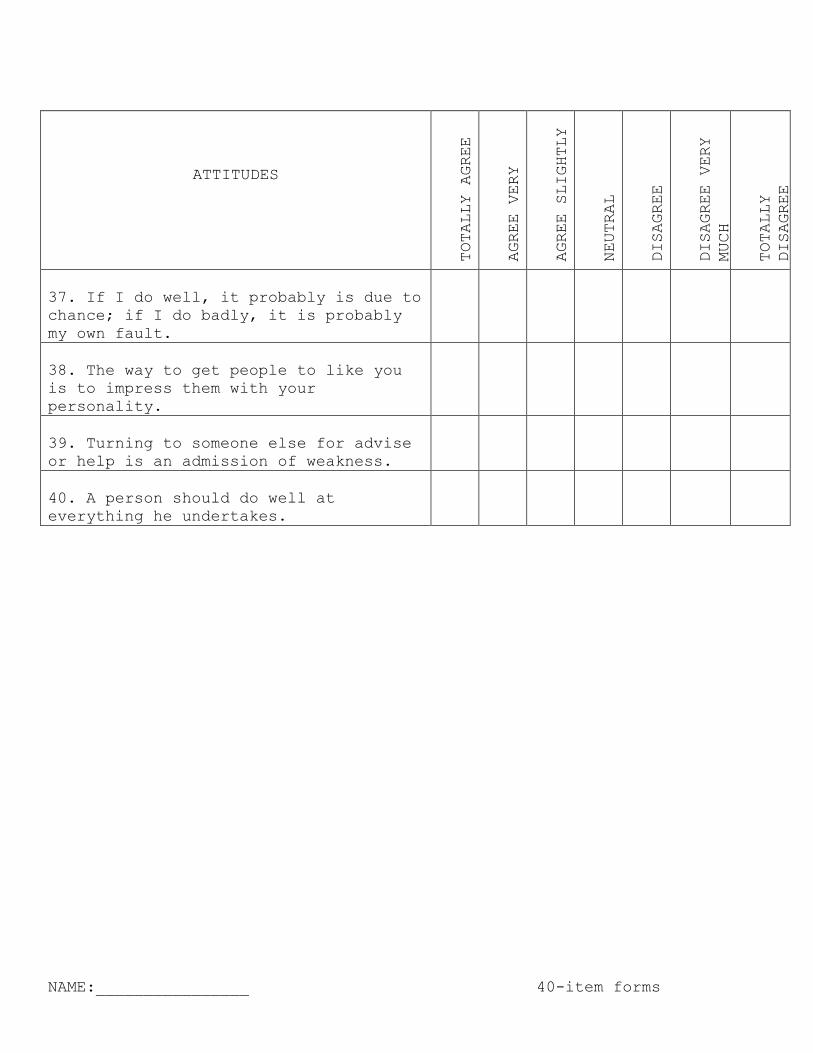
ATTITUDES
TOTALLY AGREE
AGREE VERY
MUCH
TOTALLY AGREE
AGREE SLIGHTLY
NEUTRAL
DISAGREE
SLIGHTLY
DISAGREE VERY
MUCH
TOTALLY
DISAGREE
37. If I do well, it probably is due to
chance; if I do badly, it is probably
my own fault.
38. The way to get people to like you
is to impress them with your
personality.
39. Turning to someone else for advise
or help is an admission of weakness.
40. A person should do well at
everything he undertakes.
NAME:________________ 40-item forms
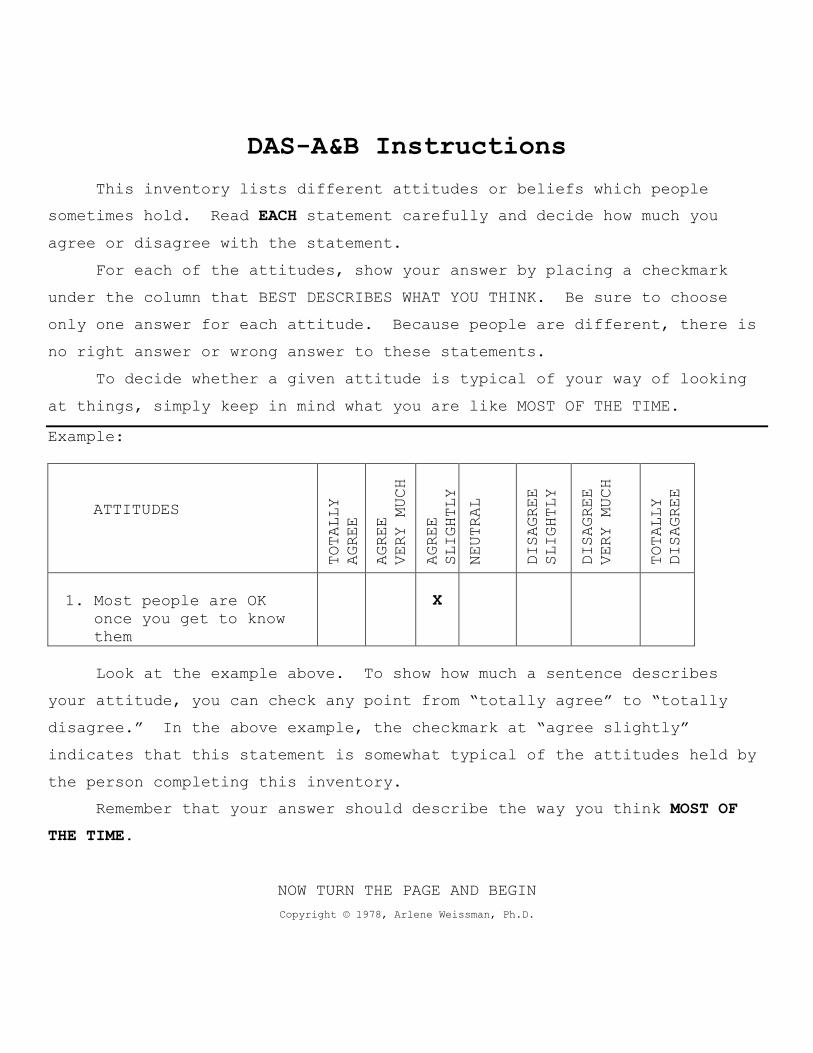
DAS-A&B Instructions
This inventory lists different attitudes or beliefs which people
sometimes hold. Read EACH statement carefully and decide how much you
agree or disagree with the statement.
For each of the attitudes, show your answer by placing a checkmark
under the column that BEST DESCRIBES WHAT YOU THINK. Be sure to choose
only one answer for each attitude. Because people are different, there is
no right answer or wrong answer to these statements.
To decide whether a given attitude is typical of your way of looking
at things, simply keep in mind what you are like MOST OF THE TIME.
Example:
ATTITUDES
TOTALLY
AGREE
AGREE
VERY MUCH
AGREE
SLIGHTLY
NEUTRAL
DISAGREE
SLIGHTLY
DISAGREE
VERY MUCH
TOTALLY
DISAGREE
1. Most people are OK once you get to know
them
X
Look at the example above. To show how much a sentence describes
your attitude, you can check any point from “totally agree” to “totally
disagree.” In the above example, the checkmark at “agree slightly”
indicates that this statement is somewhat typical of the attitudes held by
the person completing this inventory.
Remember that your answer should describe the way you think MOST OF
THE TIME.
NOW TURN THE PAGE AND BEGIN
Copyright © 1978, Arlene Weissman, Ph.D.
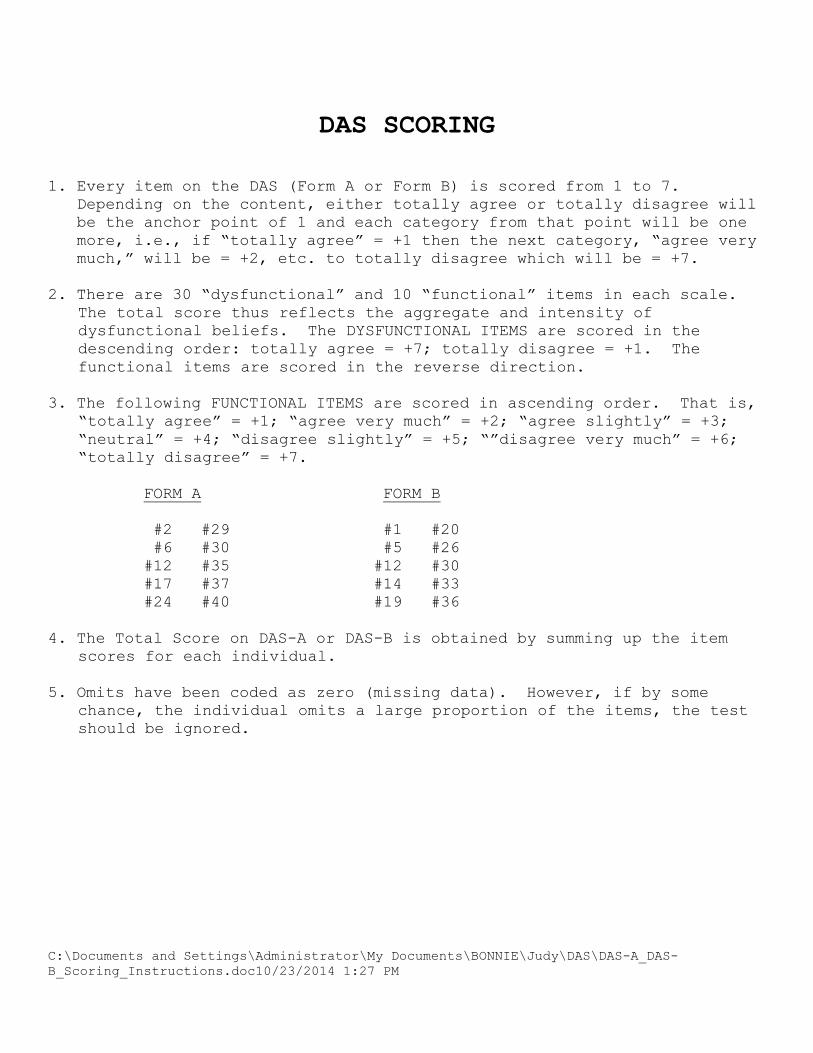
DAS SCORING
1. Every item on the DAS (Form A or Form B) is scored from 1 to 7. Depending on the content, either totally agree or totally disagree will
be the anchor point of 1 and each category from that point will be one
more, i.e., if “totally agree” = +1 then the next category, “agree very
much,” will be = +2, etc. to totally disagree which will be = +7.
2. There are 30 “dysfunctional” and 10 “functional” items in each scale.
The total score thus reflects the aggregate and intensity of
dysfunctional beliefs. The DYSFUNCTIONAL ITEMS are scored in the
descending order: totally agree = +7; totally disagree = +1. The
functional items are scored in the reverse direction.
3. The following FUNCTIONAL ITEMS are scored in ascending order. That is,
“totally agree” = +1; “agree very much” = +2; “agree slightly” = +3;
“neutral” = +4; “disagree slightly” = +5; “”disagree very much” = +6;
“totally disagree” = +7.
FORM A FORM B
#2 #29 #1 #20
#6 #30 #5 #26
#12 #35 #12 #30
#17 #37 #14 #33
#24 #40 #19 #36
4. The Total Score on DAS-A or DAS-B is obtained by summing up the item
scores for each individual.
5. Omits have been coded as zero (missing data). However, if by some
chance, the individual omits a large proportion of the items, the test
should be ignored.
C:\Documents and Settings\Administrator\My Documents\BONNIE\Judy\DAS\DAS-A_DAS-
B_Scoring_Instructions.doc10/23/2014 1:27 PM
ORIGINAL ARTICLE
Measuring Dysfunctional Attitudes in the General Population:The Dysfunctional Attitude Scale (form A) Revised
L. Esther de Graaf Æ Jeffrey Roelofs ÆMarcus J. H. Huibers
Published online: 20 January 2009
� The Author(s) 2009. This article is published with open access at Springerlink.com
Abstract The Dysfunctional Attitude Scale (DAS) was
designed to measure the intensity of dysfunctional atti-
tudes, a hallmark feature of depression. Various
exploratory factor analytic studies of the DAS form A
(DAS-A) yielded mixed results. The current study was set
up to compare the fit of various factor models. We used a
large community sample (N = 8,960) to test the previously
proposed factor models of the DAS-A using confirmatory
factor analysis. The retained model of the DAS-A was
subjected to reliability and validity analyses. All models
showed good fit to the data. Finally, a two-factor solution
of the DAS-A was retained, consisting of 17 items. The
factors demonstrated good reliability and convergent con-
struct validity. Significant associations were found with
depression. Norm-scores were presented. We advocate the
use of a 17-item DAS-A, which proved to be useful in
measuring dysfunctional beliefs. On the basis of previous
psychometric studies, our study provides solid evidence for
a two-factor model of the DAS-A, consisting of ‘depen-
dency’ and ‘perfectionism/performance evaluation’.
Keywords Dysfunctional attitude scale � Depression �General population � Psychometric analysis �Factor structure
Introduction
According to Beck’s view of depression (Beck 1972; Beck
et al. 1979), individuals vulnerable to depression have
maladaptive schemas, which remain dormant until triggered
by stressful life events. Dysfunctional beliefs reflect the
content of these relatively stable schemas. In the past, many
studies were unsuccessful in demonstrating this cognitive
vulnerability; dysfunctional beliefs seemed to covary with
depressive symptoms, suggesting state dependency rather
than vulnerability (for an overview of studies See Ingram
et al. 1998). Building on Beck’s cognitive model, Teasdale
(1988) then suggested that dysfunctional beliefs in vulner-
able individuals could only be measured in the presence of a
trigger (i.e., a dysphoric mood state). During the first episode
of depression, an association between dysfunctional beliefs
and depressed mood is created, and dysfunctional beliefs can
then be easily activated during a subsequent depressed mood
(e.g., Teasdale 1988). Several studies have indeed found
support for this ‘differential activation hypothesis’ using
mood priming methods (Ingram et al. 1998; Lau et al. 2004
Miranda et al. 1990).
The measurement of the presence and intensity of dys-
functional beliefs in depression was advanced by the
development of the Dysfunctional Attitude Scale (Weiss-
man and Beck 1978). The DAS was originally designed as
a measure that would reflect a general cognitive vulnera-
bility factor to depression. However, there is some
evidence to suggest that individuals vulnerable to depres-
sion may have dysfunctional beliefs only in a few, but not
all, areas of their lives (e.g., Dyck 1992; Power et al. 1995,
1994; Sheppard and Teasdale 2000). Moreover, the DAS
might be too general to adequately test Beck’s cognitive
diathesis-stress theory. Beck (1987) later proposed that
specific dysfunctional beliefs will interact with particular
stressors. Therefore, it is important to focus on specific
rather than general dysfunctional beliefs, in research and
clinical practice. If the DAS is to be used as a marker of
specific vulnerabilities, subscales of the DAS measuring
L. E. de Graaf (&) � J. Roelofs � M. J. H. Huibers
Department of Clinical Psychological Science, Maastricht
University, P.O. Box 616, 6200 MD Maastricht, The Netherlands
e-mail: [email protected]
123
Cogn Ther Res (2009) 33:345–355
DOI 10.1007/s10608-009-9229-y

specific patterns of maladaptive thinking need to be
identified.
Several studies have aimed to investigate the factor
structure of the DAS. It is noteworthy to mention that the
original form of the DAS, which consists of 100 items, has
been refined into two 40-item parallel forms (i.e., DAS-A
and DAS-B) by Weissman (1979). Previous research has
predominantly relied on the DAS-A. Consequently, most
research on the psychometric properties of the DAS has
been done with the DAS-A.
The DAS-A has been subjected to exploratory factor
analysis by various researchers, which yielded mixed
results. Two-factor (e.g., Cane et al. 1986; Imber et al.
1990; Raes et al. 2005; Vaglum and Falkum 1999), three-
factor (e.g., Power et al. 1994), and four-factor (e.g.,
Chioqueta and Stiles 2006; Oliver and Baumgart 1985;
Parker et al. 1984) solutions of the DAS-A have been
proposed. Moreover, some studies experienced difficulties
in determining the number of factors to retain (e.g., Floyd
et al. 2004). There are a number of methodological issues
that might explain the variability in results from psycho-
metric studies. First, most studies relied on the eigenvalue
[1.0 or the Scree test to determine the number of factors to
retain (e.g., Chioqueta and Stiles 2006; Floyd et al. 2004;
Raes et al. 2005; Vaglum and Falkum 1999). These
methods have been criticized for being too subjective and
possibly leading to an over-extraction of the number of
factors (See Zwick and Velicer 1986). Second, the rever-
sely keyed items in the DAS-A might be problematic. In
different factor models (i.e., Chioqueta and Stiles 2006;
Oliver and Baumgart 1985; Power et al. 1994) these items
load on one-factor, possibly representing a ‘method’ factor
rather than a content factor. Third, some studies have
included too few individuals to properly conduct explor-
atory factor analysis (e.g., Floyd et al. 2004; Oliver and
Baumgart 1985; Parker et al. 1984; Power et al. 1994; Raes
et al. 2005). It has been recommended to have at least 300
cases, and 1,000 cases is regarded as excellent (Comrey
and Lee 1992; Field 2000). Regarding confirmatory factor
analysis, many fit indices are favorably influenced by
having larger sample sizes, desirably more than 200 cases
(Marsh et al. 1988, 1998). However, it has been difficult for
researchers to determine a rule of thumb regarding the ratio
of sample size to number of indicators (e.g., See Meade
and Bauer 2007). Despite this variability, there seems to be
some consistency with respect to the content of the
obtained factors across studies. That is, there are two strong
factors representing ‘performance or achievement’ and
‘(need for) approval by others’.
Taken together, there is a need for large-scale studies that
rely on more stringent methods for examining the psycho-
metric properties of the DAS-A. Confirmatory factor
analysis is a more stringent procedure for testing the factor
structure of an instrument than exploratory factor analysis,
since it relies on a priori information and provides multiple
goodness-of fit indices. Therefore, we will subject previ-
ously proposed factor models to confirmatory factor analysis
with data from a large community sample. To the authors’
best knowledge this is the first confirmatory factor analytic
investigation of the DAS-A. We will subject the best fitting
model of the DAS-A to reliability and validity analyses. We
will establish the internal consistency and convergent con-
struct validity. Norm-scores will be assessed and we will
explore the extent to which the final model of the DAS-A is
associated with depression, controlling for demographic
factors. We will use demographic factors that were found to
be significant correlates of depression in a large epidemio-
logical community-based study conducted in the
Netherlands (NEMESIS, Bijl et al. 1998). In line with other
studies (e.g., Blazer et al. 1994; Kessler et al. 1997), they
found female sex, middle age (35–44), low educational level,
being occupationally disabled or without paid employment,
and living without a partner to be associated with depression.
Method
Participants and Procedure
Data were collected as part of a large-scale screening pro-
gram to recruit participants for a study, in which the
effectiveness of computerized cognitive behavioral therapy
for depression will be investigated. A random selection of
individuals in the general population (age 18–65) was sent
an invitation letter to complete a screening questionnaire via
the Internet. Six municipalities in the Southern part of the
Netherlands cooperated by providing names and addresses
of their residents. The online screening was only accessible
by using the unique log-in codes provided in each invitation
letter, which could be used just once. This large Internet-
based screening was completed by 8,960 (full response rate
8%) individuals in the Dutch general population. We com-
pared the demographic variables of our sample and the
population in the Southern part of the Netherlands (Statistics
Netherlands; www.cbs.nl). No major discrepancies on
demographic variables could be detected.
The screening questionnaire consisted of variables
concerning depression, dysfunctional attitudes and demo-
graphic data. The Medical and Ethical Committee
approved the study protocol. Individuals were not com-
pensated for participation.
Measures
Data collection was cross-sectional and took place via the
Internet. All participants completed the Dysfunctional
346 Cogn Ther Res (2009) 33:345–355
123
Attitude Scale form A, the Diagnostic Inventory for
Depression, and completed questions concerning demo-
graphic variables (i.e., age, gender, nationality, marital
status, education and employment status).
Dysfunctional Attitude Scale form A
The Dysfunctional Attitude Scale form A (DAS-A) is a
self-report scale designed to measure the presence and
intensity of dysfunctional attitudes. The DAS-A consists of
40 items and each item consists of a statement and a 7-
point Likert scale (7 = fully agree; 1 = fully disagree).
Ten items are reversely coded (2, 6, 12, 17, 24, 29, 30, 35,
37 and 40). The total score is the sum of the 40-items with
a range of 40–280. The higher the score, the more dys-
functional attitudes an individual possesses (Weissman and
Beck 1978). Internal consistency, test-retest reliability, and
average item-total correlations of the DAS-A were satis-
factory in different samples (e.g., Cane et al. 1986; Oliver
and Baumgart 1985). We used the Dutch version of the
DAS-A translated by Raes et al. (2005) which has good
psychometric properties.
Diagnostic Inventory for Depression
The Diagnostic Inventory for Depression (DID) is a 38-
item self-report scale designed to measure DSM-IV
symptom inclusion criteria for a major depressive episode.
The DID consists of 19 symptom severity items, 3 symp-
tom frequency items, 8 items measuring interference in
daily functioning due to depression, and 8 quality-of-life
items. Specified cut-offs to determine the presence or
absence of each DSM-IV criterion can be used to diagnose
major depressive episode. By adding up the 19 symptom
severity items, the severity of depression can be assessed,
ranging from 0 (no depression) to 76 (severely depressed)
(Sheeran and Zimmerman 2002; Zimmerman et al. 2004).
Psychometric properties of the DID are good in terms of
internal consistency, test-retest reliability, convergent and
discriminant validity, and diagnostic performance (Sheeran
and Zimmerman 2002; Zimmerman et al. 2004, 2006).
Using the specified cut-offs of the DID (See Zimmer-
man et al. 2004), which follow the DSM-IV algorithm, we
were able to determine the prevalence of major depressive
episode in the current sample.
Analyses
Confirmatory Factor Analysis
The robustness of previously published factor models was
examined by conducting confirmatory factor analysis by
means of LISREL (version 8.54, Joreskog and Sorbom
1999). First the one-factor model of the DAS-A was tested,
followed by the following seven factor models: the two-
factor models of Imber et al. (1990, details were provided
by Paul A. Pilkonis), Vaglum and Falkum (1999), Cane
et al. (1986), and Raes et al. (2005), the three-factor model
of Power et al. (1994), and the four-factor models of
Chioqueta and Stiles (2006) and Parker et al. (1984). A
maximum-likelihood estimation method was adopted. A
number of fit indices was used to evaluate the goodness-of
fit, including (a) the Root Mean Square Error of Approxi-
mation (RMSEA); (b) the Comparative Fit Index (CFI); (c)
the Non-Normed Fit Index (NNFI); (d) the Goodness-of Fit
Index (GFI); and (e) the Expected Cross-Validation Index
(ECVI). Kelloway (1998) indicates that RMSEA values of
\0.10 represent a good fit, while values below .05 repre-
sent a very good fit to the data. Furthermore, a well-fitting
model should have CFI, NNFI and GFI values above .90
(values above .95 are indicative of a good to very good fit)
(Kelloway 1998). The ECVI is a relative measure to
compare competing models; the model with the lowest
value has the best fit. However, since the models show a
large variability in number of items, it is risky to rely on the
ECVI only. Thus, based on all fit indices, the best fitting
model was retained in all following analyses.
Since many studies, especially treatment studies, rely on
total scores of cognitive measures, we then subjected the
one-factor model of the retained DAS-A to confirmatory
factor analysis. A likelihood ratio test (LRT), then, was
used to compare a more complex model (the retained factor
solution) with a simpler model (one-factor solution). The
simpler model is a special case of the more complex model
(i.e., ‘‘nested’’). More specifically, under the null-hypoth-
esis that the special model fits as well as the more general
one, the difference between their Chi-square-values is itself
Chi-square distributed with degrees of freedom equal to the
difference between their degrees of freedom.
Reliability, Validity, and Normative Data of the Factors
SPSS (version 12.0.1 for Windows) was used for all
analyses, and the alpha was set to .01 to decrease the
likelihood of type I error. Cronbach’s alpha and corrected
item-total correlations of the factors and of the total score
of the retained DAS-A were computed. Convergent con-
struct validity was obtained by computing Pearson
correlation coefficient with the severity of depression
(DID). The degree to which dysfunctional attitudes could
discriminate between depressed and non-depressed indi-
viduals was examined by comparing the means of the
factors of the retained DAS-A. Normative data were cal-
culated by computing quintiles of the factors as well as for
the DAS-A total score.
Cogn Ther Res (2009) 33:345–355 347
123
Associations of the DAS Factors with Depression Severity
To examine the unique association between dysfunctional
attitudes and the severity of depression, multiple linear
regression analysis was performed. The outcome variable
was the severity of depression as measured with the 19
symptom severity items of the DID. First, scores of the
factors of the retained DAS-A were entered in the first step,
controlling for demographical variables (gender, age,
partner, education and occupational status) in the second
step. Second, to determine the unique additional variance
of the DAS-A after the variance of demographic variables
has been partialled out, these analyses were performed in
reverse order (i.e., demographical variables in the first step
followed by DAS-A scores in the second step). All vari-
ables were standardized prior to the analyses and
standardized coefficients were interpreted.
Results
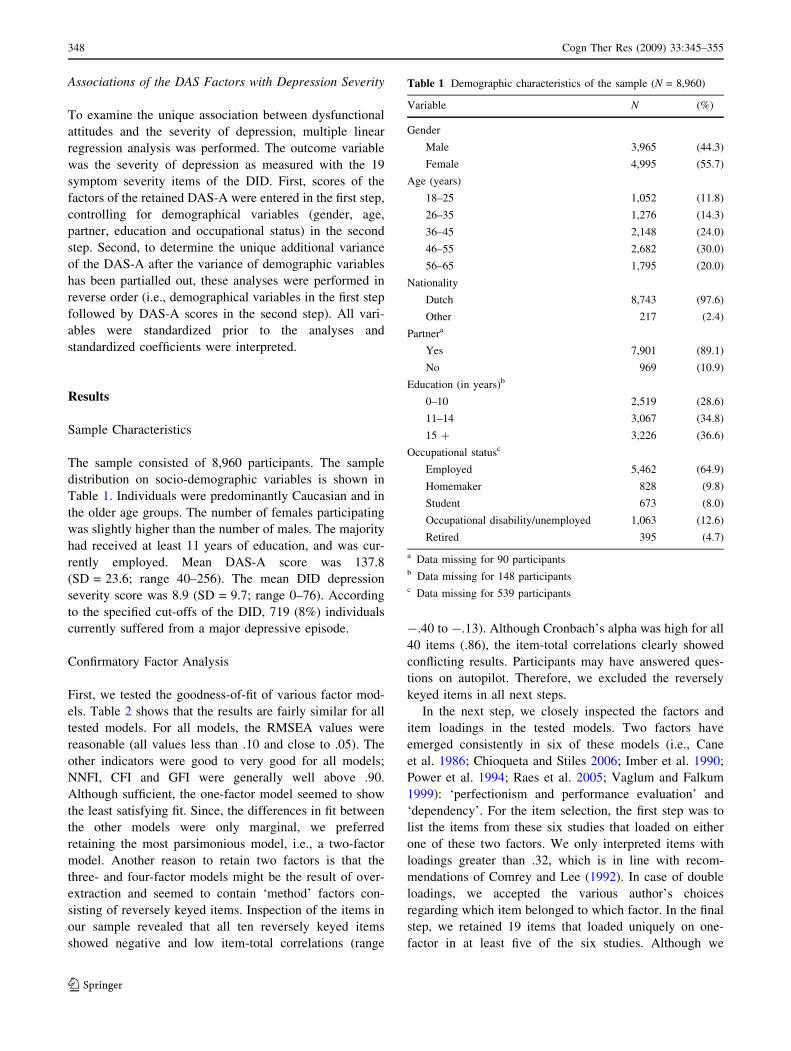
Sample Characteristics
The sample consisted of 8,960 participants. The sample
distribution on socio-demographic variables is shown in
Table 1. Individuals were predominantly Caucasian and in
the older age groups. The number of females participating
was slightly higher than the number of males. The majority
had received at least 11 years of education, and was cur-
rently employed. Mean DAS-A score was 137.8
(SD = 23.6; range 40–256). The mean DID depression
severity score was 8.9 (SD = 9.7; range 0–76). According
to the specified cut-offs of the DID, 719 (8%) individuals
currently suffered from a major depressive episode.
Confirmatory Factor Analysis
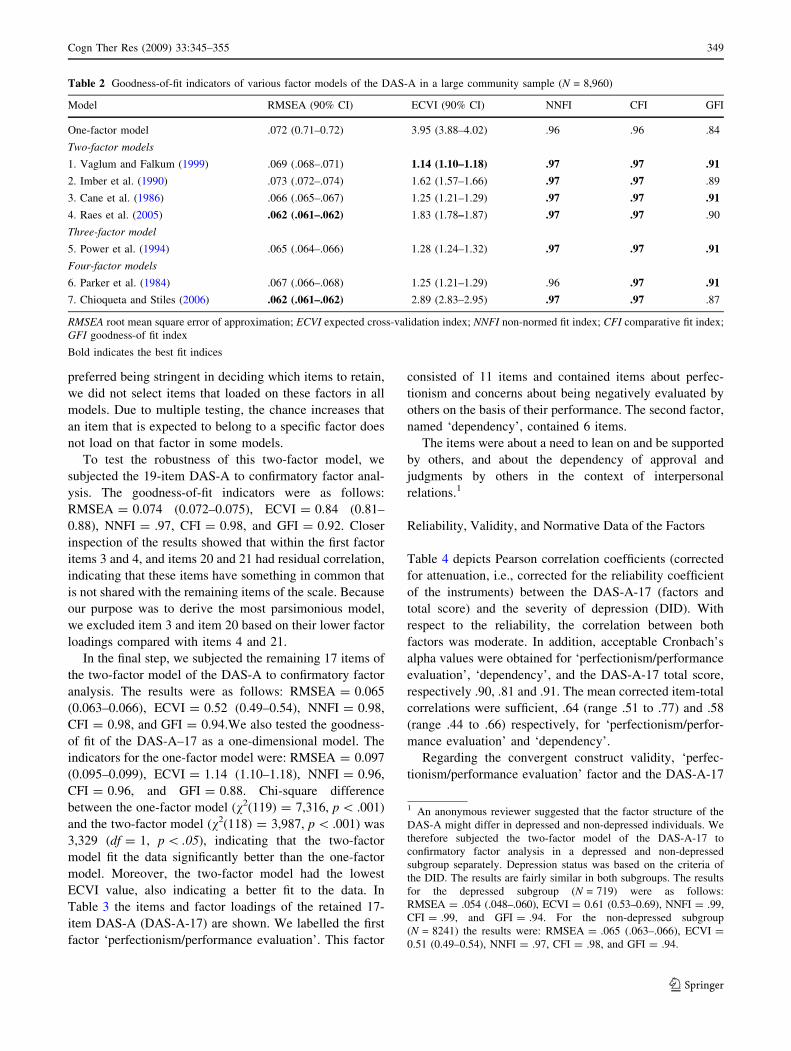
First, we tested the goodness-of-fit of various factor mod-
els. Table 2 shows that the results are fairly similar for all
tested models. For all models, the RMSEA values were
reasonable (all values less than .10 and close to .05). The
other indicators were good to very good for all models;
NNFI, CFI and GFI were generally well above .90.
Although sufficient, the one-factor model seemed to show
the least satisfying fit. Since, the differences in fit between
the other models were only marginal, we preferred
retaining the most parsimonious model, i.e., a two-factor
model. Another reason to retain two factors is that the
three- and four-factor models might be the result of over-
extraction and seemed to contain ‘method’ factors con-
sisting of reversely keyed items. Inspection of the items in
our sample revealed that all ten reversely keyed items
showed negative and low item-total correlations (range
-.40 to -.13). Although Cronbach’s alpha was high for all
40 items (.86), the item-total correlations clearly showed
conflicting results. Participants may have answered ques-
tions on autopilot. Therefore, we excluded the reversely
keyed items in all next steps.
In the next step, we closely inspected the factors and
item loadings in the tested models. Two factors have
emerged consistently in six of these models (i.e., Cane
et al. 1986; Chioqueta and Stiles 2006; Imber et al. 1990;
Power et al. 1994; Raes et al. 2005; Vaglum and Falkum
1999): ‘perfectionism and performance evaluation’ and
‘dependency’. For the item selection, the first step was to
list the items from these six studies that loaded on either
one of these two factors. We only interpreted items with
loadings greater than .32, which is in line with recom-
mendations of Comrey and Lee (1992). In case of double
loadings, we accepted the various author’s choices
regarding which item belonged to which factor. In the final
step, we retained 19 items that loaded uniquely on one-
factor in at least five of the six studies. Although we
Table 1 Demographic characteristics of the sample (N = 8,960)
Variable N (%)
Gender
Male 3,965 (44.3)
Female 4,995 (55.7)
Age (years)
18–25 1,052 (11.8)
26–35 1,276 (14.3)
36–45 2,148 (24.0)
46–55 2,682 (30.0)
56–65 1,795 (20.0)
Nationality
Dutch 8,743 (97.6)
Other 217 (2.4)
Partnera
Yes 7,901 (89.1)
No 969 (10.9)
Education (in years)b
0–10 2,519 (28.6)
11–14 3,067 (34.8)
15 ? 3,226 (36.6)
Occupational statusc
Employed 5,462 (64.9)
Homemaker 828 (9.8)
Student 673 (8.0)
Occupational disability/unemployed 1,063 (12.6)
Retired 395 (4.7)
a Data missing for 90 participantsb Data missing for 148 participantsc Data missing for 539 participants
348 Cogn Ther Res (2009) 33:345–355
123
preferred being stringent in deciding which items to retain,
we did not select items that loaded on these factors in all
models. Due to multiple testing, the chance increases that
an item that is expected to belong to a specific factor does
not load on that factor in some models.
To test the robustness of this two-factor model, we
subjected the 19-item DAS-A to confirmatory factor anal-
ysis. The goodness-of-fit indicators were as follows:
RMSEA = 0.074 (0.072–0.075), ECVI = 0.84 (0.81–
0.88), NNFI = .97, CFI = 0.98, and GFI = 0.92. Closer
inspection of the results showed that within the first factor
items 3 and 4, and items 20 and 21 had residual correlation,
indicating that these items have something in common that
is not shared with the remaining items of the scale. Because
our purpose was to derive the most parsimonious model,
we excluded item 3 and item 20 based on their lower factor
loadings compared with items 4 and 21.
In the final step, we subjected the remaining 17 items of
the two-factor model of the DAS-A to confirmatory factor
analysis. The results were as follows: RMSEA = 0.065
(0.063–0.066), ECVI = 0.52 (0.49–0.54), NNFI = 0.98,
CFI = 0.98, and GFI = 0.94.We also tested the goodness-
of fit of the DAS-A–17 as a one-dimensional model. The
indicators for the one-factor model were: RMSEA = 0.097
(0.095–0.099), ECVI = 1.14 (1.10–1.18), NNFI = 0.96,
CFI = 0.96, and GFI = 0.88. Chi-square difference
between the one-factor model (v2(119) = 7,316, p \ .001)
and the two-factor model (v2(118) = 3,987, p \ .001) was
3,329 (df = 1, p \ .05), indicating that the two-factor
model fit the data significantly better than the one-factor
model. Moreover, the two-factor model had the lowest
ECVI value, also indicating a better fit to the data. In
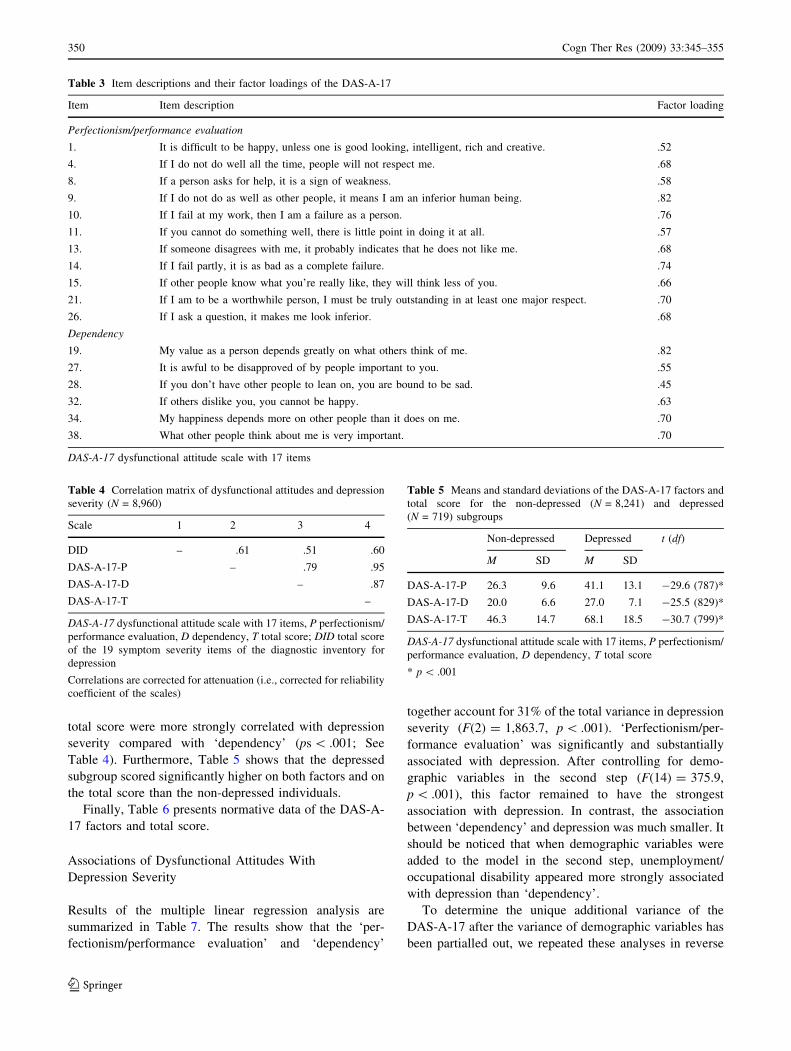
Table 3 the items and factor loadings of the retained 17-
item DAS-A (DAS-A-17) are shown. We labelled the first
factor ‘perfectionism/performance evaluation’. This factor
consisted of 11 items and contained items about perfec-
tionism and concerns about being negatively evaluated by
others on the basis of their performance. The second factor,
named ‘dependency’, contained 6 items.
The items were about a need to lean on and be supported
by others, and about the dependency of approval and
judgments by others in the context of interpersonal
relations.1
Reliability, Validity, and Normative Data of the Factors
Table 4 depicts Pearson correlation coefficients (corrected
for attenuation, i.e., corrected for the reliability coefficient
of the instruments) between the DAS-A-17 (factors and
total score) and the severity of depression (DID). With
respect to the reliability, the correlation between both
factors was moderate. In addition, acceptable Cronbach’s
alpha values were obtained for ‘perfectionism/performance
evaluation’, ‘dependency’, and the DAS-A-17 total score,
respectively .90, .81 and .91. The mean corrected item-total
correlations were sufficient, .64 (range .51 to .77) and .58
(range .44 to .66) respectively, for ‘perfectionism/perfor-
mance evaluation’ and ‘dependency’.
Regarding the convergent construct validity, ‘perfec-
tionism/performance evaluation’ factor and the DAS-A-17
Table 2 Goodness-of-fit indicators of various factor models of the DAS-A in a large community sample (N = 8,960)
Model RMSEA (90% CI) ECVI (90% CI) NNFI CFI GFI
One-factor model .072 (0.71–0.72) 3.95 (3.88–4.02) .96 .96 .84
Two-factor models
1. Vaglum and Falkum (1999) .069 (.068–.071) 1.14 (1.10–1.18) .97 .97 .91
2. Imber et al. (1990) .073 (.072–.074) 1.62 (1.57–1.66) .97 .97 .89
3. Cane et al. (1986) .066 (.065–.067) 1.25 (1.21–1.29) .97 .97 .91
4. Raes et al. (2005) .062 (.061–.062) 1.83 (1.78–1.87) .97 .97 .90
Three-factor model
5. Power et al. (1994) .065 (.064–.066) 1.28 (1.24–1.32) .97 .97 .91
Four-factor models
6. Parker et al. (1984) .067 (.066–.068) 1.25 (1.21–1.29) .96 .97 .91
7. Chioqueta and Stiles (2006) .062 (.061–.062) 2.89 (2.83–2.95) .97 .97 .87
RMSEA root mean square error of approximation; ECVI expected cross-validation index; NNFI non-normed fit index; CFI comparative fit index;
GFI goodness-of fit index
Bold indicates the best fit indices
1 An anonymous reviewer suggested that the factor structure of the
DAS-A might differ in depressed and non-depressed individuals. We
therefore subjected the two-factor model of the DAS-A-17 to
confirmatory factor analysis in a depressed and non-depressed
subgroup separately. Depression status was based on the criteria of
the DID. The results are fairly similar in both subgroups. The results
for the depressed subgroup (N = 719) were as follows:
RMSEA = .054 (.048–.060), ECVI = 0.61 (0.53–0.69), NNFI = .99,
CFI = .99, and GFI = .94. For the non-depressed subgroup
(N = 8241) the results were: RMSEA = .065 (.063–.066), ECVI =
0.51 (0.49–0.54), NNFI = .97, CFI = .98, and GFI = .94.
Cogn Ther Res (2009) 33:345–355 349
123
total score were more strongly correlated with depression
severity compared with ‘dependency’ (ps \ .001; See
Table 4). Furthermore, Table 5 shows that the depressed
subgroup scored significantly higher on both factors and on
the total score than the non-depressed individuals.
Finally, Table 6 presents normative data of the DAS-A-
17 factors and total score.
Associations of Dysfunctional Attitudes With
Depression Severity
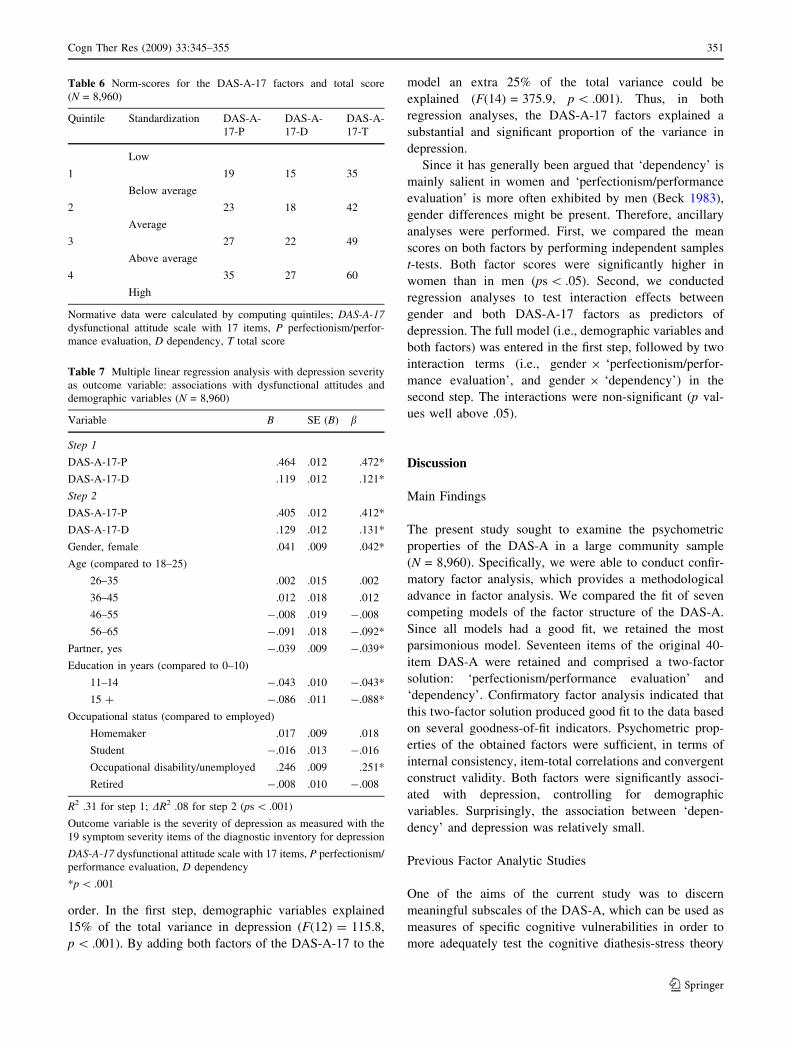
Results of the multiple linear regression analysis are
summarized in Table 7. The results show that the ‘per-
fectionism/performance evaluation’ and ‘dependency’
together account for 31% of the total variance in depression
severity (F(2) = 1,863.7, p \ .001). ‘Perfectionism/per-
formance evaluation’ was significantly and substantially
associated with depression. After controlling for demo-
graphic variables in the second step (F(14) = 375.9,
p \ .001), this factor remained to have the strongest
association with depression. In contrast, the association
between ‘dependency’ and depression was much smaller. It
should be noticed that when demographic variables were
added to the model in the second step, unemployment/
occupational disability appeared more strongly associated
with depression than ‘dependency’.
To determine the unique additional variance of the
DAS-A-17 after the variance of demographic variables has
been partialled out, we repeated these analyses in reverse
Table 3 Item descriptions and their factor loadings of the DAS-A-17
Item Item description Factor loading
Perfectionism/performance evaluation
1. It is difficult to be happy, unless one is good looking, intelligent, rich and creative. .52
4. If I do not do well all the time, people will not respect me. .68
8. If a person asks for help, it is a sign of weakness. .58
9. If I do not do as well as other people, it means I am an inferior human being. .82
10. If I fail at my work, then I am a failure as a person. .76
11. If you cannot do something well, there is little point in doing it at all. .57
13. If someone disagrees with me, it probably indicates that he does not like me. .68
14. If I fail partly, it is as bad as a complete failure. .74
15. If other people know what you’re really like, they will think less of you. .66
21. If I am to be a worthwhile person, I must be truly outstanding in at least one major respect. .70
26. If I ask a question, it makes me look inferior. .68
Dependency
19. My value as a person depends greatly on what others think of me. .82
27. It is awful to be disapproved of by people important to you. .55
28. If you don’t have other people to lean on, you are bound to be sad. .45
32. If others dislike you, you cannot be happy. .63
34. My happiness depends more on other people than it does on me. .70
38. What other people think about me is very important. .70
DAS-A-17 dysfunctional attitude scale with 17 items
Table 4 Correlation matrix of dysfunctional attitudes and depression
severity (N = 8,960)
Scale 1 2 3 4
DID – .61 .51 .60
DAS-A-17-P – .79 .95
DAS-A-17-D – .87
DAS-A-17-T –
DAS-A-17 dysfunctional attitude scale with 17 items, P perfectionism/
performance evaluation, D dependency, T total score; DID total score
of the 19 symptom severity items of the diagnostic inventory for
depression
Correlations are corrected for attenuation (i.e., corrected for reliability
coefficient of the scales)
Table 5 Means and standard deviations of the DAS-A-17 factors and
total score for the non-depressed (N = 8,241) and depressed
(N = 719) subgroups
Non-depressed Depressed t (df)
M SD M SD
DAS-A-17-P 26.3 9.6 41.1 13.1 -29.6 (787)*
DAS-A-17-D 20.0 6.6 27.0 7.1 -25.5 (829)*
DAS-A-17-T 46.3 14.7 68.1 18.5 -30.7 (799)*
DAS-A-17 dysfunctional attitude scale with 17 items, P perfectionism/
performance evaluation, D dependency, T total score
* p \ .001
350 Cogn Ther Res (2009) 33:345–355
123
order. In the first step, demographic variables explained
15% of the total variance in depression (F(12) = 115.8,
p \ .001). By adding both factors of the DAS-A-17 to the
model an extra 25% of the total variance could be
explained (F(14) = 375.9, p \ .001). Thus, in both
regression analyses, the DAS-A-17 factors explained a
substantial and significant proportion of the variance in
depression.
Since it has generally been argued that ‘dependency’ is
mainly salient in women and ‘perfectionism/performance
evaluation’ is more often exhibited by men (Beck 1983),
gender differences might be present. Therefore, ancillary
analyses were performed. First, we compared the mean
scores on both factors by performing independent samples
t-tests. Both factor scores were significantly higher in
women than in men (ps \ .05). Second, we conducted
regression analyses to test interaction effects between
gender and both DAS-A-17 factors as predictors of
depression. The full model (i.e., demographic variables and
both factors) was entered in the first step, followed by two
interaction terms (i.e., gender 9 ‘perfectionism/perfor-
mance evaluation’, and gender 9 ‘dependency’) in the
second step. The interactions were non-significant (p val-
ues well above .05).
Discussion
Main Findings
The present study sought to examine the psychometric
properties of the DAS-A in a large community sample
(N = 8,960). Specifically, we were able to conduct confir-
matory factor analysis, which provides a methodological
advance in factor analysis. We compared the fit of seven
competing models of the factor structure of the DAS-A.
Since all models had a good fit, we retained the most
parsimonious model. Seventeen items of the original 40-
item DAS-A were retained and comprised a two-factor
solution: ‘perfectionism/performance evaluation’ and
‘dependency’. Confirmatory factor analysis indicated that
this two-factor solution produced good fit to the data based
on several goodness-of-fit indicators. Psychometric prop-
erties of the obtained factors were sufficient, in terms of
internal consistency, item-total correlations and convergent
construct validity. Both factors were significantly associ-
ated with depression, controlling for demographic
variables. Surprisingly, the association between ‘depen-
dency’ and depression was relatively small.
Previous Factor Analytic Studies
One of the aims of the current study was to discern
meaningful subscales of the DAS-A, which can be used as
measures of specific cognitive vulnerabilities in order to
more adequately test the cognitive diathesis-stress theory
Table 6 Norm-scores for the DAS-A-17 factors and total score
(N = 8,960)
Quintile Standardization DAS-A-
17-P
DAS-A-
17-D
DAS-A-
17-T
Low
1 19 15 35
Below average
2 23 18 42
Average
3 27 22 49
Above average
4 35 27 60
High
Normative data were calculated by computing quintiles; DAS-A-17dysfunctional attitude scale with 17 items, P perfectionism/perfor-
mance evaluation, D dependency, T total score
Table 7 Multiple linear regression analysis with depression severity
as outcome variable: associations with dysfunctional attitudes and
demographic variables (N = 8,960)
Variable B SE (B) b
Step 1
DAS-A-17-P .464 .012 .472*
DAS-A-17-D .119 .012 .121*
Step 2
DAS-A-17-P .405 .012 .412*
DAS-A-17-D .129 .012 .131*
Gender, female .041 .009 .042*
Age (compared to 18–25)
26–35 .002 .015 .002
36–45 .012 .018 .012
46–55 -.008 .019 -.008
56–65 -.091 .018 -.092*
Partner, yes -.039 .009 -.039*
Education in years (compared to 0–10)
11–14 -.043 .010 -.043*
15 ? -.086 .011 -.088*
Occupational status (compared to employed)
Homemaker .017 .009 .018
Student -.016 .013 -.016
Occupational disability/unemployed .246 .009 .251*
Retired -.008 .010 -.008
R2 .31 for step 1; DR2 .08 for step 2 (ps \ .001)
Outcome variable is the severity of depression as measured with the
19 symptom severity items of the diagnostic inventory for depression
DAS-A-17 dysfunctional attitude scale with 17 items, P perfectionism/
performance evaluation, D dependency
*p \ .001
Cogn Ther Res (2009) 33:345–355 351
123

of Beck (1972). Therefore, we have tested several previ-
ously suggested models of the DAS-A (i.e., Cane et al.
1986; Chioqueta and Stiles 2006; Imber et al. 1990; Parker
et al. 1984; Power et al. 1994; Raes et al. 2005; Vaglum
and Falkum 1999). Although, all tested models had a good
fit, we suggest adopting a two-factor solution for several
reasons. First, two factors (i.e., ‘performance or achieve-
ment’ and ‘(need for) approval by others’) have emerged
across different populations in earlier studies. Second,
these two factors were most interpretable and are theoret-
ically meaningful; they have been suggested as appropriate
specific dimensions of dysfunctional attitudes (Beck 1983).
Finally, factors in three- and four-factor solutions (i.e.,
Chioqueta and Stiles 2006; Oliver and Baumgart 1985;
Parker et al. 1984; Power et al. 1994) were more difficult to
interpret, and they might be the result of over-extraction
due to methodological shortcomings.
While most studies focused on the psychometric prop-
erties of the DAS-A, others have examined the structure of
the full 100-item DAS and the DAS-B (e.g., See Beck et al.
1991; Power et al. 1994). The authors of these two studies
have both found other important factors next to ‘perfec-
tionism/performance evaluation’ and ‘dependency’. First, a
factor labeled ‘self-control’ was found in the DAS-B, but
did not appear in the DAS-A (Power et al. 1994). To date,
‘self-control’ has received relatively little attention in
research on cognitive vulnerability of depression. It might
be interesting for future research to elaborate more on this.
Second, Beck et al. (1991) have found a general symptom
factor, named ‘vulnerability’, reflecting a general negative
view of the world. However, this factor seemed rather state
dependent as compared with the ‘need for approval’ and
‘perfectionism’ factors. When specifically interested in
vulnerability of depression, one might prefer to use more
stable factors.
Reliability
A few comments should be made regarding the reliability
of the obtained factors of the DAS-A-17. First, both factors
appear to be reliable measures of specific constructs of
dysfunctional attitudes. However, comparable to previous
findings (e.g., Cane et al. 1986; Imber et al. 1990) the
internal consistency is relatively smaller for ‘dependency’
than for ‘perfectionism/performance evaluation’. The
smaller number of items in the ‘dependency’ factor might
explain this. The number of items on a scale influences
Cronbach’s alpha; when the number of items decreases
Cronbach’s alpha decreases. However, item-total correla-
tions were also relatively smaller for ‘dependency’ than for
‘performance evaluation’. This may suggest that depen-
dency is a rather heterogeneous factor and may still be too
broad (e.g., Mazure et al. 2001).
Second, since total scores are often used in research and
in clinical practice, the reliability of the total score of the
DAS-A-17 was examined and appeared satisfactory. As the
inter-correlation between both factors of the DAS-A-17 was
moderate, it can even be argued that the DAS-A should
preferably be used as a one-dimensional measure of dys-
functional attitudes. Moreover, the results of the
confirmatory factor analysis showed that the one-factor
model, of both the 40-item and 17-item DAS-A, fit the data
sufficiently. Therefore, it seems justified to use the DAS-A
as a one-dimensional construct. The total score might reflect
a higher order construct measuring dysfunctional thinking in
general. Still, the two-factor solution produced better fit to
the data than the one-factor solution of the DAS-A-17.
Third, a point should be made regarding the reversely
keyed items. Although usually used to prevent response
tendencies, the present results suggest that reversely keyed
items endorse contradictory statements. Sahin and Sahin
(1992) expressed their concerns about the reversely keyed
items of the DAS-A as well. In a student sample, they
found that the reversely keyed items of the DAS-A formed
a factor. The same problem may have emerged in previous
factor analytic studies (e.g., Chioqueta and Stiles 2006;
Oliver and Baumgart 1985; Power et al. 1994). Since
participants had difficulties grasping the concept of these
reversely keyed items, we decided to omit those items from
the DAS-A. However, if the use of reversely keyed items is
preferred in a questionnaire, one could elaborate the
instructions for the reader and draw the participant’s
attention to negatively and positively stated items.
Validity
Regarding the validity, both factors showed sufficient
convergent construct validity and could distinguish the
depressed subgroup from the non-depressed group.
Depression was significantly explained by both factors,
controlling for demographic determinants of depression
(See Bijl et al. 1998). The content of the obtained factors of
the DAS-A-17 largely resemble two specific dimensions of
cognitive vulnerability to depression: sociotropy and
autonomy (Beck 1983). Whereas sociotropy refers to a
need for intimacy, affiliation and dependency, autonomy
refers to as a need for goal achievement and fear of failure
(Beck 1983). Previous studies generally found stronger
indications for sociotropy as risk factor to depression
compared with autonomy. The present results suggest the
opposite. Methodological differences may in part explain
these contrasting results. First, we used a cross-sectional
design, which makes it difficult to distinguish vulnerability
from its manifestation in depression. ‘Perfectionism/per-
formance evaluation’ may covary more closely with
symptom state than ‘dependency’ (Beck et al. 1991; Coyne
352 Cogn Ther Res (2009) 33:345–355
123
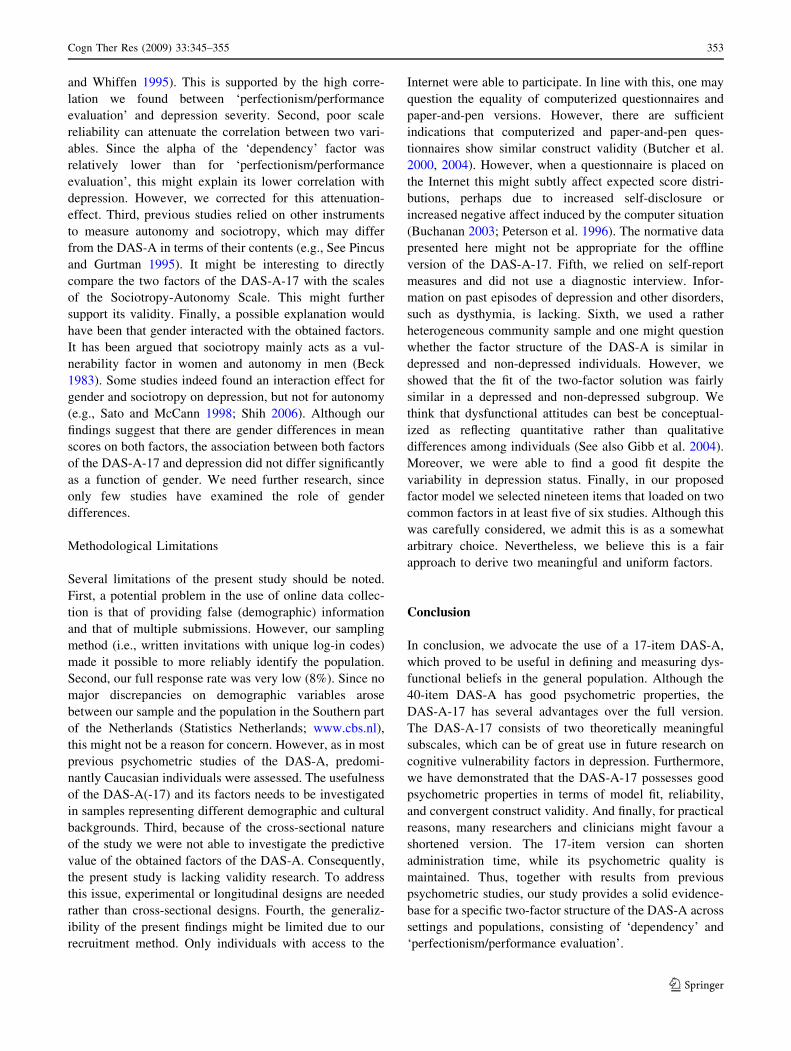
and Whiffen 1995). This is supported by the high corre-
lation we found between ‘perfectionism/performance
evaluation’ and depression severity. Second, poor scale
reliability can attenuate the correlation between two vari-
ables. Since the alpha of the ‘dependency’ factor was
relatively lower than for ‘perfectionism/performance
evaluation’, this might explain its lower correlation with
depression. However, we corrected for this attenuation-
effect. Third, previous studies relied on other instruments
to measure autonomy and sociotropy, which may differ
from the DAS-A in terms of their contents (e.g., See Pincus
and Gurtman 1995). It might be interesting to directly
compare the two factors of the DAS-A-17 with the scales
of the Sociotropy-Autonomy Scale. This might further
support its validity. Finally, a possible explanation would
have been that gender interacted with the obtained factors.
It has been argued that sociotropy mainly acts as a vul-
nerability factor in women and autonomy in men (Beck
1983). Some studies indeed found an interaction effect for
gender and sociotropy on depression, but not for autonomy
(e.g., Sato and McCann 1998; Shih 2006). Although our
findings suggest that there are gender differences in mean
scores on both factors, the association between both factors
of the DAS-A-17 and depression did not differ significantly
as a function of gender. We need further research, since
only few studies have examined the role of gender
differences.
Methodological Limitations
Several limitations of the present study should be noted.
First, a potential problem in the use of online data collec-
tion is that of providing false (demographic) information
and that of multiple submissions. However, our sampling
method (i.e., written invitations with unique log-in codes)
made it possible to more reliably identify the population.
Second, our full response rate was very low (8%). Since no
major discrepancies on demographic variables arose
between our sample and the population in the Southern part
of the Netherlands (Statistics Netherlands; www.cbs.nl),
this might not be a reason for concern. However, as in most
previous psychometric studies of the DAS-A, predomi-
nantly Caucasian individuals were assessed. The usefulness
of the DAS-A(-17) and its factors needs to be investigated
in samples representing different demographic and cultural
backgrounds. Third, because of the cross-sectional nature
of the study we were not able to investigate the predictive
value of the obtained factors of the DAS-A. Consequently,
the present study is lacking validity research. To address
this issue, experimental or longitudinal designs are needed
rather than cross-sectional designs. Fourth, the generaliz-
ibility of the present findings might be limited due to our
recruitment method. Only individuals with access to the
Internet were able to participate. In line with this, one may
question the equality of computerized questionnaires and
paper-and-pen versions. However, there are sufficient
indications that computerized and paper-and-pen ques-
tionnaires show similar construct validity (Butcher et al.
2000, 2004). However, when a questionnaire is placed on
the Internet this might subtly affect expected score distri-
butions, perhaps due to increased self-disclosure or
increased negative affect induced by the computer situation
(Buchanan 2003; Peterson et al. 1996). The normative data
presented here might not be appropriate for the offline
version of the DAS-A-17. Fifth, we relied on self-report
measures and did not use a diagnostic interview. Infor-
mation on past episodes of depression and other disorders,
such as dysthymia, is lacking. Sixth, we used a rather
heterogeneous community sample and one might question
whether the factor structure of the DAS-A is similar in
depressed and non-depressed individuals. However, we
showed that the fit of the two-factor solution was fairly
similar in a depressed and non-depressed subgroup. We
think that dysfunctional attitudes can best be conceptual-
ized as reflecting quantitative rather than qualitative
differences among individuals (See also Gibb et al. 2004).
Moreover, we were able to find a good fit despite the
variability in depression status. Finally, in our proposed
factor model we selected nineteen items that loaded on two
common factors in at least five of six studies. Although this
was carefully considered, we admit this is as a somewhat
arbitrary choice. Nevertheless, we believe this is a fair
approach to derive two meaningful and uniform factors.
Conclusion
In conclusion, we advocate the use of a 17-item DAS-A,
which proved to be useful in defining and measuring dys-
functional beliefs in the general population. Although the
40-item DAS-A has good psychometric properties, the
DAS-A-17 has several advantages over the full version.
The DAS-A-17 consists of two theoretically meaningful
subscales, which can be of great use in future research on
cognitive vulnerability factors in depression. Furthermore,
we have demonstrated that the DAS-A-17 possesses good
psychometric properties in terms of model fit, reliability,
and convergent construct validity. And finally, for practical
reasons, many researchers and clinicians might favour a
shortened version. The 17-item version can shorten
administration time, while its psychometric quality is
maintained. Thus, together with results from previous
psychometric studies, our study provides a solid evidence-
base for a specific two-factor structure of the DAS-A across
settings and populations, consisting of ‘dependency’ and
‘perfectionism/performance evaluation’.
Cogn Ther Res (2009) 33:345–355 353
123
Acknowledgments We thank Annie Hendriks, Greet Kellens, and
Sylvia Gerhards, who assisted with data collection. Rosanne Janssen
developed the infrastructure for online data collection. Municipalities
Eijsden, Meerssen, Sittard-Geleen, Valkenburg, and Maastricht
sponsored the study.
Open Access This article is distributed under the terms of the
Creative Commons Attribution Noncommercial License which per-
mits any noncommercial use, distribution, and reproduction in any
medium, provided the original author(s) and source are credited.
References
Beck, A. T. (1972). Depression: Causes and treatment. Philadelphia:
University of Pennsylvania Press.
Beck, A. T. (1983). Cognitive therapy of depression: New perspec-
tives. In P. J. Clayton & J. E. Barrett (Eds.), Treatment ofdepression: Old controversies and new approaches (pp. 265–
290). New York: Raven Press.
Beck, A. T. (1987). Cognitive models of depression. Journal ofCognitive Psychotherapy: An International Quarterly, 1, 5–37.
Beck, A. T., Brown, G., Steer, R. A., & Weissman, A. N. (1991).
Factor analysis of the dysfunctional attitude scale in a clinical
population. Psychological Assessment, 3(478), 183. doi:
10.1037/1040-3590.3.3.478.
Beck, A. T., Rush, A. J., Shaw, B. F., & Emery, G. (1979). Cognitivetherapy of depression. New York: Guildford Press.
Bijl, R. V., Ravelli, A., & van Zessen, G. (1998). Prevalence of
psychiatric disorder in the general population: Results of the
Netherlands mental health survey and incidence study (NEME-
SIS). Social Psychiatry and Psychiatric Epidemiology, 33, 587–
595. doi:10.1007/s001270050098.
Blazer, D. G., Kessler, R. C., McGonagle, K. A., & Swartz, M. S.
(1994). The prevalence and distribution of major depression in a
national community sample: The National comorbidity survey.
The American Journal of Psychiatry, 151, 979–986.
Buchanan, T. (2003). Internet-based questionnaire assessment:
Appropriate use in clinical contexts. Cognitive BehaviourTherapy, 32, 100–109. doi:10.1080/16506070310000957.
Butcher, J. N., Perry, J. N., & Atlis, M. M. (2000). Validity and utility
of computer-based test interpretation. Psychological Assessment,12, 6–18. doi:10.1037/1040-3590.12.1.6.
Butcher, J. N., Perry, J., & Hahn, J. (2004). Computers in clinical
assessment: Historical developments, present status, and future
challenges. Journal of Clinical Psychology, 60, 331–345. doi:
10.1002/jclp.10267.
Cane, D. B., Olinger, J., Gotlib, I. H., & Kuiper, N. A. (1986). Factor
structure of the dysfunctional attitude scale in a student
population. Journal of Clinical Psychology, 42, 307–309. doi:
10.1002/1097-4679(198603)42:2<307::AID-
JCLP2270420213>3.0.CO;2-J.
Chioqueta, A. P., & Stiles, T. C. (2006). Factor structure of the
dysfunctional attitude scale (Form A) and the automatic thoughts
questionnaire: An exploratory study. Psychological Reports, 99,
239–247. doi:10.2466/PR0.99.5.239-247.
Comrey, A. L., & Lee, H. B. (1992). A first course in factor analysis(2nd ed.). Hillsdale, NJ: Erlbaum.
Coyne, J. C., & Whiffen, V. E. (1995). Issues in personality as
diathesis for depression: The case of sociotropy-dependency and
autonomy-self-criticism. Psychological Bulletin, 118, 358–378.
doi:10.1037/0033-2909.118.3.358.
Dyck, M. J. (1992). Subscales of the dysfunctional attitude scale. TheBritish Journal of Clinical Psychology, 31, 333–335.
Field, A. (2000). Discovering statistics using SPSS for Windows.
London: Sage.
Floyd, M., Scogin, F., & Chaplin, W. F. (2004). The dysfunctional
attitude scale: Factor structure, reliability and validity with older
adults. Aging & Mental Health, 8, 153–160. doi:10.1080/136078
60410001649572.
Gibb, B. E., Alloy, L. B., Abramson, L. Y., Beevers, C. G., & Miller,
I. W. (2004). Cognitive vulnerability to depression: A taxometricanalysis. Journal of Abnormal Psychology, 113, 81–89. doi:
10.1037/0021-843X.113.1.81.
Imber, S. D., Pilkonis, P. A., Sotsky, S. M., Elkin, I., Watkins, J. T.,
Collins, J. F., et al. (1990). Mode-specific effects among three
treatments for depression. Journal of Consulting and ClinicalPsychology, 58, 352–359. doi:10.1037/0022-006X.58.3.352.
Ingram, R. E., Miranda, J., & Segal, Z. V. (1998). Cognitivevulnerability to depression. New York: Guilford Press.
Joreskog, K. G., & Sorbom, D. (1999). LISREL 8.30. Chicago, IL:
Scientific software International.
Kelloway, E. K. (1998). Using LISREL for structural equationmodeling: A researcher’s guide. Thousand Oaks, CA: Sage.
Kessler, R. C., Zhao, S., Blazer, D. G., & Swartz, M. (1997).
Prevalence, correlates, and course of minor depression and major
depression in the national comorbidity survey. Journal ofAffective Disorders, 45, 19–30. doi:10.1016/S0165-0327(97)
00056-6.
Lau, M. A., Segal, Z. V., & Williams, J. M. G. (2004). Teasdale’s
differential activation hypothesis: implications for mechanisms
of depressive relapse and suicidal behaviour. BehaviourResearch and Therapy, 42, 1001–1017. doi:10.1016/j.brat.2004.
03.003.
Marsh, H. W., Balla, J. R., & McDonals, R. P. (1988). Goodness-of-fit
indexes in confirmatory factor analysis: The effect of sample
size. Psychological Bulletin, 103, 391–410. doi:10.1037/0033-
2909.103.3.391.
Marsh, H. W., Hau, K. T., Balla, J. R., & Grayson, D. (1998). Is more
ever too much? The number of indicators per factor in
confirmatory factor analysis. Multivariate Behavioral Research,33, 181–220. doi:10.1207/s15327906mbr3302_1.
Mazure, C. M., Raghaven, C., Maciejewski, P. K., Jacobs, S. C., &
Bruce, M. L. (2001). Cognitive-personality characteristics as
direct predictors of unipolar major depression. Cognitive Ther-apy and Research, 25, 215–225. doi:10.1023/A:1026424126287.
Meade, A. W., & Bauer, D. J. (2007). Power and precision in
confirmatory factor analytic tests of measurement invariance.
Structural Equation Modeling: A Multidisciplinary Journal, 14,
611–635.
Miranda, J., Persons, J. B., & Byers, C. N. (1990). Endorsement of
dysfunctional beliefs depends on current mood state. Journal ofAbnormal Psychology, 99, 237–241. doi:10.1037/0021-843X.
99.3.237.
Oliver, J. M., & Baumgart, E. P. (1985). The dysfunctional attitude
scale: Psychometric properties and relation to depression in an
unselected adult population. Cognitive Therapy and Research, 9,
161–167. doi:10.1007/BF01204847.
Parker, G., Bradshaw, G., & Blignault, I. (1984). Dysfunctional attitudes:
Measurement, significant constructs and links with depression.
Acta Psychiatrica Scandinavica, 70, 90–96. doi:10.1111/
j.1600-0447.1984.tb01186.x.
Peterson, L., Johansson, V., & Carlsson, S. G. (1996). Computerised
testing in a hospital setting: Psychometric and psychological
effects. Computers in Human Behavior, 12, 339–350. doi:
10.1016/0747-5632(96)00012-X.
Pincus, A. L., & Gurtman, M. B. (1995). The three faces of
interpersonal dependency: Structural analyses of self-report
dependency measures. Journal of Personality and Social Psy-chology, 69, 744–758. doi:10.1037/0022-3514.69.4.744.
354 Cogn Ther Res (2009) 33:345–355
123

Power, M. J., Duggan, C. F., Lee, A. S., & Murrey, R. M. (1995).
Dysfunctional attitudes in depressed and recovered depressed
patients and their first-degree relatives. Psychological Medicine,25, 87–93.
Power, M. J., Katz, R., McGuffin, P., Duggan, C. F., Lam, D., &
Beck, A. T. (1994). The dysfunctional attitude scale (DAS) a
comparison of forms A and B and proposals for a new subscaled
version. Journal of Research in Personality, 28, 263–276. doi:
10.1006/jrpe.1994.1019.
Raes, F., Hermans, D., Van den Broeck, K., & Eelen, P. (2005). Kort
Instrumenteel: De Nederlandstalige versie van de Dysfunctional
Attitude Scale-vorm A (DAS-A-NL). Gedragstherapie, 38, 285–
294. The Dutch version of the Dysfunctional Attitude Scale-form
A (DAS-A-NL).
Sahin, N. H., & Sahin, N. (1992). How dysfunctional are the
dysfunctional attitudes in another culture? The British Journal ofMedical Psychology, 65, 17–26.
Sato, T., & McCann, D. (1998). Individual differences in relatedness
and individuality: An exploration of two constructs. Personalityand Individual Differences, 24, 847–859. doi:10.1016/S0191-
8869(98)00020-8.
Sheeran, T., & Zimmerman, M. (2002). Case identification of
depression with self-report questionnaires. Psychiatry Research,109, 51–59. doi:10.1016/S0165-1781(01)00364-X.
Sheppard, L. C., & Teasdale, J. D. (2000). Dysfunctional thinking in
major depressive disorder: A deficit in metacognitive monitoring.
Journal of Abnormal Psychology, 109, 768–776. doi:10.1037/
0021-843X.109.4.768.
Shih, J. H. (2006). Sex differences in stress generation: An
examination of sociotropy/autonomy, stress, and depressive
symptoms. Personality and Social Psychology Bulletin, 32,
434–446. doi:10.1177/0146167205282739.
Teasdale, J. D. (1988). Cognitive vulnerability to persistent depres-
sion. Cognition and Emotion, 2, 247–274. doi:10.1080/
02699938808410927.
Vaglum, P., & Falkum, E. (1999). Self-criticism, dependency and
depressive symptoms in a nationwide sample of Norwegian
physicians. Journal of Affective Disorders, 52, 153–159. doi:
10.1016/S0165-0327(98)00081-0.
Weissman, A.N. (1979). Assessing depressogenic attitudes: A vali-
dation study. Unpublished thesis, University of Pennsylvania.
Weissman, A.N., & Beck, A.T.(1978). Development and validation of
the dysfunctional attitude scale. Paper presented at the Annual
meeting of the Association for the Advanced Behavior Therapy,
Chicago, November.
Zimmerman, M., Chelminski, I., McGlinchey, J. B., & Young, D.
(2006). Diagnosing major depressive disorder VI; performance
of an objective test as a diagnostic criterion. The Journal ofNervous and Mental Disease, 194, 565–569. doi:10.1097/
01.nmd.0000230393.19478.d5.
Zimmerman, M., Sheeran, T., & Young, D. (2004). The diagnostic
inventory for depression: A self-report scale to diagnose DSM-
IV major depressive disorder. Clinical Psychologist, 60, 87–110.
doi:10.1002/jclp.10207.
Zwick, W. R., & Velicer, W. F. (1986). Comparison of five rules for
determining the number of components to retain. PsychologicalBulletin, 99, 432–442. doi:10.1037/0033-2909.99.3.432.
Cogn Ther Res (2009) 33:345–355 355
123


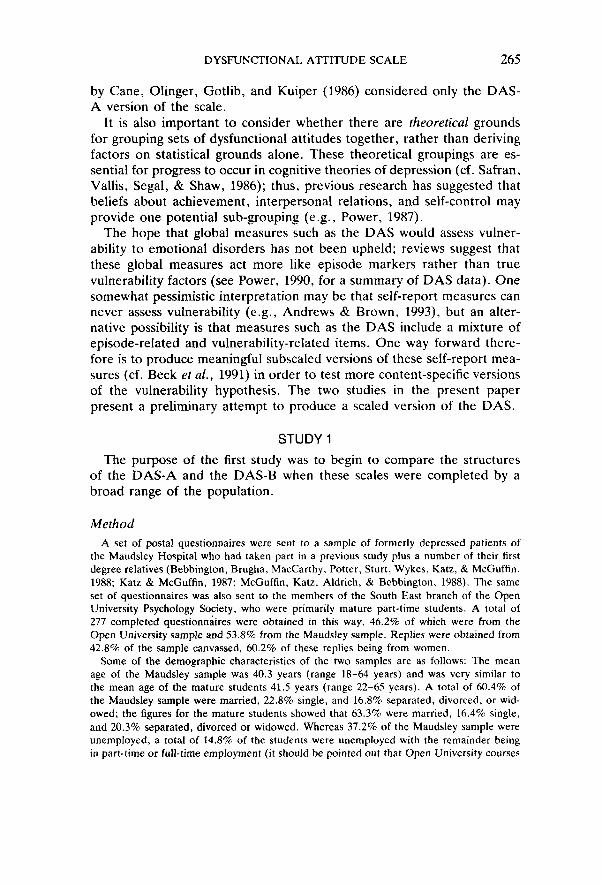
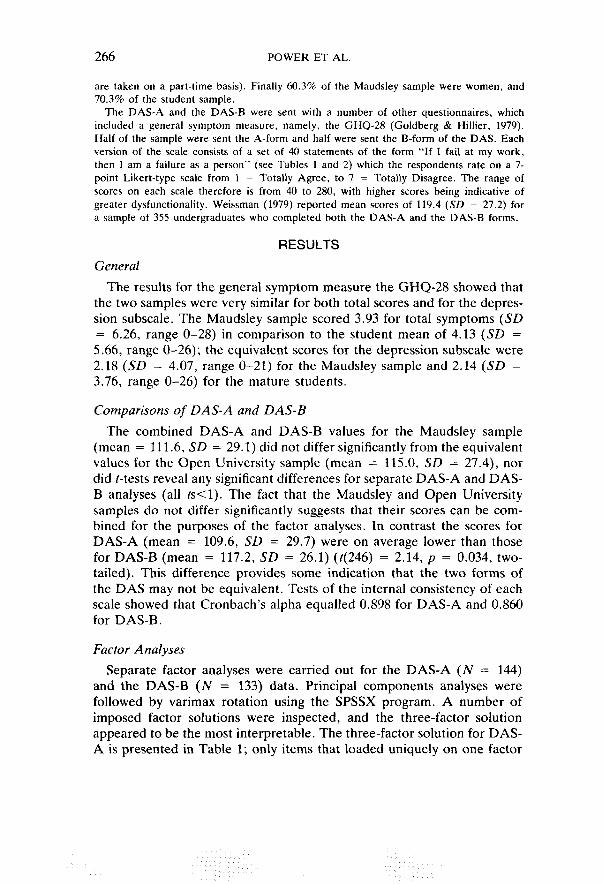
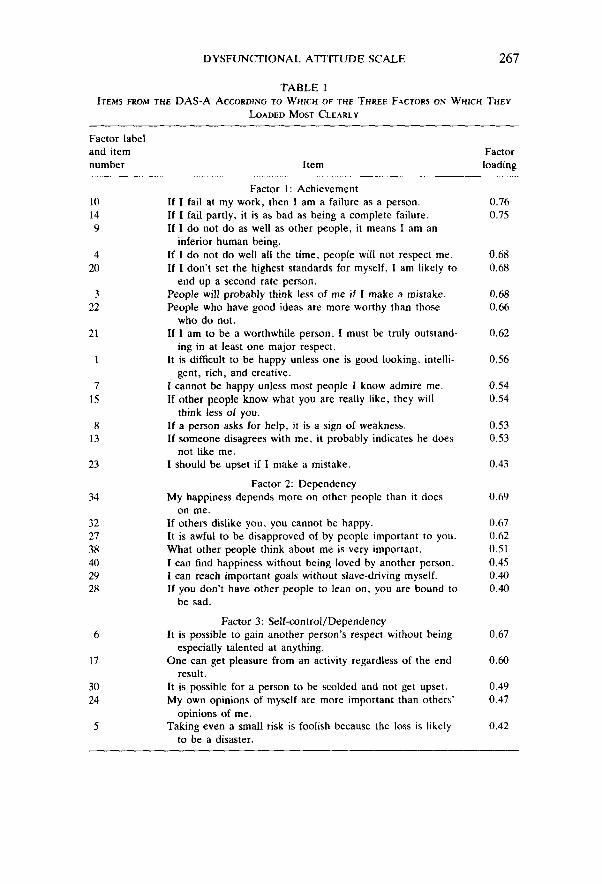
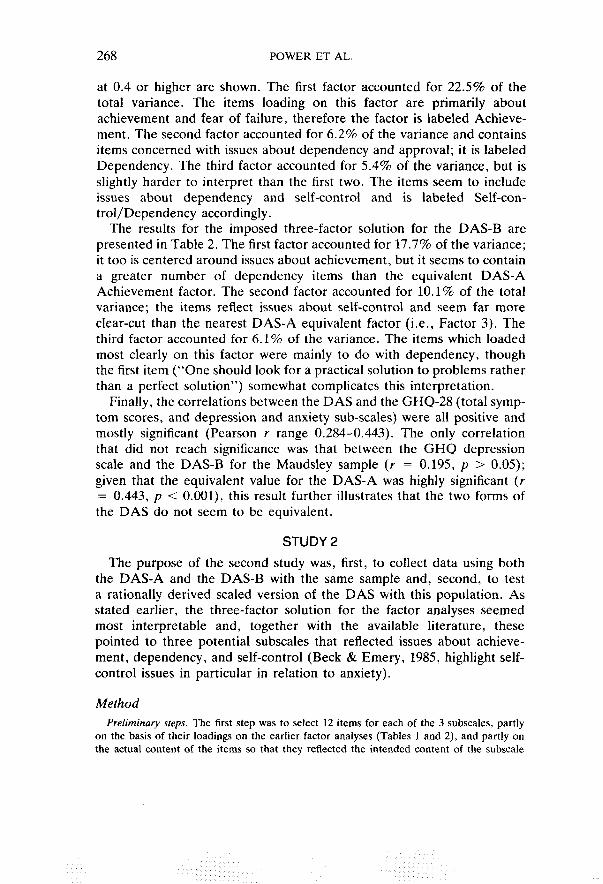
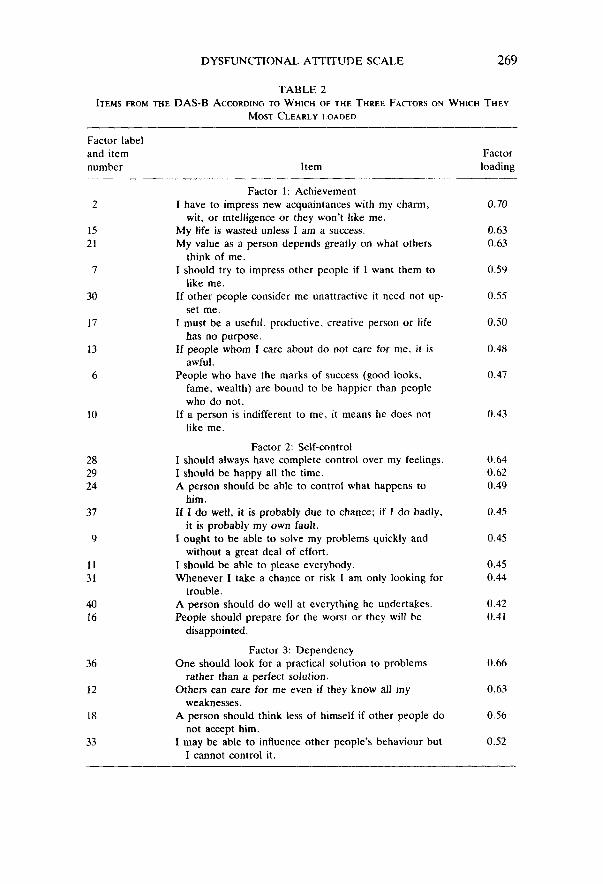
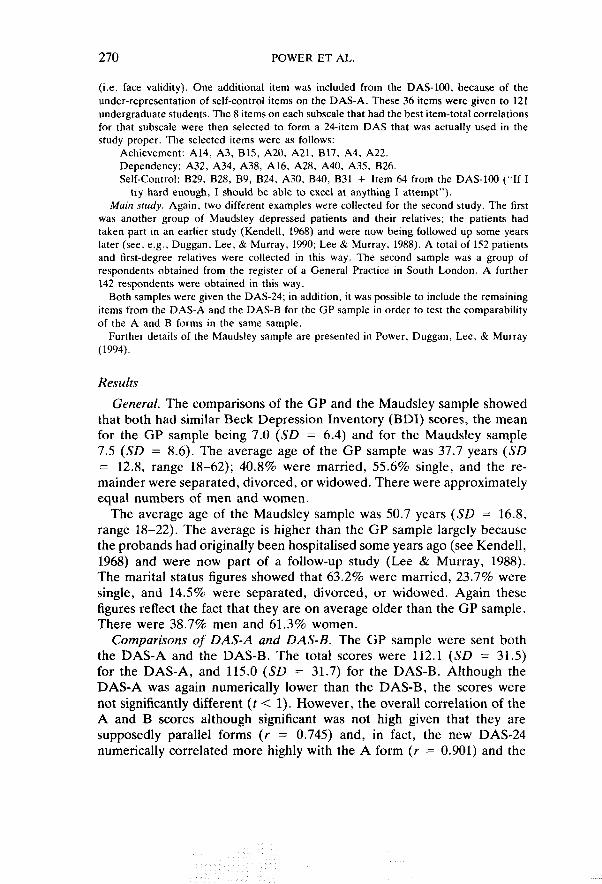
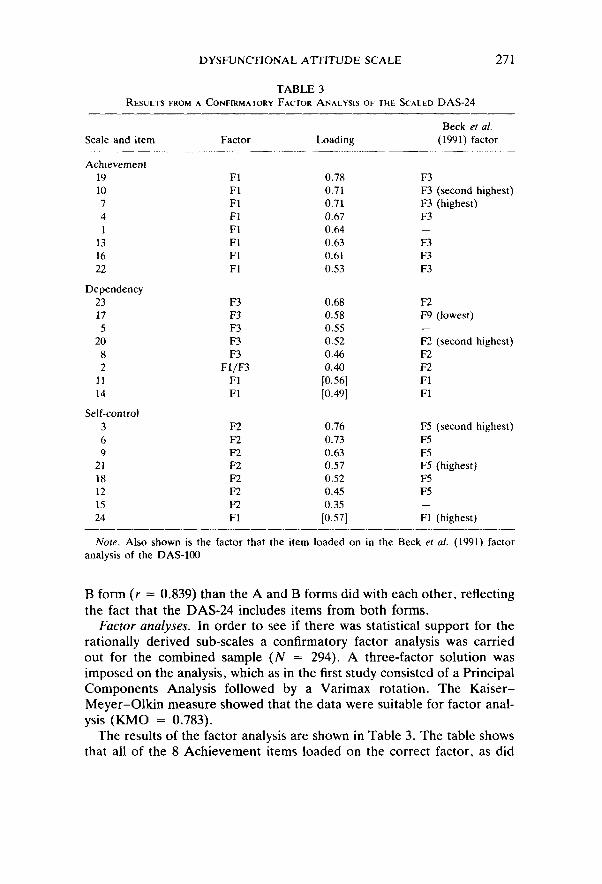
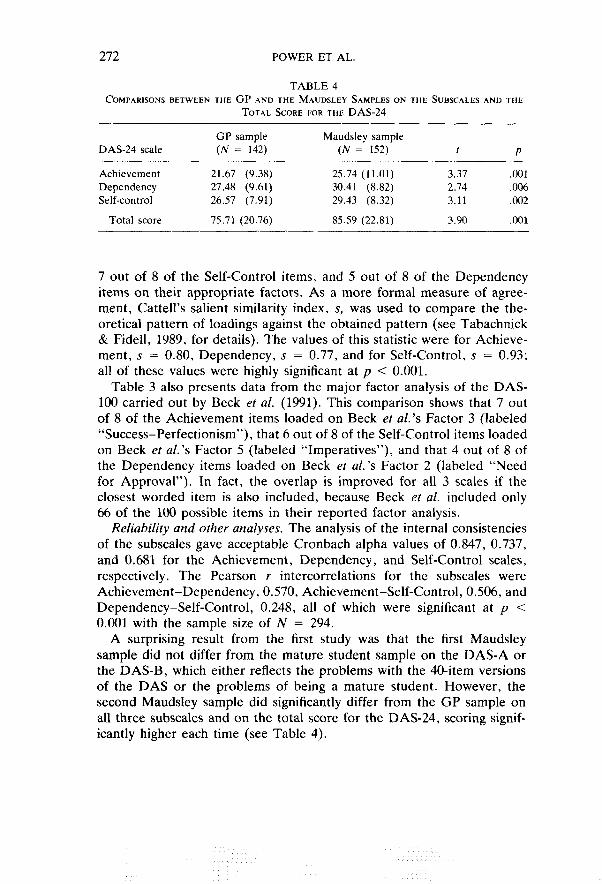
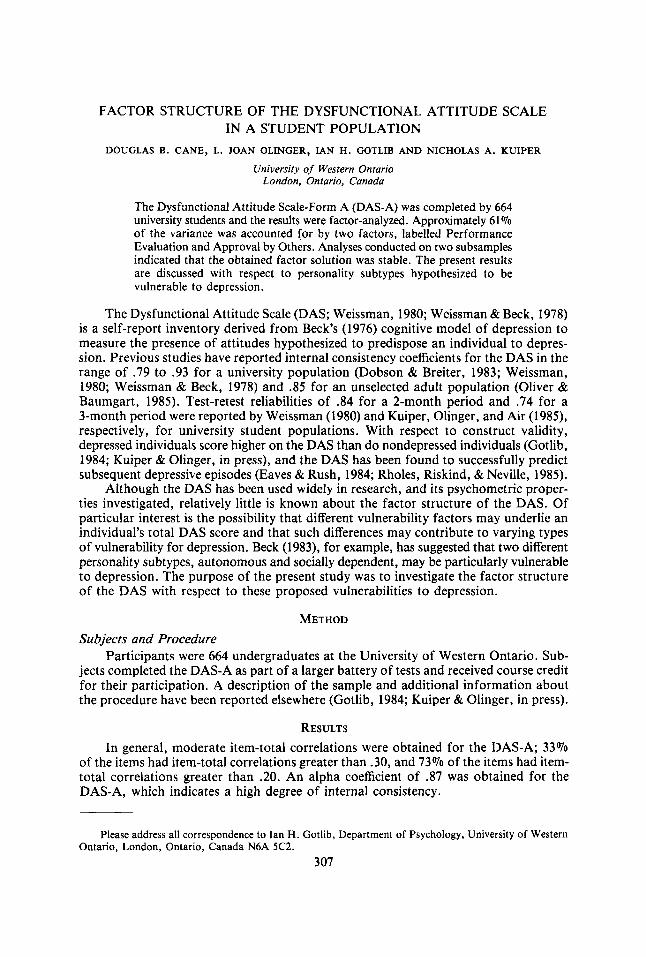
FACTOR STRUCTURE OF THE DYSFUNCTIONAL ATTITUDE SCALE IN A STUDENT POPULATION
DOUGLAS B. CANE, L. JOAN OLINGER, IAN H. GOTLIB AND NICHOLAS A. KUIPER
University of Western Ontario London, Ontario, Canada
The Dysfunctional Attitude Scale-Form A (DAS-A) was completed by 664 university students and the results were factor-analyzed. Approximately 61 ‘70 of the variance was accounted for by two factors, labelled Performance Evaluation and Approval by Others. Analyses conducted on two subsamples indicated that the obtained factor solution was stable. The present results are discussed with respect to personality subtypes hypothesized to be vulnerable to depression.
The Dysfunctional Attitude Scale (DAS; Weissman, 1980; Weissman & Beck, 1978) is a self-report inventory derived from Beck’s (1976) cognitive model of depression to measure the presence of attitudes hypothesized to predispose an individual to depres- sion. Previous studies have reported internal consistency coefficients for the DAS in the range of .79 to .93 for a university population (Dobson & Breiter, 1983; Weissman, 1980; Weissman & Beck, 1978) and .85 for an unselected adult population (Oliver & Baumgart, 1985). Test-retest reliabilities of .84 for a 2-month period and .74 for a 3-month period were reported by Weissman (1980) and Kuiper, Olinger, and Air (1985), respectively, for university student populations. With respect to construct validity, depressed individuals score higher on the DAS than do nondepressed individuals (Gotlib, 1984; Kuiper & Olinger, in press), and the DAS has been found to successfully predict subsequent depressive episodes (Eaves & Rush, 1984; Rholes, Riskind, & Neville, 1985).
Although the DAS has been used widely in research, and its psychometric proper- ties investigated, relatively little is known about the factor structure of the DAS. Of particular interest is the possibility that different vulnerability factors may underlie an individual’s total DAS score and that such differences may contribute to varying types of vulnerability for depression. Beck (1983), for example, has suggested that two different personality subtypes, autonomous and socially dependent, may be particularly vulnerable to depression. The purpose of the present study was to investigate the factor structure of the DAS with respect to these proposed vulnerabilities to depression.
METHOD Subjects and Procedure
Participants were 664 undergraduates at the University of Western Ontario. Sub- jects completed the DAS-A as part of a larger battery of tests and received course credit for their participation. A description of the sample and additional information about the procedure have been reported elsewhere (Gotlib, 1984; Kuiper & Olinger, in press).
RESULTS In general, moderate item-total correlations were obtained for the DAS-A; 33%
of the items had item-total correlations greater than .30, and 73% of the items had item- total correlations greater than .20. An alpha coefficient of .87 was obtained for the DAS-A, which indicates a high degree of internal consistency.
Please address all correspondence to Ian H. Gotlib, Department of Psychology, University of Western Ontario, London, Ontario, Canada N6A 5C2.
307
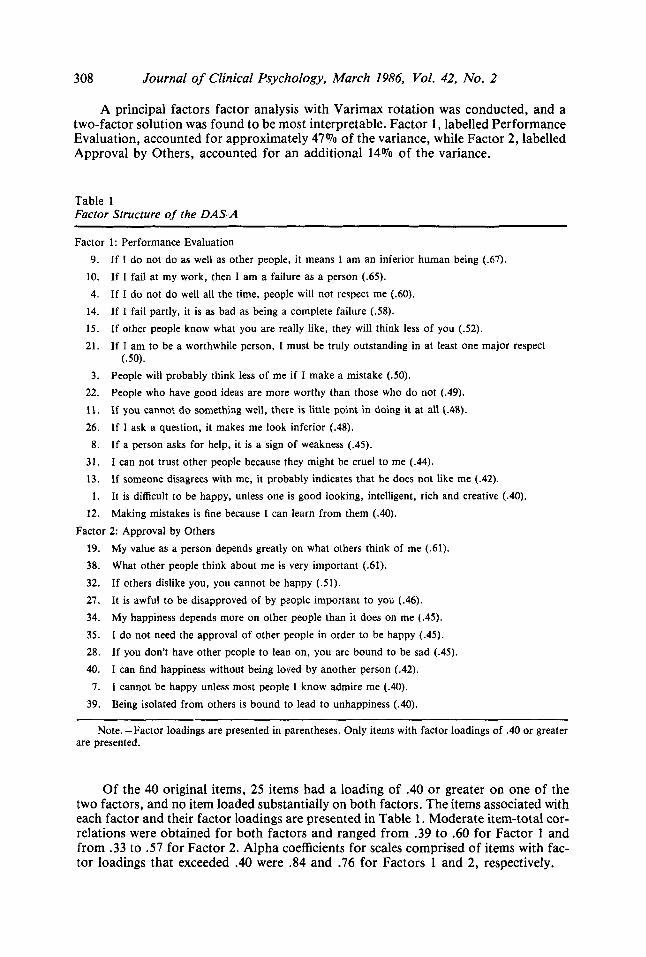
308 Journal of Clinical Psychology, March 1986, Vol. 42, No. 2
A principal factors factor analysis with Varimax rotation was conducted, and a two-factor solution was found to be most interpretable. Factor 1, labelled Performance Evaluation, accounted for approximately 47 Yo of the variance, while Factor 2, labelled Approval by Others, accounted for an additional 14% of the variance.
Table 1 Factor Structure of the DAS-A
Factor 9.
10.
4.
14.
15.
21.
3.
22.
11.
26.
8.
31.
13.
1.
12.
Factor 19. 38.
32.
21.
34.
35.
28.
40.
1.
39.
1: Performance Evaluation If I do not do as well as other people, it means I am an inferior human being (.67).
If I fail at my work, then I am a failure as a person (.65).
If I do not do well all the time, people will not respect me f.60).
If I fail partly, it is as bad as being a complete failure (38).
I f other people know what you are really like, they will think less of you (52).
If I am to be a worthwhile person, I must be truly outstanding in at least one major respect
People will probably think less of me if I make a mistake (30). People who have good ideas are more worthy than those who do not (.49).
If you cannot do something well, there is little point in doing it at all t.48).
If I ask a question, it makes me look inferior (.48).
If a person asks for help, it is a sign of weakness (.45).
I can not trust other people because they might be cruel to me (.44). If someone disagrees with me, it probably indicates that he does not like me (.42).
It is difficult to be happy, unless one is good looking, intelligent, rich and creative (.40). Making mistakes is fine because I can learn from them (.40).
2: Approval by Others My value as a person depends greatly on what others think of me (.61).
What other people think about me is very important (.61).
If others dislike you, you cannot be happy (31). It is awful to be disapproved of by people important to you (.46). My happiness depends more on other people than it does on me (.45).
I do not need the approval of other people in order to be happy (.45).
If you don’t have other people to lean on, you are bound to be sad (.45).
I can find happiness without being loved by another person (.42).
I cannot be happy unless most people I know admire me (.40).
Being isolated from others is bound to lead to unhappiness (.40).
(.50).
Note. -Factor loadings are presented in parentheses. Only items with factor loadings of .40 or greater are presented.
Of the 40 original items, 25 items had a loading of .40 or greater on one of the two factors, and no item loaded substantially on both factors. The items associated with each factor and their factor loadings are presented in Table 1. Moderate item-total cor- relations were obtained for both factors and ranged from .39 to .60 for Factor 1 and from .33 to 3 7 for Factor 2. Alpha coefficients for scales comprised of items with fac- tor loadings that exceeded .40 were .84 and .76 for Factors 1 and 2, respectively.
Dysfunctional Attitude Scale 309
The robustness of the obtained factor solution was examined by randomly dividing the sample and conducting two separate factor analyses. The factorial similarity of the resulting factor solutions was examined by computing coefficients of congruence (Har- man, 1976). For Factors 1 and 2, coefficients of .987 and .974, respectively, were ob- tained, which indicates a high degree of congruence for the two-factor solutions.
DISCUSSION Two major factors, Performance Evaluation and Approval by Others, were found
to account for a large proportion of the variance in DAS-A scores. Similar factors, labelled need for approval and perfectionism, were identified by Oliver and Baumgart (1985) as the first two factors in a four-factor solution. These factors, then, appear to be quite stable and have been found in populations of both university students and adult community members. In the present study these factors also were obtained for two in- dependent subsamples.
The finding of factors that represent concerns about performance evaluation and interpersonal approval is of interest in light of recent formulations of different vulnerabilities to depression. As noted earlier, Beck (1983) has described two person- ality subtypes relevant to depression, autonomous and socially dependent, for which different events may precipitate depression. The events hypothesized to precipitate depres- sion for the autonomous and for the socially dependent subtypes (failure to meet per- sonal goals or standards and disruption of personal relationships, respectively) are similar to the two factors found for the DAS-A. Future research, therefore, might examine the utility of employing the DAS to identify these subtypes and examine their relation- ship with specific types of life events in precipitating depression.
The present results are limited, of course, by the nature of the sample used. Addi- tional research is required to establish the factor structure of the DAS for both com- munity and clinical populations.
REFERENCES BECK, A. T. (1976). Cognitive therapy and the emotional disorders. New York: International Universities Press. BECK, A. T. (1983). Cognitive therapy of depression: New perspectives. In P. J. Clayton & J. E. Barrett
(Eds.), Treatment of depression: Old controversies and new approaches (pp. 265-290). New York: Raven Press.
DOBSON, K. S., & BREITER, H. J. (1983). Cognitive assessment of depression: Reliability and validity of three measures. Journal of Abnormal Psychology, 92, 107-109.
EAVES, G . , & RUSH, A. J. (1984). Cognitive patterns in symptomatic and remitted unipolar major depres- sion. Journal of Abnormal Psychology, 93. 31-40.
GOTLIB, I. H. (1984). Depression and general psychopathology in university students. Journal of Abnormal
HARMAN, H. H. (1976). KUIPER, N. A., & OLINGER, L. J. (in press).
PSyChology, 93, 19-30. Modern factor analysis. Chicago: University of Chicago Press.
Dysfunctional attitudes and a self-worth contingency model of depression. In P. C. Kendall (Ed.), Advances in cognitive behavioral research and therapy (Vol. 5). New York: Academic Press.
KUIPER, N. A,, OLINGER, L. J., & AIR, P. J. (1985). Stress, coping, and vulnerabili?y to depression. Un- published manuscript, University of Western Ontario.
OLIVER, J. M., & BAUMGART, E. P. (1985). The Dysfunctional Attitude Scale: Psychometric properties and relation to depression in an unselected adult population. Cognitive Therapy and Research, 9, 161-167.
RHOLES, W., RISKIND, J. H., a NEVILLE, B. (1985). The relationship of cognitions and hopelessness to depres- sion and anxiety. Social Cognition, 3, 36-50.
WEISSMAN, A. N. (1980). Assessing depressogenic attitudes: A validation study. Paper presented at the 5 1st Annual Meeting of the Eastern Psychological Association, Hartford.
WEISSMAN, A. N., & BECK, A. T. (1978). Development and validation of the Dysfunctional Attitude Scale: A preliminary investigation. Paper presented at the annual convention of the American Educational Research Association, Toronto.